Multiwavelength Variability Analysis of 3C 279
- 1Max-Planck-Institut für Radioastronomie, Bonn, Germany
- 2Department of Physics and Astronomy, University of Texas at San Antonio, San Antonio, TX, United States
- 3Instituto Nacional de Astrofísica Óptica y Electrónica, Puebla, Mexico
- 4SOFIA Science Center, NASA Ames Center, Mountain View, CA, United States
- 5Centre for Remote Sensing and Earth Observation Processes (TAP), Flemish Institute for Technological Research (VITO), Mol, Belgium
We present a multifrequency analysis of the variability in the flat-spectrum radio quasar 3C 279 from 2008 to 2014. Our multiwavelength datasets range from 1 mm to gamma-rays, with additional optical polarimetry. Cross-correlation analysis shows a significant correlation between the UV continuum emission, the optical and NIR bands, at a delay consistent with zero, implying co-spatial emission regions. We also find a correlation between the UV continuum and the 1 mm data, which implies that the dominant process in producing the UV continuum is synchrotron emission. Based on the behavior of the gamma-ray light curve with respect to other bands, we identified three different activity periods. During period A we find a significant correlation at zero delay between the UV continuum and the gamma-rays, implying co-spatial emission regions which points toward synchrotron self-Compton as dominant gamma-ray emission mechanism. During period C we find a delay between the UV continuum and the gamma-rays, as well as a correlation at zero delay between X-rays and gamma-rays, both results implying that external inverse Compton is the dominant gamma-ray emission mechanism. During period B there are multiple flares in the bands from 1 mm to UV, however, none of these show a counterpart in the gamma-rays band. We propose that this is caused by an increase in the gamma-ray opacity due to electron-positron pair production.
1. Context
Blazars are one class of jetted active galactic nuclei, with small viewing angle, thus the relativistic jet points almost directly to our line of sight (Urry and Padovani, 1995). Blazars are known for their for their variability at all frequencies with a dominant component of non-thermal emission. They can be classified as Flat Spectrum Radio Quasars (FSRQ) or BL Lac type, depending on the visible features in their optical spectrum. 3C 279 is an FSRQ at z = 0.536, and was among the first quasars discovered to emit gamma-rays via observations by the Compton Gamma-Ray Observatory (Hartman et al., 1992). In this proceeding, we present the preliminary results of a multiwavelength variability study on the source 3C 279.
2. Observations
Our multiwavelength datasets include data from different public databases as well as our own observations. The gamma-ray data was retrieved from the Fermi Science Support Center database1, which was observed by the Fermi Large Area Telescope (Fermi/LAT, Abdo et al., 2009). The X-rays was observed by the Swift X-Ray Telescope (Swift/XRT, Stroh and Falcone, 2013), 1mm observations were taken with the submillimeter Array2 (SMA, Gurwell et al., 2007), Near Infrared photometry from the Observatorio Astrofísico Guillermo Haro (OAGH) and the SMARTS project3 (Bonning et al., 2012); optical V Band from the Steward Observatory4 (Smith et al., 2009) and SMARTS; optical spectra from OAGH (Patiño-Álvarez et al., 2013) and the Steward Observatory; and polarization spectra from the Steward Observatory as well. Details on data reduction can be found in the references given.
3. Activity Periods
Based on the behavior of the gamma-rays with respect to the UV, optical and NIR, we separated the entire time range into three different periods: A flaring period in multiple bands, with counterparts in gamma-rays; a flaring period in multiple bands with no counterparts in gamma-rays; and another flaring period in multiple bands with apparent counterparts in gamma-rays. We also performed cross-correlation analysis on these activity periods of the light curves.
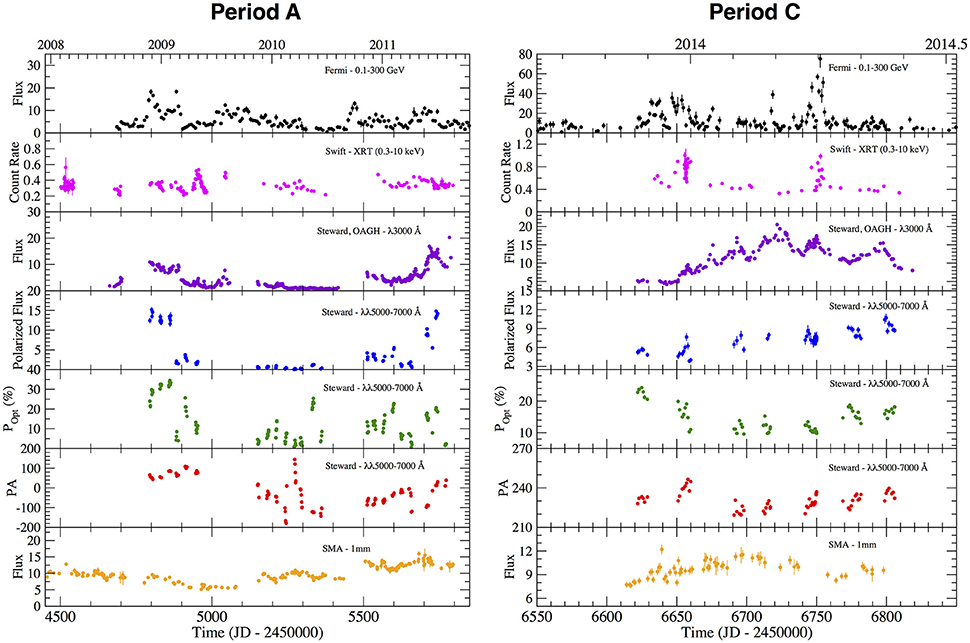
Period A ranges from JD245 = 4, 650−5, 850 (see Figure 1 left panel). During this period, we observed multiple flares in the gamma-ray emission, as well as counterparts in the optical (V-band), UV continuum, and NIR emission (J-, H- and K-bands). In the 1 mm light curve we observed a response to each of these flares, however, the amplitude of the 1 mm flares is not as high as in the other wavelengths.

Figure 1. Left: Light Curves for 3C 279 during Period A. Right: Light Curves for 3C 279 during Period C. These are the two different epochs where we found different delays between the UV continuum and the gamma-rays. This difference in the delay suggests a change in the dominant gamma-ray emission mechanism. From top to bottom, the vertical axes units are: [ph cm−2s−1], [c/s], [×10−15 erg cm−2s−1 Å−1], [×10−13 erg cm−2s−1], [%], [degrees], [Jy].
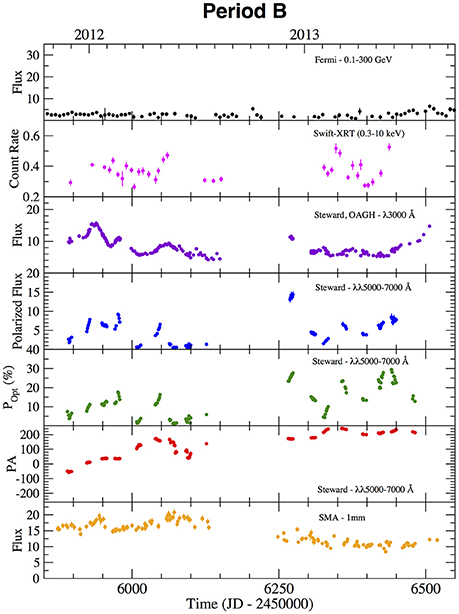
Period B ranges from JD245 = 5, 850−6, 400 (see Figure 2). During this time period, we observed multiple flares in the optical V-band, with clear counterparts in the UV spectral continuum and NIR bands. We also observed an increase in the 1 mm emission responding to each of these flares. The highest levels of 1 mm emission over the entire time-frame of our observations occur during this activity period. There are increases in polarization degree coincident with these flares; this might indicate that these flares have a non-thermal origin. However, there are no counterparts to any of these flares in the gamma-rays.

Figure 2. Light Curves for 3C 279 during period B. Units are the same as in Figure 1.
Period C ranges from JD245 = 6,400 − 6,850 (see Figure 1 right panel). During this time period, we observed the highest levels of gamma-ray emission in our time-frame of study. At the start of this time period we observe a very intense flare in the gamma-rays with a clear counterpart in the 1 mm emission, and high levels of degree of polarization, however, we do not see any response in the wavelength range from UV to NIR.
4. Correlation Analysis
In order to discern if the emission at different wavelengths are correlated, we applied Cross-Correlation analysis, by using three different methods: The Interpolated Cross-Correlation Function (ICCF, Gaskell and Sparke, 1986), the Discrete Cross-Correlation Function (DCCF, Edelson and Krolik, 1988), and the Z-Transformed Discrete Correlation Function (ZDCF, Alexander, 1997). The significance was calculated via Montecarlo simulations, and a correlation is only considered as significant if the signal is above 3-sigma, and we only state a delay when there is not more than one peak in the cross-correlation function.
With the results from the cross-correlation analysis, we have identified the simultaneity (|Δt| < 1 day) of the UV λ3000 Å continuum emission, the optical V Band, and the NIR J, H, and K bands. This correlation allows us to infer that the emissions from the middle UV range to the NIR are co-spatial. We report the finding of a significant correlation between the V Band and 1mm emission in our entire observation time range. By interpolating the V Band observations to the times of the 1mm observations, we obtain a Spearman correlation coefficient of 0.65, and a probability of obtaining this correlation by chance of P ≪ 0.01. This strongly suggests that the optical V Band emission should be dominated by non-thermal emission from the jet. These results also imply that the emission from the middle UV range to the NIR is dominated by synchrotron emission.
5. Gamma-Ray Emission Mechanism
Figure 1 (left panel) shows the light curves for Period A, which is noteworthy because we have a response in the gamma-rays every time we have a flare or flux increase in the other bands. The cross-correlation analysis between the UV continuum and the gamma-rays shows a delay of −0.7 ± 5.0 days (consistent with zero delay), implying that the emission regions are co-spatial. This, added to the low activity in the X-rays (which come mainly from the inner accretion disk and hot corona), strongly suggests that the dominant gamma-ray emission mechanism during this activity period is Synchrotron Self-Compton.
We also show in Figure 1 (right panel) the light curves for Period C. This period comes after a quiescent state in the gamma-rays (see Figure 2, left panel), and is noteworthy for having the brightest gamma-ray flare observed in this source during our time-frame of observation. The cross-correlation analysis between the UV continuum and the gamma-rays shows a delay of 28.6 ± 4.8 days, indicating a separation between the UV continuum emission region and the gamma-ray emission region (in contrast to Period A). There is a delay between X-rays and gamma-rays of −0.1 ± 3.0 days (consistent with zero delay). Added to the delay obtained between the gamma-rays and UV continuum, points to the dominant gamma-ray emission mechanism being External Inverse Compton. We present for the first time observational evidence of a change with time in the dominant gamma-ray emission mechanism for a single source. This is an important result due to its implications for SED modeling of blazars and high-energy physics. The result could also imply that the gamma-ray emission zone is changing locations over time.
6. Anomalous Gamma-Ray Activity
We report the finding of an anomalous activity period on 3C 279. In this period we have multiple flares in the λ3000 Å continuum with counterparts in the optical V and NIR bands. We also observe coincident increases in the polarized flux and optical polarization degree, as well as the highest flux levels of 1mm emission during our entire observational time range. However, there is no counterpart in the gamma-ray band to any of this activity. The light curves for this period are shown in Figure 2.
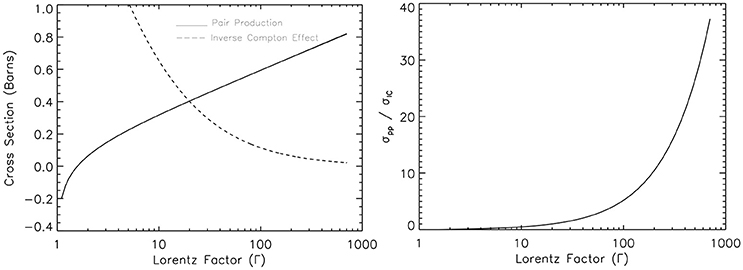
We propose that this anomalous behavior is caused by an increase in the gamma-ray opacity in the flaring region, due to an increase in the Lorentz factor in the flaring region. In order to test if this scenario is plausible, we performed analytical calculations of the cross sections for the inverse Compton scattering and the electron-positron pair production. By performing the full quantum mechanical calculations we were able to calculate the cross sections for the aforementioned processes as a function of the Lorentz factor. The results of these calculations can be seen in Figure 3. The full calculations will be available in Patiño-Álvarez et al. (submitted).

Figure 3. Left: Theoretical cross sections obtained from our analytical model, for the inverse Compton effect and the electron-positron pair production as a function of the Lorentz factor. Right: Ratio of the cross sections of the two processes mentioned above as a function of the Lorentz factor. The model predicts that as the Lorentz factor increases significantly, there is a much higher probability of a pair production transition that can cause absorption of gamma-rays within a region of increasing Lorentz factor.
Author Contributions
VP-Á analyzed multiwavelength data and spectra, spectroscopic observations, statistical analysis, the explanation for lack of gamma-ray emission, as well as the analytical model, and writing of the paper. SF analyzed spectroscopic and polarimetric data and writing of the paper. VC is the group leader, establishment of scientific objectives, general direction, and scientific discussion. EL-R participated in the polarimetric analysis as well as general reviewing and scientific discussion. JL-T discussion about statistical methods as well as general reviewing and discussion. ES general reviewing and scientific discussion. LC NIR observations. JV spectroscopic observations. AC general reviewing and scientific discussion.
Funding
This work was supported by CONACyT research grant 151494 (México). VP-Á acknowledges support from the CONACyT program for Ph.D. studies. SF acknowledges support from the University of Texas at San Antonio (UTSA) and the Vaughan family, support from the NSF grant 0904421, as well as the UTSA Mexico Center Research Fellowship funded by the Carlos and Malu Alvarez Fund. This work has received computational support from Computational System Biology Core, funded by the National Institute on Minority Health and Health Disparities (G12MD007591) from the National Institutes of Health.
Conflict of Interest Statement
The authors declare that the research was conducted in the absence of any commercial or financial relationships that could be construed as a potential conflict of interest.
Acknowledgments
We are thankful to P. Smith for his help on the polarimetry analysis. VP-Á and VC are grateful to UTSA for their hospitality during their stay. Data from the Steward Observatory spectro-polarimetric monitoring project were used; this program is supported by Fermi Guest Investigator grants NNX08AW56G, NNX09AU10G, and NNX12AO93G. 1 mm flux density light curve data from the Submillimeter Array was provided by Mark A. Gurwell. The Submillimeter Array is a joint project between the Smithsonian Astrophysical Observatory and the Academia Sinica Institute of Astronomy and Astrophysics and is funded by the Smithsonian Institution and the Academia Sinica.
Footnotes
1. ^https://fermi.gsfc.nasa.gov/ssc/data/access/
2. ^http://sma1.sma.hawaii.edu/callist/callist.html
References
Abdo, A. A., Ackermann, M., Ajello, M., Atwood, W. B., Axelsson, M., Baldini, L., et al. (2009). Fermi/large area telescope bright gamma-ray source list. Astrophys. J. Suppl. 183:46. doi: 10.1088/0067-0049/183/1/46
Alexander, T. (1997). “Is AGN variability correlated with other AGN properties? ZDCF analysis of small samples of sparse light curves,” in Astronomical Time Series, Vol. 218 of Astrophysics and Space Science Library, eds D. Maoz, A. Sternberg, and E. M. Leibowitz (Berlin: Springer), 163. doi: 10.1007/978-94-015-8941-3
Bonning, E., Urry, C. M., Bailyn, C., Buxton, M., Chatterjee, R., Coppi, P., et al. (2012). SMARTS optical and infrared monitoring of 12 gamma-ray bright blazars. Astrophys. J. 756:13. doi: 10.1088/0004-637X/756/1/13
Edelson, R. A., and Krolik, J. H. (1988). The discrete correlation function - A new method for analyzing unevenly sampled variability data. Astrophys. J. 333, 646–659. doi: 10.1086/166773
Gaskell, C. M., and Sparke, L. S. (1986). Line variations in quasars and Seyfert galaxies. Astrophys. J. 305, 175–186. doi: 10.1086/164238
Gurwell, M. A., Peck, A. B., Hostler, S. R., Darrah, M. R., and Katz, C. A. (2007). “Monitoring phase calibrators at submillimeter wavelengths,” in From Z-Machines to ALMA: (Sub)Millimeter Spectroscopy of Galaxies, Vol. 375 of Astronomical Society of the Pacific Conference Series, eds A. J. Baker, J. Glenn, A. I. Harris, J. G. Mangum, and M. S. Yun (San Francisco, CA: Astronomical Society of the Pacific), 234.
Hartman, R. C., Bertsch, D. L., Fichtel, C. E., Hunter, S. D., Kanbach, G., Kniffen, D. A., et al. (1992). Detection of high-energy gamma radiation from quasar 3C 279 by the EGRET telescope on the Compton Gamma Ray Observatory. Astrophys. J. Lett. 385, L1–L4. doi: 10.1086/186263
Patiño-Álvarez, V., Chavushyan, V., León-Tavares, J., Valdés, J. R., Carramiñana, A., Carrasco, L., et al. (2013). Optical spectrophotometric monitoring of Fermi/LAT bright sources. ArXiv e-prints. ArXiv: 1303.1893.
Smith, P. S., Montiel, E., Rightley, S., Turner, J., Schmidt, G. D., and Jannuzi, B. T. (2009). Coordinated fermi/optical monitoring of blazars and the great 2009 september gamma-ray flare of 3C 454.3. ArXiv e-prints ArXiv: 0912.3621.
Stroh, M. C., and Falcone, A. D. (2013). Swift X-ray telescope monitoring of fermi-LAT gamma-ray sources of interest. Astrophys. J. Suppl. 207:28. doi: 10.1088/0067-0049/207/2/28
Keywords: multiwavelength, blazar, 3C 279, gamma-rays, emission mechanism, FSRQ
Citation: Patiño-Álvarez VM, Fernandes S, Chavushyan V, López-Rodríguez E, León-Tavares J, Schlegel EM, Carrasco L, Valdés JR and Carramiñana A (2017) Multiwavelength Variability Analysis of 3C 279. Front. Astron. Space Sci. 4:47. doi: 10.3389/fspas.2017.00047
Received: 01 July 2017; Accepted: 03 November 2017;
Published: 23 November 2017.
Edited by:
Deborah Dultzin, Universidad Nacional Autónoma de México, MexicoReviewed by:
Giovanna Maria Stirpe, Osservatorio Astronomico di Bologna (INAF), ItalyDaniela Bettoni, Osservatorio Astronomico di Padova (INAF), Italy
Copyright © 2017 Patiño-Álvarez, Fernandes, Chavushyan, López-Rodríguez, León-Tavares, Schlegel, Carrasco, Valdés and Carramiñana. This is an open-access article distributed under the terms of the Creative Commons Attribution License (CC BY). The use, distribution or reproduction in other forums is permitted, provided the original author(s) or licensor are credited and that the original publication in this journal is cited, in accordance with accepted academic practice. No use, distribution or reproduction is permitted which does not comply with these terms.
*Correspondence: Víctor M. Patiño-Álvarez, patinoavm@mpifr-bonn.mpg.de
 Víctor M. Patiño-Álvarez
 Sunil Fernandes2
  Vahram Chavushyan
 Eric M. Schlegel
 José R. Valdés