Quasars as Cosmological Standard Candles
 C. Alenka Negrete1*
  Deborah Dultzin2
  Paola Marziani3
  Jack W. Sulentic4
  Donají Esparza-Arredondo5
  Mary L. Martínez-Aldama4
  Ascensión Del Olmo4
- 1CONACYT Research Fellow - Instituto de Astronomía, UNAM, Mexico City, Mexico
- 2Instituto de Astronomía, UNAM, Mexico City, Mexico
- 3INAF, Osservatorio Astronomico di Padova, Padua, Italy
- 4Instituto de Astrofísica de Andalucía, IAA-CSIC, Granada, Spain
- 5Instituto de Radioastronomía y Astrofísica, Morelia, Mexico
We propose the use of quasars with accretion rate near the Eddington ratio (extreme quasars) as standard candles. The selection criteria are based on the Eigenvector 1 (E1) formalism. Our first sample is a selection of 334 optical quasar spectra from the SDSS DR7 database with a S/N > 20. Using the E1, we define primary and secondary selection criteria in the optical spectral range. We show that it is possible to derive a redshift-independent estimate of luminosity for extreme Eddington ratio sources. Our results are consistent with concordance cosmology but we need to work with other spectral ranges to take into account the quasar orientation, among other constrains.
1. Introduction
Active Galactic Nuclei (AGN or quasars) are among the most powerful objects in the Universe. They have been studied for more than 50 years. Their spectra and intrinsic properties, indicating intense nuclear activity, are widely diverse. In order to organize this diversity, Sulentic et al. (2000) proposed a parameter space, described by the Eigenvector 1 (E1, see e.g., Boroson and Green, 1992). The original E1 of Boroson and Green (1992) correlated the equivalent width (EW) of the low ionization line FeII between 4435 and 4685 Å, with the intensity peak of [OIII]λ5007. The parameter space proposed by Sulentic et al. (2000) correlates optical and X-Ray spectral parameters involving only broad lines: (1) the full width at half maximum of the broad component (BC) of Hβ FWHM(HβBC), (2) the ratio of the equivalent widths of FeII (described above) and HβBC, RFeII = EW(FeII)/EW(HβBC), and (3) the photon index of the soft X-rays, Γsoft. Subsequently, Sulentic et al. (2007) added the blue shifted component of CIVλ1549 a UV high ionization line, as a fourth dimension (4D) to the E1. This 4DE1 diagram for quasars is now understood to be driven mainly by the Eddington ratio (L/LEdd) and also by the BH mass (e.g., Marziani et al., 2001; Boroson, 2002; Ferland et al., 2009).
Sulentic et al. (2000) propose the presence of two main populations based on the optical plane (FWHM(HβBC) vs RFeII): Population A for quasars with FWHM(HβBC) < 4,000 km s−1 and Population B for those with FWHM(HβBC) > 4,000 km s−1 (Figure 1 of Sulentic et al., 2002). Their phenomenological study also shows that there are spectral characteristics that distinguish objects within the same population, especially those within Pop. A. For this reason, the optical plane of the E1 was subdivided into bins with Δ FWHM(HβBC) = 4,000 km s−1 and Δ RFeII = 0.5. This created the bins A1, A2, A3, A4 defined as the RFeII increases (Figure 1 of Sulentic et al., 2002). Thus, spectra belonging to the same bin are expected to have very similar characteristics.
In this article we will briefly illustrate how the scheme of Sulentic et al. (2000) may help solving one of the big challenges in cosmology, that is to measure distances in the Universe. The Hubble law can written as: v = c z = H D, where v is the recession velocity, and D is the proper distance. At low z, the factor H is constant and equal to H0, the Hubble constant (e.g., Perlmutter et al., 1999). At higher z, H depends on both the cosmological model and the density parameter Ω = ΩM + ΩΛ, where ΩM is the density of matter and ΩΛ is the energy density. So it is important to measure the cosmic matter density ΩM in the distance range 1 < z < 4. In this range, the effect of the cosmic matter density is believed to dominate over the repulsive effect of the cosmological constant.
There have been several works focused on measuring cosmological distances using different objects as standard candles. For example, cepheids, supernovae, extragalactic HII regions and clusters of galaxies (e.g., Perlmutter et al., 1999; Chávez et al., 2012, and references therein). These works have favored the model of a flat Universe (ΩM + ΩΛ = 1). At intermediate z, Terlevich et al. (2015) used 25 HII galaxies at z ~ 2.3 to constrain ΩM, however the dispersion obtained is larger than the one using supernovae. Another method to reach higher z (~3.5) involves the use of baryonic acoustic oscillations (BAOs) obtained from the database BigBOSS/DESI (Schlegel et al., 2011). Major surveys are tracking the BAOs as standard rulers. This is a technique that is fully independent from the classical discrete standard candles such as supernovae or HII regions.
In 2014, Marziani and Sulentic (2014) proposed the use of a specific type of quasars as standard candles. They studied objects that show extreme accretion near to the Eddington limit. In the super Eddington accretion regime, the geometrically and optically thick structure known as the “slim disk" is expected to develop (Abramowicz et al., 1988). Quasars hosting slim disks should radiate at a well defined limit because their luminosity is expected to saturate close to the Eddington luminosity even if the accretion rate becomes highly super-Eddington. We point out that there are works that analyze in full detail the structure of the accretion disk (AD) at different accretion regimes. Such an analysis implies varying thickness, optical depths and magnetic fields (Pugliese and Stuchlík, 2015, 2016). The black hole spin may also have an effect (Bardeen et al., 1972; Stuchlik, 1980). The spin is expected to play a role, not only by increasing the radiative efficiency, but also by displacing the Far UV peak toward shorter wavelength: the last stable inner radius is closer to the BH for a rotating black hole, implying a stronger FUV/soft X-ray emission with respect to the non rotating case. The detailed analysis of the AD structure and black hole spin however, goes beyond the scope of the present work. In the future we will consider different scenarios, including an analysis of the disk inclination. In conclusion, we propose that highly accreting quasars can be used as cosmological candles. The present work shows the results for an optical low redshift sample. An ultraviolet high-z sample (z ~ 2.3) is discussed in the Martínez-Aldama et al., Submitted paper, also in this volume. All the computations were made considering and a “concordance cosmology” with relative energy densities ΩΛ = 0.72 and ΩM = 0.28.
2. Sample Selection
For our study, we used a sample of quasars chosen from the Sloan Digital Sky Survey Data Release 7 Shen et al. (2011), to identify the extreme accretors in the optical range at low redshift (z < 0.8). The identification of these quasars will follow the description of the E1 parameter space in the optical plane. That is, we isolated objects with RFeII > 1, belonging to Pops. A3, A4 and also some very extreme objects of Pop. A5 (with RFeII > 2).
We imposed the following filters to select only the objects with quality good enough to carry out our analysis:
1. z < 0.8 to cover the Hβ range, including the FeII blends around 4,570 and 5,260 Å.
2. S/N > 20 in the continuum at 5,100 Å.
3. RFeII > 1. To select objects with this condition, we performed automatic measurements using the IRAF task splot to estimate roughly the EW of FeII and Hβ.
4. No host galaxy contribution. The objects showing a strong contribution of the underlying galaxy were rejected.
This four criteria gave us a sample of 302 spectra.
3. Methodology
In order to isolate the “true” extreme accreting quasars, we made individual fits on the selected spectra using the specfit task of IRAF (Kriss, 1994). Specfit allows us to simultaneously fit all the components present in the spectrum: the underlying continuum, the FeII pseudo continuum and the emission lines. Specfit minimizes the χ2 to find the best fit. The steps followed to accomplish identification, deblending, and measurement of the emission lines in each object are the following:
1. The continuum. We adopted a single power-law to describe the quasar continuum using the continuum windows around 4,430, 4,760, and 5,100 Å (see, e.g., Francis et al., 1991).
2. FeII template. We used the semi-empirical template by Marziani et al. (2009), obtained from a high resolution spectrum of I Zw 1, with a model of the FeII emission computed by a photoionization code in the range of Hβ.
3. Hβ broad emission line. For highly accreting Pop A objects, Hβ can be modeled with a sum of a Lorentzian profile in its rest frame plus a blue shifted gaussian (Marziani et al., 2009).
4. [OIII]λλ4959,5007. We fitted this doublet with two Gaussians, considering: the ratio of theoretical intensities 1:3 (Dimitrijević et al., 2007), the same FWHM and the same line shift.
Apart from these four parameters, in some cases it was necessary to add other emission lines. These extra emission lines could be strong and therefore obvious. In other cases, the emission lines are weak, but we can find and identify them in the residuals of the fit. These emission lines are:
5. Hβ narrow component, modeled similarly to [OIII]λ5007: with a Gaussian profile and with the same FWHM.
6. Hβ blue shifted component. This component would be associated with a non-virialized outflow in quasars with high accretion rates (e.g., Marziani et al., 2013). We fitted this feature with a symmetric Gaussian.
7. [OIII]λλ4959,5007 semi broad component, also associated with outflows (Zamfir et al., 2010). It is characterized as being wider than the main component of [OIII]λλ4959,5007, and is generally shifted to the blue.
8. HeIIλ4686. In some objects it is detect as residual emission of the fit. We fitted it with a Gaussian component.
An example of the line fitting is shown in Figure 1. The upper panel shows the fit, and the lower panel under the fit shows the residuals. The upper abscissa is the rest frame wavelength in Å, the lower abscissa is in velocity units, and the ordinate is specific flux in arbitrary units. The vertical dashed lines are the rest frame for HβBC and [OIII]λ5007. The purple long dashed line is the fit, solid black line is the HβBC. Grey lines are the [OIII]λλ4959,5007 narrow and semi broad components, the blue line is the Hβ blueshifted component. The green line is the FeII template.
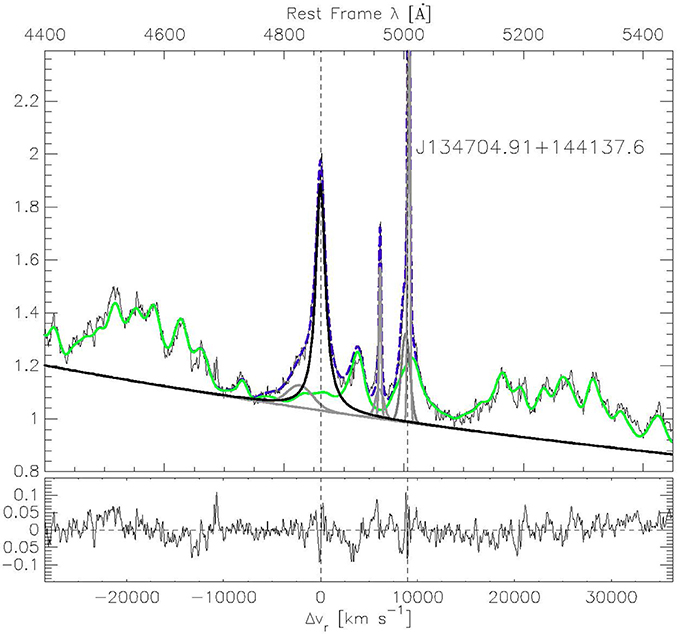
Figure 1. Example of line decomposition for the quasar J134704.91+144137.6 using specfit. See text for description.
4. Extreme Accretors as Standard Candles
In order to isolate “true” extreme accreting quasars and avoid borderline/noisy objects, we impose tighter restrictions on the selected sample. On the one hand, we choose quasars with RFeII > 1.2, based on the typical RFeII error at two sigma (one sigma is 0.1). On the other hand, we isolate only Pop. A objects, i.e., those ones with FWHM(HβBC) < 4,000 km s−1. Finally, we selected objects with S/N strictly larger than 20.0 in the continuum. These restrictions, gave us an “extreme sample” of 117 objects. It is important to mention that in the beginning we were not able to impose these two conditions using the automatic measurements. The reason is that we would have introduced objects that are not extreme accretors, or reject some that really are extreme quasars.
As pointed out previously, the main hypothesis of Marziani and Sulentic (2014) to use extreme accretion quasars as standard candles is that they have the same intrinsic luminosity, or equivalently, similar physical conditions. The bolometric luminosity of a source radiating at the Eddington ratio λEdd = L/LEdd is proportional to the product λEdd times its black hole mass (MBH). If we consider virial motions,
where cte = 104.81, fs is the structure factor, rBLR is the the broad line region radius, δv is the virial velocity dispersion estimator and G the gravitational constant. There is a way to derive rBLR independently of the quasar luminosity, based on the definition of the ionization parameter U and described in detail in Negrete et al. (2012).
where nH is the density, c is the light velocity and the number of ionizing photons ϕ = kL/hνi, with k = 0.5, νi the average frequency of the ionizing photons, and h the Planck constant. From Equation (2), rBLR can be derived if we know the product of the ionization parameter times density
In Negrete et al. (2012) we showed that both, nH and U, can be derived for individual objects using specific line ratios and CLOUDY photoionization models. In the case of the extreme accretors, we found a “typical” value of the product nH U = 109.6 (see also Padovani and Rafanelli, 1988; Matsuoka et al., 2008). Inserting Equation 3 in Equation 1, we can derive a “virial luminosity” independent of redshift:
In order to prove the consistency of our luminosity z-independent estimates we calculate how the distance modulus depends on the redshift. The distance modulus is μ = 5log(dL/10pc). The luminous distance is , where is the continuum flux at λ = 5, 100 Å, using the Bolometric Correction BC = 12.2 (Richards et al., 2006). The distance modulus can also be written as:
Figure 2 shows the trend of our “extreme sample” in the distance modulus diagram (black points). We compare our results with a sample taken from the Sloan Digital Sky Survey (SDSS) II supernova (SN) survey (Kessler et al., 2009, cyan dots). The scatter of this Figure could be due to orientation. We found that the objects with broader FWHM(HβBC) are above the solid curve, while the narrower objects are placed below. This figure shows that the so called “virial luminosity” is in agreement with the concordance cosmology.
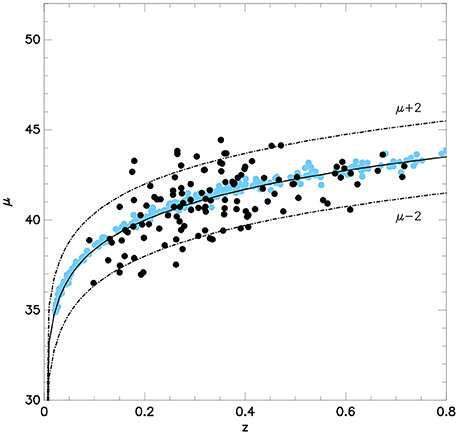
Figure 2. Distance modulus of the “extreme sample” (black dots) and the Kessler et al. (2009) SDSS-II SN sample (cyan dots) with respect to the redshift. Solid curve is the expected distance modulus for the concordance cosmology, dash dotted lines are the distance modulus with a difference of ±2 in magnitude with respect to the solid curve.
5. Summary
We have shown that the 4DE1 proposed by Sulentic et al. (2000) is a very efficient diagram that organizes both observed and physical properties of broad line quasars. For low redshift objects (z < 0.8), we can use the optical parameter space, FWHM(HβBC) Vs. RFeII, to isolate the most extreme accreting quasars. The principal characteristics of these objects is that they are strong FeII emitters, i.e., they have RFeII > 1, and they have relatively narrow lines, with a FWHM(HβBC) < 4,000 km s−1.
Based on the hypothesis that extreme accreting quasars should have the same intrinsic luminosity per unit mass, we test them as cosmological standard candles. Under several assumptions related to highly accreting objects, such as the physical conditions of the region close to the black hole, we computed a “virial luminosity” independent of z. With this luminosity we build the Hubble diagram which shows that the majority of the selected extreme quasars follow the trend of the distance modulus diagram.
In a forthcoming paper (Negrete et al., Submitted), we will give a detailed description of the selection of this sample, the methodology applied, a statistical analysis that includes the high-z sample, and the cosmological application to constrain ΩM and ΩΛ.
Author Contributions
CN and DD wrote the paper. PM and JS contributed to the main idea of the paper. CN and DE-A made the fits and analyzed the sample. All the authors contributed to the discussion and revision of the paper.
Funding
DIPARTIMENTO DI FISICA E ASTRONOMIA, Università di Padova via Marzolo, 8, I-35131 Padova, Proceedings of the meeting “Quasars at all cosmic epoch”, attn. Dr. Mauro D'Onofrio.
Conflict of Interest Statement
The authors declare that the research was conducted in the absence of any commercial or financial relationships that could be construed as a potential conflict of interest.
Acknowledgments
CN and DD acknowledge support from grants IN107313 PAPIIT, DGAPA UNAM and CONACYT project 221398. CN acknowledge support from DGAPA-UNAM grants IN111514 and IN113417. DE-A and MM-A acknowledges the doctoral and postdoctoral grant from the CONACyT, respectively. MM-A and AD acknowledge financial support from Spanish Ministry for Economy and Competitiveness through grants AYA2013-42227-P and AYA2016-76682- C3-3-1-P.
References
Abramowicz, M. A., Czerny, B., Lasota, J. P., and Szuszkiewicz, E. (1988). Slim accretion disks. Astrophys. J. 332, 646–658. doi: 10.1086/166683
Bardeen, J. M., Press, W. H., and Teukolsky, S. A. (1972). Rotating black holes: locally nonrotating frames, energy extraction, and scalar synchrotron radiation. Astrophys. J. 178, 347–370. doi: 10.1086/151796
Boroson, T. A. (2002). Black hole mass and eddington ratio as drivers for the observable properties of radio-loud and radio-quiet QSOs. Astrophys. J. 565, 78–85. doi: 10.1086/324486
Boroson, T. A., and Green, R. F. (1992). The emission-line properties of low-redshift quasi-stellar objects. Astrophys. J. Suppl. 80, 109–135. doi: 10.1086/191661
Chávez, R., Terlevich, E., Terlevich, R., Plionis, M., Bresolin, F., Basilakos, S., et al. (2012). Determining the Hubble constant using giant extragalactic H II regions and H II galaxies. Month. Notices R. Astron. Soc. 425, L56–L60. doi: 10.1111/j.1745-3933.2012.01299.x
Dimitrijević, M. S., Popović, L. Č., Kovačević, J., Dačić, M., and Ilić, D. (2007). The flux ratio of the [OIII] λλ5007, 4959 lines in AGN: comparison with theoretical calculations. Month. Notices R. Astron. Soc. 374, 1181–1184. doi: 10.1111/j.1365-2966.2006.11238.x
Ferland, G. J., Hu, C., Wang, J., Baldwin, J. A., Porter, R. L., van Hoof, P. A. M., et al. (2009). Implications of infalling Fe II-emitting clouds in active galactic nuclei: anisotropic properties. Astrophys. J. Lett. 707, L82–L86. doi: 10.1088/0004-637X/707/1/L82
Francis, P. J., Hewett, P. C., Foltz, C. B., Chaffee, F. H., Weymann, R. J., and Morris, S. L. (1991). A high signal-to-noise ratio composite quasar spectrum. Astrophys. J. 373, 465–470. doi: 10.1086/170066
Kessler, R., Becker, A. C., Cinabro, D., Vanderplas, J., Frieman, J. A., Marriner, J., et al. (2009). First-year sloan digital sky survey-II supernova results: hubble diagram and cosmological parameters. Astrophys. J. Suppl. 185, 32–84. doi: 10.1088/0067-0049/185/1/32
Kriss, G. (1994). Fitting models to UV and optical spectral data. Astron. Data Anal. Softw. Syst. 61, 437.
Marziani, P., and Sulentic, J. W. (2014). Highly accreting quasars: sample definition and possible cosmological implications. Month. Notices R. Astron. Soc. 442, 1211–1229. doi: 10.1093/mnras/stu951
Marziani, P., Sulentic, J. W., Plauchu-Frayn, I., and del Olmo, A. (2013). Low-ionization outflows in high eddington ratio quasars. Astrophys. J. 764:150. doi: 10.1088/0004-637X/764/2/150
Marziani, P., Sulentic, J. W., Stirpe, G. M., Zamfir, S., and Calvani, M. (2009). VLT/ISAAC spectra of the Hβ region in intermediate-redshift quasars. III. Hβ broad-line profile analysis and inferences about BLR structure. Astron. Astrophys. 495, 83–112. doi: 10.1051/0004-6361:200810764
Marziani, P., Sulentic, J. W., Zwitter, T., Dultzin-Hacyan, D., and Calvani, M. (2001). Searching for the physical drivers of the eigenvector 1 correlation space. Astrophys. J. 558, 553–560. doi: 10.1086/322286
Matsuoka, Y., Kawara, K., and Oyabu, S. (2008). Low-ionization emission regions in quasars: gas properties probed with broad O I and Ca II lines. Astrophys. J. 673, 62–68. doi: 10.1086/524193
Negrete, C. A., Dultzin, D., Marziani, P., and Sulentic, J. W. (2012). Broad-line region physical conditions in extreme population a quasars: a method to estimate central black hole mass at high redshift. Astrophys. J. 757:62. doi: 10.1088/0004-637X/757/1/62
Padovani, P., and Rafanelli, P. (1988). Mass-luminosity relationships and accretion rates for Seyfert 1 galaxies and quasars. Astron. Astrophys. 205, 53–70.
Perlmutter, S., Aldering, G., Goldhaber, G., Knop, R. A., Nugent, P., Castro, P. G., et al. (1999). Measurements of Ω and Λ from 42 High-redshift supernovae. Astrophys. J. 517, 565–586. doi: 10.1086/307221
Pugliese, D., and Stuchlík, Z. (2015). Ringed accretion disks: equilibrium configurations. Astrophys. J. Suppl. 221:25. doi: 10.1088/0067-0049/221/2/25
Pugliese, D., and Stuchlík, Z. (2016). Ringed accretion disks: instabilities. Astrophys. J. Suppl. 223:27. doi: 10.3847/0067-0049/223/2/27
Richards, G. T., Lacy, M., Storrie-Lombardi, L. J., Hall, P. B., Gallagher, S. C., Hines, D. C., et al. (2006). Spectral energy distributions and multiwavelength selection of type 1 quasars. Astrophys. J. Suppl. 166, 470–497. doi: 10.1086/506525
Schlegel, D., Abdalla, F., Abraham, T., Ahn, C., Allende Prieto, C., Annis, J., et al. (2011). The BigBOSS experiment. ArXiv e-prints
Shen, Y., Richards, G. T., Strauss, M. A., Hall, P. B., Schneider, D. P., Snedden, S., et al. (2011). A catalog of quasar properties from sloan digital sky survey data release 7. Astrophys. J. Suppl. 194:45. doi: 10.1088/0067-0049/194/2/45
Stuchlik, Z. (1980). Equatorial circular orbits and the motion of the shell of dust in the field of a rotating naked singularity. Bull. Astron. Instit. Czechoslovakia 31, 129–144.
Sulentic, J. W., Bachev, R., Marziani, P., Negrete, C. A., and Dultzin, D. (2007). C IV λ1549 as an eigenvector 1 parameter for active galactic nuclei. Astrophys. J. 666, 757–777. doi: 10.1086/519916
Sulentic, J. W., Marziani, P., and Dultzin-Hacyan, D. (2000). Phenomenology of Broad Emission Lines in Active Galactic Nuclei. Annu. Rev. Astron. Astrophys. 38, 521–571. doi: 10.1146/annurev.astro.38.1.521
Sulentic, J. W., Marziani, P., Zamanov, R., Bachev, R., Calvani, M., and Dultzin-Hacyan, D. (2002). Average quasar spectra in the context of eigenvector 1. Astrophys. J. Lett. 566, L71–L75. doi: 10.1086/339594
Terlevich, R., Terlevich, E., Melnick, J., Chávez, R., Plionis, M., Bresolin, F., et al. (2015). On the road to precision cosmology with high-redshift H II galaxies. Month. Notices R. Astron. Soc. 451, 3001–3010. doi: 10.1093/mnras/stv1128
Keywords: quasars: general, quasars: emission lines, quasars: broad lines, quasar: extreme accretors, quasars: NLSy1
Citation: Negrete CA, Dultzin D, Marziani P, Sulentic JW, Esparza-Arredondo D, Martínez-Aldama ML and Del Olmo A (2017) Quasars as Cosmological Standard Candles. Front. Astron. Space Sci. 4:59. doi: 10.3389/fspas.2017.00059
Received: 23 August 2017; Accepted: 27 November 2017;
Published: 15 December 2017.
Edited by:
Gianluca Calcagni, Consejo Superior de Investigaciones Científicas (CSIC), SpainReviewed by:
Øyvind Geelmuyden Grøn, Oslo and Akershus University College, NorwayZdenek Stuchlik, Silesian University in Opava, Czechia
Copyright © 2017 Negrete, Dultzin, Marziani, Sulentic, Esparza-Arredondo, Martínez-Aldama and Del Olmo. This is an open-access article distributed under the terms of the Creative Commons Attribution License (CC BY). The use, distribution or reproduction in other forums is permitted, provided the original author(s) or licensor are credited and that the original publication in this journal is cited, in accordance with accepted academic practice. No use, distribution or reproduction is permitted which does not comply with these terms.
*Correspondence: C. Alenka Negrete, alenka@astro.unam.mx