Quantifying, Projecting, and Addressing India's Hidden Hunger
 Hannah Ritchie
 David S. Reay
 Peter Higgins2
- 1School of GeoSciences, University of Edinburgh, Edinburgh, United Kingdom
- 2Moray House School of Education, University of Edinburgh, Edinburgh, United Kingdom
It is estimated that more than two billion people suffer from ‘hidden hunger’ (micronutrient malnutrition) globally, with nearly half living in India. Despite being highlighted as one the most cost-effective investments for human development, progress on addressing micronutrient deficiencies (MiND) has been slowing. The severe social, health, and economic costs of MiND in India should make it a top priority for domestic governance and international donors alike. This study, for the first time, maps food system pathways from crop production through to household-level food availability, for a range of key vitamins, minerals, and amino acids. Results suggest widespread (>80% total Indian population) risk of deficiencies in calcium, vitamin A, B12, folate, in addition to lysine limitation, with more localized deficiencies (<25% population) in iron, zinc, and vitamin B6. These deficiencies are the result of a combination of a monotonous cereal-dominated diet lacking in diversity, and overall insufficient food intake. This approach also allowed for “MiND by micronutrient” scenario analysis to 2030, to identify potential intervention points in the food system and the capacity of these interventions to address deficiency. Scenario analysis to 2030 and 2050 indicates that, although increased availability of animal-based products, reduction of supply chain losses, and close to maximum (90%) attainable yields could make some contribution to addressing Indian MiND, additional intervention strategies will be essential. Recommendations for intervention in the short (urgent), near-term (2030), and long-term (2050) have been formulated based on this analysis.
Introduction
India's “Hidden Hunger” Challenge
It is estimated over two billion people—more than one-in-three—suffer from micronutrient deficiencies globally (FAO, 2013). Micronutrient deficiency (also known as “hidden hunger” and hereafter denoted as “MiND”) occurs when the intake or absorption of essential vitamins and minerals falls below levels necessary for growth and development in children, and maintenance of physical and mental functionality in adults (von Grebmer et al., 2014).
Nearly half of the world's micronutrient deficient population live in India (USAID OMNI, 2005). India's latest National Health Survey (NFHS-4, 2015-2016) results indicate that at the national level 58.5% of children are anemic (International Institute for Population Sciences, 2016a), and the FAO estimates that ~74% are at risk of anemia as a result of iron deficiency, and 62 and 31% at risk of vitamin A and iodine deficiency respectively (FAO, 2013). Deficiencies in pregnant and lactating women in India are equally alarming—although figures vary by source, latest NFHS-4 results suggest a prevalence of anemia of 50% in pregnant women, and 53% in non-pregnant women of reproductive age (International Institute for Population Sciences, 2016a). At the sub-national level, there are also large variations in degree of malnutrition; in the state of Haryana, for example, 72% of children; 55% of pregnant women; and 63% of non-pregnant women are estimated to be anemic (International Institute for Population Sciences, 2016b).
Such deficiencies during pregnancy and in childhood years lead to a range of severe implications including increased mortality, morbidity, physical, and mental defects. Coupled with prevalence of energy-protein malnutrition, India has one of the highest rates of childhood stunting and wasting in the world, occurring in approximately one-third of all children (FAO, 2013; International Institute for Population Sciences, 2016a). The subsequent health and productivity costs of MiND in the adult population also result in severe economic losses; it's estimated that economic losses from MiND in India alone could amount to ~2.4% of its gross domestic product (GDP) (Stein and Qaim, 2007).
Micronutrient Deficiencies in India
Although progress has been made in addressing MiND in recent years, improvements in South Asia have been too slow to meet Millennium Development Goal (MDG) targets. If current trends continue, SDG2 (achieving Zero Hunger) will also be missed by 2030 (United Nations, 2016). The performance of India in particular—as a result of its large, and growing, population share—will have a major bearing on the progress of the region overall.
There are a number of interacting social, economic and agricultural drivers of India's micronutrient deficiencies, including relative food pricing of energy-dense vs. micronutrient-rich produce; farmer income effects; and inequitable gender access (Headey et al., 2012; Kadiyala et al., 2014). Ultimately these drivers result in two fundamental inadequacies; an overall lack of food intake (exemplified by latest NFHS-4 results of 1-in-5 adults being classified as underweight, and around one-third of children defined as wasted; International Institute for Population Sciences, 2016a); and poor dietary diversity resulting from an agricultural emphasis on cereal production (Kadiyala et al., 2014).
With a projected population increase to 1.6 billion by 2050 (United Nations, 2015), India faces a continued challenge both in closing the current nutrition gap, and in ensuring adequate food supply to a growing population. However, continued policy focus toward higher staple crop production is likely to fail in simultaneously addressing macro- and micronutrient malnutrition (von Grebmer et al., 2014).
Developing Informed Food System Interventions
An efficient and complete food system is necessary to deliver all basic nutritional requirements. Although increasing agricultural production will be a core component in addressing malnutrition in India, alone it may be insufficient to provide adequate micronutrient supply. Recommendations on the capacity of agricultural and alternative strategies for addressing such “hidden” malnutrition might be improved through a holistic analysis of micronutrient production, pathways through the food value chain, and the resultant availability of micronutrients at the household level.
As such, this analysis has attempted to map the flow and pathways of key micronutrients, from crop production to residual food availability within the Indian food system, in order to assess the current and estimate future risk of MiND across the population. Such analysis also aims to explore the capacity to address identified deficiency risks through broad-based food system strategies.
Methods
Food System Quantification of Current Indian Micronutrient Deficiency Risk
The Indian food system was mapped from crop production through to residual food availability using FAO Food Balance Sheets (FBS) from its FAOstats databases (FAO, 2001). FBS provide quantitative data (by mass) on production of food items and primary commodities, and their utilisations throughout the food supply chain. Food Balance Sheet data for 2011 have been used, these being from the most recent full dataset (covering all stages of the supply chain) available.
FBS provide mass quantities across the following stages of the supply chain: crop production, exports, imports, stock variation, resown produce, animal feed, other non-food uses, and food supplied (as kg per capita per year). Data on all key food items and commodities across all food groups (cereals; roots and tubers; oilseeds and pulses; fruit and vegetables; fish and seafood; and meat and dairy) are included within these balances. While there are uncertainties in FAO data (see Supplementary Information for further discussion on FAO data limitations), FBS provide the only complete dataset available for full commodity chain analysis. Therefore, while not perfect, they provide an invaluable high-level outlook of relative contribution of each stage in the food production and distribution system.
In order to calculate the total nutritional value at each supply chain stage, commodity mass quantities (e.g., tons of wheat) were multiplied by micronutrient contents from the South Asian FAO INFOODS composition and USDA nutrient databases (FAO, 2016; USDA, 2016) using the standard database approach of Ritchie et al. (2018). This summation of micronutrient production across all commodities at each stage allowed the mapping of a “waterfall pathway” of total micronutrient production, losses, re-allocation and wastage down to the household availability level.
This study attempts to quantify the average supply and availability of micronutrients through the commodity chain—micronutrients can additionally be lost through processes such as cooking. These latter losses are difficult to quantify and, as such, in the present study, these results are considered to be an upper estimate of micronutrient availability at the point of consumption. It should also be noted that this study assesses only micronutrient availability through dietary food intake; in particular demographics, micronutrients may be supplied in the form of additional interventions such as supplementation or fortification.
In this analysis, the key vitamins and minerals necessary for human health were assessed, including iron, zinc, calcium, vitamins A, B6, B12, and folate. The concentration of iodine in food items is highly variable, and strongly dependent on soil properties (Miller and Welch, 2013). This makes it challenging to assess iodine pathways using this approach; iodine quantification has therefore been omitted from this study.
Protein quality is a key concern for India in particular as a result of its largely grain-based diet (Ritchie et al., 2018), with grains tending to have poorer digestibility and amino acid (AA) profiles than animal-based products and plant-based legume alternatives (Swaminathan et al., 2012; Wu, 2016). In addition to mapping vitamin and mineral pathways, this study also analyzed the pathways of all indispensable amino acids (FAO, 2011a) using FAO and USDA composition databases (FAO, 2016; USDA, 2016). Amino acids (AAs) are presented as the quantity per gram of protein (mg/g protein), rather than in absolute terms.
FBS do not provide food loss and waste figures by stage in the supply chain. Food loss figures have instead been estimated based on regional percentages provided in separate FAO literature (FAO, 2011b). These percentage figures break food losses down across seven commodity groups and five supply chain stages (agricultural production, postharvest handling and storage, processing and packaging, distribution and consumption). The applied percentage values by commodity type and supply chain stage are provided in Supplementary Table 1.
For consistency, and to provide a better understanding of the food system down to the individual level, all metrics have been normalized to average per person per day (pppd) availability using UN population figures and prospects data (by dividing total nutrient availability at each level by national population figures) (United Nations, 2015). Whilst this provides an average per capita value for availability, it does not account for variability of micronutrient supply within the population. This study therefore adopts the standard FAO methodology of applying a log-normal distribution of food supply at the national level, utilizing an India-specific coefficient variation (CV) factor of 0.26 (FAO, 2014). Whilst the requirements for and intakes of micronutrients vary across demographic groups—depending on age, gender, activity levels, and pregnancy—this method of estimation is appropriate and is in line with the standardized Estimated Average Requirement (EAR) cut-point method, described below.
The number of individuals at risk of deficiency for micronutrients and amino acids were quantified using the EAR cut-point method, which is widely applied as the most appropriate for evaluation of micronutrient deficiency (Institute of Medicine, 2005). The EAR is defined as the median required intake and is based on the assertion that nutrient intake and requirements are independent; the distribution of requirements falls symmetrically around the EAR value; and the distribution of nutrient intakes is much larger than that of requirements (World Health Organization, 2005). WHO guidelines for calculation of Indian population EARs (for individuals >12 months of age) have been followed using specific demographic weightings for India (World Health Organization, 2005; Rao, 2010; Mark et al., 2016). Full data on EARs by age and gender group, and India population weightings are provided in Supplementary Tables 2–4. The proportion of the population defined as “at risk of deficiency” was subsequently calculated as those where estimated availability was below the India-specific weighted EAR for each vitamin, mineral and amino acid.
Projected 2050 Deficiencies Under Business-as-Usual (BAU) Conditions
To assess whether India's micronutrient deficiency risks would decrease through time as a result of expected increases in meat and dairy intake, and continued crop yield improvements under business-as-usual (BAU) policy support, initial analysis (for 2011) was first re-assessed to estimate potential levels of MiND in 2050.
It is projected that, through economic growth and shifts in dietary preferences, meat and dairy demand in India will continue to increase through to 2050. It was therefore assumed that per capita demand in 2050 is in line with FAO projections: this represents an increase in meat from 3.1 kg per person per year (2007) to 18.3 kg in 2050, and an increase in milk and dairy from 67 to 110 kg per person per year (Alexandratos and Bruinsma, 2012).
Crop yield improvements were derived based on closure of current farm yields (FY) to reported attainable yields (AY). FY is defined as the average on-farm yield achieved by farmers within a given region, and AY is defined as the economically attainable (optimal) yield which could be achieved if best practices in water and pest management, fertilizer application and technologies are utilized in non-nutrient limiting conditions. Crop yield increases were therefore derived assuming closure of this yield gap to 90% of AY based on published Indian crop-specific figures (Mueller et al., 2012). These data are available across all key crop types (see Supplementary Table 5 for baseline, and AY values). Note that this study is based on traditional crop varieties and has not included potential genetic variation and modification varieties, which are currently not consented in India (with the exception of Bt Cotton; Kumar, 2015).
Potential climate change impacts on food security and nutrition are numerous, including impacts on yields of staple crops, changes in distribution of pests and diseases, micronutrient density within staple crops and exacerbation of food waste and supply chain challenges (Chakraborty and Newton, 2011; Wheeler and von Braun, 2013). To date, most of these impacts remain poorly quantified. Nonetheless, literature on projected climate-yield impacts has been significant; this study therefore attempts to account for these yield impacts in future projections, and discusses the role of supply chain and food waste management throughout future scenarios and later discussion. Climate change impacts on crop yields in India remain highly uncertain; the importance of temperature thresholds in overall crop tolerance makes yield impacts highly dependent on greenhouse gas emission scenarios (Lal et al., 1998). This makes it challenging to robustly project 2050 climate change impacts. In this analysis, future projections of yields of Indian staple crops are estimated using crop-specific changes in yields based on averaging of published figures of historical sensitivities to temperature and greenhouse gases. These factors are then used to model future yields under temperature and greenhouse gas thresholds. This study assumes crop-specific average percentage yield changes based on the range of studies reported in the meta-analysis review of Mall et al. (2006). Such studies comprise of a combination of field-based observations and future climate modeling scenario results. The studies utilized present results for a doubling of atmospheric CO2 from pre-industrial levels. This approximates to a BAU scenario for 2050 (IPCC, 2014). The yield-climate factors assumed and applied in this analysis are provided in Supplementary Table 6. Overall changes in yield through to 2050 were therefore calculated by combining expected yield changes from closure of yield gaps (using the attainable yield figures, as described above), with projected climatic impacts by crop type.
To best demonstrate the food production potential of current agricultural support mechanisms, such as governmental policy and subsidy (which largely determine crop choices), the relative allocation of crop production was assumed constant. It was also assumed that production increases were achieved through agricultural intensification alone; this assumption was based on FAOstats data which has shown no increase in agricultural land area over the past decade, indicating a stagnation in agricultural extensification. To correct for 2050 population estimates, all metrics were re-normalized to “per person per day” (pppd) based on medium fertility scenario projections from the UN prospects (United Nations, 2015).
Accelerated Intervention Strategies to 2030
If India is to meet the SDG2 targets of ending malnutrition (i.e., by 2030), these strategies will likely have to be accelerated. To assess the impact of strategic acceleration of food production and waste interventions to meet SDG2 in the context of micronutrient supply, four hypothetical scenarios were assessed. As for the 2050 scenario, all metrics were re-normalized to “per person per day” (pppd) in 2030 based on medium fertility scenario projections from the UN prospects (United Nations, 2015).
The following scenarios were assessed:
Scenario 1: increased meat and dairy intake. This scenario assumes that the FAO's average projected meat and dairy intake in 2050 was reached by 2030 (Alexandratos and Bruinsma, 2012). This scenario assumes no change in supply chain losses or increases in crop production.
Scenario 2: 50% reduction in supply chain losses. This scenario assumes that harvesting, post-harvest, processing, and distribution food losses were reduced by 50%. This scenario assumes no change in meat and dairy consumption, or crop production.
Scenario 3: increased meat and dairy intake, and attainment of 90% attainable yields (AY). This scenario combines Scenario 1 with significant improvements in crop yields to close the current yield gap to 90% of attainable yields (AY). This scenario applies the methodology implemented in the 2050 BAU analysis, with adjustment in line with a smaller population in 2030.
Scenario 4: increased meat and dairy intake, 50% reduction in supply chain losses and attainment of 90% attainable yields (AY). This scenario assesses the combined impact if all measures were implemented, thereby assessing the maximum capacity of broad-based strategies to address MiND by 2030.
Results
Current Micronutrient Malnutrition
Following full pathway analysis from crop production through to supply at the individual level, average per capita availability in India in 2011 is shown in Figure 1 for the key micronutrients and amino acids. By estimating the national distribution of availability, the percentage of the total population and equivalent number of individuals at risk of falling below Estimated Average Requirements (EARs—see Methods) are also shown. These individuals are subsequently considered to be at risk of MiND or lysine limitation. A colored “traffic light” system has been employed in Figure 1, where red indicates a risk of deficiency in >50% of the population; orange for 25–50%; yellow for <25%; and green for <5% risk of deficiency.
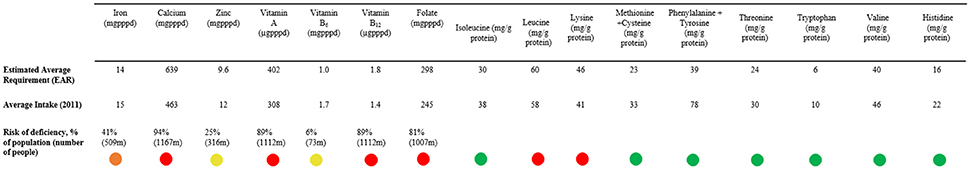
Figure 1. Average per capita availability of key micronutrients and essential amino acids assuming equitable distribution in India (2011). Average per capita availability of essential vitamins and amino acids in India assuming an equitable distribution across the population, measured in 2011. These are measured vs. the national weighted estimated average requirement (EAR). Also noted is the percentage and absolute number of the population at risk of deficiency based on distribution curves. A colored “traffic light” system has been employed, where red indicates a risk of deficiency in >50% of the population; orange for 25–50%; amber for <25%; and green for <5% risk of deficiency.
These results indicate severe deficiency risks across all key micronutrients for the Indian population in 2011. These deficiencies broadly fall into two categories (which are important to differentiate for more effective intervention strategies): “nationwide deficiencies” where the majority of the population are at risk; and “targeted deficiencies” where a smaller and more specific demographic of the population are at risk of falling below requirements.
In this analysis, iron, zinc, and vitamin B6 could be considered to be targeted deficiencies with 41, 25, and 6% of the population potentially falling below EARs, respectively. Estimates of zinc prevalence in 2011 are similar to results published by Wessells and Brown (2012), which reported a deficiency risk of 31% in 2005 (Wessells et al., 2012). It is likely that children, women, and more specifically pregnant or lactating women, will be the dominant at risk demographics within these groupings as a result of unequal access to good nutrition and healthcare, and higher typical requirements (see Supplementary Tables 3 and 4 for EARs by demographic).
Although iron and B-vitamin deficiencies do not result in anemia in all cases, they can act as an important precursor (Lynch, 2011). The availability of biomarker estimates of micronutrient deficiency from household surveys is particularly limited—such data are collected only periodically across a select number of micronutrients. However, biomarker indicators in the form of hemoglobin levels are frequently collected within vulnerable groups such as pregnant women and children. Biomarker estimates of hemoglobin concentrations the NFHS-4 2015-16 survey suggest 50, 53, and 59% of pregnant women, women of reproductive age, and children under the age of five were anemic, respectively (International Institute for Population Sciences, 2016a). These results further suggest that these groups are likely to dominate the specific demographic at risk of iron and B-vitamin deficiency.
The other key micronutrients assessed - calcium, vitamin A, B12 and folate – all indicate a widespread risk of deficiency, with 94, 89, 89, and 81% of the population deemed at risk, respectively. An overall lack of dietary diversity, particularly with respect to fruits, vegetables, pulses and animal-based products is likely to be responsible for nationwide risk of MiND with respect to these micronutrients (von Grebmer et al., 2014). It should be noted that their analysis maps only nutrient availability through food dietary intake; as such, they may overstate particular deficiencies where particular demographics attain micronutrient intake from other sources such as supplementation.
Amino acid availability estimates indicate that lysine, and less notably leucine supply, is limited in the average Indian diet, falling below EAR values. This strongly supports previous studies which have highlighted lysine as a major concern for protein quality, especially in low-meat diets (FAO, 2011a; Swaminathan et al., 2012).
Analysis of how micronutrient pathways evolve from crop production through to household-level availability plays an important role in understanding potential intervention points. There is significant variability in overall pathway patterns between the various micronutrients analyzed in this study. Vitamins and minerals concentrated in highly perishable foods, such as fruits, vegetables and animal-based products, show proportionately higher supply chain losses vs. macronutrients (FAO, 2011b).
Distribution of Vitamin A, zinc and B12 have been used here to demonstrate the contrast in pathways for nutrients concentrated in fruit and vegetables, cereal-based, and animal-based produce. For example, almost 70% of plant-based vitamin A is lost between crop production and food availability (Figure 2A), with minerals such as calcium (Figure 2B) showing similar loss streams. Both show significant losses at post-harvest, processing, and distribution stages. This is in contrast to minerals more concentrated in less perishable commodities; for example, zinc, which is more concentrated in cereals, beans, and nuts in the Indian diet, shows lower processing and distributional losses (Figure 2C). The pathways for elements unique to meat and dairy products - such as vitamin B12 have a significantly shorter value chain, and are largely determined by total meat production (Figure 2D). Full pathways for all micronutrients are provided in Supplementary Figures 1a–g.
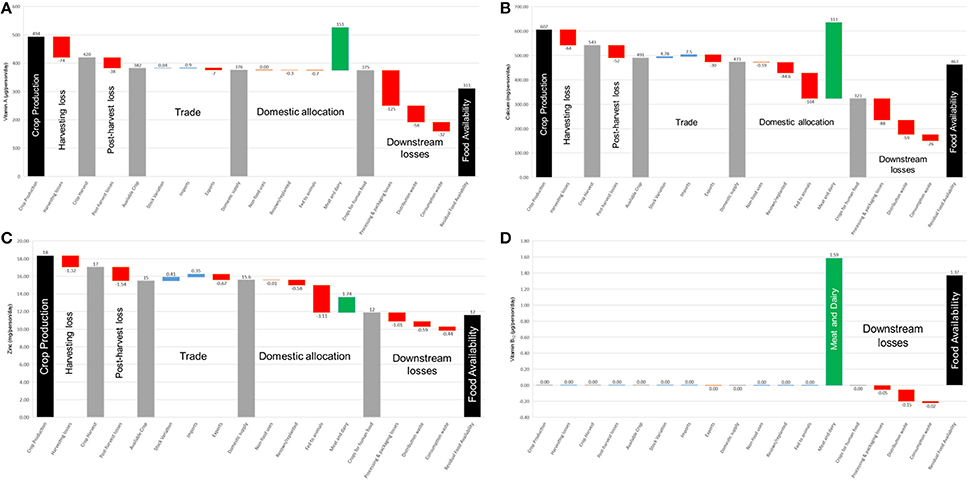
Figure 2. Production and losses in the Indian food system from “field to fork” in 2011. Food pathways in (A) vitamin A; (B) calcium; (C) zinc; (D) vitamin B12 from crop production to residual food availability, normalized to average per capita levels assuming equal distribution. Red bars (negative numbers) indicate food system losses; blue bars indicate system inputs; green bars indicate meat and dairy production; and gray bars indicate micronutrient availability at intermediate stages of the chain.
Long-Term (2050) Deficiencies Under Business-as-Usual (BAU) Conditions
Full results (including availability, requirement, and risk of deficiency) in the case of a BAU agricultural policy and expected (FAO) meat intake to 2050 are provided in Figure 3.
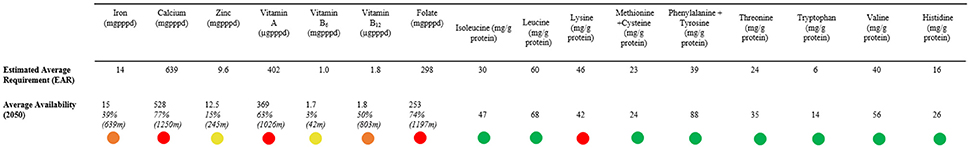
Figure 3. Average per capita availability of key micronutrients and essential amino acids assuming equitable distribution in 2050. Average per capita availability of essential vitamins and amino acids in India assuming an equitable distribution across the population in 2050 projections based on business-as-usual agricultural policies. These are measured vs. the national weighted estimated average requirement (EAR). Also noted is the percentage and absolute number of the population at risk of deficiency based on distribution curves. A colored “traffic light” system has been employed, where red indicates a risk of deficiency in >50% of the population; amber for 25–50%; yellow for <25%; and green for <5% risk of deficiency.
In almost all micronutrients and amino acids, there is a reduction in the percentage of the population at risk of deficiency by 2050 compared to current (2011) levels. This improvement in average availability is sufficient to progress vitamin B12 from a red (>50% of population at risk) to an amber (25–50% of population at risk) rating, and an elimination of leucine limitation in the average diet. However, a risk of severe deficiencies in several micronutrients remains, and lysine continues to be limiting.
It is worth noting that, despite significant reductions in the percentage of the population at risk of deficiency by 2050, the absolute number of individuals at risk increases in most cases as a result of Indian's growing population.
Accelerated Intervention Strategies to 2030
Results of the four scenarios mapped through to 2030 are shown in Figure 4, with comparison to EAR and current (2011) values. Results show that under no scenario—even scenario 4, where all three broad-based strategies are combined—are deficiency risks in any of the key vitamins and minerals sufficiently addressed. However, comparison of the four scenarios is valuable in informing the relative merits of each of the individual interventions, and in exploring what additional measures would be necessary to sufficiently address this challenge.
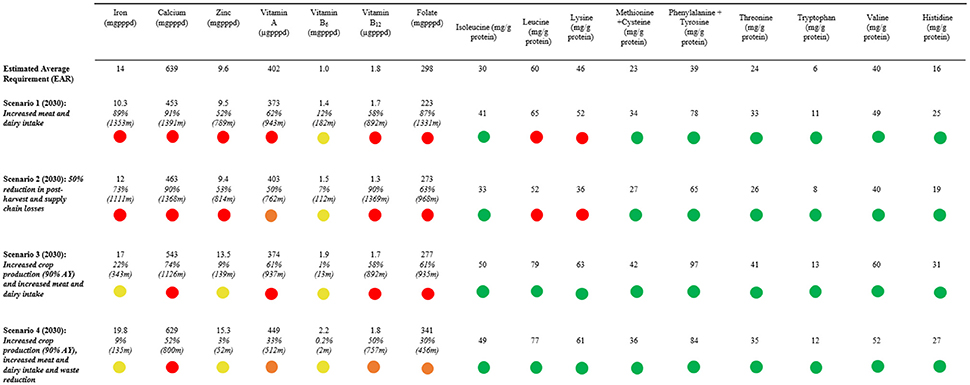
Figure 4. Average per capita availability of key micronutrients and essential amino acids assuming equitable distribution under 2030 scenarios. Average per capita availability of essential vitamins and amino acids in India assuming an equitable distribution across the population in 2030 based on meat, waste and yield scenarios. These are measured vs. the national weighted estimated average requirement (EAR). Also noted is the percentage and absolute number of the population at risk of deficiency based on distribution curves. A colored “traffic light” system has been employed, where red indicates a risk of deficiency in >50% of the population; amber for 25–50%; yellow for <25%; and green for <5% risk of deficiency.
Analysis of amino acid limitation highlights that, in all scenarios where expected 2050 meat and dairy intake is accelerated to 2030, lysine availability is no longer considered limiting in the average Indian diet. Note that many individuals will still be consuming less than the average meat intake—for these individuals, lysine, and possibly leucine, limitation would still continue to affect protein quality. The necessity of increased meat and dairy intake for amino acid provision is emphasized by continued lysine and leucine limitation in scenario 2, where supply chain losses are reduced but per capita consumption of animal-based products is assumed to remain at current (2011) levels.
As results from scenario 2 show, a large reduction in supply chain losses is significant in improving availability of vitamin A. This would be expected given that loss of perishable commodities, such as fruits and vegetables, resulted in significant losses of vitamin A from the supply chain. Folate, another vitamin richly concentrated in fruits and vegetables, also showed significant improvements in availability (albeit insufficient to reduce risk of MiND below 50%). Improved supply chain management alone, without increased crop yields and meat intake, would naturally result in an increase in deficiency risks for the remaining vitamins and minerals as a result of a growing population.
The key contribution of an accelerated increase in meat and dairy intake (scenario 1) is an increase in vitamin B12 consumption, as meat and seafood are the only natural dietary source of B12. Vitamin A intake also improves with increased meat and dairy consumption, although this is less effective than a reduction in supply chain losses.
A combination of increased meat and dairy, significant increases in crop yields, and reduced supply chain losses (scenario 4) would result in the largest reductions in MiND risk. Incidence of all deficiency risks, with the exception of calcium, would fall below 50% of the population. Risk of deficiency in iron, zinc and vitamin-B6 would see significant reductions—all below 10% of the population. However, risks of MiND in calcium, folate, and vitamins A and B12 would remain severe.
Discussion
This study's results indicate that the current risk of “hidden hunger” in India is severe. This has been previously acknowledged within the literature (Klaus von Grebmer et al., 2016), however the true extent of this risk across key micronutrients has been poorly quantified. The novel mapping of pathways of micronutrients, from crop production through to availability at the household level, undertaken here provides a valuable tool in highlighting the potential leverage points in the supply chain which could be used to address these deficiency risks.
Analysis of BAU pathways to 2050, and accelerated intervention strategies to 2030, highlight that, while increased meat and dairy intake, increased crop production and a reduction in supply chain losses have the potential to reduce the prevalence of MiND, they will be insufficient alone—even in the most optimistic scenarios—to meet the target of SDG2 by the target date of 2030, or even 2050.
Broad-Based Strategies
It's important to note the scale of the challenge India would face in accelerating these three broad-based strategies to 2030 as envisaged here. The potential contribution and challenges of each of these options are described below.
Increased Meat and Dairy Intake
Animal-based products are described as “complete proteins,” having adequate proportions of all essential amino acids (meaning none are considered to be “limiting”). In addition to being a key source of high-quality protein, meat is rich in iron, zinc, and B-vitamins; dairy products form a key source of calcium, B12, vitamin A and folate (Rivera et al., 2003). Animal products are the only natural source of vitamin B12. Their consumption has shown additional nutritional benefits beyond those expected from increased micronutrient provision alone; studies have linked their consumption to increased bioavailability and absorption of iron and zinc from other food groups when consumed together (Welch, 2001).
There is significant agreement that moderate consumption of animal-based produce is particularly important for children, leading to improved growth outcomes, including improved cognition and motor performance (Dror and Allen, 2011). Studies across a number of low-income countries in Africa and South Asia have suggested a strong link between meat consumption in young children and lower stunting rates (Krebs et al., 2011). As India has strong lactovegetarian preferences (Remedios et al., 2016) and one of the highest rates of childhood stunting globally (FAO, 2013) this is an important consideration.
Increased meat consumption has historically been a direct reflection of economic growth (Alexandratos and Bruinsma, 2012), and therefore tends to grow in line with economic trends. This makes it challenging to deliberately accelerate uptake, unless through economic mechanisms such as meat subsidization. It is suggested that, while increased meat consumption should continue to be a focus, the promotion of sustainable and nutritionally-similar alternatives such as pulses, legumes, and meat-free substitutes (Kumar et al., 2017) should also be closely considered.
Pulses and legumes may offer a significantly more sustainable alternative protein and micronutrient source (with the exception of vitamin B12; Vecchio et al., 2014). The development and increasing popularity of meat-free substitute products, such as mycoprotein and in-vitro meat, may also offer sustainable proteins with a comparable nutritional profile (Pandurangan and Kim, 2015; Apostolidis and McLeay, 2016). The lack of market access, and current economic barriers in India mean that widespread uptake of these products is unlikely to be feasible in the short-term. However, significant progress in the biotechnology sector to reduce consumer cost and widen market penetration for such meat-free products could be a viable target; this could provide lower-cost, micronutrient-rich proteins, allowing India to “leapfrog” the traditional development pathway of increasing meat consumption.
Reduction of Supply Chain Losses
Supply chain inefficiencies and losses have received significant attention in their contribution to malnutrition (FAO, 2011b) and environmental impacts (Porter et al., 2016). It's important to distinguish between food “losses” and “wastage”: the former describes edible food lost at the harvesting, post-harvest, production and processing stages of the chain, whereas the latter describes wastage as a result of behavioral factors at the retail and consumer level (Bond et al., 2013). Food system analyses in this study highlight that the majority of India's losses occur within the post-harvest, processing and distribution stages of the food chain—likely as a result of poor management, refrigeration, and preservation practices during storage and transportation. This loss is even more significant for micronutrient-rich commodities such as fruits, vegetables and animal products (Miller and Welch, 2013).
The majority of developed countries have planned food processing infrastructure, which has effectively reduced the amount of upstream food loss (although this has transitioned to higher wastage at the consumer level; FAO, 2011b). Food processing in the form of packaging and preservation can significantly reduce food losses and enhance nutritional value (Miller and Welch, 2013). It not only prevents overall spoilage, but also helps retain micronutrients that might otherwise be lost over time. Processing is also a pre-requisite for food fortification (discussed below), hence the two strategies go hand-in-hand.
Investment in improved management systems to prevent losses can reap multiple benefits: it improves the nutritional value of foods and subsequently contributes to reducing micronutrient deficiencies; it can allow farmers a higher income through a larger sellable harvest; and it reduces the resource inputs [water, energy, fertilizer, and resultant greenhouse gas (GHG) emissions] for a given utilizable output. The benefits of investment in food supply chain management can therefore be very significant, and reaped by a range of beneficiaries.
Results indicate that the micronutrients with the greatest supply chain losses—vitamin A, folate, and calcium—are associated with widespread risks of deficiency (across the majority of the population in India). This signals the need for a mass intervention strategy with nation-wide coverage. India's demographic distribution currently poses important challenges to developing a country-wide food network that fully addresses MiND. Such infrastructure is often most effective through centralized distribution centers—thereby most-suited to urban populations, and rural regions with sufficient connectivity (Miller and Welch, 2013). The development of such networks in expanding urban centers should form a near-term (next 5 years) priority. Connectivity with rural populations is likely to be limited during this period, however work toward rural integration over longer timescales (>10 years) should be an ongoing and progressive priority.
Increased Crop Yields and Production
This study assessed the impact of closure of current yield gaps to 90% of attainable yields (AY) by 2030 (scenarios 3 and 4) on MiND risks. To achieve this high level of production, India would have to significantly improve on its historical trend of staple crop yield enhancement through to 2030. For example, wheat yields in India are growing at ~0.9% per annum (non-compounding) from 2009 levels and have shown roughly linear growth at this rate over the last decade (Fischer et al., 2014). To attain the 90% AY Figures used in this study, yields would have to increase by 36% from 2011 levels, equating to a consistent annual growth rate of 1.9% to 2030. This is double India's historical growth rate—a highly ambitious target which would require significant investment in terms of agricultural practice, irrigation and fertilization practices.
Resource constraints in terms of soil fertility (Bhandari et al., 2002), declining water tables (Mekonnen and Hoekstra, 2016) and recent concerns over yield stagnation globally—in wheat, rice, and maize in particular (Ray et al., 2012)—suggests that such progress may be technically unfeasible even with significant investment.
India's challenge of maintaining balance between macro- (calories, total protein, and fat) and micronutrient (mal)nutrition is difficult to address. India's agricultural policies are currently still oriented toward achieving self-sufficiency in calories and protein (von Grebmer et al., 2014), predominantly through favorable subsidies for rice, wheat, and sugarcane production (Sharma and Thaker, 2010). Despite this drive for self-sufficiency, the prevalence of macronutrient deficiency (calories, protein, and fat deficiency) remains high; domestic food production faces a serious challenge in addressing current malnutrition, in addition to keeping pace with projected population growth (Ritchie et al., 2018).
This analysis suggests that agricultural policy orientation and land allocation toward production of staple crops may have resulted in a domestic crop composition which is insufficient to also address micronutrient needs. Crop and dietary diversification may offer one option. However, the re-allocation of land used for staple crop production toward more micronutrient-dense commodities will, in most cases, result in reduced total caloric production. This suggests an important conclusion, supported by the results from the scenarios considered here: India's domestic agriculture will be insufficient to address both macro- and micronutrient deficiencies simultaneously.
As such, food imports could play an important role in bridging this gap. However, food imports can have a significant impact on domestic prices (Anand et al., 2016), and with the dominance of agriculture as a primary source of employment in India, a negative influence on farmer income (Kadiyala et al., 2014). Further research is therefore needed on how to best optimize global food trade and import strategies for India, without significant adverse impacts on domestic prices and livelihoods. In an optimal scenario, such trade agreements would benefit poorer rural households through increased agricultural income, thereby making dietary diversification more affordable for all demographics.
The types of commodities essential in reducing MiND vary by micronutrient (key dietary sources of each micronutrient are detailed in Supplementary Table 7). Vegetables—leafy greens in particular—are typically micronutrient-dense, with high levels of calcium, iron, zinc, vitamin-A, and folate (USDA, 2016). Pulses and legumes hold multiple benefits for overall nutrition in India: they possess high levels of iron, zinc, and folate, and are one of the few commodities with calcium levels comparable to dairy produce (ibid). They also offer a key source of high-quality protein (thereby contributing to overall protein malnutrition alleviation), being the few plant-based commodities rich in lysine. From a sustainability perspective, pulses and legumes have been highlighted as a core solution on transitioning toward a more sustainable food system; nitrogen-fixation in leguminous crops aid soil fertility and reduces fertilizer demands (Gliessman, 2016); they also constitute one of the lowest-intensity, high-protein food groups in terms of GHG emissions (Tilman and Clark, 2014), and have low water requirements relative to alternatives (Vanham et al., 2013). Whether imported or produced domestically, pulses and legumes could form an integral part of Indian dietary diversification, with a unique ability to simultaneously address MiND and protein malnutrition sustainably.
While the broad-based strategies discussed here could be integral to addressing MiND in India, policies will need to combine these strategies with additional targeted interventions (such as food fortification, biofortification and dietary supplementation). These targeted interventions are detailed by supply chain stage, description and estimated cost in Table 1, and discussed in the following section.
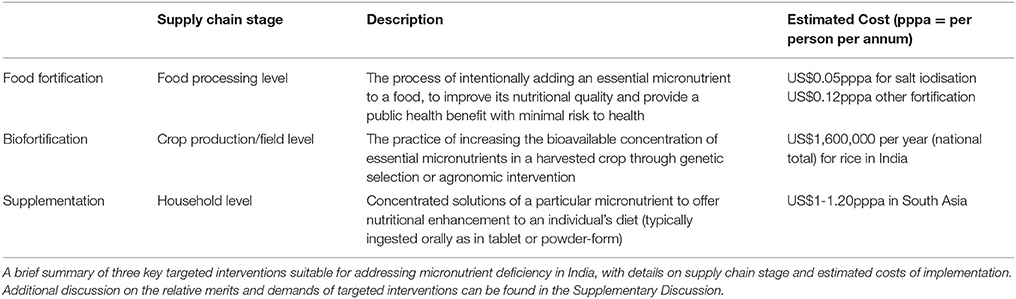
Table 1. Key targeted intervention options for addressing micronutrient deficiencies in India.
Targeted Interventions
Results presented in this study indicate an important distinction in deficiency risk between micronutrients: iron, zinc, and vitamin B6 deficiency is likely to be most prevalent in a particular subsection of the population— so targeted interventions which reach the affected demographics (primarily children, pregnant, and lactating women) are therefore necessary. In contrast, inadequate intake of calcium, vitamin A, B12, folate, and iodine are widespread—hence strategies addressing these deficiencies must be implemented across the entire population.
The selection of intervention strategy is context-dependent and determined by several key factors: the specific micronutrient being addressed; the prevalence of deficiency within a given population (i.e., widespread or demographic-specific); and the infrastructural, social and economic circumstances of the country or region in question (Miller and Welch, 2013). As such, these factors must form core considerations in policy decisions—failure to do so is likely to reduce effectiveness and may result in misplaced resources.
The potential role of different intervention measures based on the results of this study, and the Indian context, are discussed below. The feasibility of each strategy for addressing MiND by micronutrient is summarized in Table 2.
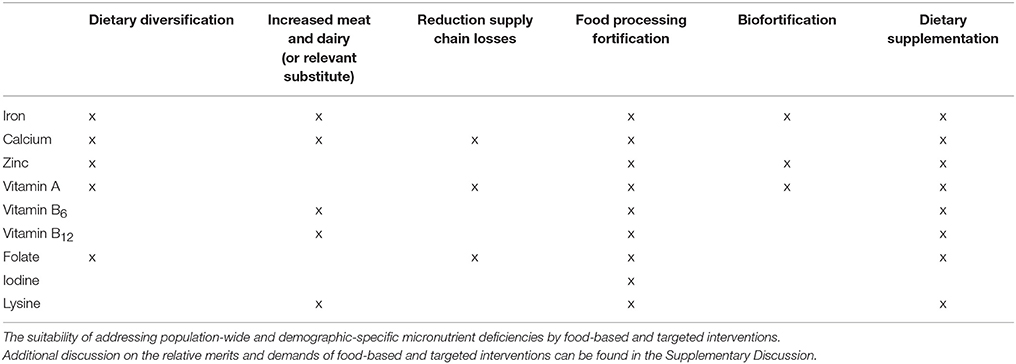
Table 2. Suitability of the various food-based and targeted intervention options in addressing Indian deficiency, by micronutrient.
Food Processing and Fortification
Food processing not only allows for a reduction of supply chain losses, but also provides the infrastructure necessary to facilitate food fortification. Food fortification is implemented at the processing stage, and involves the addition or enhancement of one or more nutrients to a food product. Several types of fortification programmes exist, covering mass, targeted, voluntary, and mandatory fortification (Allen et al., 2006). Multiple programme types are relevant in the Indian context.
Mandatory fortification applies in the case where the government makes it a regulatory requirement to fortify a given food product (Allen et al., 2006). The most common case of mandatory fortification is the Universal Salt Iodisation (USI) programme—which India also implements—which requires salt to be fortified with an adequate amount of iodine (≥15 ppm). The USI programme has achieved significant global success, with an estimated eradication of iodine deficiency in 34 countries, and delivery of iodised salt to more than 70% of households across the world (Unicef, 2008). India has also celebrated significant success in decreasing levels of iodine deficiency (Rah et al., 2015), however progress in addressing this MiND appears to be slowing (Miller and Welch, 2013). Iodised salt only reaches an estimated 71% of Indian households (Rah et al., 2015), falling well short of the 90% coverage required to achieve USI status. The 30% of households which are currently not receiving iodised salt are likely to be those in the most remote areas—meaning there are significant distribution and access barriers—and of low socioeconomic status. Overcoming these infrastructural challenges for full coverage should be an urgent priority, with USI being a practice which is sustained in the long-term. USI is a sustainable, cost-effective means of eradicating iodine deficiency, with an annual cost of only US$0.05 per person, and a benefit:cost ratio of 30:1 (The Micronutrient Initiative, 2009).
Mass fortification involves the addition of micronutrients to particular food groups or products which are widely consumed across a given population, such as wheat or rice in India. This type of programme is used in addressing nutrient deficiencies which are prevalent across a large proportion of the population. In the case of India, this would include calcium, vitamin A, B12, folate, and lysine. However, this coverage could also be extended to a wider range of micronutrients, especially those such as iron and zinc where deficiency is still highly prevalent, albeit within smaller demographics. The major barrier to mass fortification is India's current lack of centralized food processing and distribution networks; these form a fundamental pre-requisite for effective mass fortification programmes. As with biofortification (described below), the financial hurdle to fortification is the capital cost involved in development of appropriate infrastructure and networks (Miller and Welch, 2013). Once in place, the running costs can be very low, with a high payback ratio; wheat and flour fortification can cost just US$0.12 per person per year (The Micronutrient Initiative, 2009).
Food fortification strategies should be coupled with processing developments for reduction of supply chain losses—it is recommended that this forms a near-term (next 5 years) priority, with acknowledgment that coverage is likely to be initially limited to urban populations. Connectivity and wider infrastructure networks for broader coverage should continue to be a focus over longer timescales.
Biofortification
Biofortification occurs at the earliest stage of the food system. It is a comparably newer strategy, involving the innovative use of plant breeding to increase micronutrient concentrations in staple crops(Bouis, 2003). Despite biofortification sometimes being considered a competing strategy, it can be a well-suited complement to commercial fortification (Miller and Welch, 2013). Since the two approaches are most effective in targeting different beneficiaries, they can be used simultaneously to reach a larger subset of the total population. Commercial fortification is more easily suited to urban, well-connected populations, whereas biofortification can be more effective in rural areas where food production is localized, often subsistence-driven, and poorly-connected to distribution centers.
Following the development and distribution of biofortified crop varieties, the farmer should ideally be able to sow and harvest the crop using traditional approaches (i.e., the farmer's only change would be in adopting the new seed varieties) and incur no change in relative costs. Biofortification research and development is still in its relative infancy, with efforts focused across countries in the Global South (Saltzman et al., 2013).
Crops targeted for biofortification should be staple crops commonly produced and consumed by the local population—in India, this is likely to be wheat, rice, pearl millet, and sweet potato. To date, effective biofortification of crops with iron, zinc, and vitamin-A has been proven, with distribution via the HarvestPlus programme (http://www.harvestplus.org/). In India, this includes zinc wheat, iron pearl millet, and “golden rice” (vitamin-A enriched rice). Such biofortification could address the targeted deficiencies of iron and zinc—most likely to be prominent in rural pregnant women and children—and widespread vitamin-A deficiency.
The HarvestPlus programme predicts that it could take more than a decade before biofortified crops are widely distributed and utilized in target countries (Miller and Welch, 2013). This suggests that increasing uptake should be a near-term intervention focus for India, but wide adoption is only likely to be achievable over the longer-term. In the meantime, development work should focus on addressing the qualities of biofortified varieties which will increase their social acceptability: they should be equally (if not more) profitable for a farmer than current harvested varieties; harvested crops must be attractive and accepted by consumers in target markets; and the nutritional benefits must be clearly demonstrable through evidence-based results. Increasing the coverage of micronutrients which can be biofortified, to include those such as folate, lysine, and calcium, should also be a longer-term focus.
As with food fortification, investment is largely focused at the capital stage. Limited evidence makes it challenging to complete a total cost-benefit analysis. However, it is estimated that adaptive breeding (capital) costs for biofortification of total rice production in India would be ~US$1,600,000 per year (Meenakshi et al., 2010). At the national level, this would be a relatively small investment. The largest beneficiaries of biofortification are likely to be low-income households, hence this cost should ideally be absorbed through private or public investment, rather than financed through farmer or consumer price increases. The potential economic benefits of such an investment are expected to be extremely high (Meenakshi et al., 2010), and delivered to demographics of low socioeconomic status.
Supplementation
Food processing and biofortification are complementary strategies to address MiND over near- to long-term timescales (>5–10 years). However, the social, health and economic costs of malnutrition in India are on-going, making urgent interventions—such as provision of dietary supplements—necessary to bridge this period. Dietary supplementation is most commonly delivered in tablet or powder-form.
The irreversibility and permanence of maternal and childhood malnutrition means that the most common target groups for dietary supplements are children, pregnant, and lactating women (Stoltzfus, 2011; Sachdev and Gera, 2013). India has had national programmes delivering vitamin-A to children under the age of five (providing a biannual dosage), and a national anemia control programme for pregnant women and children (delivering 100 tablets of iron and folic acid), for more than 30 years (Vijayaraghavan, 2002). Evaluation of these programmes has indicated an extremely low success rate, attributed to economic, social, and educational challenges. It's estimated that allocated funding for these programmes is sufficient to cover only 10% of requirements; <50% (vitamin-A), and 10% (iron) of necessary supplies are available; distribution is irregular, with <5% of pregnant women receiving more than 90 of the required 100-dosage; and due to poor nutritional education (Vijayaraghavan, 2002), very poor compliance in intended beneficiaries.
India's large population size and prevalence of MiND makes the investment scale even more challenging. Supplementation can be inexpensive, with annual costs ranging from US$1-1.20 per person in South Asia and high benefit:cost ratios of (17:1) for vitamin-A supplements alone (The Micronutrient Initiative, 2009). However it is, in relative terms, more expensive than interventions such as commercial food fortification and biofortification (in the order of dollars, rather than cents per person). Delivering the necessary investment and distribution networks for supplementation programmes in pregnant women and children should be an urgent and near-term priority. Additional key supplements should also be considered for these groups—lysine supplements for children, in particular. However, a long-term programme providing total coverage of the Indian population would be an unsustainable delivery model for addressing MiND. Total costs would be prohibitively high, and compliance would likely drop with time.
Supplementation should therefore form an urgent and short-term (<5 years) cornerstone in addressing MiND, but should be utilized as a bridge toward more efficient and sustainable delivery mechanisms such as fortification, biofortification, and dietary diversification. Thereafter, supplementation should be reserved for vulnerable demographics with significantly higher daily requirements, such as pregnant women—a practice also implemented in developed countries today.
Conclusion
In summary, results of this study have highlighted serious deficiency risks across most essential micronutrients in India. Scenario analysis suggests that current agricultural policies will be wholly insufficient in addressing micronutrient malnutrition— in fact, orientation toward maximizing macronutrients (predominantly calories) may serve to exacerbate this issue. Broad-based interventions will remain an integral component in addressing MiND in India, with scenario analysis indicating significant potential in the reduction of supply chain losses, and increased dietary diversification through meat and dairy intake. However, India faces a significant challenge in simultaneously addressing macro- and micronutrient malnutrition with a growing population (for reference, rates of 50% MiND in 2030 would put more than 800 million at risk of deficiency in India alone). This limits its domestic potential to increase dietary diversification without causing a negative impact on caloric production.
Such a result indicates that India must address its MiND through an enhanced combination of intervention strategies, including dietary diversification of micronutrient-rich produce including fruits and vegetables, pulses, and animal-based products (domestically and through increased imports), food processing and fortification, biofortification, and supplementation. These interventions are best optimized using complementary approaches, geared toward specific demographics and evolving in line with India's changing socioeconomic and infrastructural development. The high benefit:cost ratios of the MiND intervention strategies considered here should make achieving this enhancement an urgent and sustained focus for the Indian government, and for international aid donors and policymakers.
Author Contributions
HR conceptualized the research, developed the methodology, and carried out the analysis with inputs from DR and PH. All authors contributed to writing the paper.
Funding
This research was funded by the UK Natural Environment Research Council (NERC, grant number: NE/L002558/1) under its E3 Doctoral Training Programme (DTP).
Conflict of Interest Statement
The authors declare that the research was conducted in the absence of any commercial or financial relationships that could be construed as a potential conflict of interest.
Supplementary Material
The Supplementary Material for this article can be found online at: https://www.frontiersin.org/articles/10.3389/fsufs.2018.00011/full#supplementary-material
References
Alexandratos, N., and Bruinsma, J. (2012). World agriculture: towards 2030/2050: an FAO perspective. Land Use Policy 20, 375. doi: 10.1016/S0264-8377(03)00047-4
Allen, L., Benoist, B., Dary, O., and Hurrell, R. (2006). Guidelines on Food Fortification With Micronutrients. Geneva: World Health Organization.
Anand, R., Kumar, N., and Tulin, V. (2016). Understanding India's Food Inflation: The Role of Demand and Supply Factors. International Monetary Fund. Available online at: http://www.imf.org/~/media/Websites/IMF/imported-full-text-pdf/external/pubs/ft/wp/2016/_wp1602.ashx
Apostolidis, C., and McLeay, F. (2016). Should we stop meating like this? Reducing meat consumption through substitution. Food Policy 65, 74–89. doi: 10.1016/j.foodpol.2016.11.002
Bhandari, A. L., Ladha, J. K., Pathak, H., Padre, A. T., Dawe, D., and Gupta, R. K. (2002). Yield and soil nutrient changes in a long-term rice-wheat rotation in India. Soil Sci. Soc. Am. J. 66, 162–170. doi: 10.2136/sssaj2002.0162
Bond, M., Meacham, T., Bhunnoo, R., and Benton, T. G. (2013). Food Waste Within Global Food Systems. Global Food Security Programme. 1–43.
Bouis, H. E. (2003). Micronutrient fortification of plants through plant breeding: can it improve nutrition in man at low cost?. Proc. Nutr. Soc. 62, 403–411. doi: 10.1079/PNS2003262
Chakraborty, S., and Newton, A. C. (2011). Climate change, plant diseases and food security: an overview. Plant Pathol. 60, 2–14. doi: 10.1111/j.1365-3059.2010.02411.x
Dror, D. K., and Allen, L. H. (2011). The importance of milk and other animal-source foods for children in low-income countries. Food Nutr. Bull. 32, 227–243. doi: 10.1177/156482651103200307
FAO (2001). Food Balance Sheets Handbook, FAOstats. Rome. Available online at: http://faostat3.fao.org/download/FB/*/E (Accessed January 20, 2016).
FAO (2011a) Dietary Protein Quality Evaluation in Human Nutrition, Food and Agriculrure Organization of the United Nations. Available online at: http://www.fao.org/ag/humannutrition/35978-02317b979a686a57aa4593304ffc17f06.pdf.
FAO, (2014). Refinements to the FAO Methodology for Estimating the Prevalence of Undernourishment Indicator, Working Paper Series, FAO Statistics Division. Rome.
FAO, (2016). FAO/INFOODS Food Composition Databases, International Network of Food Data Systems (INFOODS). Available online at: http://www.fao.org/infoods/infoods/tables-and-databases/faoinfoods-databases/en/ (Accessed November 28, 2016).
Fischer, T., Byerlee, D., and Edmeades, G. (2014). Crop Yields and Global Food Security. Australian Centre for International Agricultural Research. 660.
Gliessman, S. (2016). How can “the year of pulses” contribute to food system sustainability? Agroecol. Sustain. Food Syst. 40, 405–406. doi: 10.1080/21683565.2016.1140696
Klaus von Grebmer, J. B., Nilam, P., and Shazia Amin, Y. Y. (2016). Global Hunger Index: Getting to Zero Hunger. Washington, DC.
Headey, D., Chiu, A., and Kadiyala, S. (2012). ‘Agriculture’s role in the Indian enigma: help or hindrance to the crisis of undernutrition?'. Food Security 4, 87–102. doi: 10.1007/s12571-011-0161-0
Institute of Medicine (2005) Dietary Reference Intakes: Applications in Dietary Assessment. Washington, DC: The National Academies Press.
International Institute for Population Sciences (2016a). Haryana Fact Sheet-NFHS-4 (2015-16). Mumbai.
International Institute for Population Sciences (2016b). India Fact Sheet - NFHS-4 (2015-16). Mumbai: International Institute for Population Sciences. Available online at: http://rchiips.org/NFHS/pdf/NFHS4/India.pdf
IPCC (2014) Climate Change 2014 Synthesis Report Summary Chapter for Policymakers. IPCC Fifth Assessment Report (AR5).
Kadiyala, S., Harris, J., Headey, D., Yosef, S., and Gillespie, S. (2014). Agriculture and nutrition in India: mapping evidence to pathways. Ann. N. Y. Acad. Sci. 1331, 43–56. doi: 10.1111/nyas.12477
Krebs, N. F., Mazariegos, M., Tshefu, A., Bose, C., Sami, N., Chomba, E., et al. (2011). Meat consumption is associated with less stunting among toddlers in four diverse low-income settings. Food Nutr. Bull. 32, 185–191. doi: 10.1177/156482651103200301
Kumar, P., Chatli, M. K., Mehta, N., Singh, P., Malav, O. P., and Verma, A. K. (2017). Meat analogues: health promising sustainable meat substitutes. Crit. Rev. Food Sci. Nutr. 57, 923–932. doi: 10.1080/10408398.2014.939739
Lal, M., Singh, K. K., Rathore, L. S., Srinivasan, G., and Saseendran, S. A. (1998). Vulnerability of rice and wheat yields in NW India to future changes in climate. Agric. For. Meteorol. 89, 101–114. doi: 10.1016/S0168-1923(97)00064-6
Lynch, S. R. (2011). Why nutritional iron deficiency persists as a worldwide problem. J. Nutr. 141 763S−768S. doi: 10.3945/jn.110.130609
Mall, R. K., Singh, R., Gupta, A., Srinivasan, G., and Rathore, L. S. (2006). Impact of climate change on Indian agriculture: a review. Clim. Change 78, 445–478. doi: 10.1007/s10584-005-9042-x
Mark, H. E., Houghton, L. A., Gibson, R. S., Monterrosa, E., and Kraemer, K. (2016). Estimating dietary micronutrient supply and the prevalence of inadequate intakes from national Food Balance Sheets in the South Asia regiona. Asia Pac. J. Clin. Nutr. 25, 368–376. doi: 10.6133/apjcn.2016.25.2.11
Meenakshi, J. V., Johnson, N. L., Manyong, V. M., Groote, H. D., Javelosa, J., Yanggen, D. R., et al. (2010). How cost-effective is biofortification in combating micronutrient malnutrition? An ex ante assessment. World Dev. 38, 64–75. doi: 10.1016/j.worlddev.2009.03.014
Mekonnen, M. M., and Hoekstra, A. Y. (2016). Four billion people facing severe water scarcity. Sci. Adv. 2:e1500323. doi: 10.1126/sciadv.1500323
Miller, D. D., and Welch, R. M. (2013). Food system strategies for preventing micronutrient malnutrition. Food Policy 42, 115-128. doi: 10.1016/j.foodpol.2013.06.008
Mueller, N. D., Gerber, J. S., Johnston, M., Ray, D. K., Ramankutty, N., and Foley, J. A. (2012). ‘Closing yield gaps through nutrient and water management. Nature 490, 254–257. doi: 10.1038/nature11420
Pandurangan, M., and Kim, D. H. (2015). A novel approach for in vitro meat production. Appl. Microbiol. Biotechnol. 99, 5391–5395. doi: 10.1007/s00253-015-6671-5
Porter, S. D., Reay, D. S., Higgins, P., and Bomberg, E. (2016). A half-century of production-phase greenhouse gas emissions from food loss & waste in the global food supply chain. Sci. Total Environ. 571, 721–729. doi: 10.1016/j.scitotenv.2016.07.041
Rah, J. H., Anas, A. M., Chakrabarty, A., Sankar, R., Pandav, C. S., Aguayo, V. M. et al. (2015). Towards universal salt iodisation in India: Achievements, challenges and future actions. Mat. Child Nutr. 11, 483–496. doi: 10.1111/mcn.12044
Rao, B. N. (2010). Nutrient requirement and safe dietary intake for Indians. Bull. Nutr. Foundat. India 31, 1–5. Available online at: http://www.nutritionfoundationofindia.org/pdfs/BulletinArticle/Pages_from_final_Bulletin_January_2010_1.pdf
Ray, D. K., Ramankutty, N., Mueller, N. D., West, P. C., and Foley, J. A. (2012). Recent patterns of crop yield growth and stagnation. Nat. Commun. 3:1293. doi: 10.1038/ncomms2296
Remedios, C., Bhasker, A. G., Dhulla, N., Dhar, S., Lakdawala, M., et al. (2016). Bariatric nutrition guidelines for the indian population. Obes. Surg. 26, 1057–1068. doi: 10.1007/s11695-015-1836-y
Ritchie, H., Reay, D., and Higgins, P. (2018). Sustainable food security in India - domestic production and macronutrient availability. PLoS ONE 13:e0193766. doi: 10.1371/journal.pone.0193766
Rivera, J. A., Hotz, C., Gonzalez-Cossio, T., Neufeld, L., and Garcia-Guerra, A. (2003). Animal source foods to improve micronutrient nutrition and human function in developing countries: the impact of dietary intervention on the cognitive development of kenyan school children. J. Nutr. 133, 3965S−3971S. doi: 10.1093/jn/133.11.4010S
Sachdev, H. P., and Gera, T. (2013). Preventing childhood anemia in India: iron supplementation and beyond. Eur. J. Clin. Nutr. 67, 475–480. doi: 10.1038/ejcn.2012.212
Saltzman, A., Birol, E., Bouis, H. E., Boy, E., Moura, F. F. D., Islam, Y., et al. (2013). Biofortification: progress toward a more nourishing future. Glob. Food Sec. 2, 9–17. doi: 10.1016/j.gfs.2012.12.003
Sharma, V. P., and Thaker, H. (2010). Fertilizer Subsidy in India: Who are the Beneficiaries?. Research and Publications, Indian Institute of Management Ahmedabad, WP. 2–33. Available online at: http://ovidsp.ovid.com/ovidweb.cgi?T=JS&CSC=Y&NEWS=N&PAGE=fulltext&D=caba6&AN=20103132509
Stein, A. J., and Qaim, M. (2007). The human and economic cost of hidden hunger. Food Nutr. Bull. 28, 125–134. doi: 10.1177/156482650702800201
Stoltzfus, R. J. (2011). Iron interventions for women and children in low-income countries. J. Nutr. 141, 756S−762S. doi: 10.3945/jn.110.128793
Swaminathan, S., Vaz, M., and Kurpad, A. V. (2012). Protein intakes in India. Br. J. Nutr. 108, S50–S58. doi: 10.1017/S0007114512002413
The Micronutrient Initiative (2009). Investing in the Future: A United Call to Action on Vitamin and Mineral Deficiencies. Available online at: http://www.unitedcalltoaction.org/documents/Investing_in_the_future.pdf
Tilman, D., and Clark, M. (2014). Global diets link environmental sustainability and human health. Nature 515, 518–522. doi: 10.1038/nature13959
Unicef (2008). Sustainable Elimination of Iodine Deficiency, Progress Since the 1990 World Summit for Children.
United Nations (2015). UN Population Prospects. Available online at: http://esa.un.org/unpd/wpp/ (Accessed February 6, 2016).
USAID OMNI (2005). Micronutrient Fact Sheet, India. Available online at: http://www.cdc.gov/immpact/micronutrients/
USDA, (2016). USDA Food Composition Databases, United States Department of Agriculture Agricultural Research Service. Available online at: https://ndb.nal.usda.gov/ndb/ (Accessed November 28, 2016).
Vanham, D., Mekonnen, M. M., and Hoekstra, A. Y. (2013). The water footprint of the EU for different diets. Ecol. Indic. 32, 1–8. doi: 10.1016/j.ecolind.2013.02.020
Vecchio, M. G., Paramesh, E. C., Paramesh, H., Loganes, C., Ballali, S., Gafare, C. E., et al. (2014). Types of food and nutrient intake in india: a literature review. Indian J. Pediatr. 81, 17–22. doi: 10.1007/s12098-014-1465-9
Vijayaraghavan, K. (2002). Control of micronutrient deficiencies in India: obstacles and strategies. Nutr. Rev. 60, S73–S76. doi: 10.1301/00296640260130786
von Grebmer, K., Saltzman, A., Birol, E., Wiesmann, D., Prasai, N., Yin, S., et al. (2014). 2014 Global Hunger Index: The Challenge of Hidden Hunger. Bonn; Washington, DC; Dublin: IFPRI.
Welch, R. M. (2001). “Micronutrients, agriculture and nutrition; linkages for improved health and well being,” in Perspectives on the Micronutrient Nutrition of Crops, eds K. Singh, S. Mori, and R. M. Welch (Jodhpur: Scientific Publishers), 247–289.
Wessells, K. R., and Brown, K. H. (2012). Estimating the global prevalence of zinc deficiency: results based on zinc availability in national food supplies and the prevalence of stunting. PloS ONE 7:e50568. doi: 10.1371/journal.pone.0050568
Wessells, K. R., Singh, G. M., and Brown, K. H. (2012). Estimating the global prevalence of inadequate zinc intake from national food balance sheets: effects of methodological assumptions. PLoS ONE 7:e50565. doi: 10.1371/journal.pone.0050565
Wheeler, T., and von Braun, J. (2013). Climate change impacts on global food security. Science 341, 508–513. doi: 10.1126/science.1239402
World Health Organization (2005). Vitamin and Mineral Requirements in Human Nutrition: Report of a Joint FAO/WHO Expert Consultation. Geneva.
Keywords: sustainable food systems, malnutrition, hidden hunger, micronutrients, food chains, nutrition
Citation: Ritchie H, Reay DS and Higgins P (2018) Quantifying, Projecting, and Addressing India's Hidden Hunger. Front. Sustain. Food Syst. 2:11. doi: 10.3389/fsufs.2018.00011
Received: 30 January 2018; Accepted: 06 April 2018;
Published: 30 April 2018.
Edited by:
Pietro Paolo Michele Iannetta, James Hutton Institute, United KingdomReviewed by:
Youssef Aboussaleh, Ibn Tofail University, MoroccoManisha Choudhury, National Institution for Transforming India (NITI) Aayog, IPE Global Limited, India
Maria Ewa Rembialkowska, Warsaw University of Life Sciences, Poland
Copyright © 2018 Ritchie, Reay and Higgins. This is an open-access article distributed under the terms of the Creative Commons Attribution License (CC BY). The use, distribution or reproduction in other forums is permitted, provided the original author(s) and the copyright owner are credited and that the original publication in this journal is cited, in accordance with accepted academic practice. No use, distribution or reproduction is permitted which does not comply with these terms.
*Correspondence: Hannah Ritchie, hannah.ritchie@ed.ac.uk