Eco-Feedback for Food Waste Reduction in a Student Residence
 Veranika Lim
 Lyn Bartram
 Mathias Funk
 Matthias Rauterberg
- 1Department of Industrial Design, Eindhoven University of Technology, Eindhoven, Netherlands
- 2School of Interactive Arts and Technology, Simon Fraser University, Burnaby, BC, Canada
Eco-feedback aims at increasing awareness of resource use to encourage conservation. A growing area of concern in sustainable living is food waste, and many new institutional waste receptacles incorporate waste sorting and recycling instructions for waste management. However, little attention has been paid to the design of encouraging awareness of waste in the home, particularly at the point of food waste. We explored the design challenges and effectiveness of novel eco-feedback techniques at the point of food waste through an in-situ study in a university residence. Our E-COmate system captures and visualizes domestic food waste data for more readily comprehensible and accessible information within a home environment embedded in an existing waste bin. Four E-COmate smart bins were introduced, deployed and evaluated for 8 weeks at a student residence in Canada. The aim of the study was to see whether a system like E-COmate could impact food waste patterns and awareness, and if so, to what extent it engages consumers. To explore its impact, a mix of methods was adopted. Waste audits were conducted to explore waste changes. Retrospective interviews were carried out to gain insights in residences' reflections and motivations. We show that E-COmate had a positive impact on participants' awareness of and behavior toward their food waste. Participants who had E-COmate installed in their kitchens showed overall a significant decrease in food waste and in particular a decrease of almost 32% in edible or once edible food waste, and a 69% decrease in generated compost waste during the last 2 weeks compared to the first 2 baseline weeks. Furthermore, while our control group showed an increase of 244% of waste of starches and grains toward the last 2 weeks (i.e., the end of term) compared to the 2 baseline weeks, the intervention group only showed an increase of 4.5% in waste of grains and starches. Eco-feedback further engaged residences in reducing food waste practices starting at the grocery store (e.g., by buying in smaller portions). In sum, eco-feedback as provided by E-COmate had positive impacts on reducing food waste. These findings are a result of increased awareness, the constant presence and immediacy of E-COmate served as a reminder, and their understanding of how much they actually waste as a group. Their awareness was reflected in how they adapted their shopping behavior as one way to reduce waste at home.
Introduction
In developed countries, a large portion of all food waste occurs at the consumer level (Makov et al., 2020). This waste contributes to over- consumption of water, energy and fuels. In response to this, the European Commission has acknowledged its intention to move the EU toward zero waste (Morone et al., 2019; Tat and Simon, 2020). With local zero waste groups and more than 300 European municipalities, Europe is at the forefront of waste management practices and have commended new benchmarks for new recycling targets of 70% by 2030, mandatory separate collection of organics by 2025, and food waste reduction by at least 30% by 2025 (Hoes et al., 2019). In the United States, all companies and institutions that produce more than one ton a week of organic waste have been banned from sending it to landfills since 2014. Canada banned food scraps from disposal as garbage as of January 2015. For example, Vancouver aims at increasing the regional recycling rate to 80% by 2020. Despite policy changes and good intentions, many consumers are still either underestimating or are unaware of the impact of food waste on the environment (Brennan et al., 2020; Schifferstein, 2020).
In our work, we explored the use of eco-feedback embedded in a semi-public environment to raise awareness and understanding on the value of food people waste. Eco-feedback is a strategy in which peoples' activities are automatically sensed and then visualized back to users through computerized means (Froehlich et al., 2010) as a way to promote positive attitudes toward sustainability (Pierce et al., 2008; Soma et al., 2020). Current eco-feedback research mainly focuses on applications for energy, fuel or water use, while little attention has been paid to food waste (van Geffen et al., 2020). The main goal in our work is to understand how to visualize food waste information to foster sustainable behavior at home or semi-public spaces. Specifically, we are interested to know what kind of data we should visualize to raise awareness about the impact of food-related decisions and in turn motivate people to act and prevent food waste. To address this question, we designed and developed E-COmate (Lim et al., 2015), a “smart” bin (Lake et al., 2020). We explored the impact of E-COmate in a 2 months deployment in a student residence on campus of Simon Fraser University (SFU), Vancouver (Canada). SFU introduced the Zero Waste initiative as part of their sustainability strategic plan by placing Zero Waste stations in public spaces, housing and residences. These Zero Waste stations are color-coded bins with matching signage to help divide waste. This made an SFU student residence an ideal context for adapting the Zero Waste stations into “smarter” stations and implementing E-COmate in daily life experiences.
Here we discuss findings and implications from our deployment gathered through visual inspections, a questionnaire, and semi-structured interviews. Within the context of food waste and sustainability our work presented in this paper is expected to serve as a basis for gaining further insights in eco-feedback and for understanding requirements toward effective eco-feedback design (Gaskell et al., 2000).
Related Work
The most common approach in reducing food waste at home aims at raising awareness in schools or public campaigns (Thonissen, 2010). Various organizations inform consumers about topics such as food purchasing, storage, preparation, or actual shelf life. In a recent study, Soma et al. (2020) found evidence about the potential for gamification as an effective education based change strategy. In their study, they compared three food waste interventions, which included a passive approach (handouts), a community engagement approach, and a gamification approach. Waste audits found marginally significant differences between the game group and the control and no difference between the other campaign groups and the control group in edible food wasted.
Although raising awareness at schools and in public campaigns are highly important (Muriana, 2017), the information is delivered within a context that is not directly relevant for the targeted food practices at hand later on (Jayaprakash and Jagadeesan, 2019). Consumers may gain knowledge and have good intentions, but this may not be reflected in their everyday behaviors as habits are likely to interfere (De Vries et al., 2011). One way to successfully support sustainable actions, is also to engage consumers in their direct environments relevant for the targeted food practices (Jayaprakash and Jagadeesan, 2019). This requires an approach at a local scale and targeting daily practices.
Persuasive Technology
Researchers in the field of Persuasive Technology and Human Computer Interaction (HCI) have taken influence strategies to raise awareness closer to homes. Persuasive sustainability was first introduced by Fogg (1998), who suggested to use computers as persuasive technologies to support environmental sustainability. His definition of persuasion is “an attempt to shape, reinforce, or change behaviors, feelings, or thoughts about an issue, object, or action” (p. 225). One common influence strategy in persuasive sustainability to increase awareness of resource use and to encourage conservation is eco-feedback (Fogg, 2003; Froehlich et al., 2010). It is based on the hypothesis that most people lack understanding or awareness about how their everyday behaviors affects consumption patterns and their environment. To help raise awareness, eco-feedback uses feedback, a process in which the output of an action is “returned” (fed-back) to modify the next action (Holmes, 2007). The reasoning behind eco-feedback is that people understand and agree to the moral behind the feedback, adopt similar mindsets, and act accordingly once they are more aware of the systematic effects of their everyday actions. Researchers have argued that technologically enhanced feedback is an important agent of change (Midden et al., 2008; Midden and Ham, 2019). Feedback is considered essential for regulatory mechanisms and inherent to all interactions, whether human-to-human, human-to-machine, or machine-to-machine. Eco-feedback aims at increasing awareness by automatically sensing peoples' activities and feeding related information directly back through computerized means (Froehlich et al., 2010), particularly to foster positive attitudes toward sustainability and hence the adoption of sustainable behaviors (Pierce et al., 2008; Hermsen et al., 2016). It replaces hidden environmental information and behavior patterns with more accessible and understandable information without requiring much effort from users (Holmes, 2007). The work of Mozo-Reyes et al. (2016) has shown that eco-feedback technology resulted in significant increases in recycling activity and therefore can be an important tool in the promotion of recycling activity in daily life. Hermsen et al. (2016) concluded that “further research into the effectiveness of feedback interventions to disrupt habits, personal differences in feedback efficacy, and the effect of applying different feedback characteristics, might not only enhance our knowledge on how habits might be changed” (p. 71).
To date, food waste has received little attention in persuasive sustainability or eco-feedback research, whereas energy and water consumption are the most dominant topic (van Geffen et al., 2020); among other reasons most likely because of the ease with which the usage of these resources can be sensed automatically through the given infrastructure at homes. Other common targeted issues are printing paper, gasoline, making green transportation choices, improving indoor air quality, reducing CO2 emissions, or are not tied to any one specific topic (Froehlich et al., 2010; Brynjarsdottir et al., 2012; van Geffen et al., 2020). To sense food waste behaviors, on the other hand, is far more challenging because of the habitual and mainly unaware nature of food-related practices. Hence, we think it is worth exploring considering the higher cost of food in comparison to electricity or water consumption. Reducing food waste may result in a significant and noticeable difference in costs and other resources. Even though, most persuasive sustainability research focus on other topics, developments applied to food waste behavior are getting increasingly important (Soma et al., 2020). The latest developments in domestic environments can be categorized in: (1) sensor based systems (RFID tagging or camera tracking), which are used to create visibility of available foods as way for prevention, and (2) mobile applications to create visibility of wasteful behaviors for the purpose of retrospection.
Creating Visibility of Food Availability to Prevent Food Waste
In the field of smart home environments, food sensing technology is expected to have great impacts on food waste prevention (Olivier et al., 2009). Smart refrigerators can record expiration dates using bar code readers and Radio Frequency Identification (RFID) technology (Rouillard, 2012), so that food that is sensitive to spoiling can be closely monitored. This refrigerator may then alert when the food reaches a point where it must get used. RFID is a technology that connects the objects over-the-air so that the objects can be tracked and the data about them can be shared by individuals and organizations. Future research on smart refrigerators aims at an optimization of food identification with image and speech recognition techniques to improve the interaction process as well as to provide recipes based on monitored ingredients (Rouillard, 2012; Xie et al., 2013). These pervasive sensor-based approaches, including interactive fridges (Bucci et al., 2010), and fully equipped smart kitchens (Olivier et al., 2009) open up new possibilities to support food practices and reduce waste. RFID has also been used to track the food in the supply chain to guarantee the quality of products more effectively (Realini and Marcos, 2014; Ben-Daya et al., 2019). This food quality identification is expected to reduce food waste in the cold supply. Another form of pervasive computing uses mobile technologies. Smart phones and cameras have been attached to a fridge to improve the visibility of in-home food availability (Ganglbauer et al., 2013). Furthermore, Farr-Wharton et al. (2014) introduced a mobile application that can track the ingredients inside a color-coded refrigerator with the help of pictures and food identification. Their main goal was to alert users before the expiration date to achieve a reduction in food waste.
Creating Visibility of Wasteful Behaviors for Awareness
Mobile technology has also been used to create visibility and awareness of wasteful behaviors. Ganglbauer et al. (2012) presented a mobile food waste diary allowing consumers to add reasons and reflect on how much food they waste. The diary addresses visibility in different phases of food practices for self-reflection and was found to stimulate deeper insights about the relationships between food waste, experiences, habits, knowledge, occurrences and intentions to change (Ganglbauer et al., 2013). Reasons of food waste were made available to other users in order to encourage sharing and mutual reflection. Another example encouraging self-reflection is BinCam, a system that replaces an existing kitchen bin aimed at motivating reflection and behavioral change in food waste as well as recycling habits of young adults (Thieme et al., 2012). The BinCam is a camera attached on the underside of the bin lid to automatically capture digital images. These images are then uploaded to an application on Facebook where they can be explored by all users of the system. The Grumpy Bin (Altarriba et al., 2017) empowers users and their social acquaintances to collectively judge their actions, also using social mediation to increase the chance for behavior change. All these examples enabled users to form connections with relevant others while leveraging on an individual's self-interest to be socially accepted. Social networks were used to motivate sustainable behavior (Burke and Napawan, 2020).
Collective Design
A current trend in food waste research focuses on collective design (Kim et al., 2020). According to Hebrok and Boks (2017), not only our values, but also our lifestyle and the required conveniences we need in order to manage everyday life influences our awareness and attitudes. They define lifestyle by how our household is formed and everyday practices that influence important food waste-related decisions. A home contains material, structural, and social aspects that shape and restrain the interaction with food, for instance storage, packaging, the fridge. In order to reduce food waste levels, cultural and social norms as well as material and structural conditions need to be addressed simultaneously (Aktas et al., 2018). Also Burke and Napawan (2020) suggests that a more fluid approach is needed, one in which the interdependence of domestic practices, urban infrastructure and natural systems is recognized. Any shortage due to today's lifestyle, including time limitation, scheduling, family, friend and leisure time, appears as a significant constraint to food waste practices that could help to reduce it (van Geffen et al., 2020). While emphasizing the strategies that can be adopted by individuals to prevent food waste in their households, one must acknowledge that the individual is embedded in wider social, economic, and cultural structures that may prevent the adoption of less wasteful practices more effectively (Schanes et al., 2018; Harvey et al., 2020).
Our main research question is, how can eco-feedback reduce food waste in daily practice? In the following, we describe the prototype used in our deployment, our study method, related findings, and conclusions.
Approach
First, we describe briefly the development of our E-COmate device and then the empirical study to investigate the effects of our direct and action related eco-feedback.
E-COmate Prototype
Design Rationale
We developed E-COmate (Lim et al., 2015), an augmented bin that captures and visualizes domestic food waste data for more readily comprehensible and accessible information that can be used within a home or semi-public environment. It shows within a glance consumer their food waste amounts within their own kitchen environment, with the intention to elicit self-reflection on what it means to daily waste food without much cognitive effort. E-COmate is designed to impact consumers in their immediate environments relevant for the food practices at hand, to regularly remind them, and to support actions toward their goal of reducing food waste. In an evaluation of a previous version of E-COmate (Lim et al., 2017), findings showed that there is a potential of applying eco-feedback of non-consumed food items for raising awareness and triggering self-reflection, specifically on how individuals plan, prepare food and deal with leftovers. Based on learnings from this pilot, we made improvements to our E-COmate to make it robust and therefore more suitable for a longer deployment avoiding too many manual interventions or data inputs (i.e., the type of food being disposed), and feeding back information based on real time weights. In this work, an advanced version of E-COmate was deployed for a 2-month evaluation period.
Servings as a Metaphor for Wasted Food
As part of E-COmate we designed and developed a simple visualization showing the daily average and the total number of potential servings wasted in the past 24 h (see Figure 1). The interface included a thumbs-up and a thumbs-down button to allow for user interactions. At the bottom of the screen, we added a note with the definition of a serving (i.e., one serving for each 200 g). Researchers have shown that metaphorical units lead to a better understanding of consumption amounts than volumetric units were used. For example, Froehlich et al. (2012) used everyday objects as metaphors such as the number of jugs and oil trucks for water usage instead of the number of gallons or liters. And in a study, carbon weight was introduced as an indication of environmental health visualized on a bathroom scale (Kuo and Horn, 2014). To indicate food waste we could use metaphors such as the number of landfills or calories used for the production of the food that is wasted, the number of people that could have been fed, or how many earths we need if everyone would continue current wasteful behaviors. In this study, the number of servings was selected as a metaphor because we speculate that people are generally more common with a “serving” (Lim et al., 2015) which could indicate the loss of a free meal. Financial incentives have short-term effects but can be counterproductive in studies on energy use (Delmas et al., 2013); whether this applies to food waste remains unclear. Financial benefits from saving energy are often quite small compared to household expenses such as food (Wolak, 2011).
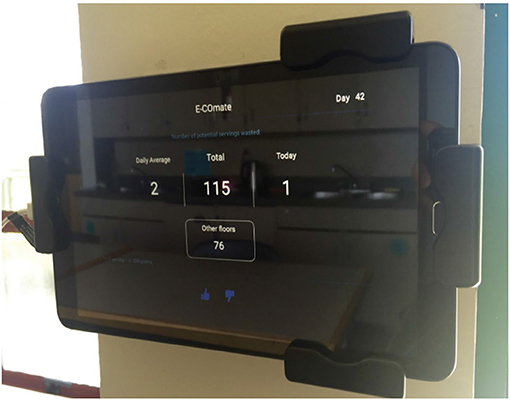
Figure 1. E-COmate feedback display—a tablet computer mounted with an anti-theft protection to a wall nearby a Zero Waste station in a kitchen.
Technical System Features
Our prototype consists of an off-the-shelf Dymo M5 USB postal scale that measures the weight periodically and transmits its measurements (only when there is a change in the weight) via a USB connection to a Raspberry Pi (see Figure 2). The Raspberry Pi includes a Wi-Fi module which handles the collection and saving of data into a server, as well as the communication with the scale. To ensure weight changes are recorded, raw sensor data is recorded periodically and stored automatically with a timestamp in a local memory as well as on a server. System processes were visible and traceable with led lamps which indicated when the program had started (red), when the scale was connected to the Raspberry Pi (orange), and when the Raspberry Pi measured a stable weight and uploaded it to a server (green). The data in the server was used for remote monitoring to make sure it was running but most importantly the data was used to feed back to the user to create realistic eco-feedback information based on actual food waste. This setup was expected to help identify system failures and trigger quick reboots of the prototype during deployments. The data was visualized on an Android application programmed in Java.
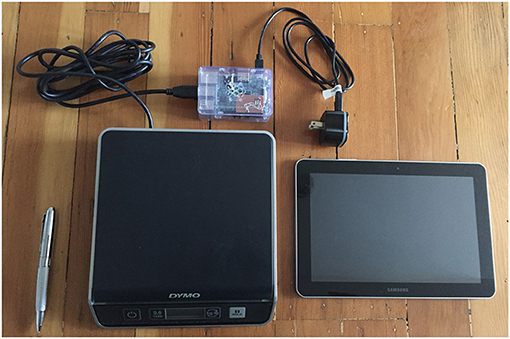
Figure 2. Parts of the E-COmate prototype: a DYMO scale [left below], SAMSUNG tablet [right below], and a Raspberry Pi [above].
Interface Design Features
We used a 10-inch tablet to run the application and placed it such that it is visible at-a-glance in the kitchen (see Figure 1). The prototype was protected with a casing to prevent food dirt as well as displacements of the parts. For the interface, we used servings as a metaphor for wasted food and social comparison information.
Considerations
We made sure our prototype was (1) compact, (2) has Wi-Fi connection, (3) provides visibility for system failures, and (4) has a display visualization showing the potential amounts of servings wasted and comparison information that is updated in real-time automatically. E-COmate, however, has some technological limitations. For example, data collection depends on whether the prototype is connected to Wi-Fi. When the Wi-Fi is temporarily off for some reason, data cannot be collected. Another issue is that the scale cannot reset to zero automatically when the bin is getting emptied. This has to be done manually for higher accuracy. To deal with these two issues we instructed janitors to reset the system and we recruited a student resident to help reset whenever necessary. On the days of the visual inspections (i.e., further explained in the next sections), one researcher made sure all E-COmates were reset.
Study Method
To replace individual concerns by a more collective concern of a larger group as a whole, suggested by Tromp and Hekkert (2018), the deployment and evaluation of our E-COmate took place at the MCTaggart-Cowan Hall student residence at SFU. The building has six living rooms and nine kitchens divided over three floors (see Figure 3) and was recently introduced with three-stream Zero Waste stations with signage for organics (green), mixed recyclables (blue), and landfill garbage (black; see Figure 4). The aim of our evaluation was to explore how eco-feedback could impact food waste and awareness, to what extent it engages residents in reducing food waste, and to explore how it should be designed further to effectively motivate sustainable behaviors. For this deployment, we adopted a mix of quantitative and qualitative methods (Corrado et al., 2019).
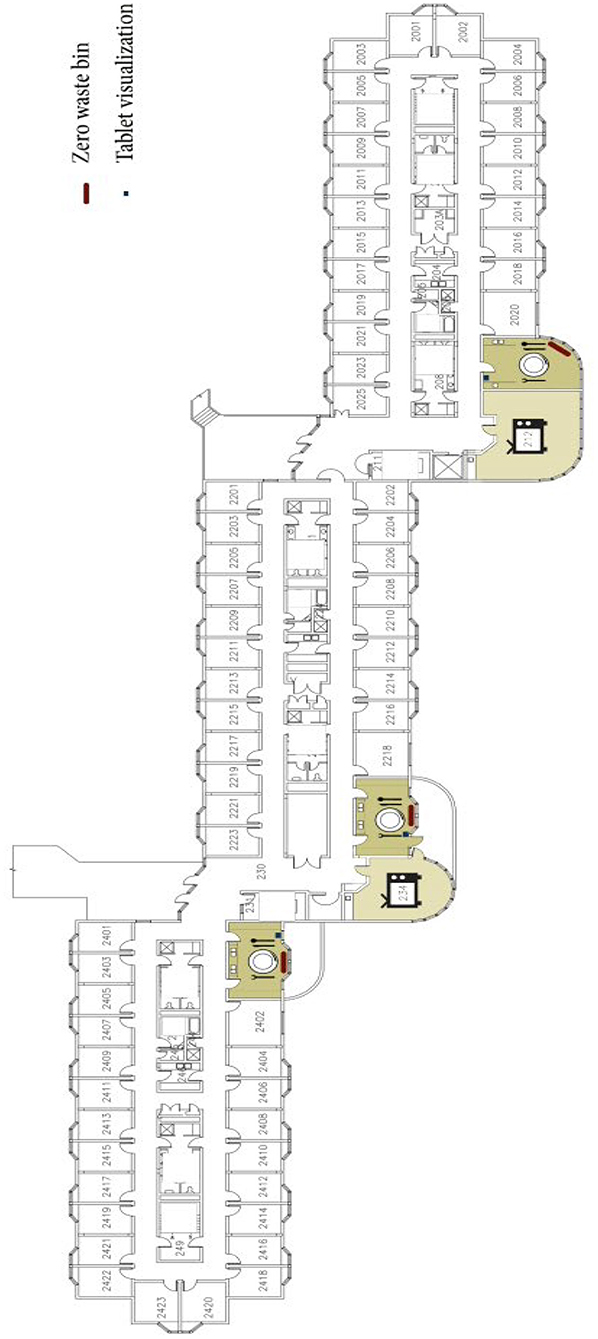
Figure 3. A floor plan of the second level of McTaggart-Cowan Hall of the Simon Fraser University.
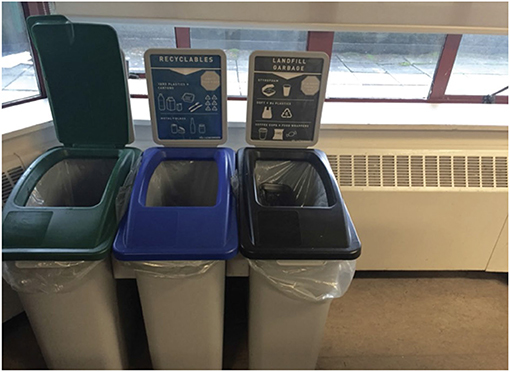
Figure 4. A three-stream Zero Waste station for organic waste [green [left]], mixed recyclables [blue [middle]], and landfill garbage [black [right]] that is introduced to the Simon Fraser University housing and residences, among which our investigation side the McTaggart-Cowan Hall is.
Study Design
The evaluation took place for a period of 8 weeks (i.e., end-February to end-April in 2016) plus 2 weeks of baseline measures before installing E-COmate (i.e., during the baseline from mid-February to end-February, we only performed visual inspections). For the purpose of the evaluation we divided the nine kitchens into two groups: a control group (i.e., without E-COmate installed) and an intervention group (i.e., with E-COmate installed). E-COmate was installed and embedded in the green compartment of the three-stream Zero Waste station in four kitchens (i.e., three on the 2,000 level and one on the 3,000 level) as shown in Figure 5. The remaining five kitchens served as the control group. During the deployment, all captured data with E-COmate was visualized on a tablet computer that was protected with an anti-theft lock and mounted to a wall near the Zero Waste station as shown in Figure 1. We recruited a student resident to help reset whenever necessary.
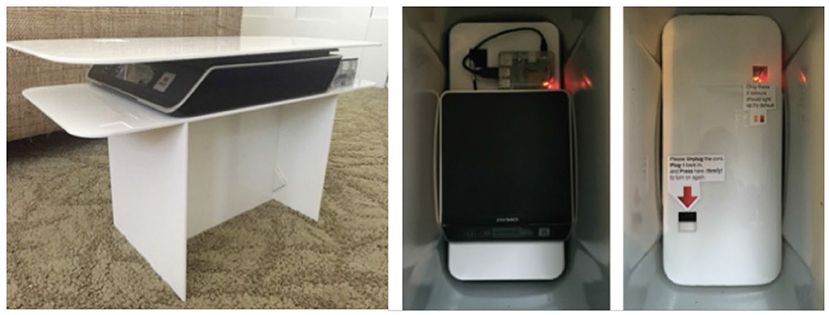
Figure 5. From left to right: The first image shows how the Demo scale is resting on top of a standard and covered with a plate (i.e., this whole unit is placed inside the green compartment). The second image shows a top view of the scale and a Raspberry Pi inside the green compartment without the plate cover. The third image shows a top view with the plate cover and the scale underneath it. The plate cover allows for rebooting the scale and visibility of system status.
Social Comparison Between User Groups
Social comparison information (i.e., “other floors” see Figure 1) was shown only in the last 4 weeks of our 10-week observation study. Social comparison information was simulated and generated by taking a random percentage between 40 and 110 percent from the actual weight. This would mean that the display would show lower food waste amounts for other floors most of the time (i.e., negative feedback). This was done to control for the ratio of the nature of feedback (i.e., negative vs. positive feedback) to all groups. By showing users how much other floors are disposing of was expected to trigger a friendly competition and engage users in social interactions within the same floors, e.g., discussions, food sharing. We often compare ourselves to others to find out how we are doing when objective measures for self-evaluation are unavailable (Festinger, 1954). This allows us to see what the norm is in our group and to receive social approval for our behaviors. These principles on norm activation and social approval were found to be successful in influencing consumers when facilitated through technology and to support sustainable practices (Midden and Ham, 2019). Previous studies have shown that consumers are more motivated to save energy when they are able to compare with others (Odom et al., 2008). Social comparison information has proven to be successful in eco-feedback research (Abrahamse and Steg, 2013).
Data Collection and Analysis
To evaluate the impact of E-COmate, we adopted a mix of quantitative and qualitative methods. We conducted an online questionnaire, visual inspections, and semi-structured interviews at the end of the deployment including a review of display design dimensions. Data was analyzed using descriptive and inferential statistics with IBM SPSS Statistics version 25.
Online Questionnaire
For the questionnaire, we approached residences personally at the entrances and in the shared spaces of the McTaggart-Cowan Hall for their participation. We used the questionnaire to explore food-related behaviors and perceptions among the intervention and control groups. Residents were given a link to the questionnaire which they could open in their own browser at a convenient time. This link was also posted online in the resident floors' Facebook pages. The questionnaire took ~5 min to fill out and included demographic questions such as gender and age, general questions on food-related behaviors (i.e., how frequent they buy groceries and cook, whether they tend to overbuy food that gets wasted, whether food expiration date is a common reason for throwing away food, and whether forgetting leftovers is a common reason for throwing away food), questions to explore their perceptions of wasted amounts (i.e., their perception of food waste amounts in comparison to other people), their level of interest in saving food from being wasted, and whether they were interested in adopting technologies in their house to raise awareness on food waste practices. The questionnaire contained ten items including sentence completion using five-point Likert scales (see Table 1). At the end of the survey, we asked their floor number to see if they were either in the control or in the intervention group.
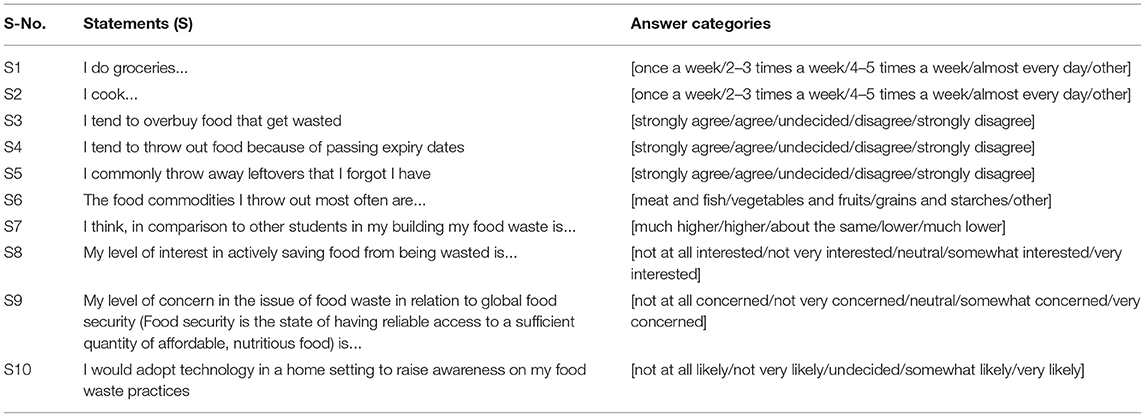
Table 1. Online questionnaire with 10 items (S1–S10) provided to all residents in this study.
Visual Inspections
Visual inspections are a more reliable and objective method to measure wasted foods than any other method such as a survey or a diary study. For instance, they do not depend on the limitations of memory recall, and do not have to rely on Wi-Fi availability or system inaccuracies. We conducted visual inspections two times a week for a total of 10 weeks in all kitchens but only for the organic waste compartment. We grouped all inspection data points in week periods [e.g., inspections nr. 1–4 in weeks w1–2 = week period 1 (baseline); etc.]. The data collected during the visual inspection represents items coming only from residences who were using the kitchen. As SFU offers meal plans, a selection of residences may never be using the kitchen for cooking. During the period of the study, 74 out of 200 residences had a meal plan. Hence, there should be a total of 126 residences using one of the nine investigated kitchens; which is an average of 14 residences per kitchen. Unfortunately, we cannot specify the exact number of residences per kitchen per week that would have contributed to the waste analyzed during the visual inspections. Therefore, the provided number of users of E-COmate per kitchen per week is only a reasonable estimation.
We conducted visual inspections of all organic waste of each Zero Waste station twice a week on Tuesday and Thursday mornings for 10 weeks, with a total of 20 inspections for each kitchen (i.e., which is in total 180 inspections). During these inspections, we documented the type and weight of the disposed items. We broke these items down into six categories; (1) edible or once edible vegetables and fruits, (2) meat and fish, (3) grains and starches, (4) in-edibles such as peels, tea bags, bones, and egg shells, compost or (5) non-food organics such as paper towels, and (6) contamination such as plastics or glass. Peels we commonly eat such as from the potato were considered edible, whereas peels from citrus or avocado were considered not edible. The content collected from each kitchen was laid out on a plastic sheet and captured with a camera (see Figure 6).
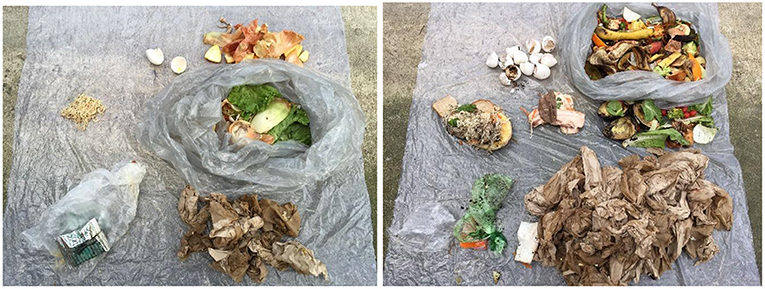
Figure 6. Two examples of amounts of all six waste types based on visual inspections. Waste types are: (1) edible or once edible vegetables and fruits, (2) meat and fish, (3) grains and starches, (4) in-edibles such as peels, tea bags, bones, and egg shells, (5) compost or non-food organics such as paper towels, and (6) contamination with glass and plastics. The original waste bag is included in the picture.
Interviews
In the last weeks of the study, residences from the intervention group were personally approached in the kitchens and asked for their participation in a retrospective semi-structured interview. A total of nine residents participated who reported to have viewed the E-COmate display every time they were in the kitchen or at least three times a week. Interview questions aimed at exploring the impact of E-COmate. We asked participants what they liked about E-COmate, their main issues with it, how it impacted their thoughts about food waste, and if there were any changes E-COmate could have had an impact on (i.e., food practices such as the way they plan around food, do groceries, prepare food, and deal with leftovers, individually as well as collectively). Interviews took around 20 min and were recorded for transcription purposes. All interviews were transcribed, and codes were generated within the overarching themes of research aims (i.e., how E-COmate support in raising awareness, how it impacts attitude, and how it encourages active engagements), but further not defined a priori.
To assure inter-rater reliability, two coders assign codes to transcriptions independently. In case of disagreement, items were discussed for inclusion or exclusion. To measure inter-rater reliability, Fleiss' kappa was applied, which is a statistical measure for assessing the reliability of agreement of a fixed number of raters when assigning categorical ratings to several items. In other words, Fleiss' kappa measures the level of agreement that a certain item or subject belongs to a certain category (Fleiss, 1971). In our findings, only those categories are included and discussed for which raters came into substantial agreement (i.e., kappa is above 0.60). Participants are referred to with unique pseudonyms as individual names preserving gender.
Findings
Our aim for our evaluation was to explore how eco-feedback could impact food waste and awareness, to what extent it engages residences in reducing food waste, and to explore how it should be designed further to effectively motivate sustainable behaviors. In this section, we firstly show questionnaire results clarifying that there are no major differences between the intervention and control group. We further triangulated the food waste data gathered through the visual inspections (see the raw data in Supplementary Material) and the interviews to gain a deeper understanding in answering the questions above. For the interview findings, only items and categories are included for which raters came into substantial agreement (i.e., kappa is between 0.61 and 0.80).
Descriptive Statistics for Questionnaire Data
Based on a convenience sample of 45 questionnaire respondents, we found no significant differences between the control and the intervention group. Hence, we will describe only the average descriptive statistics of all 45 participating residences without distinguishing the control group from the intervention group (different from what is shown in Figure 7). Generally, the average age of residents was 21 years (SD = 1.6 years), of which 26 were female (58%). Over 70% reported doing groceries more than once a week and cooking more than two or three times a week. Around 42% agreed or strongly agreed on tending to overbuy food that eventually got wasted. Around 50% agreed or strongly agreed on commonly throwing out food because of passing expiry dates. And around 28% agreed or strongly agreed on commonly throwing away forgotten leftovers (see Figure 7). Respondents reported wasting vegetables and fruits most often, which was over 60% of the total waste. Overall, 58% thought their waste is lower or much lower in comparison to other people. Over 60% of the respondents were somewhat or very concerned in the issue of food waste in relation to global food security, and over 70% was somewhat or very interested in actively saving food from being wasted. Over 60% would adopt technology in their homes to raise awareness on food waste practices.
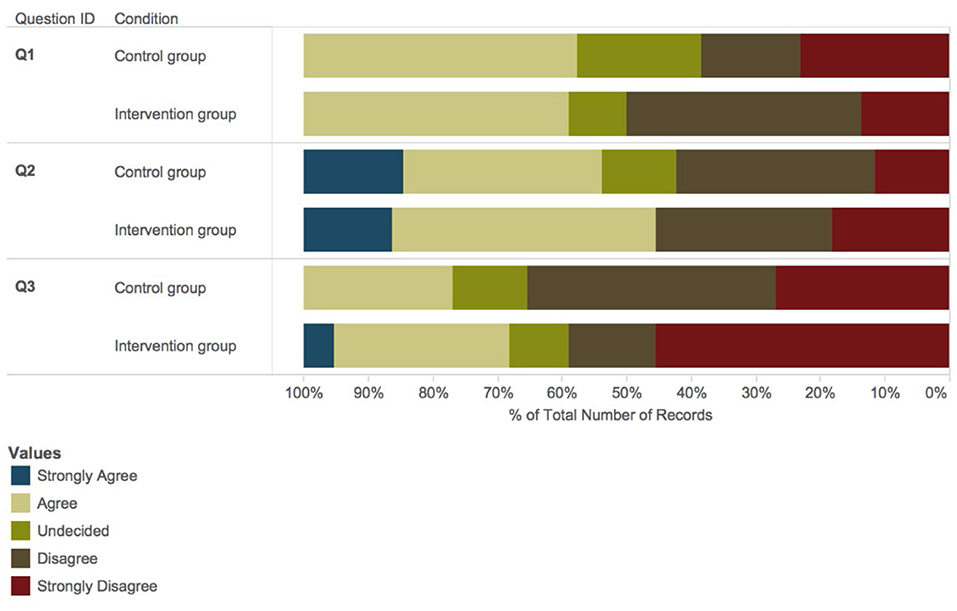
Figure 7. The level of agreement in intervention and control group for food waste behaviors. Q1: “I tend to overbuy food that gets wasted,” Q2: “I tend to throw out food because of passing expiry dates,” and Q3: “I commonly throw away leftovers that I forgot I have.” [Q1 = S3; Q2 = S4; and Q3 = S5, all in Table 1].
Inference Statistics for Inspection Data
We used General Linear Model (GLM) (Dobson and Barnett, 2008) with inspection-nr (i.e., week periods) as within-subject and group (i.e., test conditions) as between-subject factors (i.e., the independent variables). As dependent variables we analyzed (1) edibles or once edibles, (2) meat and fish, (3) grains and starches, (4) contamination with glass and plastic (5) other-compost, and (6) in-edibles (all measured in gram). We tested the two main effects and the one two-way interaction effect (see Table 2 and Figure 8). We also calculated post-hoc tests between different levels of inspection-nr.
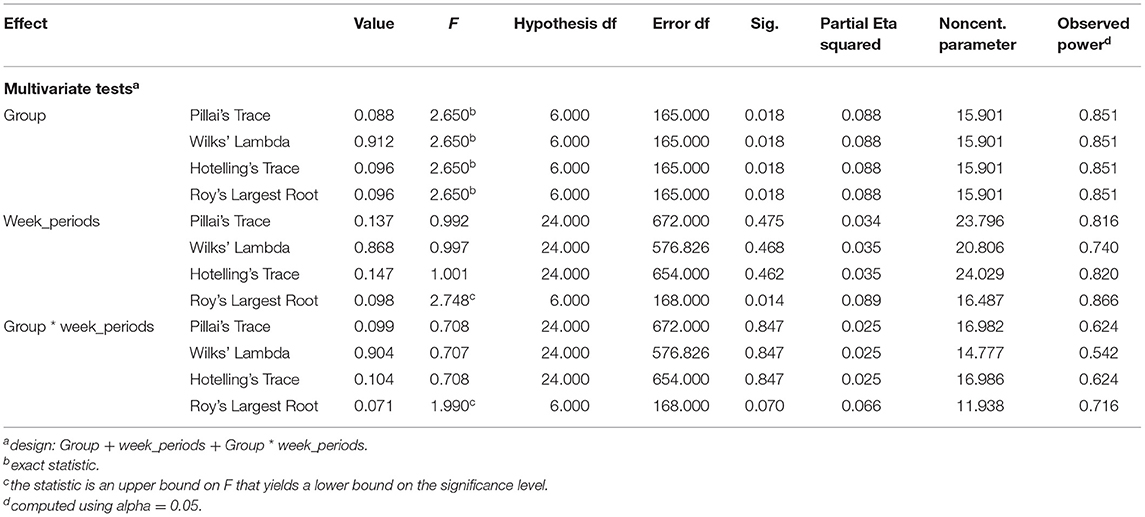
Table 2. Results of the GLM multivariate analysis of variances with the six dependent variables to present main and interaction effects for each dependent variable separately.
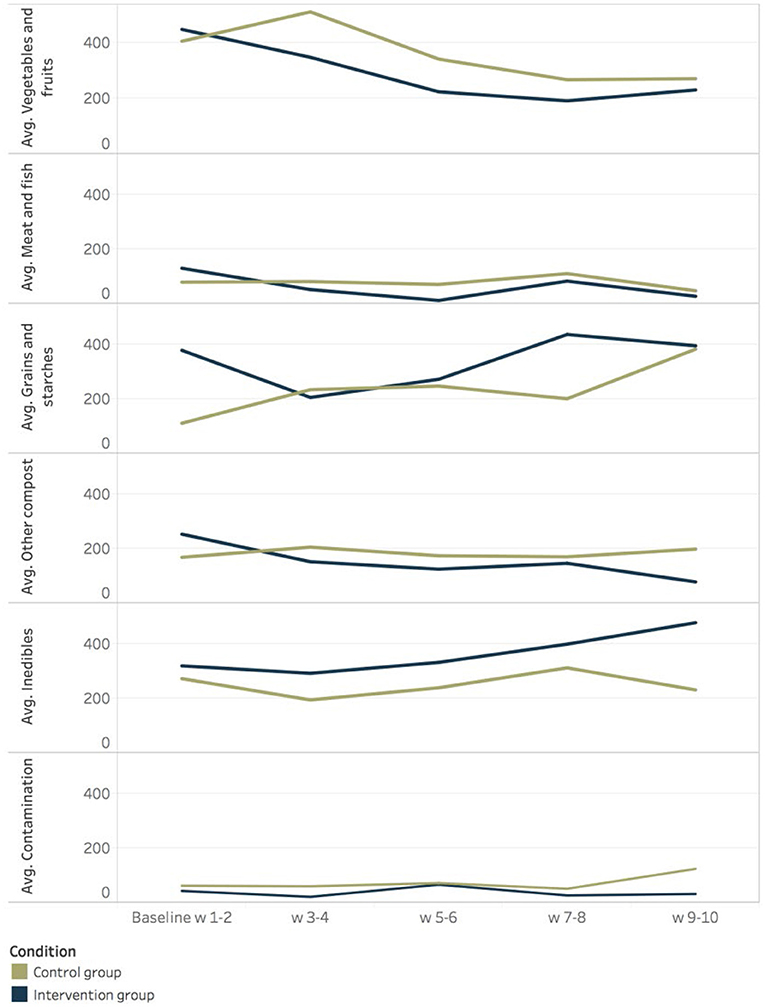
Figure 8. Average amounts (in grams) of all six waste types generated by the control vs. intervention group presented per 2 weeks. Waste types are (from top to bottom): (1) edible or once edible vegetables and fruits, (2) meat and fish, (3) grains and starches, (4) in-edibles such as peels, tea bags, bones, and egg shells, (5) other compost or non-food organics such as paper towels, and (6) contamination with glass or plastics. w, weeks.
To assess whether our intervention or control group (factor test condition) with higher and lower food waste have different measures and whether there was an interaction between test condition and repeated measurements (factor week periods), a multivariate analysis of variance was conducted (GLM). The assumptions of independence of observations and homogeneity of variance/covariance were checked and met. The main effect for group was statistically significant, Wilks' Λ = 0.912, F(24, 165) = 2.65, p < 0.05, multivariate η2 = 0.088. This indicates that the linear composite of all six waste measures was for the intervention group lower than for the control group. The main effect for week periods is not statistically significant, Wilks' Λ = 0.868, F(24, 577) = 1.00, p = 0.468, multivariate η2 = 0.04. This indicates that the linear composite does not differ for different levels of week periods. The two-way interaction effect was also not statistically significant, Wilks' Λ = 0.904, F(24, 577) = 0.71, p = 0.847, multivariate η2 = 0.025. Follow-up the statistics in Table 3 and the descriptive data in Table 4 indicate that our intervention group scored significantly lower for contamination such as glass and plastic and significantly higher for in-edibles (see Figure 9).
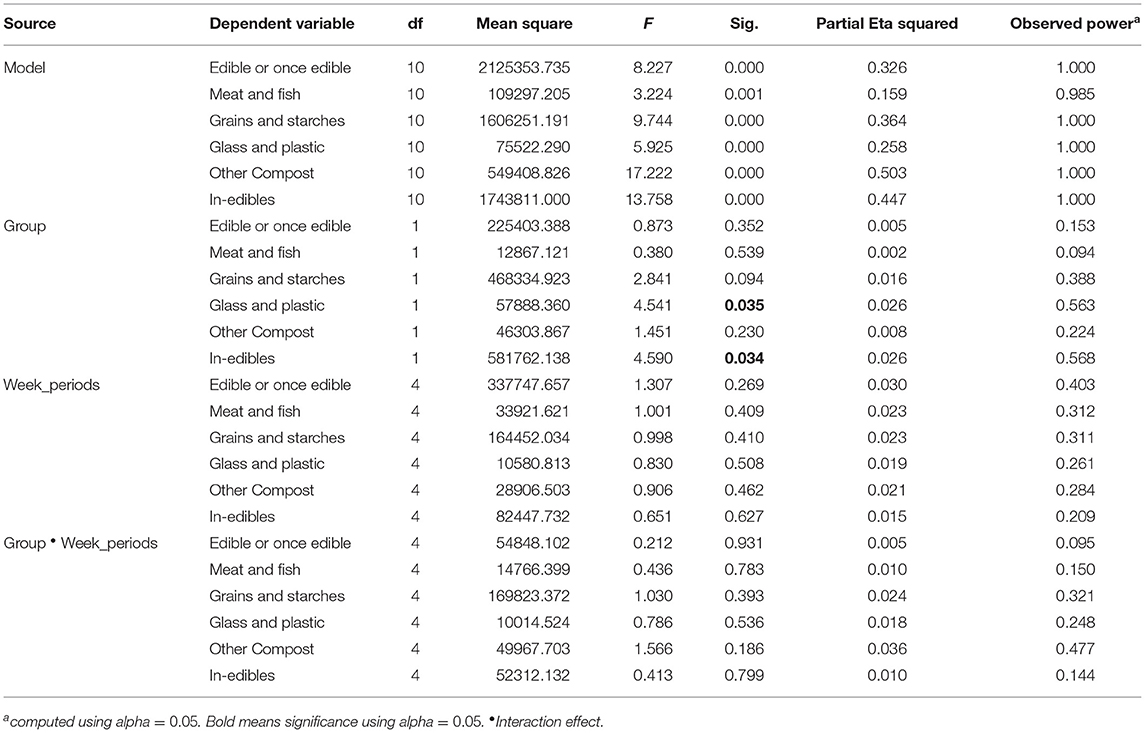
Table 3. Results of the GLM multivariate analysis of variances with the six dependent variables to present main and interaction effects for each dependent variable separately.
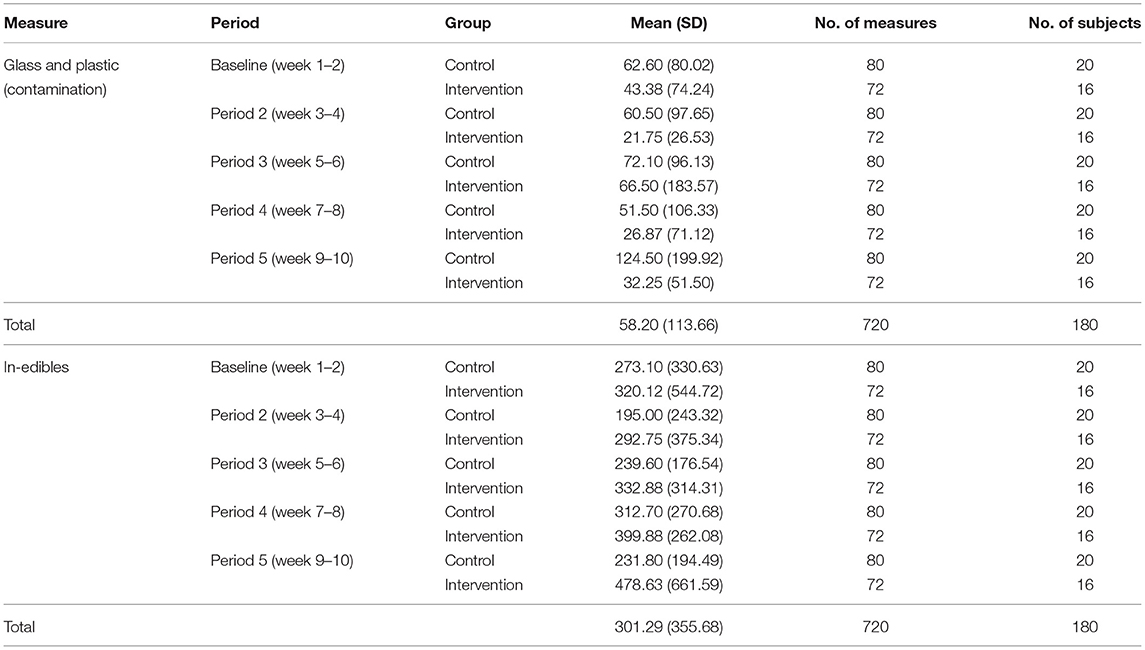
Table 4. Means (in grams), standard deviation (SD), and number of test subjects (N) for all five 2-week periods of the waste measures contamination with glass and plastic and in-edibles where the main effect Group is significant (period 1 = baseline).
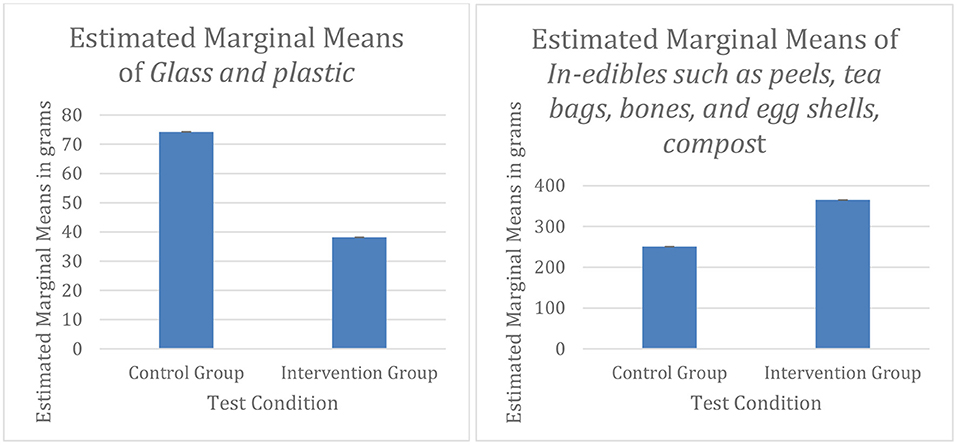
Figure 9. Average amounts (in grams) of both significant waste types generated by the control vs. intervention group for the variables contamination with glass and plastics (left) and in-edibles (right).
In a post-hoc analysis our visual inspections showed a significant decrease in the intervention group between the baseline measure [w1–2] (M = 254 g, SD = 346 g) and the last 2 weeks of the study [w9–10] (M = 79 g, SD = 121 g) for the amount of other compost, t(15) = 2.66, p ≤ 0.018 (Ruxton, 2006) (see Figure 8). That is a 69% decrease in generated other compost waste. Whereas, no significant changes for other compost were found in the control group between the baseline measure (M = 169 g, SD = 155 g) and the last 2 weeks of the study (M = 199 g, SD = 231 g), t(19) = −0.46, p ≤ 0.652.
Although participants in the intervention group did not provide examples of intentions in preventing the waste of grains and starches (which is in accordance to the waste inspection), the control group showed an increase in wasted grains and starches by the end of the study. We found a significant increase in the control group between the baseline measure (M = 111 g, SD = 158 g) and the last 2 weeks of the study (M = 383 g, SD = 318 g), for the amount of wasted grains and starches, t(19) = −3.46, p ≤ 0.003 (see Figure 8). That is an increase of 244% of waste of grains and starches in the control group. Whereas, no significant changes for grains and starches were found in the intervention group between the baseline measure (M = 379 g, SD = 426 g) and the last 2 weeks of the study (M = 396 g, SD = 636 g), t(15) = −0.08, p ≤ 0.939. Hence, the control group generated more waste for grains and starches by the end of the study.
There was a clear pattern distinguishing the control from the intervention group. We found an increase in generated edible waste as a combined measure (edible or once edible such as vegetables and fruits, plus meat and fish, plus grains and starches) in the control group between the baseline measure (M = 199 g, SD = 237 g), week 5 and 6 (M = 220 g, SD = 205 g), and week 9 and 10 (M = 234 g, SD = 172 g). Whereas, in the intervention group there was a decrease from the baseline (M = 320 g, SD = 279 g) to week 5 and 6 (M = 170 g, SD = 177 g) and then an increase to week 9 and 10 (M = 218 g, SD = 235 g). That is still a 32% decrease in edible or once edible food waste in the intervention group (see Figure 10).
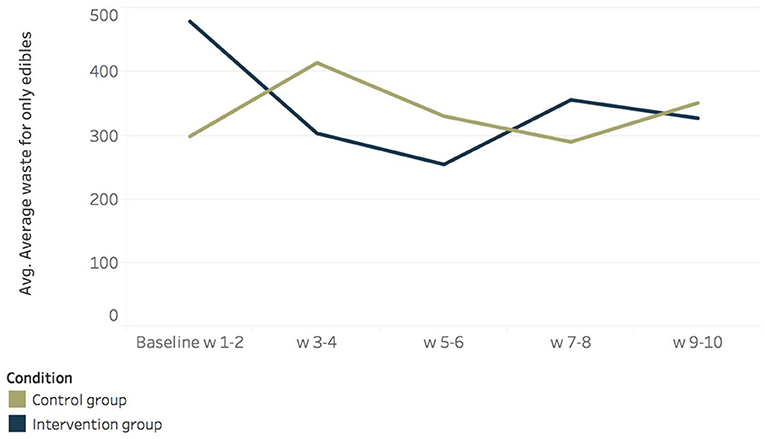
Figure 10. Average amounts for edible waste (in grams) as a combined measure with (1) edible or once edible vegetables and fruits, (2) meat and fish, and (3) grains and starches generated for the control group vs. intervention presented per 2 weeks. w, week.
The amounts of waste per person per week (with the assumption of 14 residential users per kitchen) varies per food type (see Figure 8), although it should be noted that the exact average per person per week is not of main importance here; it is more about the changes in the amounts throughout the evaluation period. No significant differences were found when social comparison information was absent vs. shown.
Qualitative Interview Results
Interview results showed that the constant presence and immediacy of E-COmate served as a trigger and reminder for inhabitants: “Every time I was in there, I sort of glanced at it.”—Eva, and “I can't remember any day I entered the kitchen and I never looked at it. The setup and the place it is in, it's a convenient place that is almost the second or first thing to see when you are in there.”—Isaac.
The way E-COmate was set up helped in raising awareness and triggered instances for reflection mainly at the time of disposal. Participants reported doing final checks to see if they were using the right compartment or if the item really needed to go. Examples of comments related to these moments of reflections were: “I feel a little self-conscious when I throw something away, cause I see. I know its recording when I throw something away it's like Oh. So, it's a little. it's making me double check when I am throwing out anything.”—Eva. Or “I was a little more hesitant about what I put in there. I double checked what I put in there to make sure.”—Farrah. And another comment: “An example from this morning. I usually don't throw away food in general. I have a bunch of grapes and two are like totally rotten and I throw them and today I was thinking, oh interesting because in my head I don't waste food, because i just hate the idea of wasting food but there are two rotten fruits and I am throwing them and that in a way is food waste.”—Geraldine.
Participants further agreed that E-COmate helped in understanding the problem better as it becomes more tangible. Participants reported that they usually do not actively reflect on food waste-related behaviors nor was it something they think about as a relevant issue. With the deployment of E-COmate, food waste became more visible to them and easier to reflect on. This gave them something to improve from and a direction for action: “It gives us a baseline and lets us know what we are doing currently so that we have somewhere to improve from.”—Alysa. And “I didn't think about it before, but this puts a number on it. It gets it more thinkable, a little easier for me to think about it.”—Farrah. And another comment: “I never knew I was wasting anything. So that type of discovery itself is one push to someone doing something about it. So that's a great thing.”—Isaac. Furthermore, E-COmate was found to provide visibility on the collective impact: “It put stuff in perspective. Because it's easier to think: oh, I waste this much food. But now I am seeing how much this one kitchen waste and then you think that adding on to other floors and it starts really adding up.”—Eva.
For those who were already aware about food waste still found E-COmate useful as it confirmed their believes, further helped their understanding in actual food waste amounts, and gave them more motivation to act accordingly: “Just judging from what I would see in the compost bin I thought I already had an expectation on how much food waste there is. It seems that people are throwing quite a bit away, especially when they got pizza or whatever, that would be in the bin. But having the amount on the prototype helps for my understanding of how much is actually being thrown away that day.”—Hannah. “I never think I just had a glimpse. Before the system came, I just look at how the bin is full and I am like.mmm, and think that people are wasting a lot. I am wasting a lot. But with the right information, I am able to actually say: AH! See! This is what we are wasting. Surprised no, but my conviction of change was straight then. It was like, ok yeah. this makes sense and now we have to do something.”—Isaac.
E-COmate further resulted in instances where participants took actual actions in reducing waste. For example, participants reported to have been more considerate about their food purchases at the grocery store: “For example like carrots. I usually don't use the tops. And you could use it for pesto and stuff. I have thought like I don't want to throw out, so I just buy carrots that do not have them you know. Maybe in that way it has influence.”—Geraldine.
Residents have also reported to have bought groceries in smaller amounts: “I actually bought less food this weekend. I was shocked when I looked at the amount. I usually spend at least 60 or something in total for everything I am buying for during the week. I ended up spending 50, I was really shocked. The lady at the checkout was like oh you are spending cheaper now; I was like really?”—Derrick. And another comment: “It impacts the way I buy things. It doesn't hurt to walk often to the market. For example, I eat vegetables, I am vegan. I eat a lot of fresh food. So instead of keeping them in my fridge when it stays there sometimes, I might not like it or go by the time I need to eat them. It made me walk to the store more. I thought it was worth it rather than wasting a lot of food.”—Isaac.
With regard to social engagement, some instances were mentioned but much less than expected. For example, two participants shared more food with each other as they regularly met in the kitchen. Placing E-COmate in a public space gave them a topic to talk about and motivated food sharing: “I see it all the time. Especially if there is someone we always like to check and see how much it is.”—Bo, and “It encourages me to offer or to share food more. I know Farrah and we talked before about food waste and food in general. We have the same mind on that. Sure, it gives us something to talk about.”—Hanna.
As we have seen, E-COmate impacted awareness and encouraged users in translating reflections toward actions, but this was not always the case for all participants. Some participants mentioned the difficulty of trusting in either the accuracy of the prototypes or the eligibility of other users in using the Zero Waste station as it is supposed to. The use of servings and averages, for example, did not entail sufficient information for the users as it left questions open such as what is wasted, when it was wasted, and most importantly who wasted it: “There is a dispersion of responsibility if it comes to big groups. I have no idea what the other people on this floor are doing.”—Farrah.
Some participants were even convinced that paper towels contributed most to the overall weight, which was not the case according to visual inspections (see Figure 8 for “contamination”). This may be the reason why we found a significant decrease in the amount of paper towels by the end of the study and therefore also the amount of compost waste that was generated. “I am still questioning to what level it is accurate. Does it really show how much food waste we are producing?”—Geraldine. Or “It doesn't differentiate what is food and what is not food, like paper towels.”—Bo.
These observed social interactions were expected to impact actions toward reducing food waste through social surveillance or norm activation. In sum, E-COmate triggered instances of reflections at the time of disposal, which resulted in users buying prepared and cut vegetables or buying in smaller amounts. This explains the decreasing amounts of wasted edibles and compost found during the inspections.
Discussion
The goal of our work was to explore how eco-feedback technology could be utilized to reduce food waste at the community level. Eco-feedback is advantageous in raising awareness in two ways. Firstly, information is provided within a setting relevant for the targeted behavior (i.e., opposed to more common strategies like campaigns). Secondly, with current lifestyles where food behaviors are habitual or unconscious, technologies that do not require manual or user-initiated tracking of the waste (e.g., such as diaries) are expected to have more impact. With E-COmate, the intention was to create a more constant perceptual connection (Strengers, 2011) toward the waste and presence of the issue and consumers' choices that have led to food waste so introspection can be made. It could further help remind users during their cooking activities at a daily basis. This every day aspect might be necessary as intentions can disappear quickly amidst other activities. We speculate that the awareness raised among residents in the intervention group may have prevented an increase in the waste of grains and starches at the end of term where exams usually take place.
Design Implications
Based on our findings, we present design implications that could serve as a basis for understanding basic requirements for effective eco-feedback design within the context of food waste. The findings of deploying and studying E-COmate and its impact on food waste, awareness, and engagements in our studied population can be organized into three categorical themes: (1) interactivity: constant reminding and responsiveness, (2) accuracy and specificity, and (3) persuasive strategies to motivate users. These themes were either explicitly suggested or can be inferred from interview comments.
Interactivity: A Constant Reminder
Food-related behaviors often occur mainly subconscious. Having technology like E-COmate embedded in consumers' everyday environments that can help them in remembering their food waste-related behaviors helps raise awareness, improve understanding around the issue of food waste, and encourages active engagements. E-COmate has shown to provide a constant reminder at the moment of disposing and even had impacts on decision-making at the grocery store. This supports previous research claiming that persuasive technology can greatly contribute to the design of motivational interventions (Midden et al., 2008), but further extends the application field to food waste-related behaviors. The design, however, could be improved by making it more responsive. For example, the data visualization could be updated as soon someone disposes an item so that feedback is immediate while visualizing personal contributions. Food waste awareness seems to require a more immediate feedback (i.e., for each wasteful behavior/each day), perhaps because of the variety of items that are disposed of on a daily basis and the variety of reasons related to it. Immediacy of feedback has been acknowledged in previous research. It is usually more effective in promoting learning than delayed feedback (Chickering and Gamson, 1987). Another example may be increasing consumers' awareness when they are doing groceries, e.g., an infrastructure or design that could help consumers shop more consciously to prevent food waste at home. An important implication here, however, is that grocery stores may increase food waste instead and the problem is shifted. At the moment, efforts are made in improving food safety and extending food life, such as such as improvements in in-home refrigerators, and the use of food preservatives, exacerbating the problem of food waste by enabling over-purchasing and increasing the likelihood of food waste at home (Lake et al., 2020).
Accuracy and Specificity
Participants reported liking the quantification of food waste, but also showed concerns about the level in which it was accurate. Many participants were assigning most of the weight to either in-edibles or paper towels, even though edibles were wasted more as found in the visual inspections. Providing specific details on how food waste amounts are calculated and the composition of the waste (e.g., edibles vs. in-edibles) would be necessary to gain consumers trust in the data and improve its impact. It might also be useful to provide personalized data at the time of disposal so that users can see their own impact. The main challenge here, however, is the ability to reliably measure and then present different types of food waste related to individuals. There are different food waste types, different types of consumers, and costs, which further depends on location and type of store/market. This complexity makes it more difficult to find a useful and generic metaphor that is equally understood by all consumers. Therefore, although metaphors are commonly used in previous eco-feedback research (Froehlich et al., 2009, 2010, 2012) to help understanding, we think this might not be the most useful for visualizing food waste specifically.
Combination of Persuasive Strategies as Motivators
We conclude that effective eco-feedback information should include a combination of economic incentives, self-comparison, and social-comparison as additional motivators to reduce food waste. Participants acknowledged the usefulness of strategies such as self-comparison to better understand when it is necessary to take action. Also, the relevance of social comparison (green competition) has been acknowledged by participants: “Its motivating in that sense that you want to have the best score compared to other floors.”—Farrah. Participants' also showed interest in the economic impact, which might be specific for the selected target group being mostly students. Another reason for this preference might be the high food costs relatively to other expenses such as water and electricity. Previous findings showed that monetary incentives were not necessarily motivators for reducing energy consumption because of the low costs (Delmas et al., 2013), but there might be a different effect for food waste. Beyond the strategies used, eco-feedback could further include tips or suggestions for actions to keep consumers motivated and involved after the first months of use. Designing for action has been suggested by Maitland et al. (2009). Even though eco-feedback has shown to impact active engagements (e.g., participants were able to come up with solutions), strategies should be combined as consumers vary in concerns, interests, and values (Reynolds et al., 2019). Reasons for waste can vary each day. Thus, if a system provides a combination of these strategies, consumers will choose how to use that information within the context of their own everyday lives.
Limitations and Future Work
This work has a few limitations. For example, the display used in the case study cannot distinguish different food types, making it more difficult to define a serving more accurately (e.g., 200 g of fruits might be one serving whereas 200 g of meat could be two servings). The display we deployed was simple in nature. Future developments in sensor technology or image recognition is expected to be able to resolve this issue. Secondly, we evaluated the additional displays only retrospectively. Future research should investigate the impact of these design dimensions individually for its impact and other potential design dimensions such as the use of a bot, providing actionable suggestions, or the use of dynamic or abstract visualizations. Thirdly, we did not explore behavior change. Instead, findings mainly provide insights and explorations into how the prototypes may have impacted awareness and behaviors in response to interventions: the interventions might or might not have led to long term impacts on behavior. In order to study behavior change, longer studies are required with a more extensive sample size and diversity. Instead, the proposed system serves as a frequent reminder to support a goal (e.g., nobody like to waste) and potentially break habits and create new ones through repetition and automaticity (De Vries et al., 2011).
The studies presented here shed light on how habits may change and what design aspects we should consider in designing and developing more effective systems than what is currently available. In future studies, different types of households, such as families with or without children, and community houses should be recruited. Additionally, in this work, deployments were done with prototypes that needed rebooting occasionally. Hence, our prototype used in this work may not have captured and visualized all wasted foods. Although, our work also focuses on exploring the impact of the concept to find implications for further design, the effectiveness or desirability of the concept may depend on what it can capture accurately. This was a major methodological and technological challenge. For example, feedback might not have been based on all wasted foods. Consumers need better incentives to use the bin properly. Easy and accurate food (waste) tracking is not only relevant for better suggestions, visualizations, and evaluation of eco-feedback, it is also necessary to better understand reasons for food waste so that influence strategies could target more specific behaviors. Future developments such as in sensor technology or image recognition is expected to significantly improve the logging and tracking of food or food waste items. Despite these limitations, our work presented here combined an objective approach to quantifying the impact of a design solution with a qualitative approach to understand the reasoning behind the impact.
Beyond This Work
Beyond this work, there is a need to stress the role of society in trusting and accepting domestic food- related technology for sustainability. A system with the aim at supporting (collective) awareness around food touches a very personal side of our lives. Any attempt to changing them is a challenging task. For this reason, technology should require low effort from users, while highlighting actions that are socially and economically appealing and acceptable. For example, if consumers could be motivated in reducing their food purchases (as a way to prevent food waste), money could be spend on other things, which would increase welfare (Rutten et al., 2013). Also, we need to consider what would happen with the food in stores if not being sold to customers because they are becoming more conscious in preventing food waste at home. Without reliable and solid data, policy makers have insufficient basis for introducing major changes. Additionally, privacy should be taken into account. Privacy is an aspect that might deter consumers from using a system like E-COmate. Technology that tracks in-home food availability and waste pervasively and visualizes this to other users could expose private matters. The information could also be a target for taxes, insurances, health inspections, child welfare etc. Therefore, an optimum balance should be found in supporting sustainable food practices and consumers' privacy. To understand how consumers are driven by these aspects, interdisciplinary research is necessary. The complexity of these implications shows a need for integrated collaboration between behavioral scientists, engineers, interaction designers, and economists in developing food-related technologies for sustainability. A long-term challenge within the scope of this work would be to explore the effects of application-mediated interventions on consumers' perceptions, values, behaviors, our economy, as well as our environment.
Conclusion
In sum, eco-feedback via E-COmate seems to have positive impacts on reducing food waste. In our intervention group, we found a 32% decrease in edible or once edible food waste and a 69% decrease in generated other compost waste. Furthermore, while our control group showed an increase of 244% of waste of grains and starches toward the end of term, the intervention group did not produce such an amount of waste of grains and starches. These findings seem to be a result of increased awareness, the constant presence and immediacy of E-COmate served as a reminder, and their understanding of how much they waste as a group. It further engaged residences in reducing food waste practices starting at the grocery store (e.g., by buying in smaller portions). We assume that these observed changes in waste patterns could have been caused by the impact of E-COmate on residents' reported increase of awareness.
The aim of our study was to gain an understanding to what level eco-feedback applied to food waste could impact awareness and encourage active engagements in trying to reduce food waste. Although previous work have pointed out that not providing an explicit solution to the user is a limitation of eco-feedback (Maitland et al., 2009; Brynjarsdottir et al., 2012), our study showed that E-COmate seems to have positive impacts through awareness as well as engagements toward reducing waste particularly around shopping. Eco-feedback has shown to provide a starting point and motivation to act but is expected to perform better if accuracy, specificity, and a combination of persuasive strategies are combined [see also Coskun (2021)].
Data Availability Statement
The raw data supporting the conclusions of this article are available in Supplementary Material.
Ethics Statement
The studies involving human participants were reviewed and approved by Ethics Board of Simon Frazer University. The patients/participants provided their written informed consent to participate in this study.
Author Contributions
VL conceived the presented idea, designed the evaluations, was responsible for creating the prototypes, and conducted the analysis. LB, MF, and MR supervised the experimental design, the development of prototypes, and the findings of this work. VL and MR compiled the final manuscript. All authors discussed the results and contributed to the final manuscript.
Funding
This work was supported by the Victory in Europe Scholarship granted by The Irving K. Barber British Columbia Scholarship Society. This work was supported in part also by the Erasmus Mundus Joint Doctorate in Interactive and Cognitive Environments (ICE), which was funded by the EACEA Agency of the European Commission under EMJD ICE FPA n 2010-0012. The funders were not involved in the study design, collection, analysis, interpretation of data, the writing of this article or the decision to submit it for publication.
Conflict of Interest
The authors declare that the research was conducted in the absence of any commercial or financial relationships that could be construed as a potential conflict of interest.
Acknowledgments
We greatly thank Erik Pietersma and Geert van den Boomen from Eindhoven University of Technology for developing the bin-scale system. We thank Rachel Telling and her team at the Simon-Fraser University—Sustainability Office for the collaboration and support throughout the study. We are also grateful to all janitors and students for the accessibility and invaluable feedback. To protect participants' privacy, all names in this article are pseudonyms. This article contains content derived from the first author's dissertation (Lim, 2017).
Supplementary Material
The Supplementary Material for this article can be found online at: https://www.frontiersin.org/articles/10.3389/fsufs.2021.658898/full#supplementary-material
References
Abrahamse, W., and Steg, L. (2013). Social influence approaches to encourage resource conservation: a meta-analysis. Glob. Environ. Change 23, 1773–1785. doi: 10.1016/j.gloenvcha.2013.07.029
Aktas, E., Sahin, H., Topaloglu, Z., Oledinma, A., Huda, A. K. S., Irani, Z., et al. (2018). A consumer behavioural approach to food waste. J. Enterpr. Inform. Manag. 31, 658–673. doi: 10.1108/JEIM-03-2018-0051
Altarriba, F., Lanzani, S. E., Torralba, A., and Funk, M. (2017). The grumpy bin: reducing food waste through playful social interactions, in Proceedings of the ACM Conference Companion Publication on Designing Interactive Systems, Vol. DIS'17 (New York, NY: ACM), 90–94. doi: 10.1145/3064857.3079125
Ben-Daya, M., Hassini, E., and Bahroun, Z. (2019). Internet of things and supply chain management: a literature review. Int. J. Prod. Res. 57, 4719–4742. doi: 10.1080/00207543.2017.1402140
Brennan, L., Langley, S., Verghese, K., Lockrey, S., Ryder, M., Francis, C., et al. (2020). The role of packaging in fighting food waste: a systematised review of consumer perceptions of packaging. J. Clean. Prod. Online 281:125276. doi: 10.1016/j.jclepro.2020.125276
Brynjarsdottir, H., Håkansson, M., Pierce, J., Baumer, E., DiSalvo, C., and Sengers, P. (2012). Sustainably unpersuaded: How persuasion narrows our vision of sustainability, in Proceedings of the SIGCHI Conference on Human Factors in Computing Systems, Vol. CHI'12 (New York, NY: ACM), 947–956. doi: 10.1145/2207676.2208539
Bucci, M., Calefato, C., Colombetti, S., Milani, M., and Montanari, R. (2010). Fridge fridge on the wall: what can I cook for us all? an HMI study for an intelligent fridge, in Proceedings of the International Conference on Advanced Visual Interfaces, Vol. AVI'10, in ed Santucci, G., (New York, NY: ACM), 415. doi: 10.1145/1842993.1843093
Burke, E., and Napawan, N. C. (2020). Between kitchen sink and city sewer: a socio-ecological approach to food waste in environmental design, in Food Waste Management: Solving the Wicked Problem, eds Närvänen, E., Mesiranta, N., Mattila, M., and Heikkinen, A., (Cham: Springer International Publishing), 169–191. doi: 10.1007/978-3-030-20561-4_7
Chickering, A. W., and Gamson, Z. F. (1987). Seven principles for good practice in undergraduate education. AAHE Bull. 3, 2–6.
Corrado, S., Caldeira, C., Eriksson, M., Hanssen, O. J., Hauser, H.-E., van Holsteijn, F., et al. (2019). Food waste accounting methodologies: challenges, opportunities, and further advancements. Glob. Food Sec. 20, 93–100. doi: 10.1016/j.gfs.2019.01.002
Coskun, A. (2021). Identification of different user types for designing household food waste interventions. Int. J. Sustain. Eng. 1–9. doi: 10.1080/19397038.2021.1886372
De Vries, P., Aarts, H., and Midden, C. J. (2011). Changing simple energy-related consumer behaviors: how the enactment of intentions is thwarted by acting and non-acting habits. Environ. Behav. 43, 612–633. doi: 10.1177/0013916510369630
Delmas, M. A., Fischlein, M., and Asensio, O. I. (2013). Information strategies and energy conservation behavior: a meta-analysis of experimental studies from 1975 to 2012. Energy Policy 61, 729–739. doi: 10.1016/j.enpol.2013.05.109
Dobson, A. J., and Barnett, A. G. (2008). An Introduction to Generalized Linear Models, 3rd Edn. Boca Raton, FL; London; New York, NY: CRC Press. doi: 10.1201/9780367807849
Farr-Wharton, G., Choi, J. H.-J., and Foth, M. (2014). Food talks back: Exploring the role of mobile applications in reducing domestic food wastage, in Proceedings of the 26th Australian Australasian Conference on Computer-Human Interaction: The Future of Design, Vol. OZCHI'14 (New York, NY: ACM), 352–361. doi: 10.1145/2686612.2686665
Festinger, L. (1954). A theory of social comparison processes. Hum. Relat. 7, 117–140. doi: 10.1177/001872675400700202
Fleiss, J. L. (1971). Measuring nominal scale agreement among many raters. Psychol. Bull. 76, 378–382. doi: 10.1037/h0031619
Fogg, B. J. (1998). Persuasive computers: perspectives and research directions, in Proceedings of the SIGCHI Conference on Human Factors in Computing Systems, Vol. CHI'98 (New York, NY: ACM), 225–232. doi: 10.1145/274644.274677
Fogg, B. J. (2003). Persuasive Technology: Using Computers to Change What We Think and Do. San Francisco, CA: Morgan Kaufmann Publishers. doi: 10.1145/764008.763957
Froehlich, J., Dillahunt, T., Klasnja, P., Mankoff, J., Consolvo, S., Harrison, B., et al. (2009). UbiGreen: investigating a mobile tool for tracking and supporting green transportation habits, in Proceedings of the SIGCHI Conference on Human Factors in Computing Systems, Vol. CHI'09 (New York, NY: ACM), 1043–1052. doi: 10.1145/1518701.1518861
Froehlich, J., Findlater, L., and Landay, J. (2010). The design of eco-feedback technology, in Proceedings of the SIGCHI Conference on Human Factors in Computing Systems, Vol. CHI'10 (New York, NY: ACM), 1999–2008. doi: 10.1145/1753326.1753629
Froehlich, J., Findlater, L., Ostergren, M., Ramanathan, S., Peterson, J., Wragg, I., et al. (2012). The design and evaluation of prototype eco-feedback displays for fixture-level water usage data, in Proceedings of the SIGCHI Conference on Human Factors in Computing Systems, Vol. CHI'12 (New York, NY: ACM), 2367–2376. doi: 10.1145/2207676.2208397
Ganglbauer, E., Fitzpatrick, G., and Comber, R. (2013). Negotiating food waste: using a practice lens to inform design. ACM Trans. Comput. Hum. Interact. 20, 1–25. doi: 10.1145/2463579.2463582
Ganglbauer, E., Fitzpatrick, G., and Molzer, G. (2012). Creating visibility: understanding the design space for food waste, in Proceedings of the 11th International Conference on Mobile and Ubiquitous Multimedia, Vol. MUM'12 (New York, NY: ACM), 1–10. doi: 10.1145/2406367.2406369
Gaskell, G., Allum, N., Bauer, M., Durant, J., Allansdottir, A., Bonfadelli, H., et al. (2000). Biotechnology and the European public. Nat. Biotechnol. 18, 935–938. doi: 10.1038/79403
Harvey, J., Smith, A., Goulding, J., and Illodo, I. B. (2020). Food sharing, redistribution, and waste reduction via mobile applications: a social network analysis. Ind. Market. Manag. 88, 437–448. doi: 10.1016/j.indmarman.2019.02.019
Hebrok, M., and Boks, C. (2017). Household food waste: drivers and potential intervention points for design–An extensive review. J. Clean. Prod. 151, 380–392. doi: 10.1016/j.jclepro.2017.03.069
Hermsen, S., Frost, J., Renes, R. J., and Kerkhof, P. (2016). Using feedback through digital technology to disrupt and change habitual behavior: a critical review of current literature. Comput. Hum. Behav. 57, 61–74. doi: 10.1016/j.chb.2015.12.023
Hoes, A.-C., Jongeneel, R., van Berkum, S., and Poppe, K. (2019). Towards Sustainable Food Systems: A Dutch Approach. The Hague. Retrieved from: https://library.wur.nl/WebQuery/wurpubs/fulltext/498900
Holmes, T. G. (2007). Eco-visualization: combining art and technology to reduce energy consumption, in Proceedings of the 6th ACM SIGCHI Conference on Creativity & Cognition, Vol. C&C'07 (New York, NY: ACM), 153–162. doi: 10.1145/1254960.1254982
Jayaprakash, J., and Jagadeesan, H. (2019). Sustainable waste management in higher education institutions: a case study in AC TECH, Anna University, Chennai, India, in Green Engineering for Campus Sustainability, ed Yaser, A. Z., (Singapore: Springer Nature Singapore Pte Ltd), 163–172. doi: 10.1007/978-981-13-7260-5_12
Kim, J., Rundle-Thiele, S., Knox, K., Burke, K., and Bogomolova, S. (2020). Consumer perspectives on household food waste reduction campaigns. J. Clean. Prod. 243, 1–10. doi: 10.1016/j.jclepro.2019.118608
Kuo, P. Y., and Horn, M. S. (2014). Energy diet: energy feedback on a bathroom scale, in Proceedings of the ACM International Joint Conference on Pervasive and Ubiquitous Computing, Vol. UBICOM'14 (New York, NY: ACM), 435–446. doi: 10.1145/2632048.2636063
Lake, D., McFarland, A., and Vogelzang, J. (2020). Creating resilient interventions to food waste: aligning and leveraging systems and design thinking, in Food Waste Management: Solving the Wicked Problem, eds Närvänen, E., Mesiranta, N., Mattila, M., and Heikkinen, A., (Cham: Springer International Publishing), 193–221. doi: 10.1007/978-3-030-20561-4_8
Lim, V. (2017). Design Opportunities in Reducing Domestic Food Waste: A Collective Approach (PhD dissertation). Eindhoven, Eindhoven University of Technology.
Lim, V., Funk, M., Marcenaro, L., Regazzoni, C., and Rauterberg, M. (2017). Designing for action: an evaluation of social recipes in reducing food waste. Int. J. Hum. Comput. Stud. 100, 18–32. doi: 10.1016/j.ijhcs.2016.12.005
Lim, V., Funk, M., Rauterberg, M., Marcenaro, L., and Regazzoni, C. (2015). E-COmate: what's your non-consumption?, in Advances in Computational Intelligence, Vol. IWANN'15, eds Rojas, I., Joya, G., and Catala, A., (Cham: Springer International Publishing), 486–499. doi: 10.1007/978-3-319-19258-1_40
Maitland, J., Chalmers, M., and Siek, K. A. (2009). Persuasion not required Improving our understanding of the sociotechnical context of dietary behavioural change, in Proceedings of the 3rd International ICST Conference on Pervasive Computing Technologies for Healthcare (London: Xplore digital library: IEEE), 1–8. doi: 10.4108/ICST.PERVASIVEHEALTH2009.5928
Makov, T., Shepon, A., Krones, J., Gupta, C., and Chertow, M. (2020). Social and environmental analysis of food waste abatement via the peer-to-peer sharing economy. Nat. Commun. 11, 1151–1158. doi: 10.1038/s41467-020-14899-5
Midden, C., and Ham, J. (2019). Persuasive technology to promote pro-environmental behaviour, in Environmental Psychology: An Introduction, 2nd Edn, eds Steg, L., and de Groot, J. I. M., (West Sussex: John Wiley & Sons Ltd.), 283–294. doi: 10.1002/9781119241072.ch28
Midden, C., McCalley, T., Ham, J., and Zaalberg, R. (2008). Using persuasive technology to encourage sustainable behavior, in Proceedings of Workshop on Pervasive Persuasive Technology and Environmental Sustainability at the 6th International Conference on Pervasive Computing, eds Foth, M., Satchell, C., Paulos, E., Igoe, T., and Ratti, C., (Sydney, NSW: Queensland University of Technology), 47–51.
Morone, P., Koutinas, A., Gathergood, N., Arshadi, M., and Matharu, A. (2019). Food waste: Challenges and opportunities for enhancing the emerging bio-economy. J. Clean. Prod. 221, 10–16. doi: 10.1016/j.jclepro.2019.02.258
Mozo-Reyes, E., Jambeck, J. R., Reeves, P., and Johnsen, K. (2016). Will they recycle? Design and implementation of eco-feedback technology to promote on-the-go recycling in a university environment. Resour. Conserv. Recycl. 114, 72–79. doi: 10.1016/j.resconrec.2016.06.024
Muriana, C. (2017). A focus on the state of the art of food waste/losses issue and suggestions for future researches. Waste Manag. 68, 557–570. doi: 10.1016/j.wasman.2017.06.047
Odom, W., Pierce, J., and Roedl, D. (2008). Social incentive & eco-visualization displays: toward persuading greater change in dormitory communities, in Paper presented at the Public and Situated Displays to Support Communities Workshop of the 20th Australasian Computer-Human Interaction Conference (Cairns, QLD).
Olivier, P., Xu, G., Monk, A., and Hoey, J. (2009). Ambient kitchen: designing situated services using a high fidelity prototyping environment, in Proceedings of the 2nd International Conference on Pervasive Technologies Related to Assistive Environments, Vol. PETRA'09 (New York, NY: ACM), 1–7. doi: 10.1145/1579114.1579161
Pierce, J., Odom, W., and Blevis, E. (2008). Energy aware dwelling: a critical survey of interaction design for eco-visualizations, in Proceedings of the 20th Australasian Conference on Computer-Human Interaction: Designing for Habitus and Habitat, Vol. OZCHI'08 (New York, NY: ACM), 1–8. doi: 10.1145/1517744.1517746
Realini, C. E., and Marcos, B. (2014). Active and intelligent packaging systems for a modern society. Meat Sci. 98, 404–419. doi: 10.1016/j.meatsci.2014.06.031
Reynolds, C., Goucher, L., Quested, T., Bromley, S., Gillick, S., Wells, V. K., et al. (2019). Consumption-stage food waste reduction interventions: what works and how to design better interventions. Food Policy 83, 7–27. doi: 10.1016/j.foodpol.2019.01.009
Rouillard, J. (2012). The pervasive fridge - A smart computer system against uneaten food loss, in Proceedings of the Seventh International Conference on Systems, Vol. ICONS'12 ((IARIA) XPS Press), 135–140.
Rutten, M., Nowicki, P., Bogaardt, M.-J., and Aramyan, L. (2013). Reducing Food Waste by Households and in Retail in the EU; A Prioritisation Using Economic, Land Use and Food Security Impacts, LEI Report 2013-035. The Hague: Wageningen University & Research.
Ruxton, G. D. (2006). The unequal variance t-test is an underused alternative to Student's t-test and the Mann–Whitney U test. Behav. Ecol. 17, 688–690. doi: 10.1093/beheco/ark016
Schanes, K., Dobernig, K., and Gözet, B. (2018). Food waste matters-A systematic review of household food waste practices and their policy implications. J. Clean. Prod. 182, 978–991. doi: 10.1016/j.jclepro.2018.02.030
Schifferstein, H. N. J. (2020). Changing food behaviors in a desirable direction. Curr. Opin. Food Sci.33, 30–37. doi: 10.1016/j.cofs.2019.11.002
Soma, T., Li, B., and Maclaren, V. (2020). Food waste reduction: a test of three consumer awareness interventions. Sustainability 12, 1–19. doi: 10.3390/su12030907
Strengers, Y. A. (2011). Designing eco-feedback systems for everyday life, in Proceedings of the SIGCHI Conference on Human Factors in Computing Systems, Vol. CHI'11 (New York, NY: ACM), 2135–2144. doi: 10.1145/1978942.1979252
Tat, E., and Simon, J. M. (2020). Zero Waste Europe - Annual Report (2019). Retrieved from: Kiel: https://zerowasteeurope.eu/
Thieme, A., Comber, R., Miebach, J., Weeden, J., Kraemer, N., Lawson, S., et al. (2012). We've bin watching you: designing for reflection and social persuasion to promote sustainable lifestyles, in Proceedings of the SIGCHI Conference on Human Factors in Computing Systems, Vol. CHI'12 (New York, NY: ACM), 2337–2346. doi: 10.1145/2207676.2208394
Thonissen, R. L. A. M. (2010). Fact Sheet: Food Waste in the Netherlands. Den Haag: Ministry of Agriculture - Nature and Food Quality. Retrieved from: https://www.government.nl/ministries/ministry-of-agriculture-nature-and-food-quality
Tromp, N., and Hekkert, P. (2018). Designing for Society: Products and Services for a Better World. London; New York, NY: Bloomsbury Publishing. doi: 10.5040/9781474205221
van Geffen, L., van Herpen, E., and van Trijp, H. (2020). Household food waste-how to avoid it? An integrative review, in Food Waste Management-Solving the Wicked Problem, eds Närvänen, E., Mesiranta, N., Mattila, M., and Heikkinen, A., (Cham: Springer Nature Switzerland AG), 27–55. doi: 10.1007/978-3-030-20561-4_2
Wolak, F. A. (2011). Do residential customers respond to hourly prices? Evidence from a dynamic pricing experiment. Am. Econ. Rev. 101, 83–87. doi: 10.1257/aer.101.3.83
Keywords: deployment, eco-feedback, E-COmate, food sustainability, food waste, mixed methods, observation study, persuasive design
Citation: Lim V, Bartram L, Funk M and Rauterberg M (2021) Eco-Feedback for Food Waste Reduction in a Student Residence. Front. Sustain. Food Syst. 5:658898. doi: 10.3389/fsufs.2021.658898
Received: 26 January 2021; Accepted: 06 April 2021;
Published: 10 May 2021.
Edited by:
Elena Horská, Slovak University of Agriculture, SlovakiaReviewed by:
Sergiy Smetana, German Institute of Food Technologies, GermanySanem Argin, Yeditepe University, Turkey
Copyright © 2021 Lim, Bartram, Funk and Rauterberg. This is an open-access article distributed under the terms of the Creative Commons Attribution License (CC BY). The use, distribution or reproduction in other forums is permitted, provided the original author(s) and the copyright owner(s) are credited and that the original publication in this journal is cited, in accordance with accepted academic practice. No use, distribution or reproduction is permitted which does not comply with these terms.
*Correspondence: Matthias Rauterberg, g.w.m.rauterberg@tue.nl
†Present address: Veranika Lim, Yur Ltd., London, United Kingdom