Dairy Cows Naturally Infected with Bovine Leukemia Virus Exhibit Abnormal B- and T-Cell Phenotypes after Primary and Secondary Exposures to Keyhole Limpet Hemocyanin
 Meredith C. Frie1*
 Kelly R. B. Sporer2
 Oscar J. Benitez3
 Joseph C. Wallace2
 Casey J. Droscha4
Paul C. Bartlett5
Casey J. Droscha4
Paul C. Bartlett5  Paul M. Coussens2
- 1Cell and Molecular Biology Program, Michigan State University, East Lansing, MI, United States
- 2Department of Animal Science, Michigan State University, East Lansing, MI, United States
- 3Comparative Medicine and Integrative Biology Program, Michigan State University, East Lansing, MI, United States
- 4NorthStar Cooperative, East Lansing, MI, United States
- 5Department of Large Animal Clinical Sciences, Michigan State University, East Lansing, MI, United States
Bovine leukemia virus (BLV) is a retrovirus that is highly prevalent in US dairy herds: over 83% are BLV infected and the within-herd infection rate can be almost 50% on average. While BLV is known to cause lymphosarcomas, only 5% or fewer infected cattle will develop lymphoma; this low prevalence of cancer has historically not been a concern to dairy producers. However, more recent research has found that BLV+ cows without lymphoma produce less milk and have shorter lifespans than uninfected herdmates. It has been hypothesized that BLV infection interferes with normal immune function in infected cattle, and this could lead to reduced dairy production. To assess how naturally infected BLV+ cows responded to a primary and secondary immune challenge, 10 BLV+ and 10 BLV− cows were injected subcutaneously with keyhole limpet hemocyanin (KLH) and dimethyldioctadecylammonium bromide. B- and T-cell responses were characterized over the following 28 days. A total of 56 days after primary KLH exposure, cows were re-injected with KLH and B- and T-cell responses were characterized again over the following 28 days. BLV+ cows produced less KLH-specific IgM after primary immune stimulation; demonstrated fewer CD45R0+ B cells, altered proportions of CD5+ B cells, altered expression of CD5 on CD5+ B cells, and reduced MHCII surface expression on B cells ex vivo; exhibited reduced B-cell activation in vitro; and displayed an increase in BLV proviral load after KLH exposure. In addition, BLV+ cows had a reduced CD45R0+γδ+ T-cell population in the periphery and demonstrated a greater prevalence of IL4-producing T cells in vitro. All together, our results demonstrate that both B- and T-cell immunities are disrupted in BLV+ cows and that antigen-specific deficiencies can be detected in BLV+ cows even after a primary immune exposure.
Introduction
Bovine leukemia virus (BLV) is a δ-retrovirus (1) that infects over 83% of dairy herds in the United States; as many as 40% of all US dairy cattle are infected (2). BLV is the causative agent of enzootic bovine leukosis (EBL), where BLV+ cattle develop malignant lymphoma or leukemia (3). Although lymphoma is deadly and results in carcass condemnation at slaughter (2), it is estimated that fewer than 10% of infected cattle will eventually develop EBL (3). Unfortunately, recent research suggests that BLV infection has more negative impacts on herd health than previously appreciated.
Bovine leukemia virus infection reduces both milk production (2) and longevity (4) in infected dairy cows. While it is unclear how BLV interferes with milk production and lifespan, one hypothesis is that BLV causes immune dysregulation, which could put BLV+ cattle at an increased risk for other infections. BLV most commonly infects B cells (5) and can cause persistent lymphocytosis (PL), a chronic, benign, polyclonal expansion of the B-cell compartment that occurs in 30% of infected cattle (3). In vitro experiments have demonstrated abnormalities in both innate and adaptive immune cells isolated from BLV+ cattle (6). In addition, a few studies have found positive correlations between BLV and other infectious diseases (7, 8) and a reduction in vaccine immunity in BLV+ cattle (9–11). However, when investigating immunity in naturally infected BLV+ cattle, many studies were unable to control for how much antigen exposure occurred before or after BLV infection.
The current study was designed to address that specific problem. BLV+ and BLV− cows were exposed to an immunostimulatory antigen, keyhole limpet hemocyanin (KLH), to mimic a primary immune response. At 56 days after primary exposure, cows were re-exposed to KLH to mimic a secondary memory immune exposure. To characterize both primary and secondary adaptive immune responses, B- and T-cell responses were tracked using ELISAs to measure antibody production against KLH, flow cytometry to measure the dynamics of freshly isolated B and T cell subsets, and cell culture to investigate B- and T-cell responses to KLH and mitogenic stimulation in vitro. Specifically, CD5 and CD45R0 expressions on ex vivo B cells and CD45R0 expression on ex vivo CD4+, CD8+, and γδ+ T cells were characterized. BLV and CD25 expressions were characterized in B cells, and IFNγ and IL4 productions were characterized in T cells after in vitro stimulation. Abnormalities in both B- and T-cell subsets were detected in BLV+ cattle during both primary and secondary immune responses, providing further support that BLV infection causes immune dysregulation.
Materials and Methods
Animals and KLH Inoculation
10 BLV− and 10 BLV+ lactating Holstein dairy cows were enrolled in the current study (Table 1). BLV+ cows (as determined by the producer’s BLV milk ELISA results) were not confirmed to have PL but were selected for elevated total leukocyte counts (as determined using a Beckman Coulter counter) and an elevated proportion of circulating B cells [as determined by immunostaining for surface IgM (SIgM) on freshly isolated PBMCs] 1 week prior to the study’s initiation. BLV+ cows had a high proviral load (PVL) on d0 (12). BLV− cows were then age and lactation matched to the 10 selected BLV+ cows. Both BLV− and BLV+ cows were also re-screened for BLV infection using a commercial serum ELISA (NorthStar Cooperative) 1 week prior to the study start. BLV serum ELISAs and endpoint PCR (on DNA extracted from whole blood) to detect BLV provirus were also used on samples collected on the first and last days of the study to confirm BLV status. One BLV− cow seroconverted in between enrollment diagnostics and the start of the study; this cow and her matched BLV+ cow were excluded from the final data analysis.
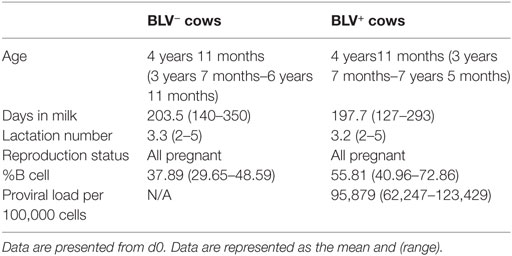
Table 1. Cow enrollment characteristics.
Upon study initiation on day 0 (d0), all cows received the primary KLH inoculation consisting of 1.5 mL KLH cocktail injected subcutaneously into the left side of the neck. The KLH cocktail was composed of 200 µg KLH (Sigma) in 0.75 mL 1× phosphate-buffered saline (PBS) containing 5% bovine serum albumin and 0.75 mL 20 mg/mL adjuvant dimethyldioctadecylammonium bromide (DDA) (Sigma) in 1× PBS (13). On d56, cows received the secondary KLH inoculation with 1.5 mL KLH cocktail subcutaneously injected into the right side of the neck. All protocols were reviewed and approved by the Michigan State University Institutional Animal Use and Care Committee (AUF# 04/15-061-00).
Whole Blood, Plasma, and PBMC Isolation
Whole blood was collected by coccygeal venipuncture on d0 before primary inoculation and on days 7, 14, 18, 21, 28, 54, and 56 after primary inoculation; after blood collection on d56, the secondary KLH inoculation was administered and blood was collected on days 60, 67, 70, 77, and 84 after primary inoculation (days 4, 11, 14, 21, and 28 after secondary inoculation). Blood for PVL quantification was collected in Vacutainer blood collection tubes containing the anticoagulant EDTA (Becton Dickinson); 1 mL aliquots of whole blood were stored at −80°C. Blood for antibody quantification and PBMC immunostaining was collected in Vacutainer blood collection tubes containing the anticoagulant ACD (Becton Dickinson). Plasma and PBMCs were isolated as previously described (10). Briefly, aliquots of plasma with 0.1% sodium azide were stored at −80°C and PBMCs were isolated using Percoll density centrifugation.
BLV PVL Quantification
DNA was extracted from whole blood using the DNeasy Blood and Tissue kit (Qiagen) using a modified protocol. Briefly, 200 µL of whole blood, 40 µL of proteinase K, 218 µL of buffer AL and 218 µL of 100% ethanol were used instead of the recommended kit volumes. Extracted DNA was quantified using a Nanodrop-1000, and A260/280 ratios were used to assess sample purity. DNA was diluted to 30 ng/µL in elution buffer for PVL quantification. BLV PVL was determined using the Coordination of Common Motifs-qPCR to amplify the long terminal repeat (LTR) of the BLV provirus. To normalize genomic DNA input, the single-copy Bola-DRA gene was also amplified (14). In brief, 30 ng of genomic DNA were assayed using TaqMan Gene Expression Master Mix (Applied Biosystems, CA, USA) on the 7500 FAST Real-time PCR System (Applied Biosystems, CA, USA). BLV copy number and BoLA-DRA copy number were calculated using 10–1 × 10⁵ copies of the standard plasmid, which contained a copy of BLV-LTR and BoLA-DRA. Each value was calculated using the algorithm suggested by the manufacturer. PVL was the ratio of BLV copy number to BoLA-DRA copy number multiplied by 100,000 (15). PVL was expressed as BLV copy number/100,000 cells.
Anti-KLH Antibody Quantification
Anti-KLH antibodies were quantified from plasma collected on days 0, 7, 14, 21, 28, 56, 60, 67, 70, 77, and 84 after primary inoculation. Flat-bottomed 96-well ELISA plates (Thermo Fisher Scientific) were incubated with 100 µL of 1 µg/mL KLH in 50 mM carbonate/bicarbonate buffer overnight at 4°C. Plates were washed 3× with wash buffer (0.05% Tween-20 in 1× PBS) and blocked with 2% heat-inactivated horse serum in wash buffer for 1 h at 37°C. Plates were then washed 5×, and 100 µL of plasma (diluted 1:50 in blocking buffer) was added to wells and incubated for 1 h at room temperature. Plates were washed 5× and then incubated for 1 h at room temperature with 100 µL anti-bovine IgM, IgG1, or IgG2 conjugated to horseradish peroxidase (Thermo Fisher Scientific) diluted 1:10,000 in blocking buffer as previously described (10). Plates were washed 5× and incubated for 15 min at room temperature in the dark with 100 µL TMB substrate (Sigma). A total of 100 µL stop solution (2 M H2SO4) was added, and the optical density was measured at 450 nm using a SpectraMax M5 microplate reader. All samples were run in duplicate, and each plate included blank and naive (not exposed to KLH) controls.
Immunostaining of Freshly Isolated PBMCs
Immunostaining of freshly isolated PBMCs was performed as previously described (10) on days 0, 7, 14, 21, 28, 56, 60, 67, 70, and 77 after primary inoculation. Briefly, 5 × 10⁵ PBMCs were fixed in 4% paraformaldehyde and then labeled via indirect immunofluorescence first with mouse anti-bovine primary antibodies and second with goat anti-mouse secondary antibodies. The freshly isolated B-cell population was characterized using the stain labeled “fresh B” in Table 2, and the freshly isolated T-cell population was characterized using the stain labeled “fresh T” in Table 2.
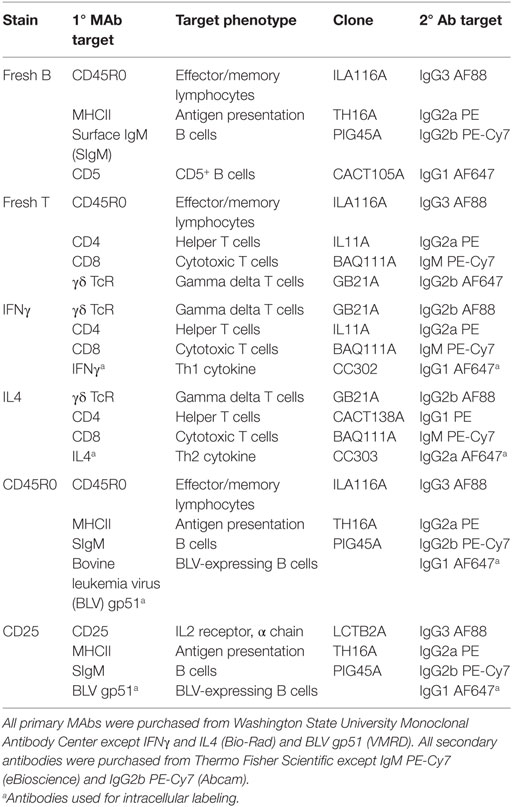
Table 2. Antibodies used for immunostaining experiments.
In Vitro Stimulation of PBMCs
To investigate T-cell activation, 2 × 10⁶ PBMCs were cultured at 38°C and 5% CO2 in 1 mL Roswell Park Memorial Institute (RPMI) complete media (RPMI plus 10% fetal bovine serum, 1% penicillin/streptomycin, and 1% fungizone, pH 7.4) in 24-well culture plates (Corning). PBMCs were either cultured in medium alone (NIL) for 18 h, with 200 µg/mL KLH for 18 h, or with 20 µg/mL positive control concanavalin A (CONA) for the final 6 h. All samples were treated with 20 ng/mL brefeldin A at 12 h to prevent cytokine secretion. T-cell activation was measured on days 7, 14, 56, 67, and 77.
To investigate B-cell activation, 5 × 10⁶ PBMCs were cultured at 38°C and 5% CO2 in 3 mL RPMI complete media in 12-well culture plates (Corning) with medium alone (NIL), 200 µg/mL KLH, or with positive control 20 ng/mL phorbol 12-myristate 13-acetate and 400 ng/mL ionomycin (P/I) for 18 h. B-cell activation was measured on days 18, 54, and 70.
Immunostaining of Cultured PBMCs
PBMCs were labeled with four-color stains to investigate IFNγ production by T cells (“IFNγ” in Table 2), IL4 production by T cells (“IL4” in Table 2), and BLV expression in B cells (“CD45R0” and “CD25” in Table 2). Immunostaining of cultured PBMCs was performed as previously described (10). Briefly, indirect immunostaining for surface receptors on live PBMCs was done as described for freshly isolated PBMCs. PBMCs were then fixed and permeabilized using a fixation/permeabilization kit according to manufacturer’s instructions (eBioscience), and PBMCs were labeled with a primary mouse anti-bovine or anti-BLV monoclonal antibody and subsequently labeled with a goat anti-mouse secondary antibody. Labeled PBMCs were stored at 4°C overnight until flow cytometry analysis.
Immunostaining Analysis
Data were acquired using an Accuri C6 flow cytometer equipped with CSampler (Becton Dickinson). Data were compensated using the Accuri C6 software (Becton Dickinson) and then exported for analysis using FCS Express 4 (De Novo Software). PBMCs were initially selected using forward and side scatter gating to exclude debris, and cells were identified gating on lineage-specific markers (CD4, CD8, γδ, or SIgM). Expression of IFNγ, IL4, CD45R0, MHCII, CD5, and CD25 were then subsequently characterized within specific cell types, and marker expression was expressed as either the mean relative percent or the mean fluorescence intensity (MFI). Unless noted, all referenced B cells are SIgM+MHCII+. CD5 labeling on fresh PBMCs exhibited three populations; the center population was denoted “CD5dim” and the far right population was denoted “CD5bright” (Figure S1 in Supplementary Material).
Statistics
Statistical analysis was performed using SAS 9.4 (SAS Institute). Antibody and fresh PBMC data were analyzed using repeated measures ANOVA with BLV and time as fixed effects and post hoc Bonferroni correction for pairwise comparisons. Cultured PBMC data were analyzed using repeated measures ANOVA with BLV and stimulant as fixed effects and post hoc Bonferroni correction for pairwise comparisons. A Tukey test was used to analyze the difference in MHCII or CD25 MFIs between different B-cell subsets. Outliers were detected using Grubbs test; both outliers and their matched cow were eliminated from analysis. Significance was determined as p < 0.05.
Results
BLV+ Cows Exhibit Reduced IgM Production In Vivo
To characterize the strength of the humoral immune response in BLV+ cows, the relative quantities of KLH-specific IgM, IgG1, and IgG2 were measured. As expected, both BLV+ and BLV− cows produced KLH-specific IgM, IgG1, and IgG2 after primary and secondary KLH inoculations (p < 0.001 for all isotypes). Interestingly, BLV+ cows had less IgM (p = 0.0045) after primary KLH inoculation at all time points, including d0. However, BLV+ cows made IgM at levels equal to BLV− cows after the secondary KLH inoculation (p = 0.7742) (Figure 1A). In contrast to IgM production, BLV+ and BLV− cows produced equivalent levels of IgG1 (p = 0.6715) (Figure 1B) and IgG2 (p = 0.9437) (Figure 1C) after both primary and secondary KLH inoculations. These data support recent evidence that BLV infection interferes with IgM antibody production after both a primary immune challenge and a common vaccine booster injection (10).
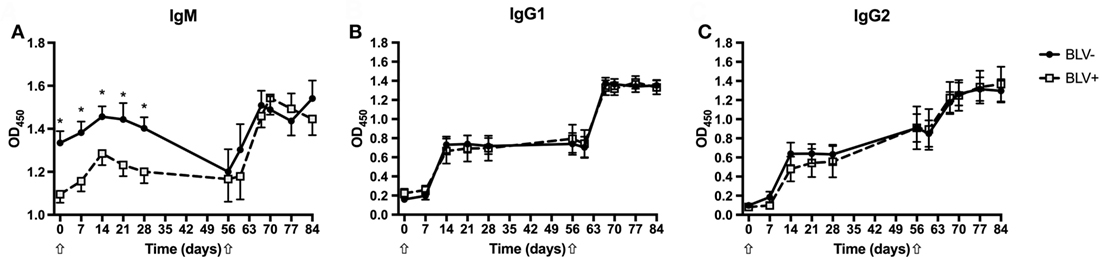
Figure 1. Anti-keyhole limpet hemocyanin (KLH) antibodies produced by BLV+ and BLV− cows. Anti-KLH antibodies from BLV+ and BLV− cows were relatively quantified. (A) IgM production; (B) IgG1 production; and (C) IgG2 production. *p < 0.05. n = 7–9/group. Arrows denote KLH inoculations. Data represent the mean ± SEM.
BLV+ Cows Demonstrate Abnormal Circulating B-Cell Populations In Vivo
To investigate how circulating B-cell populations changed in response to immune stimulation, freshly isolated PBMCs were immunostained to examine both CD45R0 and CD5 B-cell populations in BLV+ and BLV− cows. Unless noted in the text, all B cells are SIgM+MHCII+. Surprisingly, the SIgM+ B-cell population from BLV+ cows did steadily increase over time (p < 0.05) after both primary and secondary KLH inoculations; however, this trend was not observed in BLV− cows. As expected, BLV+ cows had significantly more circulating B cells than uninfected, age-matched cows (p < 0.0001) (Figure 2C). Some B-cell populations did not shift in response to KLH inoculation: in both BLV+ and BLV− cows, the mean relative percent of MHCII+SIgM+ B cells and CD45R0+ B cells, as well as the CD5 MFI on B cells, all remained constant. However, these populations were altered in BLV+ cows. While BLV+ cows exhibited a higher proportion of MHCII+SIgM+ B cells (p = 0.0084), they also demonstrated a large reduction in CD45R0+ B cells compared to uninfected, age-matched controls (p < 0.0001) (Figure 2A). When analyzing CD5 expression on B cells, two distinct positive populations were observed, which we denoted CD5dim and CD5bright (Figure S1 in Supplementary Material). Interestingly, B cells from BLV+ cows had higher CD5 expression on CD5dim+ B cells (p = 0.0002) but lower CD5 expression on CD5bright+ B cells (p = 0.0017) (Figure 2B).
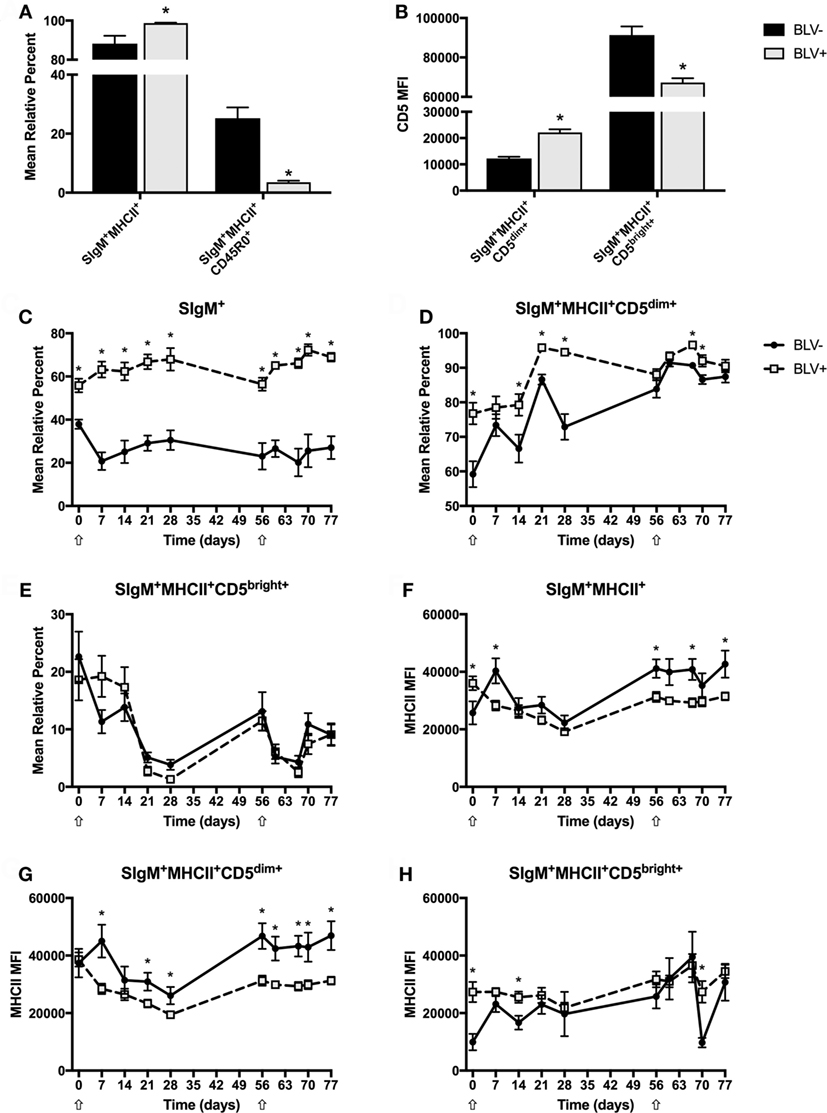
Figure 2. Circulating B-cell populations in BLV+ and BLV− cows. Freshly isolated PBMCs from BLV+ and BLV− cows were immunostained to characterize the circulating B-cell population. (A) Mean relative percentages of B-cell populations on d0. (B) Mean fluorescence intensities (MFIs) of B-cell populations on d0. (C) Mean relative percent of SIgM+ PBMCs. (D) Mean relative percent of CD5dim+SIgM+MHCII+ B cells. (E) Mean relative percent of CD5bright+SIgM+MHCII+ B cells. (F) MHCII MFI on SIgM+MHCII+ B cells. (G) MHCII MFI on SIgM+MHCII+CD5dim+ B cells. (H) MHCII MFI on SIgM+MHCII+CD5bright+ B cells. *p < 0.05. n = 6–9/group. Arrows denote keyhole limpet hemocyanin inoculations. Data represent the mean ± SEM.
Although the surface expression of CD5 did not change over time, both CD5dim+ and CD5bright+ B-cell populations responded to KLH inoculation (p < 0.05); while the CD5dim+ B-cell population steadily increased after inoculation, the CD5bright+ B-cell population sharply declined. In addition, BLV+ cows displayed a lower CD5dim+ B-cell population (p = 0.0043) (Figure 2D), but the CD5bright+ B-cell population was equal between BLV+ and BLV− cows (p = 0.9611) (Figure 2E).
We were also interested in the effect of BLV infection on MHCII surface expression. Surprisingly, MHCII surface expression actually fluctuated in response to KLH exposure on all measured B-cell types (p < 0.05). BLV+ cows presented lower MHCII surface expression on CD5dim+ B cells (p = 0.0168) (Figure 2G) and a trending lower MHCII surface expression on all B cells (p = 0.0722) (Figure 2F). In contrast, BLV+ and BLV− cows exhibited equivalent MHCII surface expression on CD45R0+ (p = 0.7919) (data not shown) and CD5bright+ B cells (p = 0.5662) (Figure 2H).
B Cells from BLV+ Cows Develop Atypical Phenotypes after In Vitro Stimulation
To determine if KLH stimulation in vitro induced BLV expression in infected B cells, PBMCs were cultured in the presence of KLH or P/I-positive control stimulation and BLV expression (by immunostaining for viral protein BLV gp51) and B-cell activation (by immunostaining for CD25) were characterized. While B-cell culture was done on d18, 54, and 70, there was no difference in results from different time points. Thus, results presented are from d70.
There was no overall difference between BLV+ and BLV− cows when comparing the mean relative percent of CD25+ B cells (p = 0.5849), and both KLH and P/I stimulation increased the proportion of CD25+ B cells. However, B cells from BLV+ cows exhibited only a trending (p = 0.053) rise in CD25+ B cells after KLH stimulation; in fact, the proportion of CD25+ B cells in KLH-stimulated cultures from BLV+ cows was significantly lower than KLH-stimulated cultures from BLV− cows (Figure 3A).
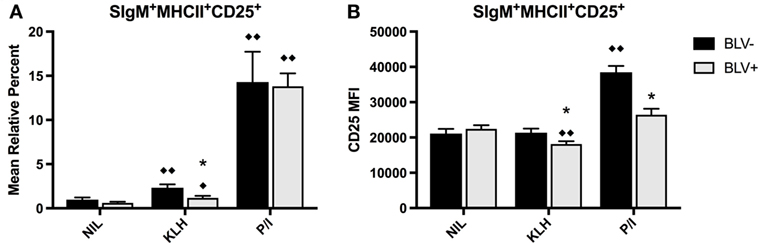
Figure 3. B-cell activation in BLV+ and BLV− cows after in vitro stimulation. PBMCs from BLV+ and BLV− cows were cultured in the presence of no (NIL), keyhole limpet hemocyanin (KLH), or positive control (P/I), stimulation and activation was measured by CD25 expression. (A) Mean relative percent of CD25+SIgM+MHCII+ B cells. (B) CD25 mean fluorescence intensity on SIgM+MHCII+CD25+ B cells. *p < 0.05 compared to BLV−, ♦♦p < 0.05 compared to nil, ♦p < 0.1 compared to nil. n = 8–9/group. Data represent the mean ± SEM.
In contrast to the mean relative percent of activated B cells, the surface expression of CD25 on B cells was significantly affected by BLV status (p = 0.0044). Only B cells from BLV− cows demonstrated higher CD25 MFI after P/I stimulation; B cells from BLV+ cows actually decreased CD25 surface expression after KLH stimulation, and the surface expression of CD25 was lower on B cells from BLV+ cows, in comparison to B cells from BLV− cows, after both KLH and P/I stimulation (Figure 3B).
PBMCs were also cultured to investigate if KLH stimulation could induce BLV expression in B-cell populations from BLV+ cows. KLH failed to trigger BLV expression in any measured B-cell subset. Surprisingly, KLH stimulation actually reduced the proportion of BLV-expressing CD45R0+ B cells. However, CD45R0 expression on B cells did not have a significant effect on BLV expression overall (p = 0.8236) (Figure 4A). In contrast, CD25 expression on B cells did have a significant effect on BLV expression (p = 0.0013); CD25+ B cells under all culture conditions exhibited a much greater proportion of BLV expression in comparison to CD25− B cells (Figure 4B).
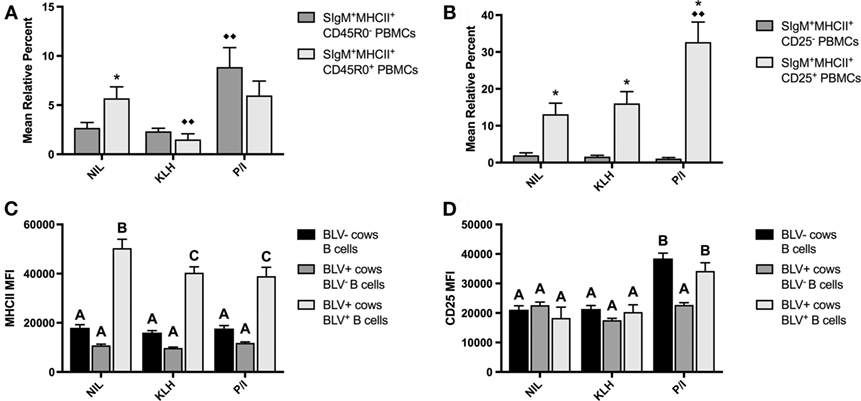
Figure 4. BLV expression in vitro. PBMCs from BLV+ and BLV− cows were cultured in the presence of no (NIL), keyhole limpet hemocyanin (KLH), or positive control (P/I) stimulation. (A) Mean relative percent of BLV+SIgM+MHCII+CD45R0− or BLV+SIgM+MHCII+CD45R0+ B cells from BLV+ cows. (B) Mean relative percent of BLV+SIgM+MHCII+CD25− or BLV+SIgM+MHCII+CD25+ B cells from BLV+ cows. (C) MHCII mean fluorescence intensity (MFI) on SIgM+MHCII+ B cells from BLV− cows, SIgM+MHCII+BLV− B cells from BLV+ cows and SIgM+MHCII+BLV+ B cells from BLV+ cows. (D) CD25 MFI on SIgM+MHCII+ B cells from BLV− cows, SIgM+MHCII+CD25+BLV− B cells from BLV+ cows, and SIgM+MHCII+CD25+BLV+ B cells from BLV+ cows. *p < 0.05 compared to CD45R0− or CD25− B cells, ♦♦p < 0.05 compared to nil. Different letters denote significant differences. n = 8–9/group. Data represent the mean ± SEM.
We also explored how BLV expression affected B-cell phenotypes in vitro. When comparing B cells from BLV− cows to B cells from BLV+ cows that did (BLV+) or did not (BLV−) express BLV protein gp51, BLV+ B cells expressed much higher MHCII in all culture conditions in comparison to both BLV− B cells and B cells from BLV− cows (Figure 4C). When investigating the effect of BLV expression on CD25 surface expression, CD25 MFI increased in P/I-stimulated cultures as expected, but only on B cells from BLV− cows and BLV+ B cells from BLV+ cows; BLV− B cells from BLV+ cows failed to increase the CD25 MFI (Figure 4D). Taken together, these results suggest that B cells from BLV+ cows are less reactive to in vitro stimulation than B cells from BLV− cows; BLV expression in vitro is more prevalent in activated B cells; and B cells from BLV+ cows demonstrate different phenotypes in comparison to B cells from BLV− cows, both in BLV− and BLV+ B-cell subsets.
BLV PVL In Vivo Increases after KLH Inoculation
In order to assess how the BLV PVL changed over time after KLH+ DDA exposure, DNA was extracted from whole blood from BLV+ cattle and qPCR was used to measure PVL. The average BLV PVL on d0 before inoculation was almost 96,000 copies/105 cells; after both primary and secondary KLH inoculations, the PVL sequentially increased over time (p < 0.0001) (Figure 5). BLV+ cows exhibited the largest increase in PVL on the final day of collection (28 days post-exposure for primary and 21 days post-exposure for secondary); in both cases, the PVL increased by over 18,000 copies/105 cells.
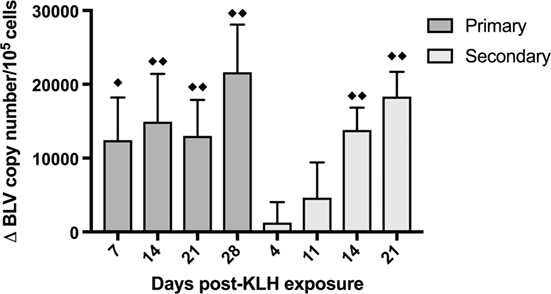
Figure 5. Bovine leukemia virus (BLV) proviral load (PVL) in whole blood in BLV+ cows. DNA was extracted from whole blood collected from BLV+ cows after keyhole limpet hemocyanin (KLH) inoculation and the BLV PVL was measured. The change in PVL after either primary (d0) or secondary (d56) KLH+ DDA injection was determined. ♦♦p < 0.05 compared to d0 (for primary) or to d56 (for secondary), ♦p < 0.1 compared to d0 or d56. n = 10. Data represent the mean ± SEM.
BLV+ Cows Have Reduced Proportions of Circulating T-Cell Populations In Vivo
Although BLV most commonly infects B cells, previous research has suggested that T-cell immunity is also compromised in BLV+ cows (6). To investigate the circulating effector and memory T-cell population in BLV+ cows after KLH inoculation, we labeled freshly isolated PBMCs to measure CD45R0 expression on CD4+, CD8+, and γδ+ T cells. BLV+ cows consistently exhibited lower relative proportions of CD4+, CD8+, and γδ+ T cells (p < 0.05) (Figure 6D), although these did not change over time. However, both CD4+CD45R0+ (Figure 6A) and CD8+CD45R0+ (Figure 6B) T-cell populations significantly responded to primary and secondary KLH inoculations (p < 0.05): both populations increased after inoculation, although there was no difference between CD4+CD45R0+ (p = 0.3816) or CD8+CD45R0+ (p = 0.4237) populations in BLV+ and BLV− cows. In contrast to classical T cells, the γδ+CD45R0+ population did not significantly change over time after KLH exposure; however, BLV+ cows demonstrated a greatly diminished γδ+CD450+ T-cell population (p < 0.0001) (Figure 6C). These data indicate that while BLV infection does not appear to affect the classical effector/memory T-cell compartment, BLV infection may negatively impact the γδ effector/memory T-cell compartment.
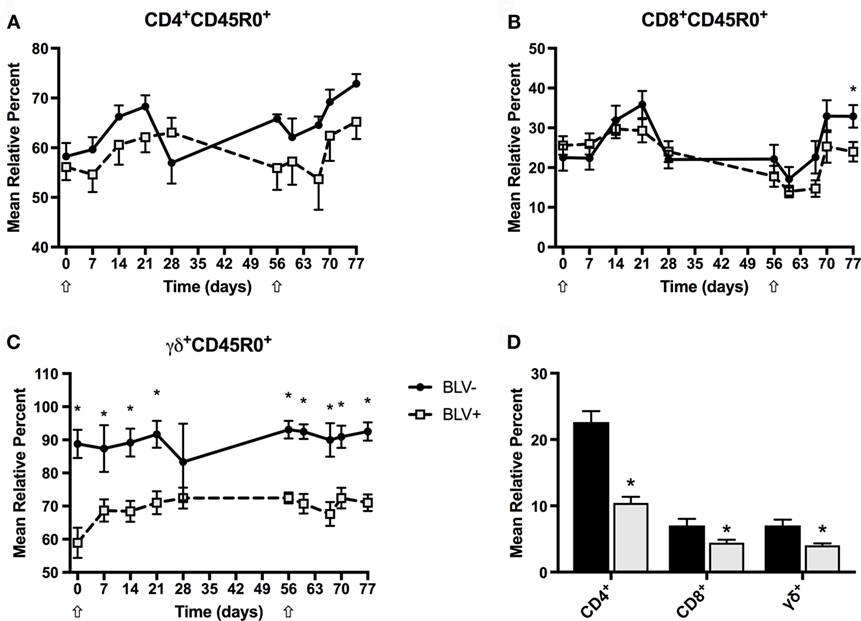
Figure 6. Circulating T-cell populations in BLV+ and BLV− cows. Freshly isolated PBMCs from BLV+ and BLV− cows were immunostained to characterize the circulating T-cell population. (A) Mean relative percent of CD45R0+CD4+ T cells. (B) Mean relative percent of CD45R0+CD8+ T cells. (C) Mean relative percent of CD45R0+γδ+ T cells. (D) Mean relative percent of CD4+, CD8+, and γδ+ T-cell populations on d0. *p < 0.05. n = 6–9/group. Arrows denote keyhole limpet hemocyanin inoculations. Data represent the mean ± SEM.
T Cells from BLV+ Cows Produce More IL4 after Stimulation In Vitro
In addition to investigate the circulating effector/memory T-cell compartment, we examined whether T cells from BLV+ cows generated IFNγ or IL4 in response to stimulation in vitro. While in vitro T-cell activation was measured on d7, 14, 56, 67, and 77, there was no difference between time points; thus, the IFNγ data presented in Figure 7 is from d56. Overall, KLH stimulation failed to increase the proportion of IFNγ+ cells in any T-cell subset and actually decreased the proportion of IFNγ+CD8+ T cells from both BLV+ and BLV− cows. There was no overall difference between BLV+ and BLV− cows in the proportion of IFNγ+CD4+ T cells (p = 0.150) (Figure 7A) or CD8+ T cells (p = 0.112) (Figure 7B). Unlike classical T cells, γδ+ T-cell IFNγ production was significantly higher in BLV+ cows (p = 0.0007) (Figure 7C).
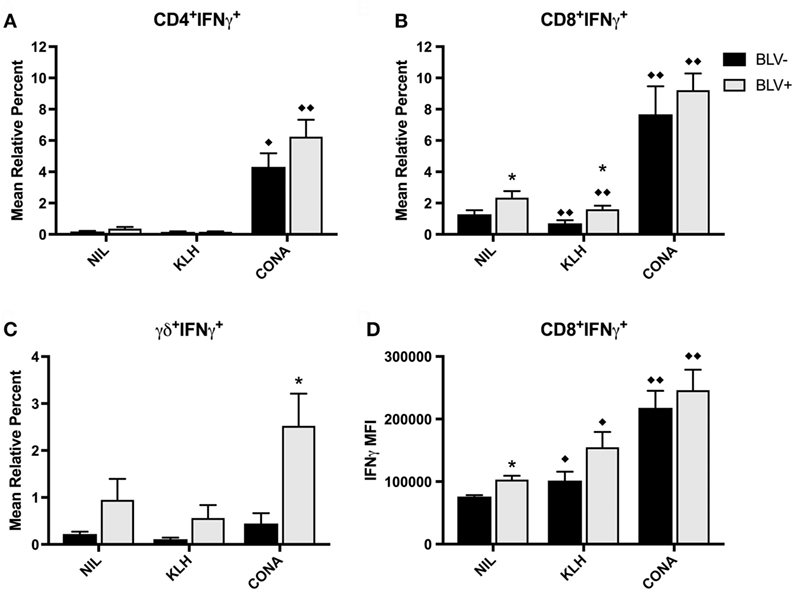
Figure 7. IFNγ production by T cells from BLV+ and BLV− cows. PBMCs from BLV+ and BLV− cows were cultured with no (NIL), keyhole limpet hemocyanin (KLH), or positive control (CONA) stimulation and IFNγ production by T-cell subsets was measured. (A) Mean relative percent of IFNγ+CD4+ T cells. (B) Mean relative percent of IFNγ+CD8+ T cells. (C) Mean relative percent of IFNγ+γδ+ T cells. (D) IFNγ mean fluorescence intensity on CD8+IFNγ+ T cells. *p < 0.05 compared to BLV−, ♦♦p < 0.05 compared to nil, ♦p < 0.1 compared to nil. n = 8–9/group. Data represent the mean ± SEM.
We also measured the IFNγ MFI as a measure of reactivity to in vitro stimulation. While there was no difference in IFNγ MFI from CD4+ or γδ+ T cells between BLV+ and BLV− cows (data not shown), BLV status did have a significant effect on IFNγ MFI from CD8+ T cells (p = 0.044): reactive CD8+ T cells from BLV+ cows were actually producing more IFNγ than reactive CD8+ T cells from BLV− cows (Figure 7D).
We also studied IL4 production by T-cell subsets in BLV+ cows. Similar to the in vitro IFNγ results, in vitro IL4 production was not different between time points; thus, the IL4 data presented in Figure 8 are from d77. Surprisingly, in vitro IL4 production was not similar to what was observed with in vitro IFNγ production. BLV status had a significant or trending significant effect on the proportion of IL4-producing cells within CD4+ (p = 0.0009), CD8+ (p = 0.0006), and γδ+ T-cell (p = 0.0879) populations. In all three T-cell populations, BLV+ cows consistently exhibited a higher proportion of IL4-producing T cells (Figures 8A–C). However, reactive CD8+ T cells from BLV+ cows actually exhibited lower IL4 expression in comparison to reactive CD8+ T cells from BLV− cows (p < 0.0001) (Figure 8D). The IL4 MFI from CD4+ and γδ+ T cells was not different between BLV+ and BLV− cows (data not shown). Taken together, these results imply that T cells from BLV+ cows are capable of producing both IFNγ and IL4 after in vitro cell culture; however, the balance in BLV+ cows may favor a greater proportion of IL4-producing T cells.
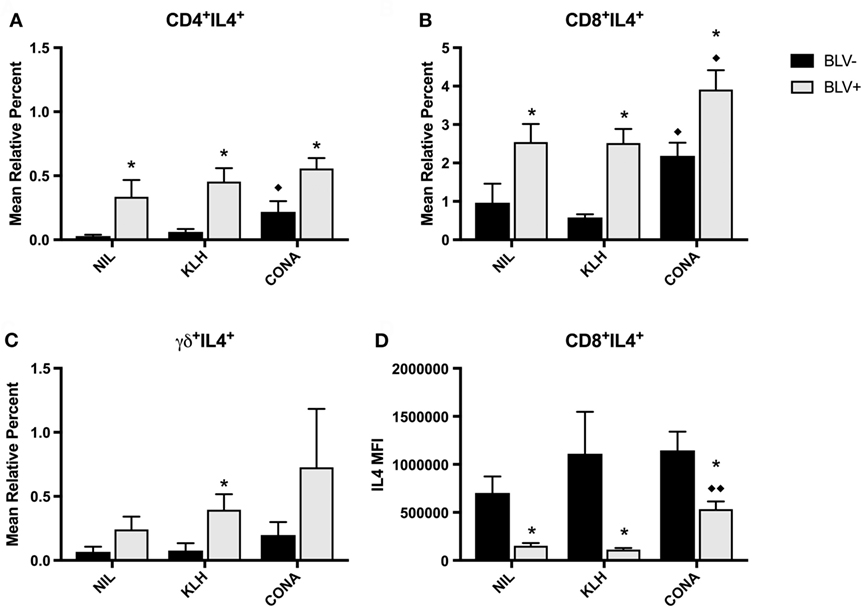
Figure 8. IL4 production by T cells from BLV+ and BLV− cows. PBMCs from BLV+ and BLV− cows were cultured with no (NIL), keyhole limpet hemocyanin (KLH), or positive control (CONA) stimulation and IL4 production by T-cell subsets was measured. (A) Mean relative percent of IL4+CD4+ T cells. (B) Mean relative percent of IL4+CD8+ T cells. (C) Mean relative percent of IL4+γδ+ T cells. (D) IL4 mean fluorescence intensity on CD8+IL4+ T cells. *p < 0.05 compared to BLV−, ♦♦p < 0.05 compared to nil, ♦p < 0.1 compared to nil. n = 7–8/group. Data represent the mean ± SEM.
Discussion
In this study, we investigated how BLV+ dairy cows respond to both a primary immune stimulation and a secondary immune stimulation. After exposing BLV+ and BLV− cows to a non-infectious antigen (KLH), both B- and T-cell responses were tracked over a 3-month period to measure both the primary and secondary immune responses. Alterations were observed in both B- and T-cell immunities in BLV+ cows relative to uninfected herdmates: BLV+ cows produced lower titers of KLH-specific IgM after primary immune stimulation; exhibited fewer CD45R0+ B cells, increased CD5dim+ B cells with higher CD5 expression, reduced CD5 expression on CD5bright+ B cells, and reduced MHCII surface expression on B cells in circulation; displayed reduced B-cell activation in vitro; and exhibited an increase in BLV PVL. In addition, BLV+ cows demonstrated a reduced CD45R0+γδ+ T-cell population in the periphery and demonstrated a greater prevalence of IL4-producing T cells in vitro. Taken together, these results suggest that BLV+ cows do have abnormal immune responses even upon a primary immune stimulation. Atypical immune responses may make BLV+ cows more vulnerable to other infections of economic importance. This risk is readily apparent at first exposure to a novel antigen as well as after repeated exposure to a common vaccine (10).
Similar to results seen in previous studies (10, 11), BLV+ cows demonstrated less antigen-specific IgM after primary stimulation. Although BLV+ cows produced equivalent levels of IgM after secondary stimulation, this appears to be the result of IgM levels declining in BLV− cows between primary and secondary stimulations. In contrast, no differences were observed in either IgG1 production or IgG2 production against KLH. While other studies have found altered IgG levels in BLV+ cattle (9, 11), it is possible that any impairment of IgG production is only detectable after repeated antigen exposure. While IgG antibodies have higher affinity for antigens, IgM is particularly important during a primary immune response as the first secreted isotype and is especially important for activating complement, which provides critical protection against bacterial infections.
It was interesting to note that the overall circulating B-cell population in BLV+ cows alone increased after both primary and secondary KLH stimulations. 30% of BLV+ cattle develop PL, which is characterized by a chronic, polyclonal expansion of B cells in peripheral blood (3). While the mechanisms by which BLV causes PL are not well understood, B-cell population dynamics are clearly dysregulated during polyclonal expansion (6). Because the prevalence of circulating B cells in BLV+ cows did not remain elevated between primary and secondary stimulations, it suggests that the prevalence of circulating B cells in the periphery was the result of KLH+ DDA exposure. It was especially intriguing that the BLV PVL significantly increased over time after both the primary and secondary KLH inoculations. BLV primarily infects B cells (5) and prior research found that 66% of CD5+ B cells carried the provirus (16), so these results could indicate that BLV-infected B cells proliferate in response to immune stimulation.
In addition to the total B-cell population, two subpopulations of circulating B cells were tracked. Although CD45R0+ B cells did not change over time, BLV+ cows consistently demonstrated a substantial reduction in the prevalence of CD45R0+ B cells. While CD45R0 expression is better characterized on αβ T cells, its expression on B cells likely indicates either (1) a memory B cell or (2) a differentiating B cell that may become either a memory B cell or a plasma cell (17). The smaller CD45R0+ B-cell population in BLV+ cows at all time points could indicate a deficiency in either developing or maintaining B-cell memory, which would be especially detrimental for any immune response dependent on antibody production. Another concerning result was that the overall B-cell population, and the CD5dim+ B-cell population in particular, in BLV+ cows had lower MHCII surface expression, which could also impair humoral immunity development that is required for isotype switching. Although in this study we did not observe reduced IgG1 or IgG2 antibody production in BLV+ cows, this may be because we only tested a secondary antigen exposure. A previous study has found a reduced IgG2 antibody production in BLV+ cows after repeated vaccination (9).
When examining the CD5+ B-cell compartment, we detected two distinct CD5+ B-cell populations, which we denoted CD5dim+ and CD5bright+. While bovine B cells have been found to contain both a CD5dim population and a CD5bright population (18), most BLV studies have only focused on CD5 expression in total, where CD5+ B cells are the type of B cell that expands in PL cattle (5). However, we kept the CD5dim+ and CD5bright+ B-cell populations distinct because the two populations showed different kinetics after KLH inoculation and there were significant differences in these two cell populations between BLV+ and BLV− cows. While the CD5dim+ B-cell population increased after KLH inoculation, the CD5bright+ B-cell population sharply declined. When comparing BLV+ and BLV− cows, BLV+ cows had an elevated CD5dim+ population, but the CD5bright+ populations were equivalent. Finally, while CD5dim+ B cells from BLV+ cows exhibited higher mean CD5 surface expression, CD5bright+ B cells from BLV+ cows exhibited lower mean CD5 surface expression. It is unclear what functional differences may exist between CD5dim+ and CD5bright+ B cells. CD5 expression on B cells may be a lineage marker for innate-like B cells that produce natural IgM (19), but CD5 expression on B cells may also be induced after stimulation through the B-cell receptor (20), and it is possible that the CD5dim+ and CD5bright+ populations reflect these different patterns of CD5 expression. Our data suggests that the distinction is relevant in the context of BLV infection, but our study was unable elucidate the function of these distinct B-cell subtypes.
We also investigated how B cells responded to KLH stimulation in vitro. While B cells from both BLV+ and BLV− cows showed a minor but significant increase in CD25+ B cells after KLH stimulation, the proportion of CD25+ B cells from BLV+ cows was significantly lower. In addition to the relative percent of CD25+ B cells, CD25+ B cells from BLV+ cows exhibited significantly lower CD25 surface expression after both KLH and P/I stimulations, suggesting that BLV+ cows display less antigen-specific or mitogenic B-cell activation when compared to healthy, BLV− cows. We also questioned whether KLH stimulation would induce BLV protein expression. While P/I stimulation induced BLV gp51 expression as expected (21), KLH stimulation did not. However, it was clear that BLV expression was most common in CD25+ B cells, indicating that BLV gp51 expression is related to B-cell activation. BLV expression was also related to different patterns of MHCII and CD25 surface expression. Under all culture conditions, BLV-expressing B cells had a dramatically increased MHCII surface expression, which was in contrast to MHCII expression observed on B cells ex vivo. Active BLV transcription is rarely detected ex vivo, while even short term in vitro culture can induce detectable BLV protein production (22), which suggests that the BLV protein expression is inducing elevated MHCII expression. In contrast, BLV expression did not affect CD25 surface expression in unstimulated or KLH-stimulated cultures. After P/I stimulation, CD25 surface expression increased only on B cells from BLV− cows or on BLV-expressing B cells from BLV+ cows; the CD25 surface expression on BLV− B cells from BLV+ cows remained unchanged. Overall, our B-cell culture experiments suggest that B cells from BLV+ cows have a reduced responsiveness to antigenic and mitogenic stimulations and this reduced responsiveness is not necessarily dependent on active BLV protein expression.
While the potential effect of BLV infection on B cells is obvious, it is less clear how BLV infection affects the T-cell compartment, although T-cell irregularities have been previously observed (6). We measured the circulating CD45R0+ T-cell populations to investigate effector/memory T cells (23). Both the CD4+ and CD8+ CD45R0+ T-cell populations increased over time after KLH+ DDA stimulation, although the abundance of the cell types was equivalent between BLV+ and BLV− cows. While the γδ+CD45R0+ T-cell population remained mostly constant after KLH+ DDA exposure, BLV+ cows exhibited a large overall reduction in their γδ+CD45R0+ T-cell population. Although γδ+CD45R0+ T cells are not a well-characterized cell population, CD45R0 expression likely indicates current or prior activation, although it is unclear whether this activation would be innate or adaptive or both (24).
We were also interested in investigating IFNγ and IL4 productions in response to KLH stimulation in vitro. While we were unable to detect increased cytokine production in KLH-stimulated cell culture, we found that both CD4+ and CD8+ T-cell populations from BLV+ and BLV− cows were equally responsive to positive control stimulation when measuring IFNγ production. Similar to previous results (10), a significantly higher proportion of γδ+ T cells from BLV+ cows produced IFNγ in cell culture. Surprisingly, while the amount of IFNγ produced by CD4+ and γδ+ T cells was not different between BLV+ and BLV− cows, CD8+ T cells from BLV+ cows did produce significantly higher amounts of IFNγ. When we similarly investigated IL4 production in vitro, we observed directly opposite results. CD4+ and CD8+ T-cell populations from BLV+ cows contained higher proportions of IL4-producting cells under all cell culture conditions; conversely, γδ+ T cells produced IL4 in equivalent proportions between BLV+ and BLV− cows. Finally, while BLV+ cows contained higher proportions of IL4-producing CD8+ T cells in vitro, reactive CD8+ IL4-producing cells from BLV− cows actually produced more IL4 under all culture conditions. This difference in IL4-producing cells versus IL4 expression on a per-cell basis could be a result of suppressed activation in CD8+ T cells from BLV+ cows. While BLV+ cows have a higher proportion of CD8+ T cells producing IL4, it is possible that BLV infection interferes with the degree of activation after CD8+ T cell stimulation, although this was not observed with IFNγ production in CD8+ T cells from BLV+ cows. While IL4 production by CD8+ T cells in cattle is not well-studied, evidence from humans and mice suggest that CD8+ T cells may also be polarized based upon their cytokine secretion and that this cytokine secretion can contribute to the overall balance of a cell-mediated versus humoral immune response (25, 26).
While our experiment was unable to detect any differences in antigen-specific activation in T cells from BLV+ cows, we did detect overall differences in circulating γδ+ T cells and in αβ and γδ+ T-cell cytokine production in vitro. The considerable reduction in circulating CD45R0+γδ+ T cells in BLV+ cows could suggest an impairment of effector or memory γδ+ T cells in BLV+ cows; considering the hypothesized importance of γδ+ T cells in bovine immunity (27), an impairment in this T-cell subtype could have serious consequences on both innate and adaptive immunities in cattle, including reduced responsiveness to vaccination and less immune protection from pathogens including Mycobacterium bovis and Leptospira borgpetersenii serovar Hardjo (28). Our in vitro experiments suggest that αβ T cells in BLV+ cattle could be more predisposed to produce IL4 as compared to αβ T cells from healthy, BLV− cattle. If BLV+ cattle immunity is more skewed toward IL4 over IFNγ production, this could have profound effects upon infections that depend on Th1 versus Th2 immunity for effective pathogen clearance.
This study was conducted to investigate B- and T-cell responses in BLV+ cows to a primary and secondary antigenic immune challenge. While evidence demonstrates that BLV-infected cattle have atypical immunity in comparison to BLV− cows (6), little research has investigated whether BLV+ cows would exhibit abnormal immune responses to a primary challenge, or if abnormal adaptive immunity in BLV+ cattle was the cumulative effect of multiple antigenic challenges. Our study did find antigen-specific deficiencies in B-cell immunity during a primary immune response, indicating that BLV infection can interfere with antigen-specific immunity without many re-exposures to antigen. While we were unable to detect antigen-specific T-cell responses in vitro, we did detect abnormalities in circulating γδ+ T cells in BLV+ cows, as well as a potential bias for IL4-producing αβ T cells. These data demonstrate that BLV infection can have a detectable impact on immune stimulation even upon a primary antigen exposure, which would likely mean that negative impacts of BLV infection on herd health could occur immediately upon a secondary infection.
Ethics Statement
All protocols were reviewed and approved by the Michigan State University Institutional Animal Use and Care Committee (AUF# 04/15-061-00).
Author Contributions
MF led the study and was involved in the study conception, design, execution, analysis, and interpretation of data. MF wrote the manuscript. KS contributed to study design, execution and interpretation of data, and manuscript editing. OB contributed to the study execution and analysis of data and wrote the PVL methods section of the manuscript. JW contributed to the study execution and manuscript editing. CD contributed to the study execution and manuscript editing. PB contributed to the study conception and design and manuscript editing. PC contributed to the study conception, design, and interpretation and manuscript editing.
Conflict of Interest Statement
The authors declare no conflict of interest. NorthStar Cooperative is a for-profit animal agriculture diagnostic company and conducted all diagnostic testing for this study free of charge in exchange for biological samples.
Acknowledgments
The authors gratefully acknowledge the contributions of other members of the Molecular Pathogenesis Laboratory: Hannah Dewald, Marie Wosny, Morgan Jernstadt, and Nikki Mallos. The authors would also like to thank Bradley Abramson from Michigan State University for his technical expertise. Finally, the authors would like to thank Kerry Nobis and the entire team at Nobis Dairy Farms for their invaluable assistance in completing this research. This work was supported by the United States Department of Agriculture and the National Institute of Food and Agriculture (2014-67015-21632, 2014-68004-21881, and 2016-67011-24713), Michigan AgBioResearch, the Michigan Alliance for Animal Agriculture and the Michigan Milk Producers Association.
Supplementary Material
The Supplementary Material for this article can be found online at https://www.frontiersin.org/article/10.3389/fvets.2017.00112/full#supplementary-material.
Figure S1. Gating strategy to determine CD5dim+ and CD5bright+ B cells. To identify CD5+ dim and bright populations, the upper right quadrant was used to denote CD5+ cells. A rectangle gate was used to select CD5bright+ cells, and cells inside the quadrant gate and outside the rectangle gate were determined to be CD5dim+ cells. Representative plots are from fresh labeling on D56 and feature samples from representative BLV− and BLV+ cows.
References
1. Gillet N, Florins A, Boxus M, Burteau C, Nigro A, Vandermeers F, et al. Mechanisms of leukemogenesis induced by bovine leukemia virus: prospects for novel anti-retroviral therapies in human. Retrovirology (2007) 4:18. doi:10.1186/1742-4690-4-18
2. Bartlett PC, Sordillo LM, Byrem TM, Norby B, Grooms DL, Swenson CL, et al. Options for the control of bovine leukemia virus in dairy cattle. J Am Vet Med Assoc (2014) 244:914–22. doi:10.2460/javma.244.8.914
3. Kabeya H, Ohashi K, Onuma M. Host immune responses in the course of bovine leukemia virus infection. J Vet Med Sci (2001) 63:703–8. doi:10.1292/jvms.63.703
4. Bartlett PC, Norby B, Byrem TM, Parmelee A, Ledergerber JT, Erskine RJ. Bovine leukemia virus and cow longevity in Michigan dairy herds. J Dairy Sci (2013) 96:1591–7. doi:10.3168/jds.2012-5930
5. Meirom R, Moss S, Brenner J. Bovine leukemia virus-gp51 antigen expression is associated with CD5 and IgM markers on infected lymphocytes. Vet Immunol Immunopathol (1997) 59:113–9. doi:10.1016/S0165-2427(97)00056-1
6. Frie MC, Coussens PM. Bovine leukemia virus: a major silent threat to proper immune responses in cattle. Vet Immunol Immunopathol (2015) 163:103–14. doi:10.1016/j.vetimm.2014.11.014
7. Emanuelson U, Scherling K, Pettersson H. Relationships between herd bovine leukemia-virus infection status and reproduction, disease incidence, and productivity in Swedish Dairy Herds. Prev Vet Med (1992) 12:121–31. doi:10.1016/0167-5877(92)90075-Q
8. Trainin Z, Brenner J, Meirom R, Ungar-Waron H. Detrimental effect of bovine leukemia virus (BLV) on the immunological state of cattle. Vet Immunol Immunopathol (1996) 54:293–302. doi:10.1016/S0165-2427(96)05706-6
9. Erskine RJ, Bartlett PC, Sabo KM, Sordillo LM. Bovine leukemia virus infection in dairy cattle: effect on serological response to immunization against J5 Escherichia coli bacterin. Vet Med Int (2011) 2011:915747. doi:10.4061/2011/915747
10. Frie MC, Sporer KR, Wallace JC, Maes RK, Sordillo LM, Bartlett PC, et al. Reduced humoral immunity and atypical cell-mediated immunity in response to vaccination in cows naturally infected with bovine leukemia virus. Vet Immunol Immunopathol (2016) 182:125–35. doi:10.1016/j.vetimm.2016.10.013
11. Puentes R, De Brun L, Algorta A, Da Silva V, Mansilla F, Sacco G, et al. Evaluation of serological response to foot-and-mouth disease vaccination in BLV infected cows. BMC Vet Res (2016) 12:119. doi:10.1186/s12917-016-0749-x
12. Panei CJ, Takeshima SN, Omori T, Nunoya T, Davis WC, Ishizaki H, et al. Estimation of bovine leukemia virus (BLV) proviral load harbored by lymphocyte subpopulations in BLV-infected cattle at the subclinical stage of enzootic bovine leucosis using BLV-CoCoMo-qPCR. BMC Vet Res (2013) 9:95. doi:10.1186/1746-6148-9-95
13. Nguyen TK, Koets AP, Santema WJ, van Eden W, Rutten VP, Van Rhijn I. The mycobacterial glycolipid glucose monomycolate induces a memory T cell response comparable to a model protein antigen and no B cell response upon experimental vaccination of cattle. Vaccine (2009) 27:4818–25. doi:10.1016/j.vaccine.2009.05.078
14. Jimba M, Takeshima SN, Matoba K, Endoh D, Aida Y. BLV-CoCoMo-qPCR: quantitation of bovine leukemia virus proviral load using the CoCoMo algorithm. Retrovirology (2010) 7:91. doi:10.1186/1742-4690-7-91
15. Jimba M, Takeshima SN, Murakami H, Kohara J, Kobayashi N, Matsuhashi T, et al. BLV-CoCoMo-qPCR: a useful tool for evaluating bovine leukemia virus infection status. BMC Vet Res (2012) 8:167. doi:10.1186/1746-6148-8-167
16. Mirsky ML, Olmstead CA, Da Y, Lewin HA. The prevalence of proviral bovine leukemia virus in peripheral blood mononuclear cells at two subclinical stages of infection. J Virol (1996) 70:2178–83.
17. McHeyzer-Williams LJ, McHeyzer-Williams MG. Antigen-specific memory B cell development. Annu Rev Immunol (2005) 23:487–513. doi:10.1146/annurev.immunol.23.021704.115732
18. Stabel JR, Khalifeh MS. Differential expression of CD5 on B lymphocytes in cattle infected with Mycobacterium avium subsp. paratuberculosis. Vet Immunol Immunopathol (2008) 126:211–9. doi:10.1016/j.vetimm.2008.07.004
19. Carsetti R, Rosado MM, Wardmann H. Peripheral development of B cells in mouse and man. Immunol Rev (2004) 197:179–91. doi:10.1111/j.0105-2896.2004.0109.x
20. Haas KM, Estes DM. Activation of bovine B cells via surface immunoglobulin M cross-linking or CD40 ligation results in different B-cell phenotypes. Immunology (2000) 99:272–8. doi:10.1046/j.1365-2567.2000.00962.x
21. Jensen WA, Wicks-Beard BJ, Cockerell GL. Inhibition of protein kinase C results in decreased expression of bovine leukemia virus. J Virol (1992) 66:4427–33.
22. Florins A, Gillet N, Asquith B, Boxus M, Burteau C, Twizere JC, et al. Cell dynamics and immune response to BLV infection: a unifying model. Front Biosci (2007) 12:1520–31. doi:10.2741/2165
23. Farber DL, Yudanin NA, Restifo NP. Human memory T cells: generation, compartmentalization and homeostasis. Nat Rev Immunol (2014) 14:24–35. doi:10.1038/nri3567
24. De Maria R, Fais S, Silvestri M, Frati L, Pallone F, Santoni A, et al. Continuous in vivo activation and transient hyporesponsiveness to TcR/CD3 triggering of human gut lamina propria lymphocytes. Eur J Immunol (1993) 23:3104–8. doi:10.1002/eji.1830231209
25. Betts RJ, Kemeny DM. CD8+ T cells in asthma: friend or foe? Pharmacol Ther (2009) 121:123–31. doi:10.1016/j.pharmthera.2008.09.001
26. Kalinski P, Nakamura Y, Watchmaker P, Giermasz A, Muthuswamy R, Mailliard RB. Helper roles of NK and CD8+ T cells in the induction of tumor immunity. Polarized dendritic cells as cancer vaccines. Immunol Res (2006) 36:137–46. doi:10.1385/IR:36:1:137
27. Guzman E, Price S, Poulsom H, Hope J. Bovine gammadelta T cells: cells with multiple functions and important roles in immunity. Vet Immunol Immunopathol (2012) 148:161–7. doi:10.1016/j.vetimm.2011.03.013
Keywords: bovine leukemia virus, memory, CD5+ B cells, gamma delta T cells, CD45R0, IFNγ, IL4, antibody
Citation: Frie MC, Sporer KRB, Benitez OJ, Wallace JC, Droscha CJ, Bartlett PC and Coussens PM (2017) Dairy Cows Naturally Infected with Bovine Leukemia Virus Exhibit Abnormal B- and T-Cell Phenotypes after Primary and Secondary Exposures to Keyhole Limpet Hemocyanin. Front. Vet. Sci. 4:112. doi: 10.3389/fvets.2017.00112
Received: 02 June 2017; Accepted: 29 June 2017;
Published: 14 July 2017
Edited by:
Dirk Werling, Royal Veterinary College, United KingdomReviewed by:
Juan Pablo Jaworski, Consejo Nacional de Investigaciones Científicas y Técnicas (CONICET), ArgentinaKieran G. Meade, Teagasc – The Irish Agriculture and Food Development Authority, Ireland
Copyright: © 2017 Frie, Sporer, Benitez, Wallace, Droscha, Bartlett and Coussens. This is an open-access article distributed under the terms of the Creative Commons Attribution License (CC BY). The use, distribution or reproduction in other forums is permitted, provided the original author(s) or licensor are credited and that the original publication in this journal is cited, in accordance with accepted academic practice. No use, distribution or reproduction is permitted which does not comply with these terms.
*Correspondence: Meredith C. Frie, friemere@msu.edu