Influenza Herd-Level Prevalence and Seasonality in Breed-to-Wean Pig Farms in the Midwestern United States
 Fabian Orlando Chamba Pardo1
 Ana Alba-Casals1
 Joel Nerem2
 Robert B. Morrison1†
Pedro Puig3
Robert B. Morrison1†
Pedro Puig3  Montserrat Torremorell1*
- 1Veterinary Population Medicine Department, University of Minnesota, St. Paul, MN, United States
- 2Pipestone Veterinary Services, Pipestone, MN, United States
- 3Departament de Matemàtiques, Universitat Autònoma de Barcelona, Cerdanyola del Vallès, Barcelona, Spain
Influenza is a costly disease for pig producers and understanding its epidemiology is critical to control it. In this study, we aimed to estimate the herd-level prevalence and seasonality of influenza in breed-to-wean pig farms, evaluate the correlation between influenza herd-level prevalence and meteorological conditions, and characterize influenza genetic diversity over time. A cohort of 34 breed-to-wean farms with monthly influenza status obtained over a 5-year period in piglets prior to wean was selected. A farm was considered positive in a given month if at least one oral fluid tested influenza positive by reverse transcriptase polymerase chain reaction. Influenza seasonality was assessed combining autoregressive integrated moving average (ARIMA) models with trigonometric functions as covariates. Meteorological conditions were gathered from local land-based weather stations, monthly aggregated and correlated with influenza herd-level prevalence. Influenza herd-level prevalence had a median of 28% with a range from 7 to 57% and followed a cyclical pattern with levels increasing during fall, peaking in both early winter (December) and late spring (May), and decreasing in summer. Influenza herd-level prevalence was correlated with mean outdoor air absolute humidity (AH) and temperature. Influenza genetic diversity was substantial over time with influenza isolates belonging to 10 distinct clades from which H1 delta 1 and H1 gamma 1 were the most common. Twenty-one percent of farms had three different clades co-circulating over time, 18% of farms had two clades, and 41% of farms had one clade. In summary, our study showed that influenza had a cyclical pattern explained in part by air AH and temperature changes over time, and highlighted the importance of active surveillance to identify high-risk periods when strategic control measures for influenza could be implemented.
Introduction
Influenza A virus (IAV) is an economically significant pathogen in pig populations and it has been associated with increased mortality (1), increased feed conversion, and decreased daily weight gain in finishing pigs (2, 3). Hence, influenza can decrease US pork producer’s profitability and affect business continuity if strains are linked to human health (4). IAV is part of the porcine respiratory disease complex in pigs together with porcine reproductive and respiratory syndrome virus (PRRSV), Mycoplasma hyopneumoniae, and porcine circovirus type 2 (PCV2).
Breed-to-wean (BTW) pig farms house adult females and their progeny from birth to weaning, which in the USA happens at approximately 21 days of age. BTW farms play a crucial role in influenza epidemiology because piglets can unnoticeably maintain, diversify, and transmit IAV at weaning when they are moved to grow-finish farms (5–7). There is some evidence that IAV infections in pigs are more common in the colder months (8–10) but, in general, information on herd-level prevalence and seasonal distribution of influenza in BTW farms is limited and it is unclear whether seasonality is observed in piglets, given that piglets are born almost daily and for the most part, they are housed in mechanically controlled environments.
There is evidence that certain meteorological conditions such as air temperature and humidity are associated with IAV survivability and transmissibility (11–17). In pigs, indoor-barn air temperature is usually controlled and drives ventilation rates in mechanically ventilated buildings. In contrast, indoor-barn air humidity is not controlled and it depends on outdoor conditions (18). Therefore, meteorological conditions could potentially impact IAV survival and transmission inside swine facilities, which could affect IAV circulation, detection, and prevalence in pig farms.
Intervention strategies to control influenza often reside in the use of vaccines in sows before farrowing (19–21) with the goal to enhance transfer of passive immunity to piglets, decrease risk of infection, and reduce clinical disease presentation (5, 22–27). However, an additional challenge to control influenza is the genetic diversity of strains circulating in pig populations. Co-circulation of genetically distinct viruses is common in pigs in both grow-finish (28–32) and BTW farms (7, 9) which make vaccination difficult to succeed given the limited cross-reactivity among certain strains (33).
In this study, we sought to (i) assess influenza herd-level prevalence and seasonality over time in BTW farms, (ii) investigate the correlation of influenza herd-level prevalence with outdoor air temperature and humidity, and (iii) characterize the genetic diversity of the influenza viruses detected in BTW farms over time. We hypothesize that influenza levels in BTW farms are cyclical and that seasonality can be correlated with certain meteorological conditions. Understanding herd-level prevalence, seasonality, genetic diversity, and meteorological conditions affecting influenza in BTW farms may help guide the allocation and timing of strategies to control influenza in pigs.
Materials and Methods
Ethics Statement
The procedures employed as part of this study were approved by the Institutional Animal Care and Use Committee (IACUC) of the University of Minnesota (Protocol no. 1510-33054A). The participating production system agreed to share influenza testing data with the researchers.
Influenza Active Surveillance Program
Data obtained for this project originated from a swine production system that had been conducting influenza surveillance since 2011 as part of their herd health management program. Briefly, the swine production system had 60 BTW farms located in three Midwestern States (Minnesota, Iowa, and South Dakota). Samples were collected from a representative sample of piglets prior to wean because piglets have been identified as a key subpopulation able to maintain and spread IAV (5–8). The swine production system aimed to collect four monthly oral fluid samples from each farm. Oral fluids were chosen because of better pen-level sensitivity and easiness of collection by farm personnel (34, 35).
Four oral fluid samples aimed to detect a within-herd influenza prevalence of 10% or higher, assuming 100 and 80% diagnostic test specificity and sensitivity, respectively, and 93% within-farm sensitivity (34–36). However, the number of samples collected in a given sampling event ranged between 1 and 7 and the implications for within-farm sensitivity are discussed in Section “Assessment of the Active Surveillance Program.” Followed procedures were also outlined as part of the United States Department of Agriculture (USDA) Influenza Surveillance Program (37).
Collection of oral fluids was performed as described before (36). Briefly, oral fluids were collected from piglets in four farrowing crates choosing one crate per farrowing room. Crates were conveniently selected by farm personnel and the day prior to sample collection, piglets in the selected crates were trained with a different rope to increase the chances of obtaining an oral fluid sample. A cotton rope was hanged in the farrowing crates within reach of the piglets. After the ropes were saturated with oral fluids, the ropes were squeezed into plastic bags to obtain the oral fluid samples that were then refrigerated and submitted to the diagnostic laboratory for IAV testing.
IAV Testing, Isolation, and Sequencing
Oral fluid samples were tested by reverse transcriptase polymerase chain reaction (RT-PCR) targeting the matrix gene of IAV (38). RT-PCR testing was conducted at South Dakota State University Veterinary Diagnostic Laboratory. A sample was considered positive if the cycle threshold (ct) value was 38 or lower. Isolation of influenza in Madin–Darby Canine Kidney (MDCK) cells was attempted in up to two samples per submission with the lowest ct values according to the USDA Influenza Surveillance Program guidelines. When isolates were available, sequencing of the hemagglutinin gene was attempted (37).
Meteorological Data
Meteorological data including outdoor air temperature and relative humidity (RH) was compiled from 14 local land-based stations located near the farms. Hourly meteorological data were gathered from the National Centers for Environmental Information (39), and then data were aggregated monthly to conduct the analysis. Monthly average temperature and RH were calculated by including all available hourly data from all stations each month. Absolute humidity (AH) was calculated using hourly temperature and RH following the equation AH = 2.17 × (pw/T) described by McDevitt et al. (14), where T is the air temperature in kelvin (K) and pw is the partial pressure of water vapor in pascals. pw was calculated using the equation pw = RH × Po, where RH is the air relative humidity and Po is the saturation vapor pressure in pascals. Finally, Po was calculated as follows: Po = exp[(−5,800/T) + 1.391 − 0.04868 × T + 4.176 × 10⁻⁵ × T2 − 1.445 × 10⁻⁸ × T3 + 6.546 × lnT], where T is the air temperature in K and lnT is the natural logarithm of T (14). AH is reported in grams of water per cubic meter of air (g/m3). AH data were also averaged monthly including data from all stations.
Data Analysis
Assessment of the Active Surveillance Program
In order to characterize the sensitivity of the surveillance program, the number of monthly oral fluid samples submitted per farm, and the number of positive and total submissions per farm were analyzed. Moreover, the within-farm sensitivity to detect IAV circulation was assessed for each sampling. The within-farm sensitivity was computed using the actual number of oral fluids in each sampling by assuming (a) a within-farm influenza prevalence of 10%, (b) nine piglets chewed the rope in each crate in 30 min (pool size) (40), and (c) a diagnostic sensitivity and specificity for influenza RT-PCR detection in oral fluids of 80% and 100%, respectively (35). The within-farm sensitivity was computed using the Sep.pooled function of the Rsurveillance package (41) in R 3.2.3 statistical software (42). Overall, we estimate that we needed at least three oral fluids per submission in order to achieve a within-farm sensitivity of 87%.
Influenza Herd-Level Prevalence and Seasonality Analysis
Only those farms that had at least 30 monthly submissions with estimated within-farm sensitivity of at least 87% were included in the time series analysis. The selected level of within-farm sensitivity was chosen in order to achieve a high and uniform level of confidence of the within-farm influenza detection. Influenza monthly herd-level prevalence was estimated by dividing the number of positive farms by the total number of farms submitting in a given month.
Initially, the monthly herd-level prevalence was analyzed using basic statistics and plots. Prevalence was logit transformed to stabilize the variance and normalize the distribution (43). The pattern of influenza herd-level prevalence was evaluated using additive decompositions and classical time series models. Autoregressive integrated moving average (ARIMA) models combined with time as a trend covariate, and trigonometric functions such as sine and cosines (Fourier functions) at different time intervals as covariates were used to assess influenza trend and seasonality. ARIMA models per se assume no trend and seasonality (stationary series). However, the combined models allowed us to account and test for trend and seasonality of the influenza herd-level prevalence.
All tested models were fitted using the logit transformed data (44, 45). Several combinations of the trend and trigonometric functions were tested at 3-, 4-, 6-, 12-, and 24-month intervals as linear regression models. Trend, sine, and cosine functions that were significant (p < 0.05) were kept for the combined models. Several combined models were tested with different ARIMA models. Model selection was based on parsimony using the lowest Bayesian Information criterion (BIC) as a goodness-of-fit criteria, including residual inspection to ensure lack of autocorrelation through autocorrelation function (ACF) and partial autocorrelation function (PACF) plots. Error distribution plots were checked for normality. These analyses were computed using the R base package and the forecast package (46) in R 3.2.3 statistical software (42).
The final combined model was an ARIMA (0, 0, 3) plus sine and cosine functions for 6- and 12-month periods (annual and semiannual cycles). The final model after the logit transformation can be expressed as follows:
where Yt is the logit transformed monthly herd-level prevalence, μ is the intercept, αi is the coefficients of the moving average, ϵt− i is the error terms of the ARIMA model, and βi is the coefficients of the trigonometric functions: , where Ti is the number of months (period) for which seasonality was tested and ϵt is the error term of the trigonometric functions model.
Meteorological Data and Influenza Herd-Level Prevalence Correlation
To explore the correlation between monthly herd-level prevalence and meteorological conditions, specifically ambient air temperature, RH, and AH, we used the cross-correlation function (ccf) in the R base package and the lag2.plot function in the astsa package (47) at different time lags. Lag correlation coefficient p-values were obtained using the pnorm function of the R base package. The above-described statistical analysis was done using R 3.2.3 statistical software (42). Although at first it may appear redundant to link both temperature and AH to prevalence, AH is a function of both temperature and RH which does not always have to fluctuate in the same direction as temperature.
Influenza Genetic Diversity Analysis
Hemagglutinin gene (HA) sequences were annotated for completeness and functionality using the influenza virus sequence annotation tool (FLAN)1 (48). H1 clade classification was done using the swine H1 clade classification tool in the Influenza Research Database (IRD)2 (49).
For H3 cluster classification, reference strains were obtained from the Influenza Virus Resource at the National Center for Biotechnology Information (NCBI)3 (50). Included H3 reference strains were under the following GenBank reference numbers: JX092535 (H3 IV C), JX092307 (H3 IV D), JN652493 (H3 IV F), JN638733 (H3 IV A), JF812276 (H3 IV E), CY114592 (H3 IV B), CY095675 (H3 I), CY006475 (H3 III), CY002120 (H3 II), and KC306165 (H3 humSea11).
Alignment of 1,698-nucleotide-length HA sequences was done using the ClustalW algorithm. Phylogenetic trees were generated using a neighbor joining method and a Hasegawa, Kishino, and Yano (HKY) substitution model in Geneious version 8.1.84 (51). H3 cluster was inferred according to the clustering of each isolate in the corresponding trees.
Results
Influenza Active Surveillance Program Assessment
From July 2011 to April 2016, there were 58 months of data and 60 BTW pig farms that submitted samples as part of the company influenza surveillance program. The median size of the selected farms was 3,125 sows ranging from 1,200 to 6,000. There were 2,105 diagnostic submissions with a total of 7,778 oral fluids. The number of oral fluids per submission varied from 1 to 7 and the estimated within-farm sensitivity varied from 49 to 100%. Lastly, a total of 34 farms that had both at least 30 submissions and a within-farm sensitivity of 87% or higher (three or more oral fluids per submission) were selected and included in the seasonality analysis.
From the 34 selected farms, there were 1,523 submissions with a total of 6,585 oral fluids. The number of oral fluids per submission varied from 3 to 7 with a median of 4 and an interquartile range (IQR) of 0. The median number of submissions per farm was 47 (IQR = 10) with a range from 30 to 55. Median positive submissions per farm were 12 (IQR = 8) ranging from 3 to 34. Moreover, there were 28% (424/1,523) of submissions with at least one influenza positive result. All farms tested positive at least once during the study period. Finally, the within-farm sensitivity had a median of 93% (IQR = 0) and varied from 87 to 99%.
Seasonality of Influenza Herd-Level Prevalence
Influenza herd-level prevalence varied over time. Prevalence of influenza had a median of 28% (IQR = 18%) with a range from 7 to 57%, as shown in Figure 1. Influenza herd-level prevalence showed a seasonal pattern that was repeated on a yearly basis. The seasonality analysis showed that the herd-level prevalence had annual and semiannual cycles that were detected with the sine and cosine functions at 6- and 12-month periods in the final combined model as described above (p < 0.05). Prevalence was low in summer, rose during fall, and peaked twice in both early winter (December) and late spring (May). August was the month with the lowest prevalence. Figure 2 shows the seasonality of influenza herd-level prevalence as observed and as predicted after considering the combined final model that included the significant seasonal functions as predictors.
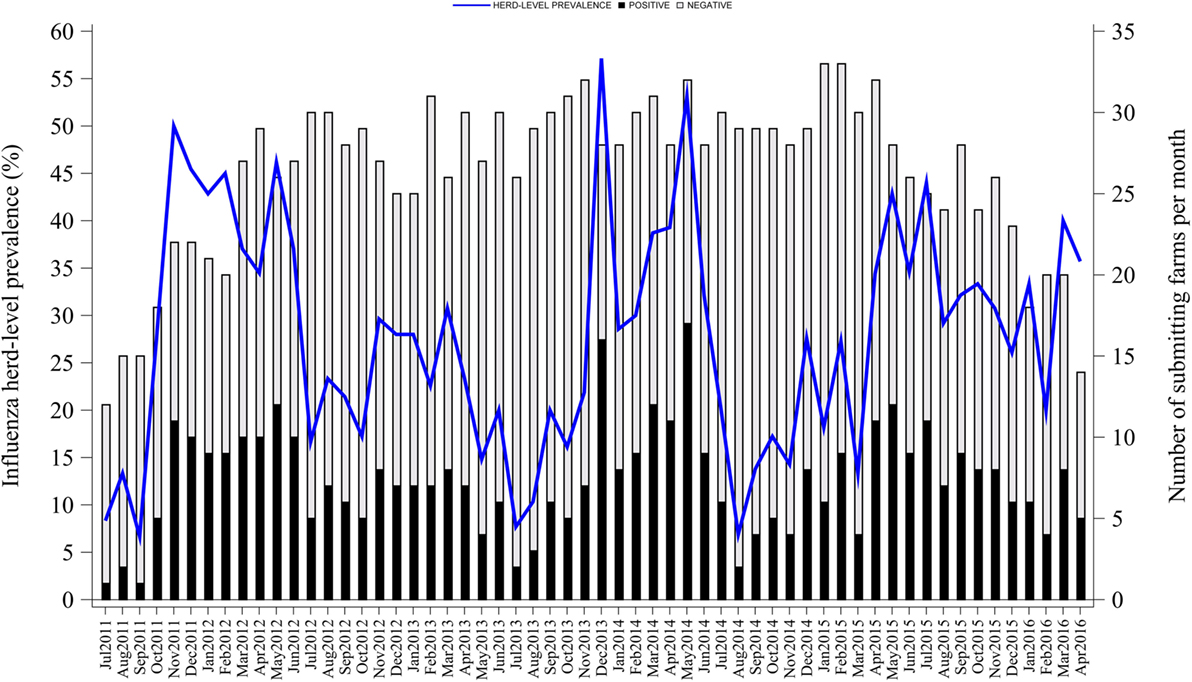
Figure 1. Influenza A virus herd-level prevalence in breed-to-wean pig farms.
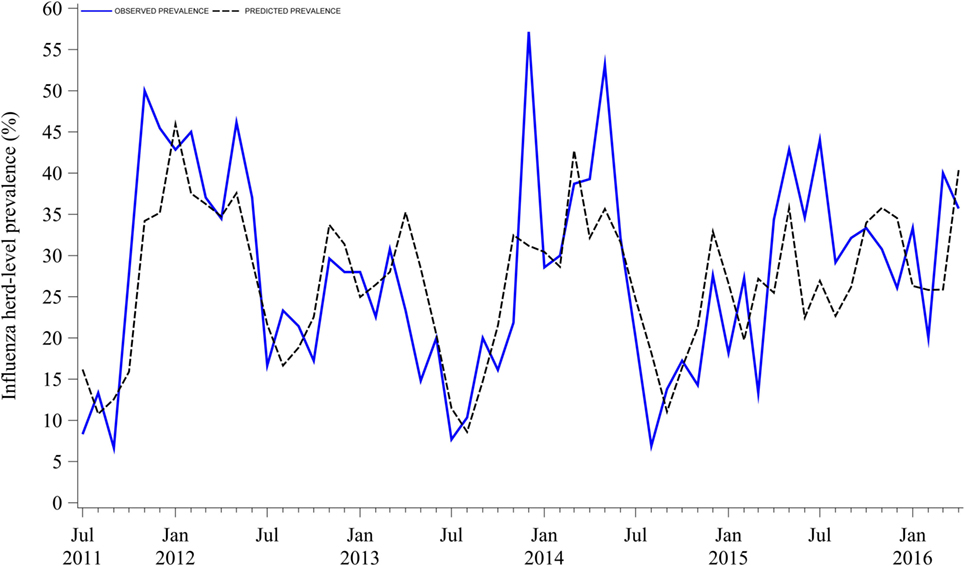
Figure 2. Observed and predicted seasonality of influenza A virus herd-level prevalence in breed-to-wean pig farms.
Meteorological Conditions and Influenza Herd-Level Prevalence
Mean outdoor air temperature and AH were negatively correlated with herd-level prevalence. Influenza herd-level prevalence was higher when both mean outdoor air temperature and AH were lower. Indeed, temperature and AH variations that happened earlier at 0, −1, and −2 months were statistically correlated with the influenza herd-level prevalence of a given month, as shown in Table 1 and Figure 3. The lag correlation coefficients varied between −0.28 and −0.43 for both temperature and AH at lags from 0 to −3 months. Lastly, mean outdoor air RH was not correlated with influenza herd-level prevalence at the tested lag months, as shown in Table 1 and Figure 3.
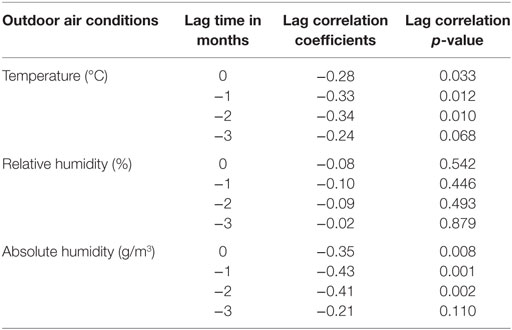
Table 1. Lag correlation between influenza A virus herd-level prevalence and meteorological conditions.
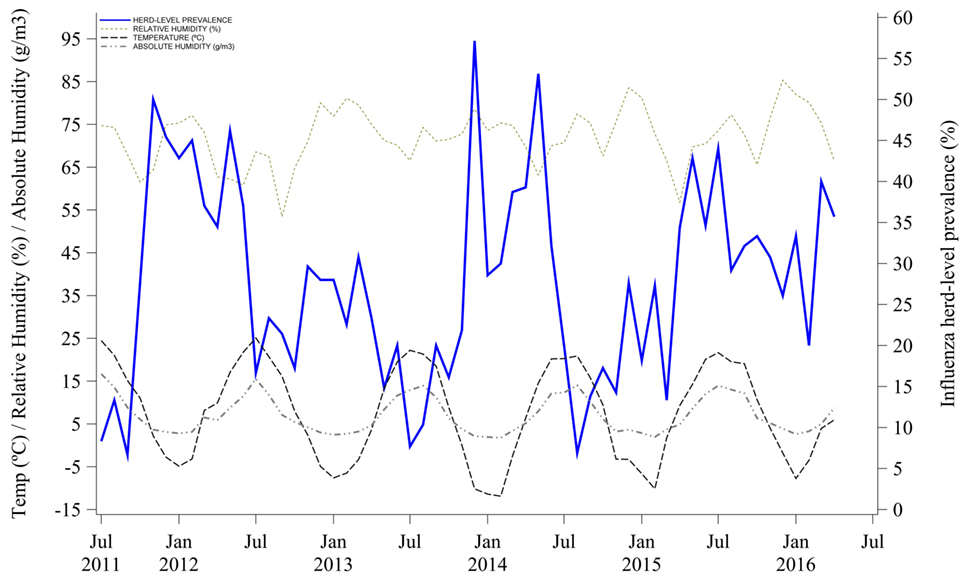
Figure 3. Correlation of meteorological conditions and influenza A virus herd-level prevalence.
Influenza Co-Circulation and Genetic Diversity at the System Level
Eighty-five (20%) influenza isolates from 424 positive submissions were obtained from the 34 selected farms. Isolates were distinct genetically and grouped into 10 different clades or clusters of H1 and H3 subtypes that are contemporary in North American swine populations. The most common clades identified were H1 delta 1 (40%, 34/85), H1 gamma 1 (21%, 18/85), and clusters H3 IV A (12%, 10/85) and H3 IV B (11%, 9/85).
Furthermore, 21% (7/34) of the farms had 3 different influenza genetic clades circulating during the study period, 18% (6/34) had 2, 41% (14/34) had 1, and the remaining 20% (7/34) of farms had no isolates available to further characterize influenza. The genetic diversity and frequency of the influenza isolates obtained over time are presented in Figure 4.
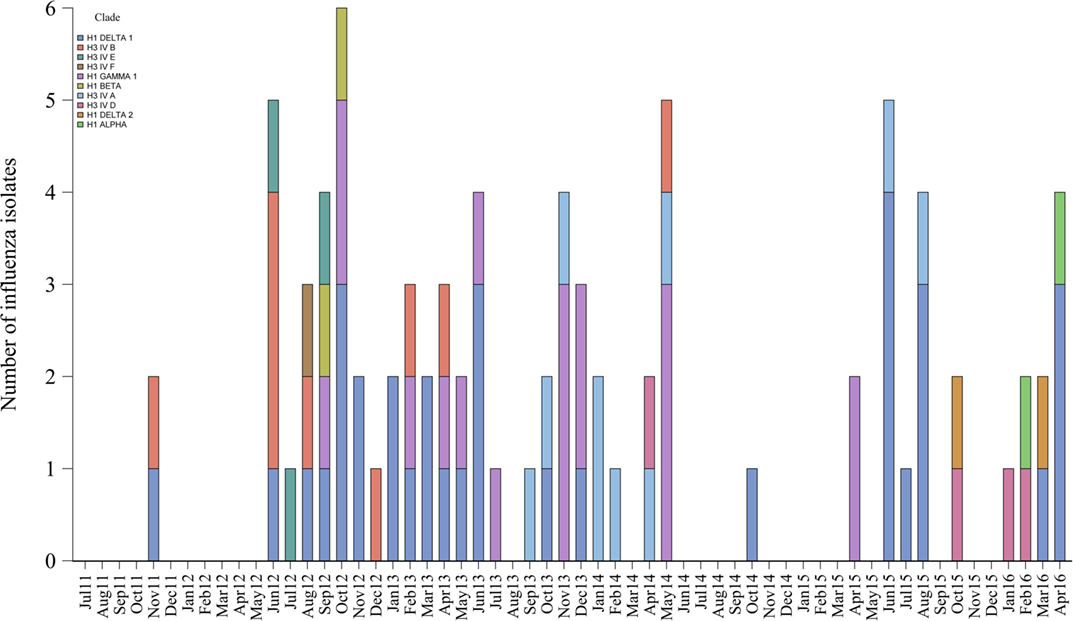
Figure 4. Genetic classification and frequency of influenza A virus isolates over time.
Discussion
Understanding the temporal dynamics and genetic diversity of influenza in BTW farms is central to control influenza infections in pigs. In this study, we assessed influenza herd-level prevalence, seasonality, and strain distribution in Midwestern BTW farms belonging to one production system. The farms sampled were considered representative of the region, given the similarities across commercial farms in the Midwest and the large number of farms managed by the production company in the study. Influenza infections were widespread and seasonal with infection peaks in both winter and spring. The seasonal pattern was partially explained by air temperature and AH, and there was significant co-circulation of genetically distinct strains over time. To the knowledge of the authors, this is the first time that influenza herd-level prevalence and seasonality in swine has been assessed based on an active surveillance program.
Influenza seasonality in BTW farms is epidemiologically significant because BTW farms supply pigs at weaning. Weaned pigs are commonly transported to distant locations, which represents a risk for influenza dissemination to grow-finish farms (6, 9, 52). Our results targeting the sampling of piglets showed the highest herd-level prevalence in December and May, which is slightly different and after the peaks in October/November and April/May reported in other studies based on the number of positive diagnostic laboratory submissions (53–56) and short-time investigations (8–10, 28). Differences on the age of pigs sampled, geographical regions, climatic conditions, immune status, management practices, sampling strategies, introduction of new strains by replacement females, and/or farm personnel and lack of precision in model predictions used in the studies may explain the differences among the reported studies (57–59).
It is also important to note that our study was based on an active surveillance program with a standardized sampling procedure and high within-farm sensitivity for influenza detection across the participating farms. However, the assumption that nine pigs (pool size) contributed to one oral fluid sample may have overestimated the within-farm sensitivity for a within-farm prevalence of 10% or higher. Given that there are no data available on how many suckling piglets will chew a rope in 30 min, and the fact that piglets were trained to chew the rope before collection (36), we feel that the assumptions to calculate the within-farm sensitivity are logical. Within-farm sensitivity estimates using a pool size of 7 and 8 would still be 80% or higher to detect a within-farm prevalence of 10% or higher and considering three or more oral fluid samples (results not shown). Finally, a BTW farm that tested negative means that within-farm prevalence was lower than 10% considering our sampling approach.
Although the seasonal pattern was repeatable across the 5 years of study, herd-level prevalence varied between years perhaps because of differences in herd immunity, management strategies, or introduction of novel strains through female replacements and/or farm personnel. Analysis of the effect of these factors on herd-level prevalence was beyond the scope of this study. Nevertheless, the consistent seasonal pattern described in these farms can serve as a guide for producers and veterinarians to allocate control strategies to mitigate the spread of influenza.
Influenza seasonality in people and birds has been attributed to seasonal variations in temperature and humidity (12, 15, 60–65). Both temperature and AH have been associated with influenza survivability and transmissibility (11, 14–18, 66–69). In our study, we observed an association between influenza herd-level prevalence and outdoor air temperature and AH. Although the correlation was considered low, seasonal changes in air AH and temperature appeared to partially explain influenza circulation in the studied farms. The mechanism behind this correlation is unclear, given that pigs are housed indoor in mechanically controlled environments. However, given that ventilation controls are set based on ambient temperature, we speculate that outdoor conditions can have an effect on influenza circulation inside facilities. Indeed, ventilation rates may act as a surrogate for outdoor environmental conditions but unfortunately, we had no data on ventilation rates to evaluate whether there was a direct association between ventilation rates and influenza herd-level prevalence. Further studies should investigate this potential association.
The genetic diversity and frequency of influenza isolates was significant despite the low yield of virus isolates obtained from oral fluids, which is known to be a poor sample to measure viral viability (34–36, 70–72). The isolates clustered in 10 genetically distinct hemagglutinin clades or clusters that were contemporary and similar to the ones reported by the USDA influenza surveillance program (53, 56, 73–76). In our study, we could not establish an association between the seasonal peak of infection and the detection of new strains likely because of the limited number of isolates recovered from each farm. This is a question that remains to be answered in future studies.
Furthermore, there were multiple farms that had more than one genetically distinct influenza virus. The co-circulation of different influenza strains in swine farms has been documented before (7, 9, 28), and our results support those studies and illustrate the difficulty to control influenza in BTW farms. The detected co-circulation is relevant because it suggests that comprehensive vaccination approaches that consider the broad genetic diversity are needed to control influenza in swine populations (75).
In summary, influenza herd-level prevalence in Midwestern BTW pig farms had a seasonal pattern with higher levels of influenza in winter and spring months. Seasonality was partially explained by air temperature and AH, although other factors may have played a role in the observed trends. Finally, our results evidenced the co-circulation of genetically diverse influenza viruses over time and highlighted the challenge that this represents for the control of influenza in pigs.
Author Contributions
FCP gathered data for the study, conducted data analysis, and prepared the manuscript. JN coordinated sample submission and testing. AA-C and PP contributed to the statistical analysis. RM contributed to the results interpretation and manuscript preparation. MT conceived and supervised the study and reviewed, edited, and approved the manuscript.
Conflict of Interest Statement
The authors declare that the research was conducted in the absence of any commercial or financial relationships that could be construed as a potential conflict of interest.
Acknowledgments
We thank Pipestone Veterinary Services for their assistance and technical contribution to this project. A word of thanks also goes to Aaron Rendahl and Amanda Fernandez Fontelo for their help in the statistical analysis.
Funding
This study was funded by the Minnesota Rapid Agricultural Response Funding (RARF). The funders had no role in study design, data collection and analysis, decision to publish, or preparation of the manuscript.
Footnotes
References
1. Alvarez J, Sarradell J, Kerkaert B, Bandyopadhyay D, Torremorell M, Morrison R, et al. Association of the presence of influenza A virus and porcine reproductive and respiratory syndrome virus in sow farms with post-weaning mortality. Prev Vet Med (2015) 121(3–4):240–5. doi:10.1016/j.prevetmed.2015.07.003
2. Er C, Skjerve E, Brun E, Hofmo PO, Framstad T, Lium B. Production impact of influenza A(H1N1)pdm09 virus infection on fattening pigs in Norway. J Anim Sci (2016) 94(2):751–9. doi:10.2527/jas.2015-9251
3. Er C, Lium B, Tavornpanich S, Hofmo PO, Forberg H, Hauge AG, et al. Adverse effects of influenza A(H1N1)pdm09 virus infection on growth performance of Norwegian pigs––a longitudinal study at a boar testing station. BMC Vet Res (2014) 10:284. doi:10.1186/s12917-014-0284-6
4. Howden KJ, Brockhoff EJ, Caya FD, McLeod LJ, Lavoie M, Ing JD, et al. An investigation into human pandemic influenza virus (H1N1) 2009 on an Alberta swine farm. Can Vet J (2009) 50(11):1153–61.
5. Corzo CA, Allerson M, Gramer M, Morrison RB, Torremorell M. Detection of airborne influenza a virus in experimentally infected pigs with maternally derived antibodies. Transbound Emerg Dis (2014) 61(1):28–36. doi:10.1111/j.1865-1682.2012.01367.x
6. Allerson MW, Davies PR, Gramer MR, Torremorell M. Infection dynamics of pandemic 2009 H1N1 influenza virus in a two-site swine herd. Transbound Emerg Dis (2014) 61(6):490–9. doi:10.1111/tbed.12053
7. Diaz A, Marthaler D, Culhane M, Sreevatsan S, Alkhamis M, Torremorell M. Complete genome sequencing of influenza A viruses within swine farrow-to-wean farms reveals the emergence, persistence, and subsidence of diverse viral genotypes. J Virol (2017) 91(18):e745–717. doi:10.1128/JVI.00745-17
8. Diaz A, Perez A, Sreevatsan S, Davies P, Culhane M, Torremorell M. Association between influenza A virus infection and pigs subpopulations in endemically infected breeding herds. PLoS One (2015) 10(6):e0129213. doi:10.1371/journal.pone.0129213
9. Kaplan BS, DeBeauchamp J, Stigger-Rosser E, Franks J, Crumpton JC, Turner J, et al. Influenza virus surveillance in coordinated swine production systems, United States. Emerg Infect Dis (2015) 21(10):1834–6. doi:10.3201/eid2110.140633
10. Kyriakis CS, Rose N, Foni E, Maldonado J, Loeffen WL, Madec F, et al. Influenza A virus infection dynamics in swine farms in Belgium, France, Italy and Spain, 2006–2008. Vet Microbiol (2013) 162(2–4):543–50. doi:10.1016/j.vetmic.2012.11.014
11. Guan J, Chan M, VanderZaag A. Inactivation of avian influenza viruses on porous and non-porous surfaces is enhanced by elevating absolute humidity. Transbound Emerg Dis (2017) 64(4):1254–61. doi:10.1111/tbed.12499
12. Lowen AC, Steel J. Roles of humidity and temperature in shaping influenza seasonality. J Virol (2014) 88(14):7692–5. doi:10.1128/JVI.03544-13
13. Steel J, Palese P, Lowen AC. Transmission of a 2009 pandemic influenza virus shows a sensitivity to temperature and humidity similar to that of an H3N2 seasonal strain. J Virol (2011) 85(3):1400–2. doi:10.1128/JVI.02186-10
14. McDevitt J, Rudnick S, First M, Spengler J. Role of absolute humidity in the inactivation of influenza viruses on stainless steel surfaces at elevated temperatures. Appl Environ Microbiol (2010) 76(12):3943–7. doi:10.1128/AEM.02674-09
15. Shaman J, Kohn M. Absolute humidity modulates influenza survival, transmission, and seasonality. Proc Natl Acad Sci U S A (2009) 106(9):3243–8. doi:10.1073/pnas.0806852106
16. Lowen AC, Steel J, Mubareka S, Palese P. High temperature (30 degrees C) blocks aerosol but not contact transmission of influenza virus. J Virol (2008) 82(11):5650–2. doi:10.1128/JVI.00325-08
17. Lowen AC, Mubareka S, Steel J, Palese P. Influenza virus transmission is dependent on relative humidity and temperature. PLoS Pathog (2007) 3(10):1470–6. doi:10.1371/journal.ppat.0030151
18. Koep TH, Enders FT, Pierret C, Ekker SC, Krageschmidt D, Neff KL, et al. Predictors of indoor absolute humidity and estimated effects on influenza virus survival in grade schools. BMC Infect Dis (2013) 13(1):71. doi:10.1186/1471-2334-13-71
19. White LA, Torremorell M, Craft ME. Influenza A virus in swine breeding herds: combination of vaccination and biosecurity practices can reduce likelihood of endemic piglet reservoir. Prev Vet Med (2017) 138:55–69. doi:10.1016/j.prevetmed.2016.12.013
20. Reynolds JJ, Torremorell M, Craft ME. Mathematical modeling of influenza A virus dynamics within swine farms and the effects of vaccination. PLoS One (2014) 9(8):e106177. doi:10.1371/journal.pone.0106177
21. USDA. Swine 2012. Part II: Reference of Swine Health and Health Management in the United States, 2012. Fort Collins, CO: USDA–APHIS–VS–CEAH–NAHMS (2017). Available from: https://www.aphis.usda.gov/aphis/ourfocus/animalhealth/monitoring-and-surveillance/nahms/nahms_swine_studies
22. Cador C, Herve S, Andraud M, Gorin S, Paboeuf F, Barbier N, et al. Maternally-derived antibodies do not prevent transmission of swine influenza A virus between pigs. Vet Res (2016) 47(1):86. doi:10.1186/s13567-016-0365-6
23. Choi YK, Goyal SM, Joo HS. Evaluation of transmission of swine influenza type A subtype H1N2 virus in seropositive pigs. Am J Vet Res (2004) 65(3):303–6. doi:10.2460/ajvr.2004.65.303
24. Loeffen WL, Heinen PP, Bianchi AT, Hunneman WA, Verheijden JH. Effect of maternally derived antibodies on the clinical signs and immune response in pigs after primary and secondary infection with an influenza H1N1 virus. Vet Immunol Immunopathol (2003) 92(1–2):23–35. doi:10.1016/S0165-2427(03)00019-9
25. Sandbulte MR, Platt R, Roth JA, Henningson JN, Gibson KA, Rajao DS, et al. Divergent immune responses and disease outcomes in piglets immunized with inactivated and attenuated H3N2 swine influenza vaccines in the presence of maternally-derived antibodies. Virology (2014) 46(4–465):45–54. doi:10.1016/j.virol.2014.06.027
26. Renshaw HW. Influence of antibody-mediated immune suppression on clinical, viral, and immune responses to swine influenza infection. Am J Vet Res (1975) 36(1):5–13.
27. Kitikoon P, Nilubol D, Erickson BJ, Janke BH, Hoover TC, Sornsen SA, et al. The immune response and maternal antibody interference to a heterologous H1N1 swine influenza virus infection following vaccination. Vet Immunol Immunopathol (2006) 112(3–4):117–28. doi:10.1016/j.vetimm.2006.02.008
28. Corzo CA, Culhane M, Juleen K, Stigger-Rosser E, Ducatez MF, Webby RJ, et al. Active surveillance for influenza A virus among swine, Midwestern United States, 2009–2011. Emerg Infect Dis (2013) 19(6):954–60. doi:10.3201/eid1906.121637
29. Rose N, Herve S, Eveno E, Barbier N, Eono F, Dorenlor V, et al. Dynamics of influenza A virus infections in permanently infected pig farms: evidence of recurrent infections, circulation of several swine influenza viruses and reassortment events. Vet Res (2013) 44:72. doi:10.1186/1297-9716-44-72
30. Simon-Grife M, Martin-Valls GE, Vilar MJ, Busquets N, Mora-Salvatierra M, Bestebroer TM, et al. Swine influenza virus infection dynamics in two pig farms; results of a longitudinal assessment. Vet Res (2012) 43:24. doi:10.1186/1297-9716-43-24
31. Loeffen WL, Hunneman WA, Quak J, Verheijden JH, Stegeman JA. Population dynamics of swine influenza virus in farrow-to-finish and specialised finishing herds in the Netherlands. Vet Microbiol (2009) 137(1–2):45–50. doi:10.1016/j.vetmic.2009.01.004
32. Loeffen WLA, Nodelijk G, Heinen PP, van Leengoed LAMG, Hunneman WA, Verheijden JHM. Estimating the incidence of influenza-virus infections in Dutch weaned piglets using blood samples from a cross-sectional study. Vet Microbiol (2003) 91(4):295–308. doi:10.1016/S0378-1135(02)00306-1
33. Kitikoon P, Gauger PC, Anderson TK, Culhane MR, Swenson S, Loving CL, et al. Swine influenza virus vaccine serologic cross-reactivity to contemporary US swine H3N2 and efficacy in pigs infected with an H3N2 similar to 2011–2012 H3N2v. Influenza Other Respi Viruses (2013) 7(Suppl 4):32–41. doi:10.1111/irv.12189
34. Goodell CK, Prickett J, Kittawornrat A, Zhou F, Rauh R, Nelson W, et al. Probability of detecting influenza A virus subtypes H1N1 and H3N2 in individual pig nasal swabs and pen-based oral fluid specimens over time. Vet Microbiol (2013) 166(3–4):450–60. doi:10.1016/j.vetmic.2013.06.029
35. Romagosa A, Gramer M, Joo HS, Torremorell M. Sensitivity of oral fluids for detecting influenza A virus in populations of vaccinated and non-vaccinated pigs. Influenza Other Respi Viruses (2012) 6(2):110–8. doi:10.1111/j.1750-2659.2011.00276.x
36. Panyasing Y, Goodell C, Kittawornrat A, Wang C, Levis I, Desfresne L, et al. Influenza A virus surveillance based on pre-weaning piglet oral fluid samples. Transbound Emerg Dis (2016) 63(5):e328–38. doi:10.1111/tbed.12307
37. USDA. Swine Influenza Surveillance. Riverdale, MD: USDA-APHIS-AH-ADI-SH (2017). Available from: https://www.aphis.usda.gov/aphis/ourfocus/animalhealth/animal-disease-information/swine-disease-information/ct_siv_surveillance
38. Zhang J, Harmon KM. RNA extraction from swine samples and detection of influenza A virus in swine by real-time RT-PCR. In: Spackman E, editor. Animal Influenza Virus. Methods Mol Biol. 1161. New York, US: Humana Press (2014). p. 277–93.
39. Local Climatological Data (LCD). National Oceanic and Atmospheric Administration. (2016). Available from: http://www.ncdc.noaa.gov/cdo-web/datatools/lcd
40. Dron N, Doyle R, Jover-Hernandez M, Holyoake T. Detection of Actinobacillus Pleuropneumoniae in Pigs Using Pooled Oral Fluids. Australia: Co-Operative Research Centre for High Integrity Australian Pork (2012).
41. Evan S. RSurveillance: Design and Analysis of Disease Surveillance Activities. RSurveillance. 0.2.0 ed. Sydney, Australia: Sergeant Evan (2016).
42. Team RC. R: A Language and Environment for Statistical Computing. R Statisitical Software. 3.2.3 ed. Vienna, Austria: R Foundation for Statistical Computing (2015).
43. Barceló-Vidal C, Aguilar L, editors. Time Series of Proportions: A Compositional Approach. 25th International Workshop on Statistical Modelling. Glasgow, Scotland (2010).
44. Alba A, Dorea FC, Arinero L, Sanchez J, Cordon R, Puig P, et al. Exploring the surveillance potential of mortality data: nine years of bovine fallen stock data collected in Catalonia (Spain). PLoS One (2015) 10(4):e0122547. doi:10.1371/journal.pone.0122547
45. Barceló-Vidal C, Aguilar L, Martın-Fernández J, editors. Compositional Time Series: A First Approach. Proceedings of the 22nd International Workshop of Statistical Modelling. Barcelona, Spain (2007).
46. Hyndman R. Forecast: Forecasting Functions for Time Series and Linear Models. 7.0 ed. Melbourne, Australia: Hyndman, RJ (2016).
47. Stoffer D. Astsa: Applied Statistical Time Series Analysis. 1.6 ed. Pittsburgh, PA: David Stoffer (2016).
48. Bao Y, Bolotov P, Dernovoy D, Kiryutin B, Tatusova T. FLAN: a web server for influenza virus genome annotation. Nucleic Acids Res (2007) 35(Web Server issue):W280–4. doi:10.1093/nar/gkm354
49. Squires RB, Noronha J, Hunt V, Garcia-Sastre A, Macken C, Baumgarth N, et al. Influenza research database: an integrated bioinformatics resource for influenza research and surveillance. Influenza Other Respi Viruses (2012) 6(6):404–16. doi:10.1111/j.1750-2659.2011.00331.x
50. Bao Y, Bolotov P, Dernovoy D, Kiryutin B, Zaslavsky L, Tatusova T, et al. The influenza virus resource at the National Center for Biotechnology Information. J Virol (2008) 82(2):596–601. doi:10.1128/JVI.02005-07
51. Kearse M, Moir R, Wilson A, Stones-Havas S, Cheung M, Sturrock S, et al. Geneious basic: an integrated and extendable desktop software platform for the organization and analysis of sequence data. Bioinformatics (2012) 28(12):1647–9. doi:10.1093/bioinformatics/bts199
52. Nelson MI, Viboud C, Vincent AL, Culhane MR, Detmer SE, Wentworth DE, et al. Global migration of influenza A viruses in swine. Nat Commun (2015) 6:6696. doi:10.1038/ncomms7696
53. Anderson TK, Nelson MI, Kitikoon P, Swenson SL, Korslund JA, Vincent AL. Population dynamics of cocirculating swine influenza A viruses in the United States from 2009 to 2012. Influenza Other Respi Viruses (2013) 7(Suppl 4):42–51. doi:10.1111/irv.12193
54. Beaudoin A, Johnson S, Davies P, Bender J, Gramer M. Characterization of influenza a outbreaks in Minnesota swine herds and measures taken to reduce the risk of zoonotic transmission. Zoonoses Public Health (2012) 59(2):96–106. doi:10.1111/j.1863-2378.2011.01423.x
55. Poljak Z, Carman S, McEwen B. Assessment of seasonality of influenza in swine using field submissions to a diagnostic laboratory in Ontario between 2007 and 2012. Influenza Other Respi Viruses (2014) 8(4):482–92. doi:10.1111/irv.12248
56. USDA. Influenza A Virus in Swine Surveillance. Riverdale, MD: USDA-APHIS-AH-ADI-SH (2017). Available from: https://www.aphis.usda.gov/aphis/ourfocus/animalhealth/animal-disease-information/swine-disease-information/ct_swine_health_monitoring_surveillance
57. Romagosa A, Allerson M, Gramer M, Joo HS, Deen J, Detmer S, et al. Vaccination of influenza a virus decreases transmission rates in pigs. Vet Res (2011) 42:120. doi:10.1186/1297-9716-42-120
58. Allerson M, Deen J, Detmer SE, Gramer MR, Joo HS, Romagosa A, et al. The impact of maternally derived immunity on influenza A virus transmission in neonatal pig populations. Vaccine (2013) 31(3):500–5. doi:10.1016/j.vaccine.2012.11.023
59. Markowska-Daniel I, Pomorska-Mol M, Pejsak Z. The influence of age and maternal antibodies on the postvaccinal response against swine influenza viruses in pigs. Vet Immunol Immunopathol (2011) 142(1–2):81–6. doi:10.1016/j.vetimm.2011.03.019
60. Shaman J, Pitzer VE, Viboud C, Grenfell BT, Lipsitch M. Absolute humidity and the seasonal onset of influenza in the continental United States. PLoS Biol (2010) 8(2):e1000316. doi:10.1371/journal.pbio.1000316
61. Zhang Y, Feng C, Ma C, Yang P, Tang S, Lau A, et al. The impact of temperature and humidity measures on influenza A (H7N9) outbreaks-evidence from China. Int J Infect Dis (2015) 30:122–4. doi:10.1016/j.ijid.2014.11.010
62. Metz JA, Finn A. Influenza and humidity––why a bit more damp may be good for you! J Infect (2015) 71(Suppl 1):S54–8. doi:10.1016/j.jinf.2015.04.013
63. Jaakkola K, Saukkoriipi A, Jokelainen J, Juvonen R, Kauppila J, Vainio O, et al. Decline in temperature and humidity increases the occurrence of influenza in cold climate. Environ Health (2014) 13(1):22. doi:10.1186/1476-069X-13-22
64. Shoji M, Katayama K, Sano K. Absolute humidity as a deterministic factor affecting seasonal influenza epidemics in Japan. Tohoku J Exp Med (2011) 224(4):251–6. doi:10.1620/tjem.224.251
65. Harata S, Seimori T, Shoji M, Fukuyama M, Amano K-I. Relationship between absolute humidity and influenza prevalence in Odate and Akita cities, Akita Prefecture, in 2001 and 2002. Kansenshogaku Zasshi (2004) 78(5):411–9. doi:10.11150/kansenshogakuzasshi1970.78.411
66. Noti JD, Blachere FM, McMillen CM, Lindsley WG, Kashon ML, Slaughter DR, et al. High humidity leads to loss of infectious influenza virus from simulated coughs. PLoS One (2013) 8(2):e57485. doi:10.1371/journal.pone.0057485
67. Yang W, Elankumaran S, Marr LC. Relationship between humidity and influenza A viability in droplets and implications for influenza’s seasonality. PLoS One (2012) 7(10):e46789. doi:10.1371/journal.pone.0046789
68. Yang W, Marr LC. Dynamics of airborne influenza A viruses indoors and dependence on humidity. PLoS One (2011) 6(6):e21481. doi:10.1371/journal.pone.0021481
69. Schaffer FL, Soergel ME, Straube DC. Survival of airborne influenza virus: effects of propagating host, relative humidity, and composition of spray fluids. Arch Virol (1976) 51(4):263–73. doi:10.1007/BF01317930
70. Goodell CK, Zhang J, Strait E, Harmon K, Patnayak D, Otterson T, et al. Ring test evaluation of the detection of influenza A virus in swine oral fluids by real-time reverse-transcription polymerase chain reaction and virus isolation. Can J Vet Res (2016) 80(1):12–20.
71. Decorte I, Steensels M, Lambrecht B, Cay AB, De Regge N. Detection and isolation of swine influenza A virus in spiked oral fluid and samples from individually housed, experimentally infected pigs: potential role of porcine oral fluid in active influenza A virus surveillance in swine. PLoS One (2015) 10(10):e0139586. doi:10.1371/journal.pone.0139586
72. Detmer SE, Patnayak DP, Jiang Y, Gramer MR, Goyal SM. Detection of influenza A virus in porcine oral fluid samples. J Vet Diagn Invest (2011) 23(2):241–7. doi:10.1177/104063871102300207
73. Vincent A, Awada L, Brown I, Chen H, Claes F, Dauphin G, et al. Review of influenza A virus in swine worldwide: a call for increased surveillance and research. Zoonoses Public Health (2014) 61(1):4–17. doi:10.1111/zph.12049
74. Vincent AL, Lager KM, Anderson TK. A brief introduction to influenza A virus in swine. In: Spackman E, editor. Animal Influenza Virus. Methods in Molecular Biology. 1161. New York, US: Humana Press (2014). p. 243–58.
75. Vincent AL, Perez DR, Rajao D, Anderson TK, Abente EJ, Walia RR, et al. Influenza A virus vaccines for swine. Vet Microbiol (2017) 206:35–44. doi:10.1016/j.vetmic.2016.11.026
76. Lorusso A, Vincent AL, Gramer MR, Lager KM, Ciacci-Zanella JR. Contemporary epidemiology of North American lineage triple reassortant influenza A viruses in pigs. In: Richt JA, Webby R, editors. Swine Influenza. Current Topics in Microbiology and Immunology. Berlin, Germany: Springer (2013). p. 113–31.
Keywords: influenza, seasonality, prevalence, genetic diversity, swine, absolute humidity, breed-to-wean pig farm, swine influenza virus
Citation: Chamba Pardo FO, Alba-Casals A, Nerem J, Morrison RB, Puig P and Torremorell M (2017) Influenza Herd-Level Prevalence and Seasonality in Breed-to-Wean Pig Farms in the Midwestern United States. Front. Vet. Sci. 4:167. doi: 10.3389/fvets.2017.00167
Received: 01 August 2017; Accepted: 25 September 2017;
Published: 11 October 2017
Edited by:
Eyal Klement, The Hebrew University, IsraelReviewed by:
Hsin-Yi Weng, Purdue University, United StatesZvonimir Poljak, University of Guelph, Canada
Copyright: © 2017 Chamba Pardo, Alba-Casals, Nerem, Morrison, Puig and Torremorell. This is an open-access article distributed under the terms of the Creative Commons Attribution License (CC BY). The use, distribution or reproduction in other forums is permitted, provided the original author(s) or licensor are credited and that the original publication in this journal is cited, in accordance with accepted academic practice. No use, distribution or reproduction is permitted which does not comply with these terms.
*Correspondence: Montserrat Torremorell, torr0033@umn.edu
†Robert B. Morrison, Deceased (May He Rest in Peace).