Inferring the Ecological Niche of Toxoplasma gondii and Bartonella spp. in Wild Felids
 Luis E. Escobar1,2,3*
 Scott Carver4†
 Daniel Romero-Alvarez5†
Sue VandeWoude6
Kevin R. Crooks7
Michael R. Lappin8
Daniel Romero-Alvarez5†
Sue VandeWoude6
Kevin R. Crooks7
Michael R. Lappin8  Meggan E. Craft1
- 1Department of Veterinary Population Medicine, University of Minnesota, Minneapolis, MN, United States
- 2Department of Fisheries, Wildlife and Conservation Biology, University of Minnesota, St. Paul, MN, United States
- 3Department of Fish and Wildlife Conservation, Virginia Tech, Blacksburg, VA, United States
- 4School of Biological Sciences, University of Tasmania, Hobart, TAS, Australia
- 5Department of Ecology and Evolutionary Biology, University of Kansas, Lawrence, KS, United States
- 6Department of Microbiology, Immunology and Pathology, Colorado State University, Fort Collins, CO, United States
- 7Department of Fish, Wildlife, and Conservation Biology, Colorado State University, Fort Collins, CO, United States
- 8Department of Clinical Sciences, Colorado State University, Fort Collins, CO, United States
Traditional epidemiological studies of disease in animal populations often focus on directly transmitted pathogens. One reason pathogens with complex lifecycles are understudied could be due to challenges associated with detection in vectors and the environment. Ecological niche modeling (ENM) is a methodological approach that overcomes some of the detection challenges often seen with vector or environmentally dependent pathogens. We test this approach using a unique dataset of two pathogens in wild felids across North America: Toxoplasma gondii and Bartonella spp. in bobcats (Lynx rufus) and puma (Puma concolor). We found three main patterns. First, T. gondii showed a broader use of environmental conditions than did Bartonella spp. Also, ecological niche models, and Normalized Difference Vegetation Index satellite imagery, were useful even when applied to wide-ranging hosts. Finally, ENM results from one region could be applied to other regions, thus transferring information across different landscapes. With this research, we detail the uncertainty of epidemiological risk models across novel environments, thereby advancing tools available for epidemiological decision-making. We propose that ENM could be a valuable tool for enabling understanding of transmission risk, contributing to more focused prevention and control options for infectious diseases.
Introduction
Traditional epidemiological studies of disease in animal populations are dominated by intraspecific transmission of contact-dependent (directly transmitted) parasites or pathogens (1, 2). However, many important parasites have complex life cycles that include vectors or environmental stages, and we often know much less about these types of parasites (3). For parasites or pathogens transmitted via vectors or the environment, it is especially important to understand not only the relationships between the host and pathogen, but also the environmental niche—the environmental conditions in which the pathogen persists in the long term (4). In practice, understanding the environmental niche of many pathogens can be difficult to achieve due to challenges associated with detecting pathogens in vectors and the environment (e.g., sparsely distributed pathogens in vectors, in soil, on plant matter, or in water). As an alternative, capturing and sampling wildlife hosts is more effective. Innovative methodological approaches that overcome some of these environmental challenges are therefore needed and would be valuable for enabling understanding of transmission risk, thereby contributing to more focused prevention and control options.
Current approaches to map pathogens often include conducting a cluster analysis and spatial interpolations of disease cases in a specific area, thereby creating a tentative risk map for pathogen exposure (5, 6). However, a limitation of these classic approaches is the questionable value for forecasting risk in novel areas beyond those with ongoing surveillance. That is to say, geographic interpolations and cluster analyses do not consider environmental features and only reflect the sampling effort (7). Environmental (or ecological) niche modeling (ENM) is the practice of reconstructing a species’ environmental determinants (8). These methods can be useful in creating predictive maps that can forecast pathogen presence in novel regions (9). Ecological niche modeling is established for species distribution modeling and is gaining attraction in the field of veterinary epidemiology (7).
Recent research has demonstrated the utility of ENM to predict disease in distant novel areas (8), but it remains rare for these predictive models to be validated using independent data, which is particularly true for models of pathogens in wildlife. We tackle this problem using a unique dataset of two pathogens, Toxoplasma gondii and Bartonella spp., isolated from wild felids across North America. Specifically, we analyzed samples from bobcats (Lynx rufus) and puma (Puma concolor), two secretive carnivores that are widespread in North America and are adaptable to a wide array of habitats where they are exposed to pathogens acquired from their environment (10–12). T. gondii is an intracellular protozoan parasite found in warm-blooded animals, including birds and mammals, and is transmitted via consumption of sporulated oocysts in feces, water, and soil or bradyzoites in tissues of prey species (13); in these wild felids, T. gondii is likely transmitted via consumption of infected prey such as rodents, lagomorphs, and cervids (10). The Bartonella genus includes gram negative anaerobic facultative intracellular bacteria species that cause an array of diseases affecting mammals; contact with arthropod vectors, particularly fleas, is the primary route of transmission of Bartonella henselae, Bartonella koehlerae, and Bartonella clarridgeiae (hereafter Bartonella spp.) (14, 15). Both, T. gondii and Bartonella spp., require other organisms to persist; thus, here we define them as micro-parasites or simply parasites (7).
This study has two primary tasks. First, we evaluate if ENM can characterize the potential distribution of parasites with complex lifecycles found in felid host species. This is particularly important when there is limited knowledge about the environmental niche of the pathogens, such as in this study. Second, we examine if ENM results from one region can be applied to other novel regions. We emphasize important novelties from this study: (i) this study utilizes remote sensing data that captures the habitat heterogeneity across study sites with high detail; (ii) this environmental heterogeneity is explicitly incorporated into risk maps produced by ENM; and (iii) we detail the uncertainty of epidemiological risk models across novel environments, thereby advancing epidemiological decision-making tools.
Materials and Methods
Our dataset included 467 felids serologically positive for T. gondii and/or Bartonella spp. from Florida, Colorado, and California. Of these exposed felids, 328 were positive to T. gondii parasites and 234 to Bartonella spp.; occurrence records contained each animal’s capture location and exposure status (16). These data were coupled with landscape information from satellite imagery to develop ENMs and create a risk map for each pathogen.
Occurrences
Occurrences of T. gondii and Bartonella spp. were recorded in ongoing research featuring an unusually large collection of wild felid serosurvey data from three different study areas: Florida, Colorado, and California (10, 12, 17, 18). The study areas were chosen as part of a previous study to represent a range of sites important for puma and bobcat conservation and were also representative of a wide degree of anthropogenic impacts (i.e., habitat fragmentation, urbanization, and agriculture) across North America. The Californian study region is a highly urbanized landscape characterized by a warm dry Mediterranean climate with vegetation communities dominated by coastal California sage scrub, chaparral, riparian and coastal oak woodlands, and annual grasslands. Colorado region was delimited by two polygons resembling sampling in rural and exurban areas with cold semi-arid climates and vegetation characterized by coniferous woodlands and forests primarily interspersed with aspens. The two regions in Colorado represent an area proximate to human development and a more natural area with agricultural surroundings. The Florida region is a mixture of urban, exurban, and agricultural areas spanning humid subtropical and tropical savanna climates with vegetation communities consisting of pine flatwoods, south Florida rockland, cypress domes and strands, dwarf cypress, prairies, mixed hardwood swamps, hardwood hammocks, freshwater swamps, and mangroves.
At each region, individual felids were captured, their location recorded, and samples for pathogen screening were collected according to protocols previously described (10, 12, 18). Wild felids were anesthetized using various tranquilizers/sedatives (19, 20), sampled, and released. Thoracic fluid was collected from hunter-killed animals instead of serum for a subset of bobcats from Colorado (11). Blood and serum samples were initially stored in ethylenediaminetetraacetic acid and serum-separating tubes. Samples were either refrigerated at 4°C or kept on ice until return from the field where they were temporarily frozen at −20°C, and later transferred to −80°C until screening for pathogen exposure. All procedures were performed after appropriate Institutional Animal Care and Use Committee approvals were obtained.
Exposure to T. gondii and Bartonella spp. in puma (P. concolor) and bobcats (L. rufus) was estimated by measuring serum antibodies at the Specialized Infectious Disease Laboratory (Colorado State University) according to protocols previously described (10, 12). Serological samples were considered positive for T. gondii if they were positive to IgM or IgG. Samples were considered positive to Bartonella spp. if immunofluorescence antibody assay (IFA) tests detecting antibodies against B. henselae and B. clarridgeiae were positive (21–23); this was also confirmed independently by performing PCR on matched blood samples (12). For each study area and species, samples were generally collected over a 2- to 3-year intensive study period, and cumulatively the majority of samples across all sites were collected between 2001 and 2012 (12, 16). Puma and bobcat from Florida were not tested for Bartonella spp. (12). For the purpose of reducing overfit of models to the data, duplicate pathogen records from the same location (i.e., those from different individuals captured at the same location, but both exposed to the same pathogen) were restricted to single occurrence records for analyses.
Model Calibration Area
The area selected for ENM calibration has a direct effect on the model results (24), resulting in models area-dependent. Thus, the calibration area must hypothesize the occurrence potential and the sampling effort of the organism in question (25). Based on Poo-Muñoz et al. (26), we used the average distance among available occurrences for T. gondii and Bartonella spp. to generate a buffer around occurrences in each region. The buffered area was used as model calibration region (26), assuming that this region provided a proxy of the landscape conditions contained across the sampled areas (8). Total areas considered for each selected regions are as follow: ~52,500 km2 for terrestrial area of California, ~105,400 km2 for Colorado divided in two polygons (Figure 1 left: ~64,700 km2 and right: ~40,700 km2), and ~43,000 km2 for terrestrial areas of Florida (Figure 1).
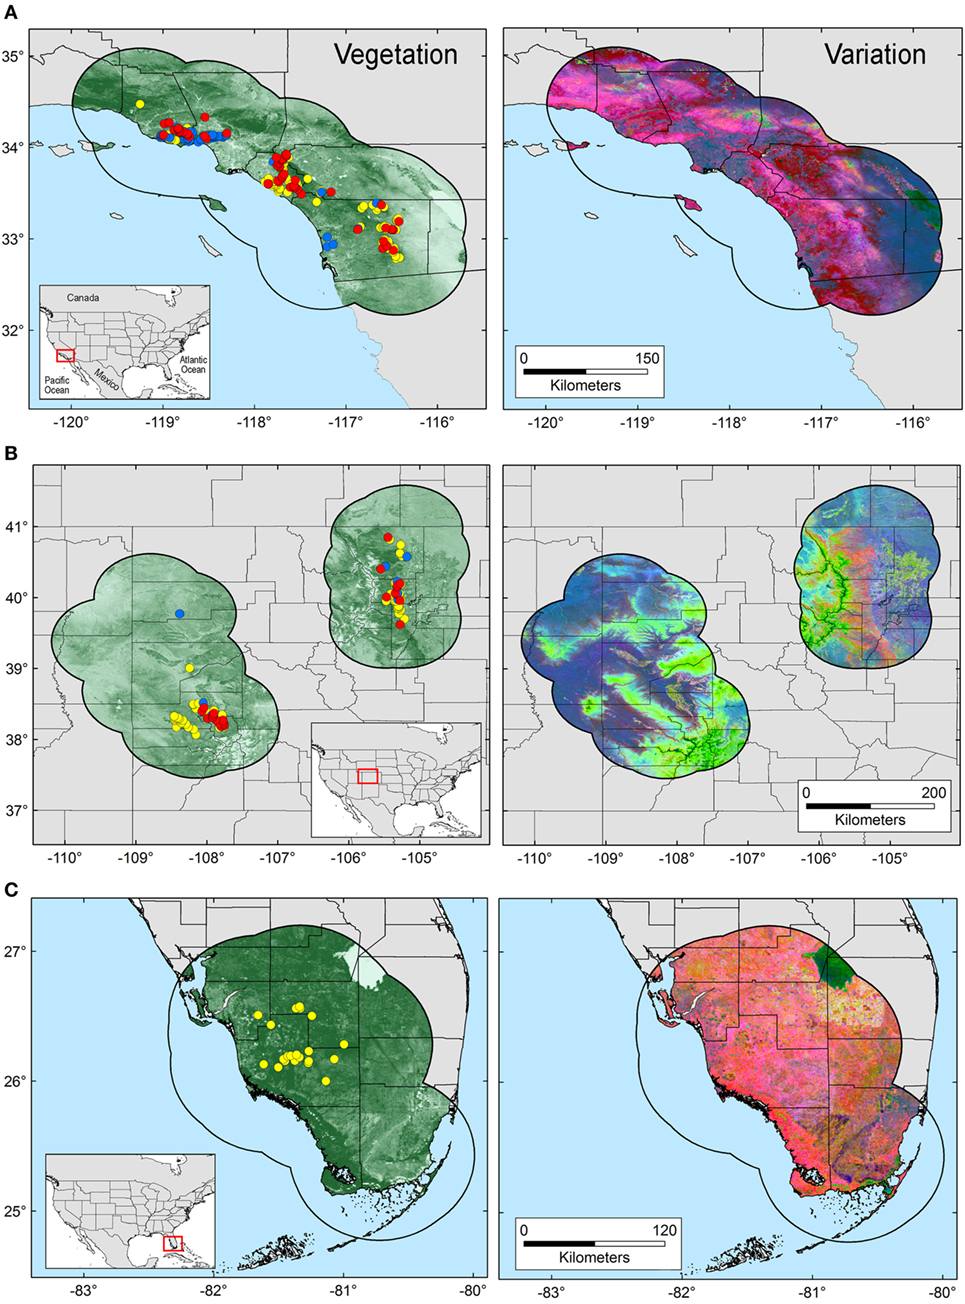
Figure 1. Study areas and environmental variables employed in this study. Model calibration areas were defined in California (A), Colorado (B), and Florida (C) based on a buffer zone estimated from the average distance among occurrences. Left: occurrences for Toxoplasma gondii (yellow points), Bartonella spp. (blue points), and co-infections (red points) are displayed on a surface resembling landscape vegetation in the form of Normalized Difference Vegetation Index (NDVI) data. Right: original NDVI data were transformed to uncorrelated variables via principal component analysis. The variability across the study areas is summarized in principal components 1, 2, and 3, represented by the colors red, green, and blue, respectively.
Environmental Variables
Capturing fine-scale features of the landscape to understand the occurrence of pathogens is challenging and usually restricted to small study areas (27). A valuable alternative to landscape characterization is the use of satellite-derived remote sensing imagery. All objects emit radiation, at different intensities and wavelengths (28). This radiation can be characterized using satellite imagery from, for example, the MODerate-resolution Imaging Spectroradiometer sensor in the Terra satellite (29). These images offer low cost broad spatial coverage environmental information in the form of vegetation indexes (27), such as the Normalized Difference Vegetation Index (NDVI). The NDVI has proven representative of photosynthetic activity, biomass, net primary production, soil features, precipitations and humidity, and terrestrial landscapes in general. Thus, NDVI values have been associated with the distributional ecology and population dynamics of plants, invertebrates, birds, amphibians, ungulates, primates, carnivores, rodents, and reptiles in natural ecosystems; NDVI also provides information on changes in land use and soil humidity (27, 30).
Normalized Difference Vegetation Index data collected at 250 m spatial resolution at 16-day composites during 2005 in raster format were available from the Global Land Cover Facility (29). The resulting 21 original NDVI layers were reduced in number and collinearity via a principal component analysis (PCA) using ArcGIS 10.3 (31). We obtained new uncorrelated principal components (PC) with their respective descriptive values (e.g., correlation coefficients, eigenvalues, and eigenvectors). For the niche modeling procedure, we selected the PC summarizing at least 90% of the overall variance to capture a considerable amount of information from the original NDVI variables. The first three components were then utilized as axes to generate a three-dimensional environmental space as a proxy of Hutchinson’s duality to extract the environmental information of the geography (32) and were used to display occurrences in environmental terms. This environmental space was developed using NicheA 3.0 software (33), available at http://nichea.sourceforge.net/.
Ecological Niche Modeling
We used Maxent 3.3.3k to generate the ecological niche models. Maxent is a machine learning tool developed to forecast species distributions with incomplete data (34). Maxent estimates the most uniform distribution of species occurrences compared with the available environmental background in the study area given constraints derived from the environmental data (35). Maxent also uses a regularization coefficient to increase or reduce the fit of the models to the available data, with a default value of 1 (36). We tested 20 regularization coefficients to find the best fit for our model. We used Akaike information criterion values corrected by sample sizes (AICc) to discriminate among models (37). This evaluation was developed using ENMTools 1.4.4 software (38). Specific settings in the final Maxent model included 100 bootstrap replicates with random seed and logistic output. The average of replicates in continuous format was converted to a binary format using a threshold value of E = 5%; this threshold aims to remove 5% of the calibration occurrences with the lowest logistic value (8).
Occurrence data were split into the three buffered study regions (i.e., California, Colorado, and Florida). Models were calibrated with all the occurrences in two regions, models were then transferred (neither clamping nor extrapolation allowed in Maxent) to the remaining region (39), and were then evaluated with the occurrences from such region (40). For example, we calibrated models using occurrence data for T. gondii from two regions (e.g., California and Florida) and evaluated predictions with occurrence data in the third region (e.g., Colorado). For Bartonella spp., due to the lack of occurrence records in Florida, we used one site (i.e., Colorado) to predict the other (i.e., California) and vice versa. This split configuration assured a fair evaluation of the models by using data independent from that used during model calibration. Maxent predictions were tested between the three study regions using partial receiver operating characteristic (Partial ROC) (41), a metric developed for ecological niche models to assess the correct prediction of independent evaluation occurrences and the proportion of area predicted suitable, against a null model (42). Partial ROC analyses were conducted using the Partial ROC metric (41, 43); parameters included 5% of omission, α < 0.05, 50% of random occurrences used for model testing, and 100 bootstrap iterations (41). Partial ROC estimates area under the curve (AUC) ratio values ranging between 0 and 2, with values above 1 (null model) resembling predictions better than by random expectations that are considered statistically significant (42).
Results
Environmental variables showed heterogeneous landscapes in spatial terms and collinearity among NDVI variables in temporal terms (Figure 1; Table S1 in Supplementary Material). For example, NDVI values in the summer (e.g., Julian days 193 and 209 in July in Table S1) showed low correlation with greenness with data from winter (e.g., days 1 and 17 in January in Table S1 in Supplementary Material). However, consecutive 16-day NDVI comparisons showed high correlation (e.g., Julian days 1 and 17, 17 and 33, and so on), with correlation coefficients ranging between 0.74 and 0.83 for comparisons between consecutive 21 layers (Table S1 in Supplementary Material). The first ten PC accumulated 90.77% of the overall information contained in the original 21 NDVI variables and were used for modeling (Table S2 in Supplementary Material). The first three components showed high environmental variability inside and between study areas, contained most of the information (80.37%) from the NDVI variables (Tables S2 and S3 in Supplementary Material), and showed differences in vegetation cover composition in California, Colorado, and Florida (Figure 1, right). Further, these three components were used to display the distribution of species in a three-dimensional virtual representation of the environmental space (Figure 2); here, the environmental distribution of both T. gondii and Bartonella spp. showed high overlap, despite the broader use of environmental conditions by T. gondii (Figure 2).
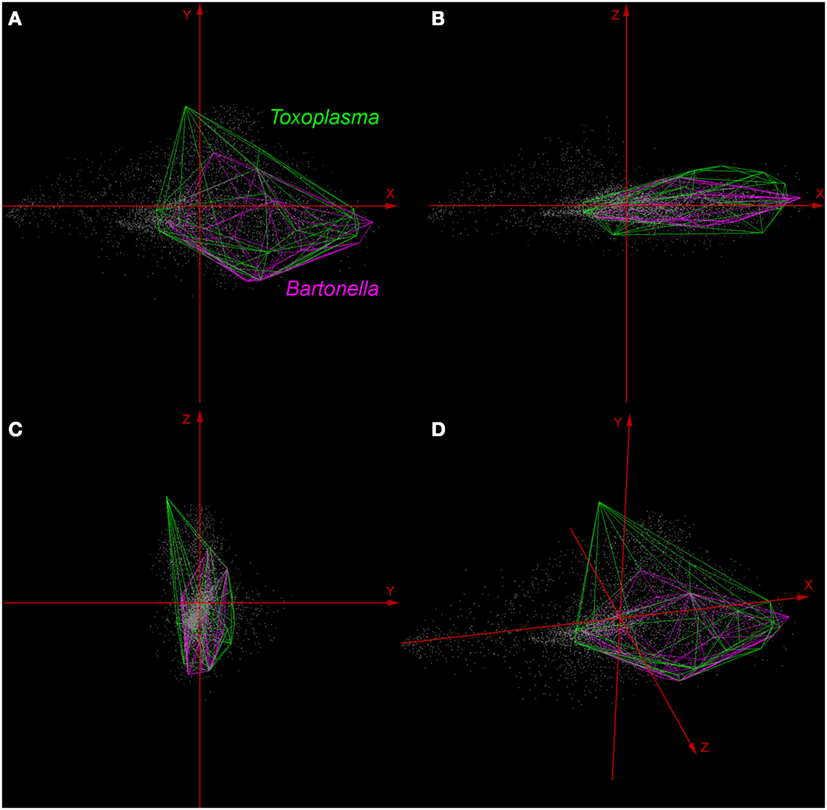
Figure 2. Distribution of Toxoplasma gondii and Bartonella spp. in a three-dimensional representation of the environmental space. All the available occurrences of T. gondii (green polyhedron) and Bartonella spp. (pink polyhedron) were displayed based on environmental values (gray points) available in California, Colorado, and Florida. Axes (red arrows) were constructed using principal components (PC) 1 (X axis), PC 2 (Y axis), and PC 3 (Z axis), which are the same variables represented in the right side of Figure 1. (A) View of the occupied niches based on PC 1 and 2. (B) View of niches based on PC 1 and 3. (C) View of niches using PC 2 and 3. (D) Three-dimensional view of species distributions based on PC 1, 2, and 3.
In all, 328 samples were positive for T. gondii, including 129 bobcats and 199 pumas across California, Colorado, and Florida (Figure 1). Two hundred thirty-four samples were positive for Bartonella spp. in 196 bobcats and 38 pumas from California and Colorado (Figure 1; Table 1). Models were calibrated using 291 single occurrence records for T. gondii and 189 occurrences for Bartonella spp. Models for both species required regularization coefficients other than the default value of 1 to have the best fit and lowest AICc: T. gondii required a regularization coefficient of 1.2, while the Bartonella spp. model required a regularization coefficient of 1.3 (Table S4 in Supplementary Material). Once calibrated, model evaluations showed that predictions between states were significantly better than a random model (AUC ratios above 1, p < 0.05) when data of T. gondii from California and Colorado were used to predict the location of this parasite in Florida (mean AUC ratio = 1.056, SD = 0.044), from Colorado and Florida to California (mean AUC ratio = 1.089, SD = 0.066), and when data from California and Florida were used to predict occurrences in Colorado (mean AUC ratio = 1.247, SD = 0.085) (Figure S1 in Supplementary Material). Bartonella spp. models calibrated in California were significantly predictive of the occurrence of this parasite in Colorado with AUC ratios above 1; similarly, models calibrated in Colorado significantly predicted Bartonella spp. in California (mean AUC ratio = 1.107, SD = 0.029) (Figure S1 in Supplementary Material).
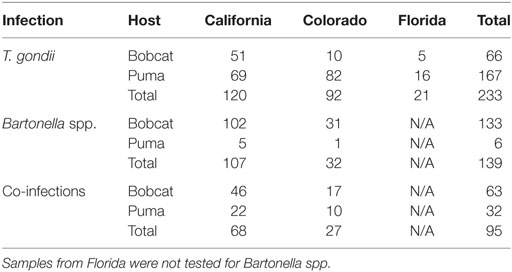
Table 1. Positive cases by host (bobcat and puma), parasite (Toxoplasma gondii and Bartonella spp.), and region.
The T. gondii model identified suitable areas for this parasite, but also showed heterogeneity in uncertainty estimations across areas (i.e., predictions ranged from low uncertainty to high uncertainty in each area), with SD ranging between 8.13 × 10⁻⁶ (lowest) to 0.42 (highest; Figure 3). Binary models for T. gondii showed high proportion of suitability mainly in California (43.7% of the area) as compared with Colorado (35.8%) and Florida (20.5%); these predictions came with some variation in certainty (Figure 3A). Models also predicted isolated and limited suitability for both regions in Colorado, also with some variation evident in uncertainty, although these models were more confident in the places where T. gondii is unlikely to occur (Figure 3B). Florida showed wide suitability for this parasite across all the study areas (but with high uncertainty in suitability), except for consistent unsuitable predictions in Lake Okeechobee region (Figure 3C). Models for Bartonella spp. had a similar variation in predictions of suitable areas of pathogen occurrence, and uncertainty in predictions (SD ranging from 2.77 × 10⁻⁶ to 0.39; Figure 4). Our Bartonella spp. models predicted extensive suitability throughout California, with high certainty in unsuitable areas for Bartonella spp. occurrence (Figure 4A). It is notable that the area of uncertainty for Bartonella spp. in California was greater than for T. gondii (see Figures 3A vs. 4A). In Colorado, models predicted low Bartonella spp. suitability in the study area to the west with high certainty, but higher suitability to the east (Figure 4B). Even when no pathogen records were available to us for Bartonella spp. in Florida, our model predicted suitable conditions in specific sites across this region (Figure 4C) and with less uncertainty than T. gondii. In general terms, however, Bartonella spp. was predicted to be less widespread, as compared with T. gondii in Colorado and Florida.
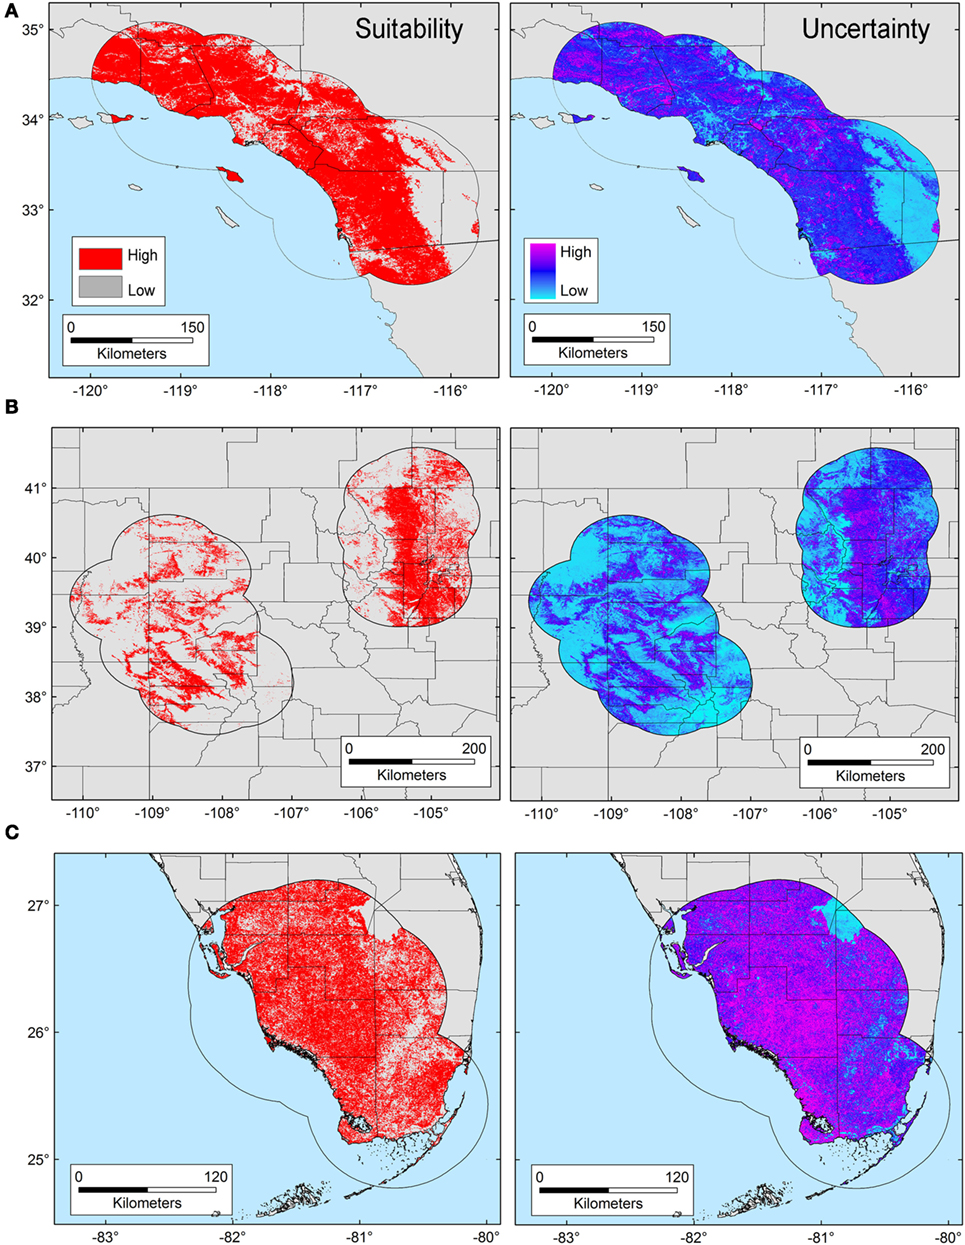
Figure 3. Ecological niche model of Toxoplasma gondii. Binary maps of T. gondii suitability (red) were developed for areas in California (A), Colorado (B), and Florida [(C); left panel]. Uncertainty estimations based on the suitability differences among models (right panel) show areas of low (cyan) and high (pink) uncertainty as follows: California (A) from 3.31 × 10⁻⁵ to 0.42, Colorado (B) from 9.96 × 10⁻⁶ to 0.32, and Florida (C) from 8.13 × 10⁻⁶ to 0.3.
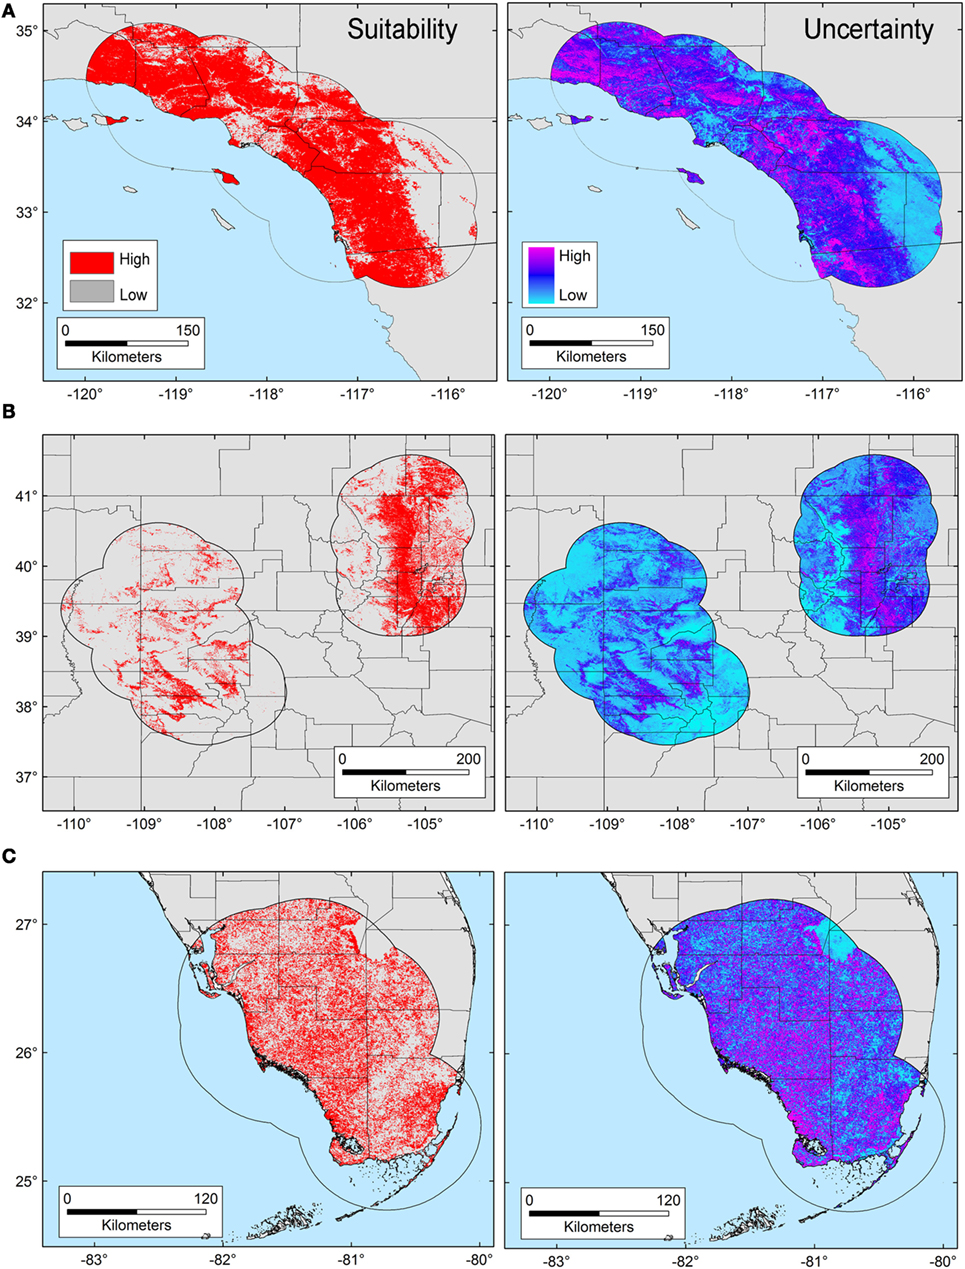
Figure 4. Ecological niche model of Bartonella spp. Binary maps of Bartonella spp. suitability (red) were developed for areas in California (A), Colorado (B), and Florida [(C); left panel]. Uncertainty estimations based on the suitability differences among models (right panel) show areas of low (cyan) and high (pink) uncertainty as follows: California (A) from 5.77 × 10⁻⁶ to 0.37, Colorado (B) from 2.75 × 10⁻⁶ to 0.39, and Florida (C) from 8.59 × 10⁻⁶ to 0.39.
Discussion
Here, we illustrate the utility of a cutting-edge analytical tool that can be used to advance the understanding of the epidemiology of pathogens with complex lifecycles. Our modeling framework attempted to reconstruct the occupied niche of the parasites in question [sensu (8)]—the subset of the environmental space occupied by the species in the area studied. That is to say, the host species included in the study have broad home ranges [puma ~48.6 km2, bobcat ~30.7 km2 (44)] and occur through the Americas from Canada to Patagonia (puma) or across North America (bobcats), a typical characteristic of Felidae (45, 46). Thus, our representation of patterns of suitable areas for parasites is a high-resolution site and time specific reconstruction of risk. We found that although exposure to both T. gondii and Bartonella spp. was generally widespread in the study areas (Figure 1), T. gondii showed a broader distribution across environmental conditions than did Bartonella spp. (Figure 2), suggesting a broader niche for T. gondii. Although Bartonella spp. was not tested in the Florida samples, our niche model experiments suggest suitability in diverse areas of this state. We found that our models were most accurate in predicting areas where these parasites were least likely to occur. Specifically, the uncertainty, expressed as variability found in our Maxent predictions was the smallest for areas predicted unsuitable for T. gondii and Bartonella spp. (Figures 3 and 4).
Ecological niche models, and NDVI satellite imagery, proved to be useful to characterize the potential distribution of the selected pathogens at the landscape level, generating distribution maps for T. gondii and Bartonella spp. from exposure in wild felids. NDVI captures with high accuracy information of soil features, temperature conditions, and changes of humidity and precipitations as expressed in the structure of local vegetation (27); thus, allowing to capture the environmental signature of Bartonella-positive reservoirs associated with increments on precipitation, as is the case for some Bartonella species (47, 48). Environmental variables showed collinearity, and thus, using PC instead of the original NDVI variables mitigated Maxent overfit by reducing correlation and number of parameters employed by the model. The PCA allowed us to capture landscape variation, which was evident when the first three PC were displayed for each study area (Figure 1, right), suggesting that NDVI is a powerful tool for epidemiological studies aiming to forecast disease transmission risk at a habitat level (i.e., 250 m spatial resolution).
We had predictive success when applying ENM from one region to other, even though there were marked environmental differences among regions (Figure 1). Nevertheless, although all predictions among regions were significant, not all of our sites were equal in predictive abilities (Figure S1 in Supplementary Material). This highlights the key role that environment similarity can play between calibration and projection areas in Maxent. Potentially this supports the idea that Maxent predictions are more consistently suited for transference to similar environmental conditions (39). Further, we also show that NDVI environmental data are robust for reconstructing the environmental conditions suitable for pathogens, similar to more routine approaches using climate variables.
ENM applied to environmental dependent pathogens facilitates the identification of habitats of risk where collection of information has been lacking maybe due to limited sampling effort or other factors related to the detection of pathogens. It implies an advancement in understanding the distribution of pathogens beyond the use of data of their vectors or reservoirs. For example, T. gondii oocysts can be viable in the environment for up to 18 months (49), or potentially more importantly for these large felids, in their prey (rodents, lagomorphs, and cervids). Bartonella spp. easily survive in fleas whose abundance is associated with increasing humidity (50), and with microclimate conditions indirectly represented by NDVI, which could determine the distribution of Bartonella spp. between wildlife and domestic reservoirs (10). The ENM framework used here, including freely available vegetation data, with the presence-background Maxent algorithm, has the potential to be used to explore other environmental dependent pathogens. Our suitability maps of T. gondii and Bartonella spp. suggest that risk may exist in broad areas in the three states studied. Potential transmission may occur in the areas predicted suitable if hosts, the pathogen, and the vectors converge (Figures 3 and 4).
Despite the evident benefits, our approach is a simplification of two complex parasite systems. We based our interpretation of the pathogens’ niche from infected wild felids (i.e., bobcats and puma) in their sylvatic habitats, but may be missing other pieces of the epidemiological triangle. For instance, the distribution of intermediate hosts for T. gondii (such as rodents, lagomorphs, and cervids) (13) was not included in our models, nor was the presence of domestic cats (another definitive host) owing to insufficient data across all study areas. For Bartonella spp., we did not account for presence of vectors (e.g., fleas) (10), and thus, even when we anticipate suitable conditions for the parasite occurrence, suitable conditions for vectors could limit the occurrence of Bartonella spp. in certain areas. Moreover, we modeled Bartonella spp. at genus level under the assumption of niche conservatism, which proposes that species phylogenetically close will share ecological niche characteristics, and that intraspecific differentiation of niches is challenging (51, 52). Although our diagnostics tests have proven effective for these wild felids, there could exist a small number of false-positive and false-negative results, we assumed that this proportion would not change the general patterns of the findings.
Ecological niche models of both parasite species based on hosts from wild areas revealed that our models were a proxy of the sylvatic cycle of both parasites; however, these pathogens might also occur in urban areas, which are not often frequented by puma or bobcats. T. gondii can also occur in urban environments given its adaptability and host generalization as a result of its broad ecological niche (53). Nonetheless, Lélu et al. (54) suggest T. gondii is likely to be less prevalent in urban areas owing to reduced transmission through the food chain, a conclusion supported by our work in these study areas where domestic cats are restricted to urban areas, wild felids avoid urban areas, and T. gondii has a higher prevalence in wild felids (12). Conversely, our previous research shows a strong positive relationship between urbanization and exposure to Bartonella spp. (12), suggesting that these bacteria persist in stable homogeneous urban landscapes. Future research should include the urban component in the distribution of T. gondii and Bartonella spp. parasites for a broader characterization of the ecological potential of both parasites in natural and impervious surfaces in North America.
Previous studies have demonstrated niches of pathogens independent of potential reservoir distributions (55), thus showing that the modeling of pathogens-only provides accurate forecasts of disease transmission risk. These cutting-edge available tools of disease modeling are worthy of exploration to generate further fine-scale hypotheses to advance our knowledge of the environmental component of infectious disease transmission chains (9). Although the occurrences of the two pathogens were explored in wildlife, they are also zoonotic, so the results of this study have implications for human, as well as domestic and other wild animals’ health. NDVI and longitudinal epidemiological studies can help address questions not only about the prevalence of Bartonella spp. and T. gondii in the environment, but also can allow us to identify suitable habitats for their presence, and in turn, forecast into the future as these methods can incorporate the effects of land use change to understand the ecology of infectious diseases, particularly environmentally dependent forms, before outbreaks occur.
Author Contributions
LE and DR-A designed the experiments, developed the analyses, and co-wrote the manuscript. SC and MC designed the study and co-wrote the manuscript. SV, KC, and ML provided the data and co-wrote the manuscript.
Conflict of Interest Statement
The authors declare that the research was conducted in the absence of any commercial or financial relationships that could be construed as a potential conflict of interest.
Acknowledgments
LE thanks Andres Perez and Kim VanderWaal for the logistic support for DR-A to develop part of the analyses.
Funding
This research was funded by National Science Foundation’s Ecology and Evolution of Infectious Diseases Research Program (NSF EF-0723676 and NSF DEB-1413925). MC was funded by the University of Minnesota’s Office of the Vice President for Research and Academic Health Center Seed Grant. LE and DR-A thank the MiniGrant MF-0010-15 from the Institute of the Environment of the University of Minnesota, which supported the internship of DR-A in Minnesota.
Supplementary Material
The Supplementary Material for this article can be found online at http://www.frontiersin.org/article/10.3389/fvets.2017.00172/full#supplementary-material.
References
1. Craft ME, Caillaud D. Network models: an underutilized tool in wildlife epidemiology? Interdiscip Perspect Infect Dis (2011) 2011:1–12. doi:10.1155/2011/676949
2. Hudson PJ, Rizzoli A, Grenfell BT. The Ecology of Wildlife Diseases. New York: Oxford University Press (2002).
3. Godfrey SS. Networks and the ecology of parasite transmission: a framework for wildlife parasitology. Int J Parasitol Parasites Wildl (2013) 2:235–45. doi:10.1016/j.ijppaw.2013.09.001
4. Peterson AT. Biogeography of diseases: a framework for analysis. Naturwissenschaften (2008) 95:483–91. doi:10.1007/s00114-008-0352-5
5. Auchincloss AH, Gebreab SY, Mair C, Roux AVD. A review of spatial methods in epidemiology, 2000 – 2010. Annu Rev Public Heal (2012) 33:107–22. doi:10.1146/annurev-publhealth-031811-124655.A
6. Carpenter TE. The spatial epidemiologic (r)evolution: a look back in time and forward to the future. Spat Spatiotemporal Epidemiol (2011) 2:119–24. doi:10.1016/j.sste.2011.07.002
7. Escobar LE, Craft ME. Advances and limitations of disease biogeography using ecological niche modeling. Front Microbiol (2016) 7:1174. doi:10.3389/fmicb.2016.01174
8. Peterson AT, Soberón J, Pearson RG, Anderson RP, Martínez-Meyer E, Nakamura M, et al. Ecological Niches and Geographic Distributions. New Jersey: Princeton University Press (2011).
9. Peterson AT. Mapping Disease Transmission Risk: Enriching Models Using Biology and Ecology. Baltimore: Johns Hopkins University Press (2014).
10. Bevins SN, Carver S, Boydston EE, Lyren LM, Alldredge M, Logan KA, et al. Three pathogens in sympatric populations of pumas, bobcats, and domestic cats: implications for infectious disease transmission. PLoS One (2012) 7:e31403. doi:10.1371/journal.pone.0031403
11. Carver S, Scorza AV, Bevins SN, Riley SPD, Crooks KR, VandeWoude S, et al. Zoonotic parasites of bobcats around human landscapes. J Clin Microbiol (2012) 50:3080–3. doi:10.1128/JCM.01558-12
12. Carver S, Bevins SN, Lappin MR, Boydston EE, Lyren LM, Alldredge M, et al. Pathogen exposure varies widely among sympatric populations of wild and domestic felids across the United States. Ecol Appl (2016) 26:367–81. doi:10.1890/15-0445
13. Dubey JP, Jones J. Toxoplasma gondii infection in humans and animals in the United States. Int J Parasitol (2008) 38:1257–78. doi:10.1016/j.ijpara.2008.03.007
14. Breitschwerdt EB. Feline bartonellosis and cat scratch disease. Vet Immunol Immunopathol (2008) 123:167–71. doi:10.1016/j.vetimm.2008.01.025
15. Chomel BB, Kasten RW, Henn JB, Molia S. Bartonella infection in domestic cats and wild felids. Ann N Y Acad Sci (2006) 1078:410–5. doi:10.1196/annals.1374.080
16. Gilbertson ML, Carver S, VandeWoude S, Crooks KR, Lappin MR, Craft ME. Is pathogen exposure spatially autocorrelated? Patterns of pathogens in puma and bobcat. Ecosphere (2016) 7:1–27. doi:10.1002/ecs2.1558
17. Lagana DM, Lee JS, Lewis JS, Bevins SN, Carver S, Sweanor LL, et al. Characterization of regionally associated feline immunodeficiency virus (FIV) in bobcats (Lynx rufus). J Wildl Dis (2013) 49:718–22. doi:10.7589/2012-10-243
18. Troyer RM, Beatty JA, Stutzman-Rodriguez KR, Carver S, Lozano CC, Lee JS, et al. Novel Gammaherpes viruses in North American domestic cats, bobcats, and pumas: identification, prevalence, and risk factors. J Virol (2014) 88:3914–24. doi:10.1128/JVI.03405-13
19. Logan A, Sweanor LL. Desert Puma: Evolutionary Ecology and Conservation of an Enduring Carnivore. Washington, DC: Island Press (2001).
20. Riley SPD, Foley J, Chomel BB. Exposure to feline and canine pathogens in bobcats and gray foxes in urban and rural zones of a national park in California. J Wildl Dis (2004) 40:11–22. doi:10.7589/0090-3558-40.1.11
21. Jensen WA, Lappin MR, Kamkar S, Reagan WJ. Use of a polymerase chain reaction assay to detect and differentiate two strains of Haemobartonella felis in naturally infected cats. Am J Vet Res (2001) 62:604–8. doi:10.2460/ajvr.2001.62.604
22. Lappin MR, Jacobson ER, Kollias GV, Powell CC, Stover J. Comparison of serologic assays for the diagnosis of Toxoplasmosis in nondomestic felids. J Zoo Wildl Med (1991) 2:169–74.
23. Lappin MR, Powell CC. Comparison of latex agglutination, indirect hemagglutination, and ELISA techniques for the detection of Toxoplasma gondii-specific antibodies in the serum of cats. J Vet Intern Med (1991) 5:299–301. doi:10.1111/j.1939-1676.1991.tb03137.x
24. Barve N, Barve V, Jiménez-Valverde A, Lira-Noriega A, Maher SP, Peterson AT, et al. The crucial role of the accessible area in ecological niche modeling and species distribution modeling. Ecol Modell (2011) 222:1810–9. doi:10.1016/j.ecolmodel.2011.02.011
25. Soberón J, Peterson AT. Interpretation of models of fundamental ecological niches and species’ distributional areas. Biodiv Inform (2005) 2:1–10. doi:10.17161/bi.v2i0.4
26. Poo-Muñoz DA, Escobar LE, Peterson AT, Astorga F, Organ JF, Medina-Vogel G. Galictis cuja (Mammalia): an update of current knowledge and geographic distribution. Iheringia Série Zool (2014) 104:341–6. doi:10.1590/1678-476620141043341346
27. Pettorelli N. The Normalized Difference Vegetation Index. Oxford: Oxford University Press (2013).
28. Horning N, Robinson J, Sterling E, Turner W, Spector S. Remote Sensing for Ecology and Conservation. New York: Oxford University Press (2010).
29. Carroll ML, DiMiceli CM, Sohlberg RA, Townshend JRG. 250m MODIS Normalized Difference Vegetation Index, 250ndvi28920033435, Collection 4. (2009). Available from: http://glcf.umd.edu/data/ndvi/
30. Pettorelli N, Vik JO, Mysterud A, Gaillard JM, Tucker CJ, Stenseth NC. Using the satellite-derived NDVI to assess ecological responses to environmental change. Trends Ecol Evol (2005) 20:503–10. doi:10.1016/j.tree.2005.05.011
31. ESRI. ArcGIS Desktop: Release 10.3. Redlands, CA: Environmental Systems Research Institute (2015).
32. Colwell R, Rangel T. Hutchinson’s duality: the once and future niche. Proc Natl Acad Sci U S A (2009) 106:19651–8. doi:10.1073/pnas.0901650106
33. Qiao H, Peterson AT, Campbell LP, Soberón J, Ji L, Escobar LE. NicheA: creating virtual species and ecological niches in multivariate environmental scenarios. Ecography (2016) 39:1–9. doi:10.1111/ecog.01961
34. Phillips SJ, Anderson RP, Schapire RE. Maximum entropy modeling of species geographic distributions. Ecol Modell (2006) 190:231–59. doi:10.1016/j.ecolmodel.2005.03.026
35. Merow C, Smith MJ, Silander JA. A practical guide to Maxent for modeling species’ distributions: what it does, and why inputs and settings matter. Ecography (2013) 36:1058–69. doi:10.1111/j.1600-0587.2013.07872.x
36. Phillips SJ, Dudík M. Modeling of species distributions with Maxent: new extensions and a comprehensive evaluation. Ecography (2008) 31:161–75. doi:10.1111/j.2007.0906-7590.05203.x
37. Radosavljevic A, Anderson RP. Making better Maxent models of species distributions: complexity, overfitting and evaluation. J Biogeogr (2014) 41:629–43. doi:10.1111/jbi.12227
38. Warren DL, Seifert SN. Ecological niche modeling in Maxent: the importance of model complexity and the performance of model selection criteria. Ecol Appl (2011) 21:335–42. doi:10.1890/10-1171.1
39. Owens HL, Campbell LP, Dornak LL, Saupe EE, Barve N, Soberón J, et al. Constraints on interpretation of ecological niche models by limited environmental ranges on calibration areas. Ecol Modell (2013) 263:10–8. doi:10.1016/j.ecolmodel.2013.04.011
40. Escobar LE, Peterson AT, Favi M, Yung V, Pons DJ, Medina-Vogel G. Ecology and geography of transmission of two bat-borne rabies lineages in Chile. PLoS Negl Trop Dis (2013) 7:e2577. doi:10.1371/journal.pntd.0002577
41. Peterson AT. Niche modeling: model evaluation. Biodiv Inform (2012) 8:41. doi:10.17161/bi.v8i1.4300
42. Peterson AT, Papeş M, Soberón J. Rethinking receiver operating characteristic analysis applications in ecological niche modeling. Ecol Modell (2008) 213:63–72. doi:10.1016/j.ecolmodel.2007.11.008
43. Barve N. Tool for Partial-ROC. (2008). Available from: http://kuscholarworks.ku.edu/dspace/handle/1808/10059
44. Gittleman JL, Harvey PH. Carnivore home-range size, metabolic needs and Ecology. Behav Ecol Sociobiol (1982) 10:57–63. doi:10.1007/BF00296396
45. Kelly M, Morin D, Lopez-Gonzalez CA. Lynx Rufus. The IUCN Red List of Threatened Species (2016). e.T12521A50655874. doi:10.2305/IUCN.UK.2016-1.RLTS.T12521A50655874.en
46. Nielsen C, Thompson D, Kelly M, Lopez-Gonzalez CA. Puma Concolor. The IUCN Red List of Threatened Species (2015). e.T18868A97216466. doi:10.2305/IUCN.UK.2015-4.RLTS.T18868A50663436.en
47. Beldomenico PM, Chomel BB, Foley JE, Sacks BN, Baldi CJ, Kasten RW, et al. Environmental factors associated with Bartonella vinsonii subsp. berkhoffii seropositivity in free-ranging coyotes from northern California. Vector Borne Zoonotic Dis (2005) 5:110–9. doi:10.1089/vbz.2005.5.110
48. Jiyipong T, Morand S, Jittapalapong S, Rolain J-M. Bartonella spp. infections in rodents of Cambodia, Lao PDR, and Thailand: identifying risky habitats. Vector Borne Zoonotic Dis (2015) 15:48–55. doi:10.1089/vbz.2014.1621
49. VanWormer E, Fritz H, Shapiro K, Mazet JAK, Conrad PA. Molecules to modeling: Toxoplasma gondii oocysts at the human–animal–environment interface. Comp Immunol Microbiol Infect Dis (2013) 36:217–31. doi:10.1016/j.cimid.2012.10.006
50. Jameson P, Greene C, Regnery R, Dryden M, Marks A, Brown J, et al. Prevalence of Bartonella henselae antibodies in pet cats throughout regions of North America. J Infect Dis (1995) 172:1145–9. doi:10.1093/infdis/172.4.1145
51. Peterson AT, Soberón J, Sánchez-Cordero V. Conservatism of ecological niches in evolutionary time. Science (1999) 285:1265–7. doi:10.1126/science.285.5431.1265
52. Tocchio LJ, Gurgel-Gonçalves R, Escobar LE, Peterson AT. Niche similarities among white-eared opossums (Mammalia, Didelphidae): is ecological niche modelling relevant to setting species limits? Zool Scr (2014) 44:1–10. doi:10.1111/zsc.12082
53. Flegr J, Prandota J, Sovičková M, Israili ZH. Toxoplasmosis – a global threat. Correlation of latent toxoplasmosis with specific disease burden in a set of 88 countries. PLoS One (2014) 9:e90203. doi:10.1371/journal.pone.0090203
54. Lélu M, Langlais M, Poulle M-L, Gilot-Fromont E. Transmission dynamics of Toxoplasma gondii along an urban–rural gradient. Theor Popul Biol (2010) 78:139–47. doi:10.1016/j.tpb.2010.05.005
Keywords: Bartonella spp., environmental transmission, Lynx rufus, niche, Puma concolor, Toxoplasma gondii
Citation: Escobar LE, Carver S, Romero-Alvarez D, VandeWoude S, Crooks KR, Lappin MR and Craft ME (2017) Inferring the Ecological Niche of Toxoplasma gondii and Bartonella spp. in Wild Felids. Front. Vet. Sci. 4:172. doi: 10.3389/fvets.2017.00172
Received: 31 March 2017; Accepted: 28 September 2017;
Published: 17 October 2017
Edited by:
Victoria J. Brookes, University of Sydney, AustraliaReviewed by:
Gerardo Acosta-Jamett, Universidad Austral de Chile, ChileAnke Wiethoelter, University of Melbourne, Australia
Copyright: © 2017 Escobar, Carver, Romero-Alvarez, VandeWoude, Crooks, Lappin and Craft. This is an open-access article distributed under the terms of the Creative Commons Attribution License (CC BY). The use, distribution or reproduction in other forums is permitted, provided the original author(s) or licensor are credited and that the original publication in this journal is cited, in accordance with accepted academic practice. No use, distribution or reproduction is permitted which does not comply with these terms.
*Correspondence: Luis E. Escobar, lescobar@umn.edu, escobar1@vt.edu
†These authors have contributed equally to this work.