Topography of the complete corticopontine projection: From experiments to principal maps
- Centre for Molecular Biology and Neuroscience & Institute of Basic Medical Sciences, University of Oslo, Norway
The mammalian brain is characterized by orderly spatial distribution of its cellular components, commonly referred to as topographical organization. The topography of cortical and subcortical maps is thought to represent functional or computational properties. In the present investigation, we have studied map transformations and organizing principles in the projections from the cerebral cortex to the pontine nuclei, with emphasis on the mapping of the cortex as a whole onto the pontine nuclei. Following single or multiple axonal tracer injections into different cortical regions, three-dimensional (3-D) distributions of anterogradely labeled axons in the pontine nuclei were mapped. All 3-D reconstructed data sets were normalized to a standardized local coordinate system for the pontine nuclei and uploaded in a database application (FACCS, Functional Anatomy of the Cerebro-Cerebellar System, available via The Rodent Brain Workbench, http://www.rbwb.org ). The database application allowed flexible use of the data in novel combinations, and use of a previously published data sets. Visualization of different combinations of data was used to explore alternative principles of organization. As a result of these analyses, a principal map of the topography of corticopontine projections was developed. This map followed the organization of early spatiotemporal gradients present in the cerebral cortex and the pontine nuclei. With the principal map for corticopontine projections, a fairly accurate prediction of pontine target area can be made for any site of origin in the cerebral cortex. The map and the underlying shared data sets represent a basis for modeling of topographical organization and structure–function relationships in this system.
Introduction
Classical recording studies have revealed discrete localization of body part representations in motor and somatosensory cortical areas (see, e.g., Foerster, 1936 ; Penfield and Boldrey, 1937 ; Woolsey et al., 1942 ) and represent the basis for maps of somatotopical organization, featuring a homunculus cartoon superimposed on the brain surface. Topographic mapping is a general principle of organization in the brain, and many projection systems are assumed to hold a relatively simple topography, reflecting the orderly neighboring relationships of the body musculature or sensory surfaces, such as somatotopically, retinotopically, or tonotopically organized cortical brain maps (see, e.g., Irvine, 1992 ; Killackey et al., 1995 ; Roskies et al., 1995 ; Schreiner and Langner, 1997 ; Sefton and Dreher, 1995 ; Tracey and Waite, 1995 ). However, at higher levels of processing in cortical and subcortical networks, more complicated patterns of organization occur (see, e.g., Felleman and Van Essen, 1991 ; Gerfen, 1992 ; Joel and Weiner, 2000 ). Such more complicated maps are viewed as important in the context of understanding brain function (see, e.g., Sporns et al., 2004 ; Strogatz, 2001 ; Thivierge and Marcus, 2007 ). From the concept that specific patterns of afferent and efferent connections are key determinants of function and computational capacities of a given brain region (see, e.g., Kaas, 1997 ; Leise, 1990 ; Mountcastle, 1997 ; Nelson and Bower, 1990 ; Schwarz and Thier, 1999 ), it follows that characterization of wiring patterns and underlying organizational principles is required to gain understanding of how different brain systems function under normal or pathological conditions.
Wiring patterns and topographical organization have been extensively studied in the cerebro-ponto-cerebellar system, one of the largest projection systems in the brain. The pontine nuclei, intercalated between the cerebral cortex and the cerebellum, are typically attributed a complex clustered organization (see e.g., Brodal and Bjaalie, 1992 ; Ruigrok, 2005 ; Schmahmann and Pandya, 1997a , 1997b ; Schwarz and Thier, 1999 ), related to a map transformation from orderly maps in the cerebral cortex (Chapin and Lin, 1984 ; Welker, 1971 ; Woolsey and Van der Loos, 1970 ) to disseminated, fractured representations in the granular layer of the cerebellar cortex (Bower et al., 1981 ; Shambes et al., 1978 ). Our recent studies in rat have, however, shown that somatosensory and motor corticopontine projections have a simpler than previously assumed organization (Leergaard et al., 2000a , 2000b , 2004 , 2006 ; see also Leergaard, 2003 ). Thus, with use of computerized three-dimensional (3-D) reconstruction, widespread clusters of corticopontine axonal terminal fields were found within concentrically organized layers, resembling the inside-out organization of sharply defined lamellar zones reported in primates (Brodal, 1978 ; Dhanarajan et al., 1977 ; Hartmann von Monakow et al., 1981 ; Nyby and Jansen, 1951 ; Wiesendanger et al., 1979 ; see also, Schmahmann and Pandya, 1997a , 1997b ). Based on findings in newborn rats, we have earlier proposed that the overall topographical layout of corticopontine projections is determined by interaction of temporal and spatial gradients operative within the source (cerebral cortex) and target region (Leergaard et al., 1995 ; see also Altman and Bayer, 1996 ; Leergaard, 2003 ). Thus, it should be possible to explain the seemingly complex distribution of labeled clusters in the pontine nuclei from a general set of organizational principles. In the present study, we have used the FACCS (Functional Anatomy of the Cerebro-Cerebellar System) database application (Bjaalie et al., 2005 ; Moene et al., 2007 ; http://www.rbwb.org/ ) as a basis for the analyses. We have (1) re-used previously published data, and (2) performed new experiments and uploaded new data covering projections from regions of the cerebral cortex not previously covered by the database. The accumulated collection of 3-D data sets was subsequently submitted to a series of analyses, applying different organizational principles to the data, and testing the ensuing results by use of different combinations of data. Based on these analyses, we present a principal representation of the overall corticopontine projection map, allowing a general prediction of the localization and distribution of corticopontine projections originating from any corticocortical location.
Materials and Methods
Our collection of data included 31 tracer injection sites placed in 18 Sprague Dawley and Wistar rats (Table 1 ). Twenty-five of these experimental data sets were obtained from 13 new tracing experiments, and six data sets were re-used from the previously published experiments (Leergaard et al., 2000a , 2000b ), downloaded from the database Functional Anatomy of the Cerebro-Cerebellar System in rat (http://www.rbwb.org/ ). All experimental procedures were reviewed by the institutional animal welfare committee of the University of Oslo, and were in compliance with European Community regulations on animal well being, and National Institutes of Health guidelines for the care and use of laboratory animals.
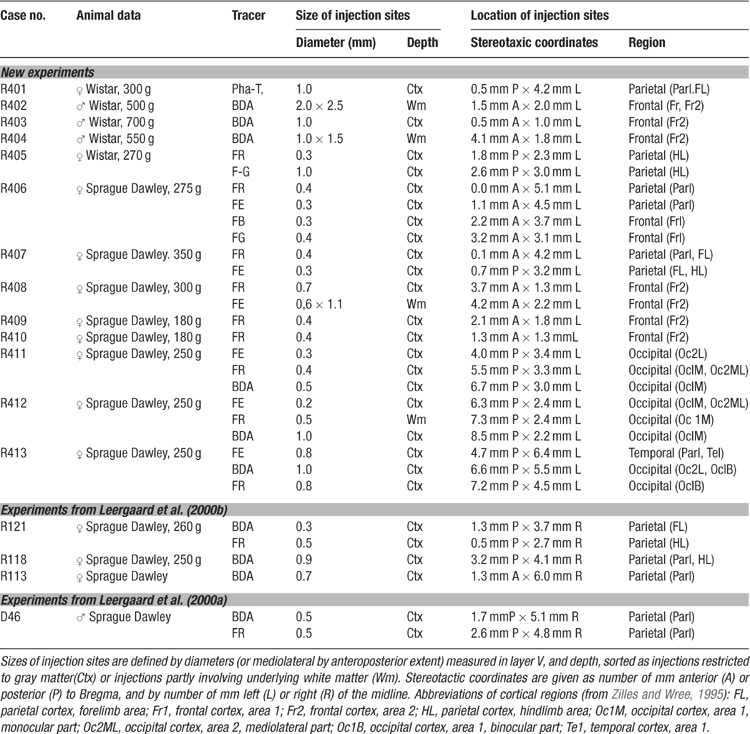
Table 1. Animals, tracers, and size and position of injection sites
Axonal Tracing Experiments
All surgical procedures were performed under deep surgical anesthesia, obtained by subcutaneous injection (0.35 mL per 100 g) of a mixture with equal volumes of Hypnorm® (Janssen Pharmaceutica, Beerse, Belgium) and Dormicum® (5 mg/mL; F. Hoffmann – La Roche, Basel, Switzerland). Both single and multiple tracing paradigms were used (Table 1 ). For single tracing experiments, we used biotinylated dextran amine (BDA, Molecular Probes), tetramethylrhodamine conjugated dextran amine (FluoroRuby, FR, Molecular Probes) or Phaseolus vulgaris-leucoagglutinin (Pha-L, Vector Laboratories, Burlingame, CA). For multiple tracing experiments, we combined FR with one or more of the following tracers: BDA, fluorescein conjugated dextran amine (FluoroEmerald, FE, Molecular Probes, Eugene, OR), Fast Blue (FB, Sigma, St. Louis, Missouri), and/or Fluoro-Gold (F-G, Fluorochrome Inc., Englewood, CO). After craniotomy and duratomy, small amounts of tracer were applied at 1.0–1.2 mm depth at various anatomically defined locations in the left cerebral cortex. Aqueous solutions of 10% BDA or 2.5% Pha-L were applied through glass micropipettes by iontophoresis (0.5 μA pulsed for 20 minutes). Aqueous solutions of 10% FR, 10% FE, 3% FB, or 2% F-G, were applied by pressure injection (0.1–0.2 μL) through glass micropipettes mounted on Hamilton syringes. In three cases (R411, R412, and R413), solid crystals of FR and FE were implanted as described by Glover (1995) . After 1 week, the animals were re-anesthetized and killed by transcardial perfusion with lukewarm saline followed by 4% paraformaldehyde and 10% phosphate-buffered sucrose. The brains were removed, photographed, and soaked in 30% sucrose for 1 day prior to sectioning. Frontal sections of the cerebral cortex and transverse sections of the brain stem were cut at 50 μm on a freezing microtome.
Histochemistry
Pha-L or BDA labeling was visualized histochemically in either complete series of sections or alternate series of sections. Sections containing Pha-L were processed as outlined by Gerfen and Sawchenko (1984) . Sections containing BDA were processed according to steps 1–7 in Lanciego and Wouterlood (1994) . For both Pha-L and BDA processing, the avidin–biotin solution (as used in the original protocols) was substituted with the streptavidin–biotinylated horse-radish-peroxidase complex (Amersham International, Buckinghamshire, England), as employed by Lehre et al. (1995) . Sections containing fluorescent tracers only were mounted directly on gelatine-coated glass and coverslipped with Eukit.
Data Acquisition
Injection sites and labeling patterns within the pontine nuclei were observed with a Leica DMR microscope (Leica, Deerfield, IL). Pha-L and BDA labeling was viewed with translucent light, FR labeling was viewed with excitation light of 515–560 nm (Leica N2.1 filter block), FE labeling with excitation light 460–500 nm (Leica L5 filter block), FB, and F-G labeling with excitation light of 340–380 nm (Leica A filter block).
The location and extent of injection sites and axonal labeling patterns were recorded using an image-combining computerized microscope (based on the Leica DMR microscope) running the program MicroTrace (Leergaard and Bjaalie, 1995 ). The size of each injection site was defined by the maximum width of dense staining at the level of layer V (the cortical layer containing cell bodies of corticopontine neurons). The position and extent of all injection sites was mapped onto a standard drawing of the brain (Figure 1 ), using combined data from photographs of the intact brain, pre-operative stereotaxic data, and measurements from histological sections. Anterogradely labeled plexuses within the pontine nuclei were coded semi-quantitatively as points (Figure 1 I, compare with Figures 1 E–H; see also Leergaard and Bjaalie, 1995 ; Leergaard et al., 1995 , 2000a , 2000b , 2004 ). In areas with low density of labeling, point coordinates were placed at regular intervals along the length of single axons. In areas with dense labeling, a rough correspondence was sought between the density of labeling and the number of digitized points. The ventral surface of the pons, the outlines of the pontine gray, the contours of the corticobulbar and corticospinal fiber tracts, and the midline of the brain and fourth ventricle served as reference lines. For the 3-D reconstruction, visualization, and analysis of the distribution of labeling, we used program Micro3D for Silicon Graphics (Neural Systems and Graphics Computing Laboratory, University of Oslo, Norway; http://www.nesys.uio.no/ ; Bjaalie et al., 2006 ). The serially ordered digitized sections were aligned interactively on the screen using the above mentioned anatomical boundaries and landmarks. To facilitate the alignment, the 3-D reconstructions were inspected from different angles of view using real-time rotation. Each section was assigned a z-value defined by its thickness and serial number. The 3-D reconstruction from each case was scaled to an average-size pontine coordinate system (see below). Variations in pontine distributions of point clusters were analyzed by visualizing different combinations of the normalized reconstructions (Figures 2 3 4 5 ). Surface modeling of the outer boundaries of the brain stem, the pontine nuclei, and the descending cerebral peduncle (Figure 1 ) was based on digitized contour lines and performed with a simple triangulation method or with the use of the software library SISL (SINTEF Spline Library; cf. Bjaalie et al., 1997 ). Isodensity surfaces surrounding the point clusters (Figures 2 and 3 ) were created using a Java 3D (Sun Microsystems Inc., Santa Clara, CA) application (J.O. Nygaard, S. Gaure, C. Pettersen, H. Avlesen, and J.G. Bjaalie, see http://www.nesys.uio.no/ ). The boundaries of the clusters were defined with use of implicit representations of geometries. Thus, scalar fields were generated by binning point coordinates and estimating the relative density for each bin. For visualization, isosurfaces were extracted by marching cube like algorithms.
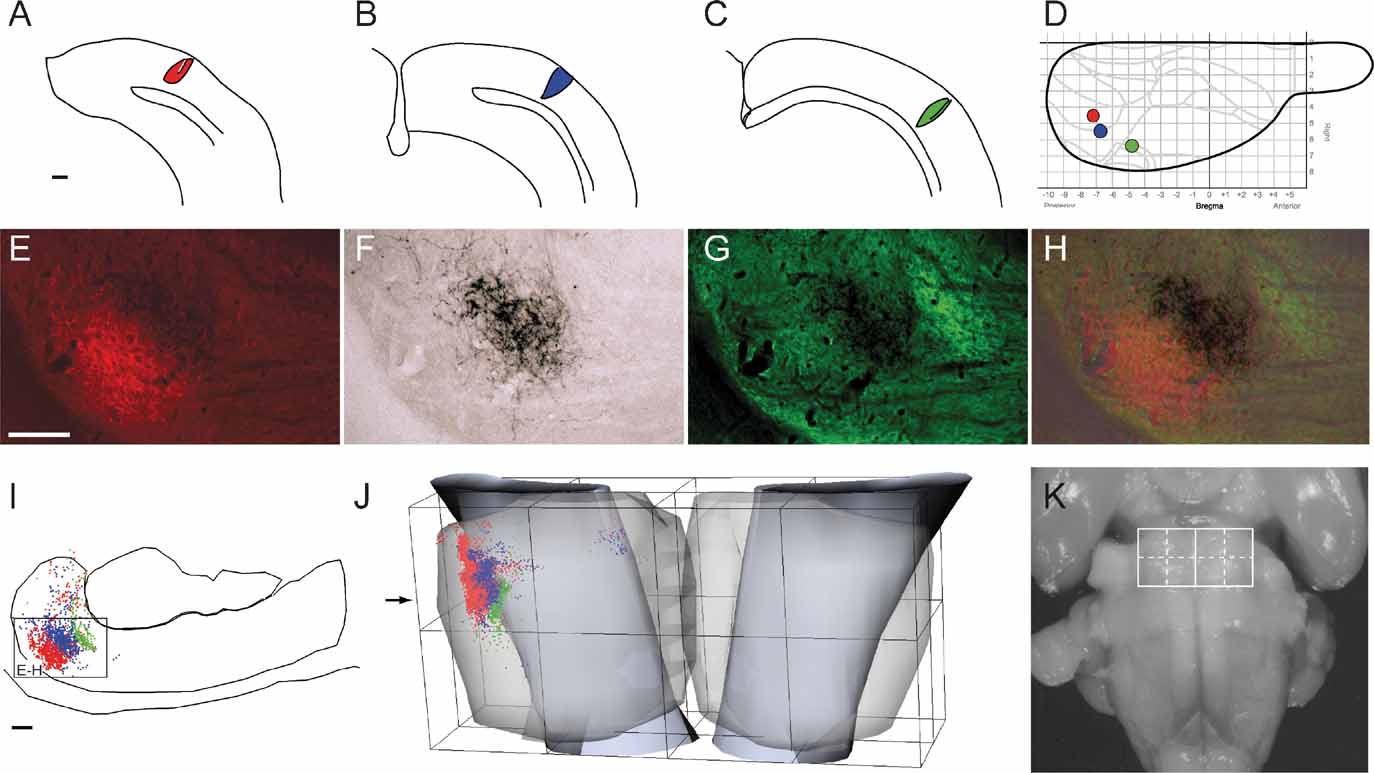
Figure 1. Distribution of triple tracer injections and anterogradely labeled fibers. A–C, schematic drawings of coronal sections through the center of Fluoro-Ruby, FR (A), biotinylated dextran amine, BDA (B), and Fluoro-Emerald, FE (C) injection sites in animal R413. D, Schematic drawing of the cerebral cortex viewed from dorsal, showing the position and size of the injection sites in A (red), B (blue), and C (green) in relation to the Bregma-related stereotaxic coordinate system (grid, in millimeter units) of Paxinos and Watson (1982) , as well as the cytoarchitectonic parcellation of the cerebral cortex (gray lines) of Zilles and Wree (1995) . E–G, Corresponding photomicrographs of a transverse section through the pontine nuclei (at level indicated in J) showing the pontine distribution of FR (E), BDA (F), and FE (G) labeled fibers. (H), Overlay of the images in E-G. (I), Computerized plot of the section shown in E–H. Labeled axons are semiquantitatively represented by dots, corresponding to the observed density of labeling. Lines indicate the outer boundaries of the ventral surface of the brain stem, the pontine nuclei, and the descending peduncle. The plexuses of labeled axons are largely segregated, and distributed with an inside-out shift in pontine location. (J) Computerized 3-D reconstruction of the pontine nuclei with labeled axons represented as color coded dots. The outer boundaries of the pontine nuclei are shown as transparent surfaces, and the boundaries of the peduncle as solid surfaces. A bounding box, representing the standardized coordinate system for the pontine nuclei, has been orientated along the long axis of the brain stem and fitted to the external boundaries of the pontine nuclei. The arrow indicates the rostrocaudal level of the section shown in I. (K) Photograph of the rat brain stem in view from ventral, with the pontine nuclei coordinate system superimposed. Scale bars, 500 μm (A–C), and 50 μm (E–I).
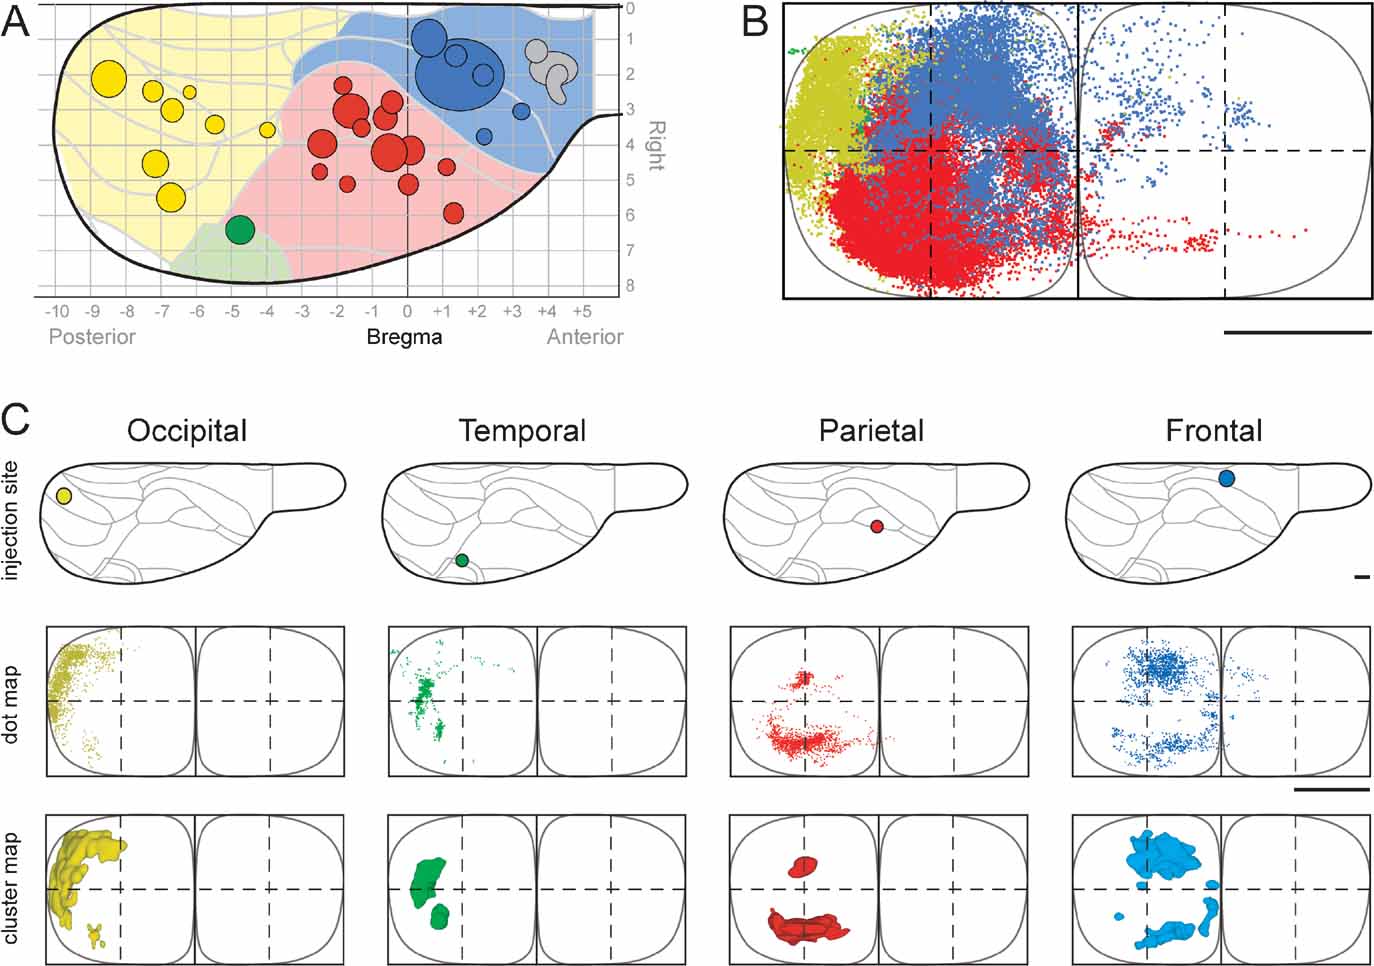
Figure 2. Regional organization of corticopontine projections. (A) The location and size of 31 tracer injection sites is mapped onto a diagram of the right cerebral surface. Major brain regions are color coded (blue, frontal; red, parietal; green, temporal; yellow, occipital). Presentation otherwise as in Figure 1 . Injection sites indicated in gray did not give rise to pontine projections. (B) The pontine nuclei coordinate system (view from ventral), with solid curved lines indicating the outer boundaries of the pontine nuclei. Dots, representing labeled corticopontine axons from all cases investigated, are color coded in correspondence with A. (C) Selected individual experiments showing representative distributions of corticopontine projections from each region. The distribution of labeling is shown as dot maps and as cluster maps, with solid surfaces representing the external boundaries of densely labeled axonal clusters. The experiments clearly show that cerebral regional topography is maintained in the pontine nuclei. Projections arising from the occipital cortex (animal R412, BDA injection) are distributed laterally in the ipsilateral pontine nuclei. Projections from the temporal cortex (animal R411, FE injection) are shifted internally, whereas projections from parietal cortex (R407, FR injection) are distributed in central and caudal regions, and projections from frontal cortex (R410) are located medially and rostrally. Contralateral projections are sparse, but appear as mirror image of the (medially located) ipsilateral projections. The individual experiments show the characteristic clustered appearance of corticopontine projections. Restricted cortical tracer injections typically give rise to two to three distinct spherical or elongated axonal clusters. Bars, 1 mm.
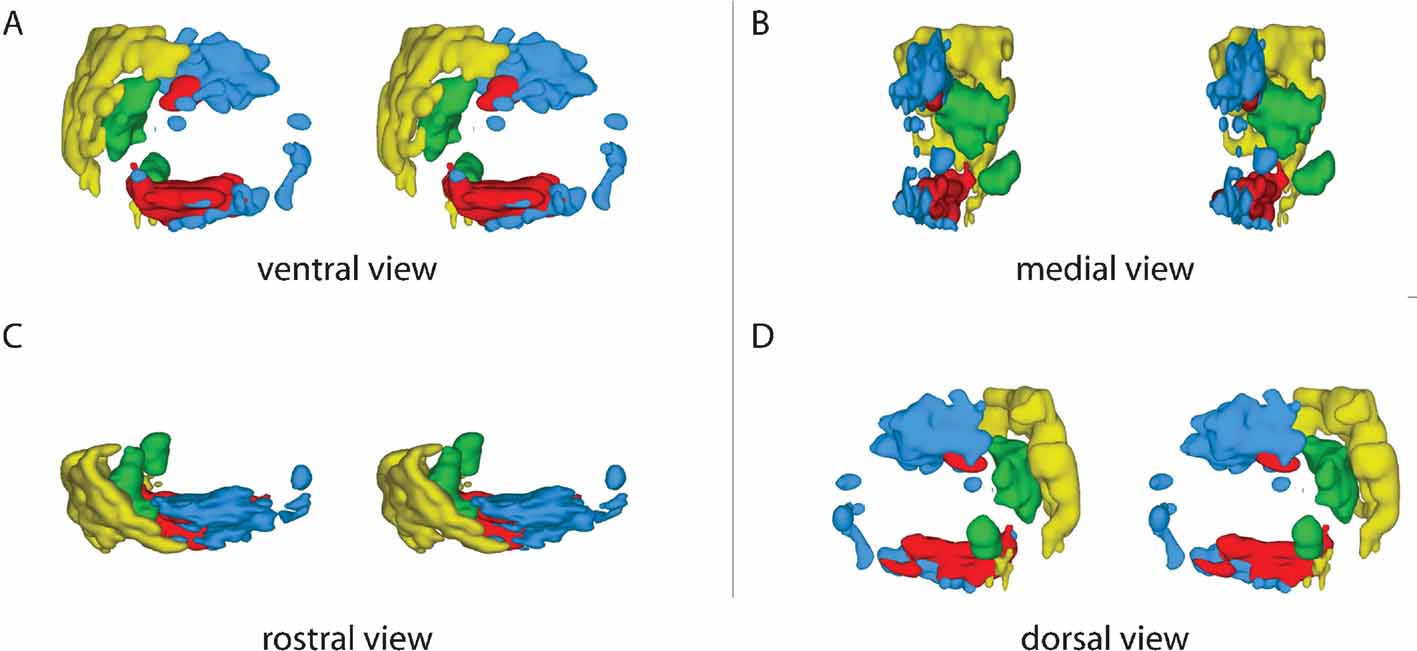
Figure 3. 3-D distribution of pontine clusters. Computer-generated stereo pairs showing the 3-D shape and relationship of pontine nuclei projections arising from occipital (yellow), temporal (green), parietal (red), and frontal (red) cortical regions (same cases as shown in Figure 2 ) in standard angles of view. The viewer must cross the eye axis to let the pair of images merge into a 3-D image. The cluster maps clearly show that the topographically organized corticopontine clusters are largely segregated but have close neighboring relationships at multiple locations.
Data Normalization and Comparison
To allow direct comparison of data, all 3-D reconstructions were normalized to our standard size coordinate system for the pontine nuclei (see also, Bjaalie and Leergaard, 2006 ; Brevik et al., 2001 ; Leergaard et al., 2000a , 2000b ). The coordinate system was applied as outlined in Bjaalie and Leergaard (2006) , by orienting a cuboid bounding box along the long axis of the brain stem at level of the pons, and size adjusting the boundaries to fit the (histologically defined) rostral, caudal, lateral, medial, and ventral limits of the pontine nuclei (Figure 1 J; for details and technical implementations, see “Ontologies and coordinate systems” in the FACCS application at http://www.rbwb.org/ ). New tracer injections were placed in the left cerebral cortex, and labeling was predominantly located within the left pontine nuclei. In order to fit new data to the previously published data in the FACCS database, all 3-D reconstructions were mirrored from left to right. Simplified presentation diagrams were used to show data point distributions in relation to the pontine coordinate system (Figures 2 , 4 , and 5 ). The new data were submitted to the publicly available FACCS database (http://www.rbwb.org/ ).
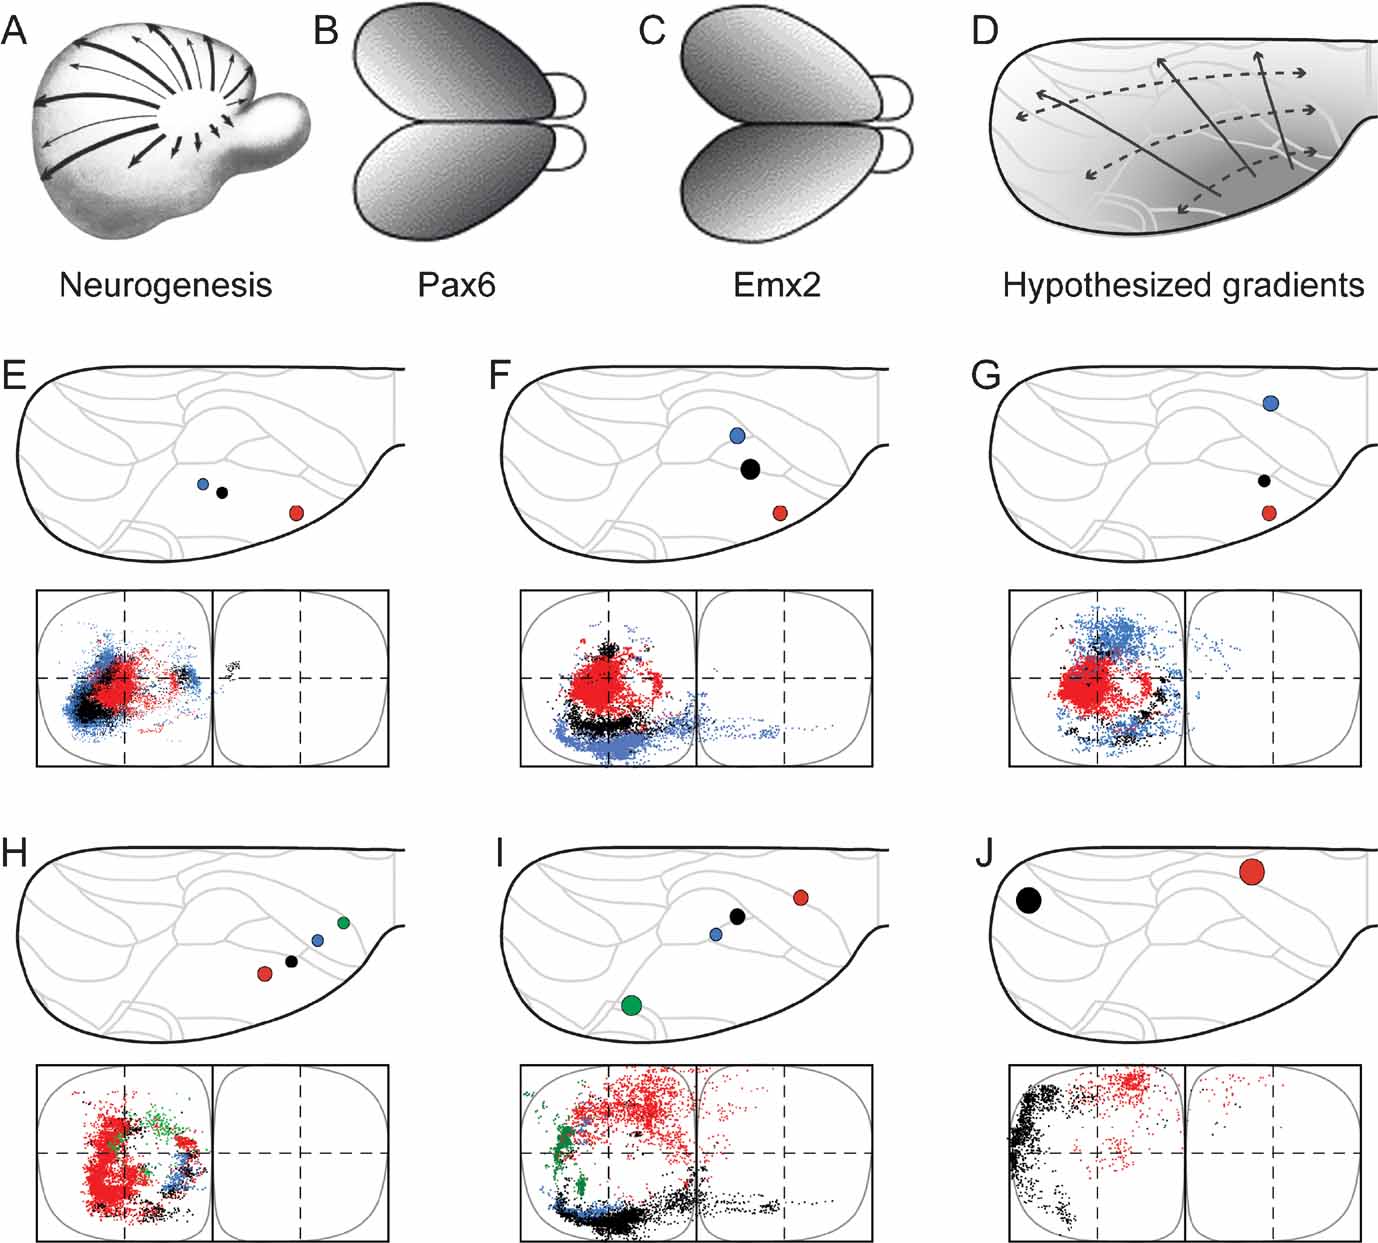
Figure 4. Organization of corticopontine projections according to cortical gradients. Selected combinations of cerebral injection sites reveal concentric topographical organization in the pontine nuclei. (A-D) Cortical neurogenesis (A, reproduced from Smart, 1984 , with permission) and regionalization follows graded gene expression patterns (B, C, reproduced from O’Leary and Nakagawa, 2002 , with permission) that shift from anterolateral to posteriomedial. D, Interpretation of cerebal maturation gradients mapped onto the standard dorsal view drawing of the cerebral cortex. (E–G) Three different combinations of injection sites revealing a concentric, inside-out arrangement of terminal fields in the pontine nuclei. Presentation as in Figure 2 . The selected three injection sites are located along the cerebral neurogenetic gradient, colored from red to black to blue, from the anterolateral cortex toward occipital (A, animal R113, red; D46/BDA, black; D46/FR, blue), (B, R113, red; R407/FR, black; R121/FR, blue) and frontal (C, R113, red; R406/FE, black; R410, blue), all giving rise to concentrically organized patterns with gradually more external location of the black and blue dots surrounding the centrally located red dots. (H–J), Three other combinations of injection sites, oriented from frontal and medial toward occipital and lateral, located approximately within the same neurogenetic zone (H, R406/FR, red; R406/FE, blue; R406/FB, blue; R406/F-G, green; I, R409, red; R121/BDA, black; R121/FR, blue; R412/FE, green; J, R412/FR, black, R403, red). Together, the different axonal clusters form circular volumes, increasing in diameter as the rows of injection sites are shifted from anterolateral toward dorsomedial, along the cerebral neurogenetic gradient.
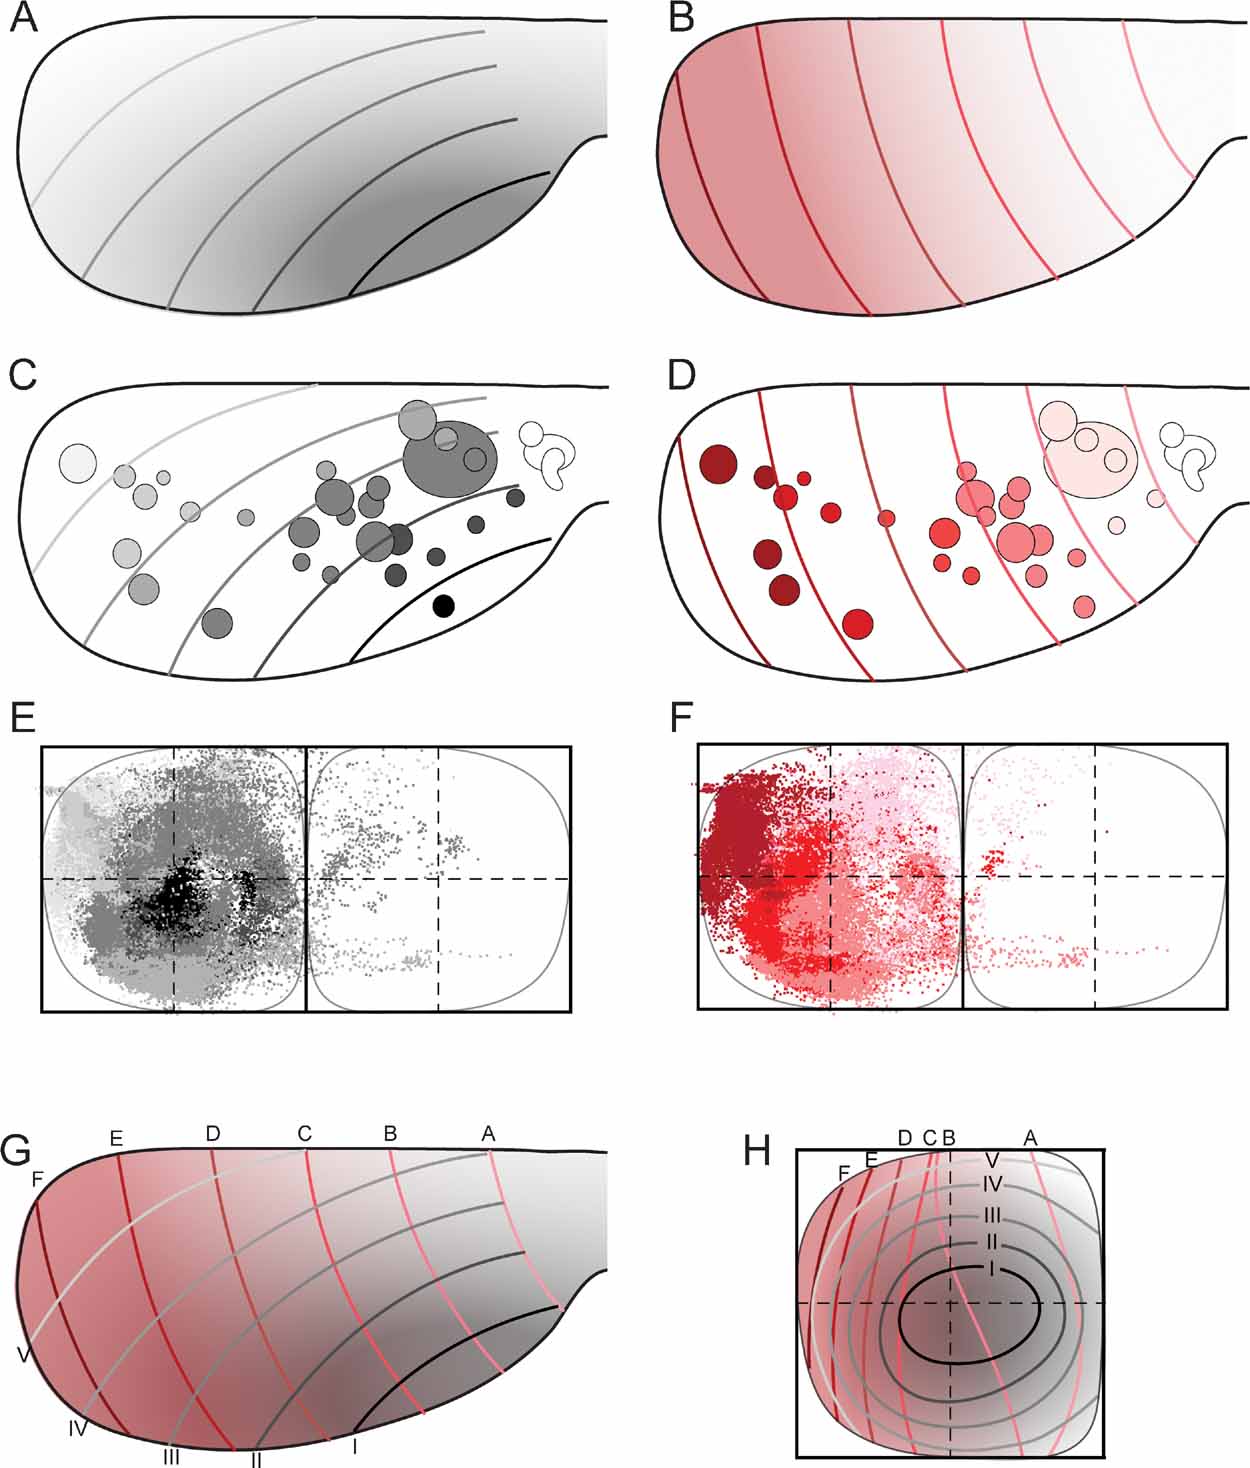
Figure 5. Map transformation principles in the rat corticopontine system. Injection sites and corresponding dot populations representing labeled fibers are color coded according to graded patterns in the cerebral cortex. (A, C) When all experimental data are colored following the putative orientation of cortical neurogenesis, from anterolateral (dark gray) toward medial and posterior (white), a pattern of concentric organization is revealed (E), with black dots located in the center, and gradually brighter colored dots distributed more externally. (B, D) When the same data are colored following the cortical frontal to occipital axis (white to red), a general medial to lateral organization is seen in the pontine nuclei (F), with frontally originating dots primarily located in the medial half of the pontine nuclei, and darker colored dots gradually distributed toward lateral. (G, H) Principal map of corresponding locations in the cerebral cortex (viewed from dorsal) and pontine nuclei (viewed from ventral). In G, the gray (A) and red (B) graded cortical patterns are combined. Gridlines are alphabetically named from frontal to occipital, and labeled with roman numbers from anterolateral to dorsomedial. (H) Graphical model of corresponding topographical distributions (inside-out, black to white; medial to lateral, white to red) in the pontine nuclei. The two coordinate grids allow prediction of the overall pontine distribution of axonal plexuses arising from any location in the cerebral cortex.
Illustrations
Digital models and data representations obtained in the Micro3D program were exported to Adobe Illustrator CS2 (Adobe Systems Inc., San Jose, Ca), which was used for assembly of all illustrations. Color slide photomicrographs (Figures 1 E–1 H) were taken through the Leica DMR microscope using Fujichrome 1600 film, and imported to Adobe Photoshop CS2 (Adobe Systems Inc., San Jose, Ca) using a Polaroid SprintScanner 35 (Polaroid Corporation, Waltham, MA). Contrast enhancement was performed using the AutoLevels algorithm in Photoshop. The brain stem photograph in Figure 1 K was obtained through a Nikon Multiphot microscope (Nikon, Tokyo, Japan) equipped with a MacroNIKKOR 1:4.5 lens.
Results
The present report is based on findings from 13 not previously published single and multiple tracing experiments, combined with data from 6 previously published experiments downloaded from the FACCS database application available via The Rodent Brain Workbench (http://www.rbwb.org/ ). The pool of data used encompassed altogether 31 tracer injections (Table 1 ). All data on distribution of corticopontine axons were normalized to a standardized, local coordinate system for the pontine nuclei (Bjaalie et al., 2005 ; Bjaalie and Leergaard, 2006 ; Brevik et al., 2001 ; Leergaard et al., 2000a , 2000b , 2004 ), according to procedures detailed in Bjaalie and Leergaard (2006) and on the FACCS web pages. Various combinations of data sets were used to test different organizational schemes proposed for the spatial distribution of corticopontine terminal fields of axons.
General Features of Labeling
In most cases, the estimated size of the neural tracer injection sites was below 1.0 mm in diameter and restricted to cortical gray matter (Table 1 ). In both cases the injection sites were somewhat larger, and in four cases also involving the white matter directly underneath the injection site (Table 1 ). The tracers BDA, Pha-L, FR, and FE, all labeled the complete axonal trajectory from cortical layer V to the pontine nuclei, where labeled fibers branched extensively to form distinct plexuses considered as putative terminal fields (Figures 1 E–1 H). In comparison, anterograde labeling obtained with F–G and FB was less crisp, but nevertheless contributed with useful spatial distribution data when used in combination with other tracers in single animals. Labeled fibers were in general located in two or three clusters within the ipsilateral pontine nuclei (Figure 2 C), and only sparse labeling was found contralaterally, appearing as a weak mirror image of the ipsilateral labeling (Figure 2 B). This contralateral component was most prominent when the ipsilateral labeling was located medially in the pontine nuclei. The shape, size, and distribution of pontine labeling varied as a function of cortical site of origin (Figures 2 3 4 5 ).
Regions as Organizing Principle
We here first characterize the pontine projections from frontal (primarily motor), parietal (primarily somatosensory), temporal (primarily auditory), and occipital (visual) regions of the cerebral cortex. Previous investigations in rat have emphasized that different (motor or sensory) regions of the cerebral cortex mainly project to segregated regions in the pontine nuclei, but also have convergent projections (Leergaard et al., 2004 ; Mihailoff et al., 1985 ; Wiesendanger and Wiesendanger, 1982 ; for a review, see Ruigrok, 2005 ). To investigate the regional organization of corticopontine projections, we sorted our injection sites into four main cortical regions (frontal, parietal, temporal, and occipital, Figure 2 A), on the basis of estimated stereotaxic coordinates of injection site centers (Table 1 ) and their relationship to cytoarchitectonic parcellation schemes (Table 1 ; Figure 2 A). In the context of this analysis, results from multi-tracer experiments are described individually as if they were single tracing experiments. When the superimposed pontine labeling from all cases were color coded according to the cortical region of origin (Figure 2 B), it was evident that frontal (motor), parietal (somatosensory), and temporal/occipital (auditory/visual) regions of the cerebral cortex project to largely segregated domains within the pontine nuclei. In general, frontal regions project rostromedially, parietal regions centrocaudally, and temporal and occipital regions progressively more laterally and rostrally (Figures 2 and 3 ). Thus, our findings show that the large scale regional topography of the cerebral cortex is preserved within the clustered 3-D pontine map. At a finer scale, however, the organization becomes more complex, since some axonal clusters of different modalities are brought in close spatial proximity, located side-by-side in the pontine nuclei (Figure 3 ). For example, smaller components of projections from the parietal cortex are typically found in pontine regions primarily containing projections from the frontal cortex, and vice versa (blue and red clusters in Figure 3 ). This observation is supported by findings in a previous study (Leergaard et al., 2004 ), in which functionally related (somatotopically homologous) regions of SI and MI were found to have partly overlapping projections. Also, projections from the occipital cortex were found to have a close relationship with projections from the temporal cortex, as well as a close proximity to regions containing projections from frontal cortex. In summary, projections from somatosensory and motor cortex are found in central, medial, and caudal parts of the pontine nuclei, whereas projections from visual and auditory cortex are found in separate lateral and rostral regions.
Cortical Gradients as Organizing Principle
We have previously hypothesized that a concentric topographic organization in the pontine nuclei correlates with patterns occurring as gradients in the developing cerebral cortex, such as the cortical maturational (neurogenetic) gradient (Figure 4 A; Smart, 1984 ; Uylings et al., 1990 ) and similarly oriented graded gene expression patterns (Figures 4 B and 4 C; (see, e.g., Bishop et al., 2000 ; Mackarehtschian et al., 1999 ). In addition, previous reports also describe the topographical rule that the frontal to occipital axis of the cerebral cortex (which is more or less perpendicular to the neurogenetic gradient) is distributed from medial to lateral in the pontine nuclei (Wiesendanger and Wiesendanger, 1982 ; Mihailoff et al., 1985 ). To investigate how cortical sites of origin located within or across these gradients of the cerebral cortex (Figure 4 D) are projected onto the pontine nuclei, we selected three combinations of cortical injection sites linearly positioned in rows radiating from anterolateral toward medial and occipital parts of the cortex, and three combinations of injection sites positioned in rows from frontal toward occipital.
The first sets of injection sites (Figures 4 E–G) were chosen to be located along the neocortical maturation gradient (Figure 4 A; Smart, 1984 ; Uylings et al., 1990 ), matching as closely as possible the decreasing expression of the homeodomain transcription factor Emx2 and increasing expression of paired-box transcription factor Pax6 as observed in mouse (Figure 1 B and Figure 1 C; Bishop et al., 2000 ; O’Leary and Nakagawa, 2002 ). The second sets of injection sites (Figures 4 H–J) were chosen to be located in cortical regions holding an equal maturation status and equal gene expression level (i.e., at sites with equal gray levels in Figure 4 D). According to the principles outlined in Leergaard et al. (1995) , we predicted that injections into sites at increasing distance from the early matured anterolateral cortex would label axonal clusters occupying progressively more external location in the pontine nuclei, and that injections into cortical sites at similar distance from the anterolateral cortex would give rise to axonal clusters at the same distance from an imaginary interal core of the pontine nuclei.
As shown in Figure 4 E–4 G, all three combinations of data sets with progressively more occipital or medial location of the injection site (i.e., data sets with injections at increasing distance from the anterolateral cortex), displayed a concentric arrangement of pontine labeling, with axonal clusters distributed from internal toward external in the pontine nuclei. Similar results were obtained with use of three tracers in the same animal (Figure 1 ). By contrast, the three combinations of data sets in which the injection sites were sequentially positioned from rostral toward occipital (i.e. at approximately similar distance from the anterolateral cortex), revealed concentric pontine labeling patterns in which segregated axonal clusters form components of a circle at similar distance from an imaginary core of the pontine nuclei (Figures 4 H–J). This was valid both for multi-tracer experiments (Figure 4 H) and combined data sets (Figures 4 I and 4 J). Again, these pontine “circles” of labeling had increasing diameters, i.e., progressively more external locations, in proportion to increasing distance of the injection sites from the anterolateral region of the cortex.
Finally, to visualize the overall distribution patterns, we grouped all data sets and assigned color in accordance with the hypothesized cortical anterolateral-to-dorsomedial (neurogenetic orientation, Figures 5 A and 5 C), and frontal-to-occipital distribution gradients (Figures 5 B and 5 D). Again, in accordance with the observations based on selections of individual data sets (Figure 4 ), we observed the same predicted internal to external (Figure 5 E) and medial to lateral (Figure 5 F) distribution patterns in the pontine nuclei.
We thus conclude that (1) linear shifts in cortical site of origin, oriented in relation to early cortical maturation gradients, correspond to concentric inside-out shifts in distribution of corticopontine terminal fields, (2) that the orderly two-dimensional (2-D) topography of the neocortical surface is orderly represented within concentric layers in the 3-D volume of the pontine nuclei.
Distribution Principles for the Organization of Corticopontine Projections
As described above, focal cortical tracer injections give rise to several delineated axonal clusters that are orderly distributed within the pontine nuclei. Based on our previous (Leergaard et al., 1995 , 2000a , 2000b , 2004 ; see also Leergaard, 2003 ) and present findings, we here propose a set of general distribution principles for the organization of pontine projections from the entire cerebral cortex: (1) Cortical locations located along graded patterns present in the developing cortex (Figures 4 A–4 C), thus at increasing distance from the anterolateral cortex (Figures 4 D, 5 A and 5 C), project to pontine clusters located at increasing distance from an imaginary central core of the pontine nuclei (Figures 4 E–4 G and 5 E). (2) Cortical locations at equal distance from the anterolateral cortex (Figure 5 A), project to axonal clusters located at equal distance from the pontine central core, distributed within (imaginary) concentric layers around this core (Figures 4 H–4 J and 5 E). These concentric layers typically consists of either one or two large clusters and one or two smaller clusters (the latter two often found at diametrically opposite location within the layer, Figures 2 C, 3 and 4 E–4 J). (3) The frontal-to-occipital axis of the cerebral cortex (Figures 4 D, 5 B, 5 D) is represented from medial to lateral in the pontine nuclei (Figures 2 , 3 , and 5 F), such that the dominant portion of the labeled clusters have a mediolateral position in the pontine nuclei corresponding to the position of the cortical site of origin along the cerebral frontal to occipital axis. (4) The larger clusters of labeled axons are predominantly located in separate regions in the pontine nuclei, preserving the regional organization of the cerebral cortex, while the smaller clusters often overlap (or co-locate) with projections from neighboring regions. Thus, projections from frontal cortex are predominantly located rostrally and medially, while projections from parietal, temporal, and occipital cortex, respectively predominate in central and caudal, central and lateral, and lateral and rostral parts of the pontine nuclei (Figures 2 and 3 ).
Principal Map of Corticopontine Projections
The distribution principles above imply that the general topographic distribution of corticopontine projections is predictable. To establish a principal map for the distribution of pontine projections from all cerebral areas, we utilized our results to develop a graphical representation of the observed distributions. The principal map is based on the cortical distribution grid created by the perpendicularly oriented distribution gradients (increasing shades of gray and red in Figures 5 A and B, combined to a grid in Figure 5 G). The map is constructed on the basis of groups of data points defined from the cerebral gradients (Figures 5 E and 5 F). Thus, for each group, pontine gridlines are qualitatively defined according to the distribution of the majority of points (seen in view from ventral), aiming to step-by-step reproduce the overall gradual internal-to-external (Figure 5 E) and medial-to-lateral shifts in distribution (Figure 5 F) observed in our dot maps. The ensuing pontine grid (Figure 5 H) consists of 1) concentric lines indicating progressively external location corresponding to the anterolateral-to-dorsomedial shift in cortical location (gray lines in Figure 5 H), and 2) vertical lines indicating progressively more lateral location (red lines in Figure 5 H), corresponding to the frontal-to-occipital shift in cortical location (Figure 5 G). Although limited to a ventral view of the pontine nuclei, this representation allows predictions to be made of the most likely pontine target region for any region of origin in the cerebral cortex. The implementation is exemplified in Figure 6 , where the predicted and observed distributions of four individual data sets are compared (same data as shown in Figures 3 C and 4 ). A prediction of the most likely overall location and relative distribution of the corticopontine projections from a cerebrocortical site of interest, is made by first selecting grid fields of interest in the map of the cerebral cortex (Figure 6 A), and second, by identifying corresponding grids fields in pontine map (Figure 6 B), as illustrated by the color coded fields in the two maps (Figures 6 A and 6 B). Thus, from the principal map, we can infer that a tracer injection medially in the frontal cortex (blue color in Figure 6 ) will label two rostrocaudally separated axonal clusters located medially in the pontine nuclei. Similarly, it can be predicted that a parietal injection (red) will label a smaller rostral and a larger caudal cluster centrally in the pontine nuclei, whereas injections into temporal (green) and occipital (yellow) regions will label axons distributed in progressively more external and lateral lamellar regions. The graphical overlay of the predicted and observed distributions (Figure 6 C) shows a high degree of correspondence, both with respect to the location and relative neighboring relationships within the map. Some mismatch, such as seen for the blue dots in Figure 6 C, is likely to be related to projections not accounted for in the ventral view map, occurring as a result of different dorsoventral location within lamellar subspaces in the pontine nuclei. For example, 3-D inspection of this particular data set (blue surfaces in Figure 3 ) reveals that the most ventral parts of the clusters are curved around the more internally located red clusters, resulting in a projection onto a more internal layer than what was predicted. It is also important to note that the here presented principal map is restricted to predicting overall distributions of main projections. Finer details relating to minor projection clusters and partial overlap of projections, known to occur to a varying degree (Leergaard et al., 2000a , 2004 ; present report) cannot be predicted from these principles. Despite these minor inaccuracies, our principle map allows a fairly accurate prediction of relative distributions in the pontine nuclei.
Discussion
We have studied the topography of rat corticopontine projections by use of axonal tract tracing, 3-D reconstruction techniques, and use of a database application holding a 3-D digital atlas of corticopontine projection data normalized to the same coordinate system. New experimental tracing data were combined with previously published data. Dynamic visualization of data from different combinations of experiments allowed an investigation of pontine spatial organization patterns relative to various schemes of organization in the cerebral cortex. We formulate a set of topographic distribution principles and propose a principal map for the rat corticopontine projection. This map allows a prediction of the overall distribution of pontine projections from any cortical site of origin.
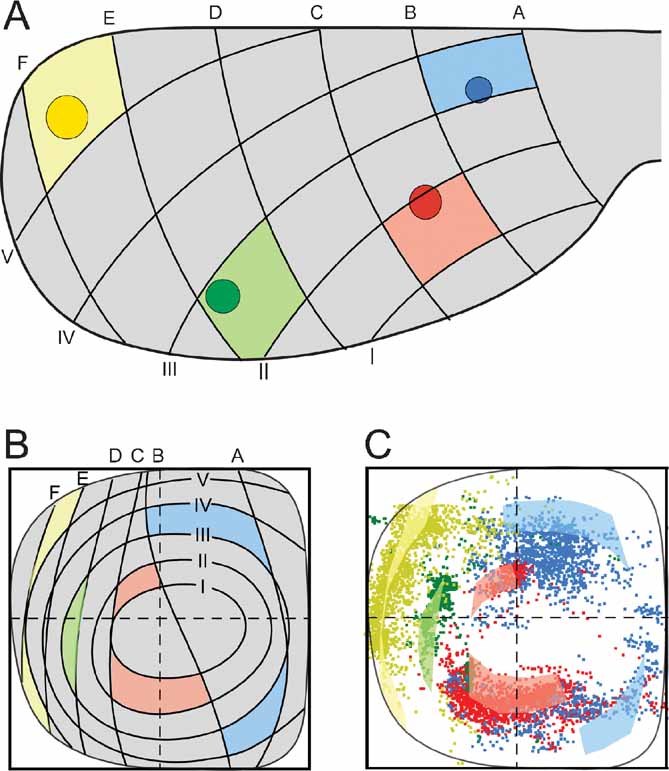
Figure 6. Correspondence between predicted and observed distribution of corticopontine projections. (A) four injection site positions (same data as shown in Figures 3 and 4 ) are indicated on a dorsal view of the cerebral cortex together with a positional grid of the cerebral surface (explained in Figure 5 ). Grid fields containing the injection site center are correspondingly colored. (B) Predicted distributions of projections from the four injection sites in (A) shown in our principal graphical representation (explained in Figure 5 ). Prediction of overall pontine distribution is made by coloring pontine grid fields corresponding to the cortical grid fields in (A). (C) Overlay of predicted (transparent colored fields) and observed (colored dots) pontine distributions shows a high degree of correspondence.
Neuroinformatics and Data Sharing
The methodological approach chosen in the present study has been inspired by recent developments in the field of neuroinformatics, with initiatives toward data sharing in databases, and re-use of previously published data (see, e.g., Amari et al., 2002 ; Chicurel, 2000 ; Eckersley et al., 2003 ; Fox and Lancaster, 2002 ; Koslow, 2000 ; Shepherd et al., 1998 ). The present use of the FACCS database application represents a novel approach to neuroanatomy and axonal tracing based brain mapping, allowing flexible analyses of multiple combinations of experimental data (Bjaalie et al., 2005 ; Moene et al., 2007 ). By investigating the the distributions of pontine labeling patterns emerging from different combination of cortical sites of origin, we could directly observe how 2-D cerebral brain map patterns are transformed into 3-D patterns in the pontine nuclei. The methods for data acquisition and 3-D reconstructions have been discussed elsewhere (Bjaalie and Leergaard, 2005 , 2006 ). The use of a standard 3-D local coordinate system for the pontine nuclei (Bjaalie and Leergaard, 2006 ; Brevik et al., 2001 ; Leergaard et al., 2000a , 2000b ) has been a prerequisite for normalizing and comparing data. The original 3-D data sets are shared through the database application (http://www.rbwb.org/ , see FACCS application (Bjaalie et al., 2005 ; Moene et al., 2007 ), thus allowing any user to replicate our findings or test alternative principles. Users may make use of the larger pool of data and the suite of visualization tools embedded in application. Data in the FACCS application may also be downloaded for further analyses with external tools.
Regional Organization and Cortical Gradients
Brain function and organizational principles are often related to the subdivision into functionally and cytoarchitectonically distinct areas (e.g., Woolsey and Van der Loos, 1970 ; Zilles and Wree, 1995 ). One of our analyses demonstrates that the cortical regional organization is preserved in the pontine nuclei, at least such that projections from different regions (frontal, parietal, and occipital) remain largely segregated. Albeit based on a single observation, our data also indicate that projections from temporal regions are distributed within a separate region of the pontine nuclei. Our subsequent analyses further indicate that cortical gradients, independent of regional boundaries, allow prediction of where in the pontine map a given set of projections are distributed. Thus, the cortical map appears to be systematically transformed to a pontine map according to a set of distribution principles that preserve topography and regional organization, but most likely is unrelated to cortical regional boundaries.
Topographical Organization of Clustered Corticopontine Projections
The present findings are in agreement with previous reports in rat that corticopontine projections from most cerebral regions typically consist of several delineated clusters of fibers topographically distributed at segregated locations in the pontine nuclei (Azizi et al., 1985 ; Burne et al., 1978 ; Kosinski et al., 1986 , 1988 ; Lee and Mihailoff, 1990 ; Leergaard et al., 1995 , 2000a , 2000b , 2004 ; Mihailoff et al., 1978 ; Mihailoff et al., 1984 , 1985 ; Panto et al., 1995 ; Wiesendanger and Wiesendanger, 1982 ). A new finding is that clustered pontine projections from all parts of the cerebral cortex in rat are topographically distributed inside-out within concentrically organized volumes, in addition to obeying previously described medial-to-lateral distribution principles (Mihailoff et al., 1978 , 1985 ; Wiesendanger and Wiesendanger, 1982 ). An internal-to-external arrangement of corticopontine projections was previously demonstrated in young rats (Leergaard et al., 1995 ), in pontine projections from the primary somatosensory cortex in adult rats (Leergaard et al., 2000a , 2000b , 2004 ), as well as in cat and monkey (for reviews, see Brodal and Bjaalie, 1992 , 1997 ; Schmahmann and Pandya, 1997a , 1997b ). The regional topography of the cerebral cortex is orderly mapped onto the pontine nuclei, such that the frontal cortex projects medially and rostrally in the pontine nuclei, parietal cortex projects centrally and caudally, temporal cortex projects laterally, and the occipital cortex projects laterally and rostrally. Our multi-tracer experiments demonstrated partial overlap of projections from segregated cortical sites. Similar patterns of partial overlap were reported in more detail in previous studies (Leergaard et al., 2000a , 2004 ). Overall, the majority of labeled clusters were located in segregated regions of the pontine nuclei. Small clusters of labeling, however, are often located close to larger clusters originating from another cortical area. The latter findings support the notion that multimodal cortical and subcortical inputs are integrated in the pontine nuclei (see also, Bjaalie and Leergaard, 2000 ; Leergaard, 2003 ; Leergaard and Bjaalie, 2002 ; Schwarz and Thier, 1999 ).
Establishment of Corticopontine Topography
Complex anatomy is usually easy understood from a developmental point of view. Topographic specificity is evident in the corticopontine system from the onset of innervation during the first postnatal week (Leergaard et al., 1995 ; Mihailoff et al., 1984 ; O’Leary and Terashima, 1988 ). The observation of congruence of early corticopontine connectivity distributions (Leergaard et al., 1995 ) with maturational (neurogenetic) gradients present in the cerebral cortex (Erzurumlu and Jhaveri, 1992 ; Hicks and D’Amato, 1968 ; Miller, 1987 ; Smart, 1984 ; Uylings et al., 1990 ) and pontine nuclei (Altman and Bayer, 1978 , 1987 ) led to the hypothesis that corticopontine topography is blueprinted during early development by the interaction of simple and independent spatial and temporal gradients (see also, Altman and Bayer, 1996 ; Leergaard et al., 1995 ). Thus, temporospatial gradients in source (cortex) and target (pontine nuclei) presumably interact by means of a chemotropic mechanism (demonstrated in vitro by Heffner et al. (1990) to create an inside-out arrangement of axonal terminals in the pontine nuclei. The medial to lateral topographical organization of corticopontine projections is present at the level of descending corticofugal pathways both in young (Leergaard et al., 1995 ) and adult rats (Coleman et al., 1997 ; Glickstein et al., 1992 ), presumably resulting from a combination of mechanical factors (spatical constraint), fasciculation, and molecular axonal guidance cues (see, e.g., Bentley and Caudy, 1983 ; Raper et al., 1988 ). At a more detailed level, the patterns of regional specificity of clustered projections within the concentric pontine layers (i.e., rostral preponderance of motor and visual projections, and central/caudal preponderance of somatosensory projections), and specific co-location of functionally related sensory and motor projections, are difficult to explain from simple temporal gradients. We have earlier (Leergaard et al., 1995 ) hypothesized the existence of subtle caudal to rostral temporal gradients in the pontine nuclei, in addition to the more general inside-out gradient. There are, however, few available data to substantiate this. Developmental mechanisms such as functional remodelling of initially abundant projections (Mihailoff et al., 1984 ), or more specific genetically controlled target acquisition might explain this observation.
The finding that adult pontine brain map organization is associated with early graded gene expression patterns does not necessarily imply that these are involved in the actual target acquisition of corticopontine axons. Rather, both patterns might derive from a common precursory developmental mechanism. Apparently, both the graded cerebral gene expression patterns (Bishop et al., 2000 ; Mackarehtschian et al., 1999 ; O’Leary and Nakagawa, 2002 ), the sequence of descent of corticofugal axons (Lakke, 1997 ), and the sequential settling of pontine neurons (Altman and Bayer, 1978 , 1987 ) are related to simple temporal maturational (neurogenetic) gradients. It remains to be demonstrated whether the cortical spatiotemporal maturational gradient is directly translated into a sequence of (pluripotent) corticofugal axons, or whether descending axons at some stage express specific properties regulated by cortical area identity (Fukuchi-Shimogori and Grove, 2001 ; Sestan et al., 2001 ). Such heterogeneity might provide positional cues for outgrowing axons both in the major descending pathways and during target acquisition (O’Leary, 1992 ) at multiple sites in the midbrain and hindbrain. Similarly, the neurons of the pontine nuclei might also have heterogeneous signaling properties (see, e.g., Gesemann et al., 2001 ; Litwack et al., 2004 ).
We conclude that the main mediolateral and inside-out organization of corticopontine projections may be established from simple developmental gradients, while regional specification and co-location of functionally related axonal clusters in the pontine nuclei require more elaborate explanation models. Functional remodeling of initially abundant projections (Mihailoff et al., 1984 ) and genetically determined differential expression of receptors are candidate mechanisms. Gesemann et al. (2001) have identified several secreted and transmembrane proteins that are highly expressed in the developing pontine nuclei (see also, Litwack et al., 2004 ), potentially involved in the regulation of neuronal migration and axonal guidance. It remains to be seen whether the most detailed level of organization in the topographic map here presented are predefined by specific gene expression patterns or resulting from functional remodeling mechanisms.
Conclusion
The possibility to directly compare different schemes of organization in source and target brain maps has allowed us to propose a principal map for the topographical organization of corticopontine projections. As discussed above, key to the understanding of the proposed map is the organization of brain maps during early development (Altman and Bayer, 1996 ; Lakke, 1997 ; Leergaard, 2003 ; Leergaard et al., 1995 ). Topographical organization has long been recognized in corticopontine pathways (Brodal, 1978 ; Mihailoff et al., 1978 ; Nyby and Jansen, 1951 ; Wiesendanger and Wiesendanger, 1982 ), and overall somatotopic organization of clustered corticopontine somatosensory and motor projections has been described previously (Leergaard et al., 2000a , 2000b , 2004 ). With the principal map for corticopontine projections, a fairly accurate prediction of pontine target area can be made for any site of origin in the cerebral cortex. The present version of the map is limited to a ventral view of the pontine nuclei. Thus, it does not incorporate the full 3-D complexity of the pontine map. Nevertheless, it provides a more precise basis for understanding the distribution of corticopontine projections. The map can be used in context of designing and interpreting future experimental, anatomical, and electrophysiological investigations of the corticopontine and pontocerebellar system. Further, it may prove to be useful as a starting point for a more quantitative computational modeling of the pontine nuclei, which in turn may impact on understanding of cerebro-cerebellar functions, as well as on structure–function relationships and the functional relevance of topographical mapping. The accumulated pool of original, spatially normalized 3-D reconstructed corticopontine and pontocerebellar distribution data, shared via the FAACS database (http://www.rbwb.org ), may be used as a foundation for such future computational modeling efforts.
Conflict of Interest Statement
The authors declare that this research was conducted without any commercial of financial relationships that could be constructed as a potential conflict of interest.
Acknowledgments
We thank Christian Pettersen and Anna Torbjørg Bore for expert technical assistance, and all contributors to the NeSys database.
This work was supported by grants from The Research Council of Norway, The European Community (grant QLRT-2000-02256), and The Norwegian Consortium for High Performance Computing.
References
Altman, J., and Bayer, S. A. (1978). Prenatal development of the cerebellar system in the rat. II. Cytogenesis and histogenesis of the inferior olive, pontine gray, and the precerebellar reticular nuclei. J. Comp. Neurol. 179, 49-75.
Altman, J., and Bayer, S. A. (1987). Development of the precerebellar nuclei in the rat: IV. The anterior precerebellar extramural migratory stream and the nucleus reticularis tegmenti pontis and the basal pontine gray. J. Comp. Neurol. 257, 529-552.
Altman, J., and Bayer, S. A. (1996). Development of the upper precerebellar pystem: The pontine gray nucleus. In Development of the Cerebellar System in Relation to Its Evolution, Structure and Functions, J. Altman, and S. A. Bayer, eds. (Boca Raton, CRC Press Inc.), pp. 300-321.
Amari, S.-I., Beltrame, F., Bjaalie, J. G., Dalkara, T., De Schutter, E., Egan, G. F., Goddard, N., Gonzalez, C., Grillner, S., Herz, A., Hoffmann, K. -P., Jaaskelainen, I., Koslow, S. H., Lee, S.-U., Matthiessen, L., Miller, P. L., Mira da Silva, F., Novak, M., Ravindranath, V., Ritz, R., Ruotsalainen, U., Sebestra, V., Subramaniam, S., Tang, Y., Toga, A. W., Usui, S., Van Pelt, J., Verschure, P., Willshaw, D., and Wrobel, A. (2002). Neuroinformatics: the integration of shared databases and tools toward integrative neuroscience. J. Int. Neurosci. 1, 117-128.
Azizi, S. A., Burne, R. A., and Woodward, D. J. (1985). The auditory corticopontocerebellar projection in the rat: inputs to the paraflocculus and midvermis. An anatomical and physiological study. Exp. Brain Res. 59, 36-49.
Bentley, D., and Caudy, M. (1983). Navigational substrates for peripheral pioneer growth cones: limb-axis polarity cues, limb-segment boundaries, and guidepost neurons. Cold Spring Harb. Symp. Quant. Biol. 48, 573-85.
Bishop, K. M., Goudreau, G., and O’Leary, D. D. (2000). Regulation of area identity in the mammalian neocortex by Emx2 and Pax6. Science 288, 344-349.
Bjaalie, J. G., and Leergaard, T. B. (2000). Functions of the pontine nuclei in cerebro-cerebellar communication. Trends Neurosci. 23, 152-153.
Bjaalie, J. G., and Leergaard, T. B. (2005). Three-dimensional visualization and analysis of wiring patterns in the brain: Experiments, tools, models and databases. In Databasing the Brain, S. H. Koslow, and S. Subramaniam, eds. Wiley), pp. 350-368.
Bjaalie, J. G., and Leergaard, T. B. (2006). Three-dimensional computerized reconstruction from serial sections: cells populations, regions, and whole brain. In Neuroanatomical Tract Tracing: Molecules, Neurons, & Systems, L. Zaborszky, F. G. Wouterlood, and J. L. Lanciego, eds. (New York, Springer Science + Business Media), pp. 530-565.
Bjaalie, J. G., Daehlen, M., and Stensby, T. V. (1997). Surface modeling from biomedical data. In Numerical Methods and Software Tools in Industrial Mathematics, M. Daehlen, and A. Tveito, eds. (Boston, Birkhauser), pp. 9-26.
Bjaalie, J. G., Leergaard, T. B., and Pettersen, C. (2006). Micro3D: computer program for three-dimensional reconstruction visualization, and analysis of neuronal populations and brain regions. Int. J. Neurosci. 116, 515-540.
Bower, J. M., Beermann, D. H., Gibson, J. M., Shambes, G. M., and Welker, W. (1981). Principles of organization of a cerebro-cerebellar circuit. Micromapping the projections from cerebral (SI) to cerebellar (granule cell layer) tactile areas of rats. Brain Behav. Evol. 18, 1-18.
Bjaalie, J. G., Leergaard, T. B., Lillehaug, S., Odeh, F., Moene, I. A., Kjode, J. O., and Darin, D. (2005). Database and tools for analysis of topographic organization and map transformations in major projection systems of the brain. Neuroscience 136, 681-695.
Brevik, A., Leergaard, T. B., Svanevik, M., and Bjaalie, J. G. (2001). Three-dimensional computerised atlas of the rat brain stem precerebellar system: approaches for mapping, visualization, and comparison of spatial distribution data. Anat. Embryol. 204, 319-332.
Brodal, P. (1978). The corticopontine projection in the rhesus monkey. Origin and principles of organization. Brain 101, 251-283.
Brodal, P., and Bjaalie, J. G. (1992). Organization of the pontine nuclei. Neurosci. Res. 13, 83-118.
Brodal, P., and Bjaalie, J. G. (1997). Salient anatomic features of the cortico-ponto-cerebellar pathway. Prog. Brain Res. 114, 227-249.
Burne, R. A., Mihailoff, G. A., and Woodward, D. J. (1978). Visual corticopontine input to the paraflocculus: a combined autoradiographic and horseradish peroxidase study. Brain Res. 143, 139-146.
Chapin, J. K., and Lin, C. S. (1984). Mapping the body representation in the SI cortex of anesthetized and awake rats. J. Comp. Neurol. 229, 199-213.
Coleman, K. A., Baker, G. E., and Mitrofanis, J. (1997). Topography of fiber organisation in the corticofugal pathways of rats. J. Comp Neurol. 381, 143-157.
Dhanarajan, P., Ruegg, D. G., and Wiesendanger, M. (1977). An anatomical investigation of the corticopontine projection in the primate (Saimiri sciureus). The projection from motor and somatosensory areas. Neuroscience 2, 913-922.
Eckersley, P., Egan, G. F., Amari, S., Beltrame, F., Bennett, R., Bjaalie, J. G., Dalkara, T., De, S. E., Gonzalez, C., Grillner, S., Herz, A., Hoffmann, K. P., Jaaskelainen, I. P., Koslow, S. H., Lee, S. Y., Matthiessen, L., Miller, P. L., da Silva, F. M., Novak, M., Ravindranath, V., Ritz, R., Ruotsalainen, U., Subramaniam, S., Toga, A. W., Usui, S., van, P. J., Verschure, P., Willshaw, D., Wrobel, A., and Tang, Y. (2003). Neuroscience data and tool sharing: A legal and policy framework for neuroinformatics. Neuroinformatics. 1, 149-165.
Erzurumlu, R. S., and Jhaveri, S. (1992). Emergence of connectivity in the embryonic rat parietal cortex. Cereb. Cortex. 2, 336-352.
Felleman, D. J., and Van Essen, D. C. (1991). Distributed hierarchical processing in the primate cerebral cortex. Cereb. Cortex 1, 1-47.
Foerster, O. (1936). Symptomatologie der Erkrankungen des Rückenmarks und seiner Wurzeln. In Handbuch der Neurologie, Vol. 5, O. Bumke, and O. Foerster, eds. (Berlin, Springer-Verlag), pp. 1-403.
Fox, P. T., and Lancaster, J. L. (2002). Opinion: Mapping context and content: the BrainMap model. Nat. Rev. Neurosci. 3, 319-321.
Fukuchi-Shimogori, T., and Grove, E. A. (2001). Neocortex patterning by the secreted signaling molecule FGF8. Science 294, 1071-1074.
Gerfen, C. R. (1992). The neostriatal mosaic: multiple levels of compartmental organization in the basal ganglia. Annu. Rev. Neurosci. 15, 285-320.
Gerfen, C. R., and Sawchenko, P. E. (1984). An anterograde neuroanatomical tracing method that shows the detailed morphology of neurons, their axons and terminals: immunohistochemical localization of an axonally transported plant lectin, Phaseolus vulgaris leucoagglutinin (PHA-L). Brain Res. 290, 219-238.
Gesemann, M., Litwack, E. D., Yee, K. T., Christen, U., and O’Leary, D. D. M. (2001). Identification of Candidate Genes for Controlling Development of the Basilar Pons by Differential Display PCR. Molecular and Cellular Neuroscience 18, 1-12.
Glickstein, M., Kralj-Hans, I., Legg, C., Mercier, B., Ramna-Rayan, M., and Vaudano, E. (1992). The organisation of fibers within the rat basis pedunculi. Neurosci. Lett. 135, 75-79.
Glover, J. C. (1995). Retrograde and anterograde axonal tracing with fluorescent dextran-amines in the embryonic nervous system. Neurosci. Prot. 30, 1-13.
Hartmann von Monakow, K., Akert, K., and Kunzle, H. (1981). Projection of precentral, premotor and prefrontal cortex to the basilar pontine gray and to nucleus reticularis tegmenti pontis in the monkey (Macaca fascicularis). Arch. Suisses Neurol. Neurochir. Psychiat. 129, 189-208.
Heffner, C. D., Lumsden, A. G., and O’Leary, D. D. (1990). Target control of collateral extension and directional axon growth in the mammalian brain. Science 247, 217-220.
Hicks, S. P., and D’Amato, C. J. (1968). Cell migrations to the isocortex in the rat. Anat. Rec. 160, 619-634.
Irvine, D. R. F. (1992). Physiology of the auditory brainstem. In The Mammalian Auditory Pathway: Neurophysiology., A. Popper, and R. R. Fay, eds. (New York, Springer), pp. 153-231.
Joel, D., and Weiner, I. (2000). The connections of the dopaminergic system with the striatum in rats and primates: an analysis with respect to the functional and compartmental organization of the striatum. Neuroscience 96, 451-474.
Kaas, J. H. (1997). Topographic maps are fundamental to sensory processing. Brain Res. Bull. 44, 107-112.
Killackey, H. P., Rhoades, R. W., and Bennett-Clarke, C. A. (1995). The formation of a cortical somatotopic map. Trends Neurosci. 18, 402-407.
Kosinski, R. J., Azizi, S. A., and Mihailoff, G. A. (1988). Convergence of cortico- and cuneopontine projections onto components of the pontocerebellar system in the rat: An anatomical and electrophysiological study. Exp. Brain Res. 71, 541-556.
Kosinski, R. J., Neafsey, E. J., and Castro, A. J. (1986). A comparative topographical analysis of dorsal column nuclear and cerebral cortical projections to the basilar pontine gray in rats. J. Comp. Neurol. 244, 163-173.
Koslow, S. H. (2000). Should the neuroscience community make a paradigm shift to sharing primary data? Nat. Neurosci. 3, 863-865.
Lakke, E. A. (1997). The projections to the spinal cord of the rat during development: a timetable of descent. Adv. Anat. Embryol. Cell Biol. 135, 1-143.
Lanciego, J. L., and Wouterlood, F. G. (1994). Dual anterograde axonal tracing with Phaseolus vulgaris-leucoagglutinin (PHA-L) and biotinylated dextran amine (BDA). Neurosci. Protoc. 94-050-06-01-13.
Lee, H. S., and Mihailoff, G. A. (1990). Convergence of cortical and cerebellar projections on single basilar pontine neurons: a light and electron microscopic study in the rat. Neuroscience 39, 561-577.
Leergaard, T. B. (2003). Clustered and laminar topographic patterns in rat cerebro-pontine pathways. Anat. Embryol. 206, 149-162.
Leergaard, T. B., and Bjaalie, J. G. (1995). Semi-automatic data acquisition for quantitative neuroanatomy. MicroTrace--computer program for recording of the spatial distribution of neuronal populations. Neurosci. Res. 22, 231-243.
Leergaard, T. B., and Bjaalie, J. G. (2002). Architecture of sensory map transformations: axonal tracing in combination with 3-D reconstruction, geometric modeling, and quantitative analyses. In Computational Neuroanatomy: Principles and Methods, G. Ascoli, ed. (Totowa, NJ, Humana Press), pp. 119-217.
Leergaard, T. B., Lakke, E. A., and Bjaalie, J. G. (1995). Topographical organization in the early postnatal corticopontine projection: a carbocyanine dye and 3-D computer reconstruction study in the rat. J. Comp. Neurol. 361, 77-94.
Leergaard, T. B., Alloway, K. D., Mutic, J. J., and Bjaalie, J. G. (2000a). Three-dimensional topography of corticopontine projections from rat barrel cortex: correlations with corticostriatal organization. J. Neurosci. 20, 8474-8484.
Leergaard, T. B., Lyngstad, K. A., Thompson, J. H., Taeymans, S., Vos, B. P., De Schutter, E., Bower, J. M., and Bjaalie, J. G. (2000b). Rat somatosensory cerebropontocerebellar pathways: spatial relationships of the somatotopic map of the primary somatosensory cortex are preserved in a three-dimensional clustered pontine map. J. Comp. Neurol. 422, 246-266.
Leergaard, T. B., Alloway, K. D., Pham, T. A., Bolstad, I., Hoffer, Z. S., Pettersen, C., and Bjaalie, J. G. (2004). Three-dimensional topography of corticopontine projections from rat sensorimotor cortex: comparisons with corticostriatal projections reveal diverse integrative organization. J. Comp Neurol. 478, 306-322.
Leergaard, T. B., Lillehaug, S., De Schutter, E., Bower, J. M., and Bjaalie, J. G. (2006). Topographical organization of pathways from somatosensory cortex through the pontine nuclei to tactile regions of the rat cerebellar hemispheres. Eur. J. Neurosci. In Press.
Lehre, K. P., Levy, L. M., Ottersen, O. P., Storm-Mathisen, J., and Danbolt, N. C. (1995). Differential expression of two glial glutamate transporters in the rat brain: quantitative and immunocytochemical observations. J. Neurosci. 15, 1835-1853.
Leise, E. M. (1990). Modular construction of nervous systems: a basic principle of design for invertebrates and vertebrates. Brain Res. Rev. 15, 1-23.
Litwack, E. D., Babey, R., Buser, R., Gesemann, M., and O’Leary, D. D. (2004). Identification and characterization of two novel brain-derived immunoglobulin superfamily members with a unique structural organization. Mol. Cell Neurosci. 25, 263-274.
Mackarehtschian, K., Lau, C. K., Caras, I., and McConnell, S. K. (1999). Regional differences in the developing cerebral cortex revealed by ephrin-A5 expression. Cereb. Cortex 9, 601-610.
Mihailoff, G. A., Adams, C. E., and Woodward, D. J. (1984). An autoradiographic study of the postnatal development of sensorimotor and visual components of the corticopontine system. J. Comp. Neurol. 222, 116-127.
Mihailoff, G. A., Burne, R. A., and Woodward, D. J. (1978). Projections of sensorimotor cortex to the basilar pontine nuclei in the rat: an autoradiographic study. Brain Res. 145, 347-354.
Mihailoff, G. A., Lee, H., Watt, C. B., and Yates, R. (1985). Projections to the basilar pontine nuclei from face sensory and motor regions of the cerebral cortex in the rat. J. Comp. Neurol. 237, 251-263.
Miller, M. W. (1987). Effect of prenatal exposure to alcohol on the distribution and time of origin of corticospinal neurons in the rat. J. Comp. Neurol. 257, 372-382.
Moene, I. A., Subramaniam, S., Darin, D., Leergaard, T. B., and Bjaalie, J. G. (2007). Toward a workbench for rodent brain image data: systems architecture and design. Neuroinformatics 5, 35-58.
Nelson, M. E., and Bower, J. M. (1990). Brain maps and parallel computers. Trends Neurosci. 13, 403-408.
Nyby, O., and Jansen, J. (1951). An experimental investigation of the corticopontine projection in Macaca mulatta. Skr. Norske Vidensk. -akad.,I. Mat. -Nat. Kl. 3, 1-47.
O’Leary, D. D. (1992). Development of connectional diversity and specificity in the mammalian brain by the pruning of collateral projections. Curr. Opin. Neurobiol. 2, 70-77.
O’Leary, D. D., and Nakagawa, Y. (2002). Patterning centers, regulatory genes and extrinsic mechanisms controlling arealization of the neocortex. Curr. Opin. Neurobiol. 12, 14-25.
O’Leary, D. D., and Terashima, T. (1988). Cortical axons branch to multiple subcortical targets by interstitial axon budding: implications for target recognition and “waiting periods”. Neuron 1, 901-910.
Panto, M. R., Cicirata, F., Angaut, P., Parenti, R., and Serapide, F. (1995). The projection from the primary motor and somatic sensory cortex to the basilar pontine nuclei. A detailed electrophysiological and anatomical study in the rat. J. Hirnforsch. 36, 7-19.
Paxinos, G., and Watson, C. (1982). The Rat Brain in Stereotaxic Coordinates (Sydney: Academic Press).
Penfield, W., and Boldrey, E. (1937). Somatic motor and sensory representation in the cerebral cortex of man as studied by electrical stimulation. Brain 60, 389-443.
Raper, J. A., Chang, S., Kapfhammer, J. P., and Rathje, F. G. (1988). Growth cone guidance and labeled axons. In The Making of the Nervous System, J. G.Parnavelas C. D. Stein R. V. Stirling, eds. (Oxford: Oxford University Press), pp. 188-203.
Roskies, A., Friedman, G. C., and O’Leary, D. D. (1995). Mechanisms and molecules controlling the development of retinal maps. Perspect. Dev. Neurobiol. 3, 63-75.
Ruigrok, T. J. H. (2005). Precerebellar nuclei and red nucleus. In The Rat Nervous System, G. Paxinos, ed. (San Diego, CA, Elsevier Academic Press), pp. 167-204.
Schmahmann, J. D., and Pandya, D. N. (1997a). Anatomic organization of the basilar pontine projections from prefrontal cortices in rhesus monkey. J. Neurosci. 17, 438-458.
Schmahmann, J. D., and Pandya, D. N. (1997b). The cerebrocerebellar system. Int. Rev. Neurobiol. 41, 31-60 31-60.
Schreiner, C. E., and Langner, G. (1997). Laminar fine structure of frequency organization in auditory midbrain. Nature 388, 383-386.
Schwarz, C., and Thier, P. (1999). Binding of signals relevant for action: toward a hypothesis of the functional role of the pontine nuclei. Trends Neurosci. 22, 443-451.
Sefton, A. J., and Dreher, B. (1995). Visual system. In The Rat Nervous System, G. Paxinos, ed. (San Diego, Academic Press), pp. 833-898.
Sestan, N., Rakic, P., and Donoghue, M. J. (2001). Independent parcellation of the embryonic visual cortex and thalamus revealed by combinatorial Eph/ephrin gene expression. Curr. Biol. 11, 39-43.
Shambes, G. M., Gibson, J. M., and Welker, W. (1978). Fractured somatotopy in granule cell tactile areas of rat cerebellar hemispheres revealed by micromapping. Brain Behav. Evol. 15, 94-140.
Shepherd, G. M., Mirsky, J. S., Healy, M. D., Singer, M. S., Skoufos, E., Hines, M. S., Nadkarni, P. M., and Miller, P. L. (1998). The Human Brain Project: neuroinformatics tools for integrating, searching and modeling multidisciplinary neuroscience data. Trends Neurosci. 21, 460-468.
Smart, I. H. (1984). Histogenesis of the mesocortical area of the mouse telencephalon. J. Anat. 138, 537-552.
Sporns, O., Chialvo, D. R., Kaiser, M., and Hilgetag, C. C. (2004). Organization, development and function of complex brain networks. Trends Cogn. Sci. 8, 418-425.
Thivierge, J. P., and Marcus, G. F. (2007). The topographic brain: from neural connectivity to cognition. Trends Neurosci. 30, 251-259.
Tracey, D. J., and Waite, P. M. E. (1995). Somatosensory system. In The Rat Nervous System, G. Paxinos, ed. (San Diego, Academic Press), pp. 689-704.
Uylings, H. B., Van Eden, C. G., Parnavelas, J. G., and Kalsbeek, A. (1990). The prenatal and postnatal development of rat cerebral cortex. In The Cerebral Cortex of the Rat, B. Kolb, and R. C. Tees, eds. (London, MIT Press), pp. 34-76.
Welker, C. (1971). Microelectrode delineation of fine grain somatotopic organization of (SmI) cerebral neocortex in albino rat. Brain Res. 26, 259-275.
Wiesendanger, R., and Wiesendanger, M. (1982). The corticopontine system in the rat. II. The projection pattern. J. Comp. Neurol. 208, 227-238.
Wiesendanger, R., Wiesendanger, M., and Ruegg, D. G. (1979). An anatomical investigation of the corticopontine projection in the primate (Macaca fascicularis and Saimiri sciureus)--II. The projection from frontal and parental association areas. Neuroscience 4, 747-765.
Woolsey, C. N., Marshall, W. H., and Bard, P. (1942). Representations of cutaneous tactile sensibility in the cerebral cortex of the monkey as indicated by evoked potentials. Bull. Johns Hopk. Hosp. 70, 399-441.
Keywords: 3-D reconstruction; axonal tracing; brain map; cerebellum; development; neuroinformatics; pontine nuclei
Citation: Trygve B. Leergaard and Jan G. Bjaalie (2007). Principal map of corticopontine projections. Front. Neurosci. 1:1. 211-223. doi: 10.3389/neuro.01/1.1.016.2007
Received: 15 August 2007;
Paper pending published: 01 September 2007;
Accepted: 01 September 2007;
Published online: 15 October 2007.
Edited by:
Idan Segev, Hebrew University, IsraelReviewed by:
Philip H. Goodman, University of Nevada, USAMihail Bota, University of Southern California, USA
Idan Segev, Hebrew University, Israel
Copyright: © 2007 Leergaard and Bjaalie. This is an open-access article subject to an exclusive license agreement between the authors and the Frontiers Research Foundation, which permits unrestricted use, distribution, and reproduction in any medium, provided the original authors and source are credited.
*Correspondence: Jan G. Bjaalie, Centre for Molecular Biology and Neuroscience & Institute of Basic Medical Sciences, University of Oslo, P.O. Box 1105 Blindern, N-0317 Oslo, Norway. e-mail: j.g.bjaalie@medisin.uio.no