1
Queensland Brain Institute, The University of Queensland, Brisbane, QLD, Australia
2
School of Biomedical Sciences, The University of Queensland, Brisbane, QLD, Australia
The inhibitory glycine receptor (GlyR) is a member of the Cys-loop receptor family that mediates inhibitory neurotransmission in the central nervous system. These receptors are emerging as potential drug targets for inflammatory pain, immunomodulation, spasticity and epilepsy. Antagonists that specifically inhibit particular GlyR isoforms are also required as pharmacological probes for elucidating the roles of particular GlyR isoforms in health and disease. Although a substantial number of both positive and negative GlyR modulators have been identified, very few of these are specific for the GlyR over other receptor types. Thus, the potential of known compounds as either therapeutic leads or pharmacological probes is limited. It is therefore surprising that there have been few published studies describing attempts to discover novel GlyR isoform-specific modulators. The first aim of this review is to consider various methods for efficiently screening compounds against these receptors. We conclude that an anion sensitive yellow fluorescent protein is optimal for primary screening and that automated electrophysiology of cells stably expressing GlyRs is useful for confirming hits and quantitating the actions of identified compounds. The second aim of this review is to demonstrate how these techniques are used in our laboratory for the purpose of both discovering novel GlyR-active compounds and characterizing their binding sites. We also describe a reliable, cost effective method for transfecting HEK293 cells in single wells of a 384-well plate using nanogram quantities of plasmid DNA.
The inhibitory glycine receptor (GlyR) is a member of the Cys-loop ligand-gated receptor family that also includes the nicotinic acetylcholine receptor (nAChR), the GABA type-A receptor (GABAAR) and serotonin type-3 receptor (5-HT3R). Receptors of this class comprise five subunits arranged symmetrically around a central ion-conducting pore. Each subunit comprises four α-helical transmembrane domains and a large extracellular amino-terminal domain that harbours the ligand binding sites and the signature ‘Cys-loop’ (Unwin, 2003
; Hilf and Dutzler, 2008
). A total of five GlyR subunits have been identified so far, namely α1−α4 and β (Betz and Laube, 2006
; Lynch, 2009
). The α4 gene is a pseudo-gene in humans (Simon et al., 2004
). All α subunits can form functional homomeric receptors but β subunit is functionally expressed only as a heteromer with the α subunit in a putative 2α:3β stoichiometry (Grudzinska et al., 2005
).
In the adult rat, α1 subunit mRNA is abundant in brain stem, spinal cord and retina but is also found in superior and inferior colliculi, thalamus and hypothalamus (Malosio et al., 1991
). Expression is low prenatally but increases from birth to reach to a maximum by the end of the third postnatal weak. The distribution and developmental profile of the α3 subunit is similar but occurs at lower levels, except in retina and spinal cord as discussed below (Malosio et al., 1991
; Watanabe and Akagi, 1995
). In contrast, the α2 subunit is present at high levels prenatally but declines postnatally to low levels in the adult (Malosio et al., 1991
; Watanabe and Akagi, 1995
). The β subunit, which shows a surprisingly widespread distribution throughout the spinal cord and the brain, also increases with age in parallel with the α1 and α3 subunits.
Inhibitory synaptic transmission in motor reflex circuits of the spinal cord is mediated by the α1β GlyR. This is perhaps best evidenced by the fact that hereditary mutations to the α1 GlyR that reduce the charge transfer rate of synaptic α1β GlyRs cause human startle disease, a disorder characterized by a temporary increase in muscular rigidity but no alteration in cognitive state (Bakker et al., 2006
).
The retina expresses a diversity of GlyR subunits. Synaptic GlyRs comprising α1β, α2β and α3β GlyRs are all postulated to be present in anatomically discrete locations, although their individual contributions to visual processing are yet to be elucidated (Balse et al., 2006
; Ge et al., 2007
; Grunert and Wassle, 1993
; Grunert and Ghosh, 1999
; Haverkamp et al., 2003
, 2004
; Jusuf et al., 2005
; Majumdar et al., 2007
; Veruki et al., 2007
). The α2 GlyR subunit also plays a crucial role in rod photoreceptor development (Young and Cepko, 2004
). Glycinergic synapses also are found in several brainstem nuclei, particularly those of the central auditory pathways (Caspary et al., 2008
), where the large fast glycinergic synaptic currents are important for the precise timing associated with directional hearing (Kandler, 2004
). Extrasynaptic GlyRs are widely distributed throughout the adult nervous system in areas such as the cortex (Flint et al., 1998
), hippocampus (Mori et al., 2002
) and basolateral amygdala (McCool and Farroni, 2001
) where they are thought to mediate tonic inhibition. GlyR expression is not limited to neurons but is also found in sperm where GlyRs contribute to the acrosomal reaction that fuses sperm to the egg (Meizel, 1997
). GlyRs have also been identified in macrophages and leucocytes where they are thought to mediate the anti-inflammatory effects of glycine (Gundersen et al., 2005
).
Movement Disorders
As α1β GlyRs control the excitability of spinal motor neurons, agents that increase current flow through α1-containing GlyRs should decrease the activity of these neurons. Thus, α1-specific enhancing agents may be useful as treatments for startle disease and as muscle relaxants for hypertonic movement disorders such as spasticity. Such movement disorders are currently treated with GABAAR-enhancing benzodiazepines which have substantial side-effects due to the widespread distribution of target GABAARs throughout the brain. In contrast, their relatively limited distribution renders α1β GlyRs a more promising therapeutic target.
Anti-Inflammatory Analgesia
GlyR α1 and α3 subunits co-exist in individual glycinergic inhibitory synapses on nociceptive sensory neurons in the spinal cord dorsal horn (Harvey et al., 2004
). An inflammatory mediator, prostaglandin E2 acting at the EP2 receptor, specifically inhibited both glycinergic inhibitory postsynaptic currents (IPSCs) in pain sensory neurons (Ahmadi et al., 2002
; Harvey et al., 2004
) and glycine-gated currents in recombinantly expressed α3 (but not α1) GlyRs (Harvey et al., 2004
), implying that inflammatory pain sensitisation is mediated by inhibition of glycinergic IPSCs. Consistent with this, knockout of either the α3 GlyR subunit or the EP2 receptor in mice abolished pain sensitisation induced by peripheral inflammation (Harvey et al., 2004
; Reinold et al., 2005
). Thus, inflammatory pain sensitization is caused by a PGE2-mediated down-regulation of α3-mediated glycinergic IPSCs in nociceptive neurons. This in turn implies that molecules that can specifically potentiate or prolong IPSCs in spinal nociceptive neurons offer promise as anti-inflammatory analgesic lead compounds. Although it should be possible to compensate for the effects of inflammatory mediators on α3-containing GlyRs by pharmacological enhancement of charge transfer through synaptic α1-containing GlyRs, the risk of side-effects is higher given that α1 subunits are more widespread outside the dorsal horn (Lynch and Callister, 2006
; Zeilhofer, 2005
).
Immunomodulation
Functional GlyRs are present in immune cells including neutrophils (Wheeler et al., 2000
), macrophages and leucocytes (Froh et al., 2002
; Ikejima et al., 1997
). There is mounting evidence that GlyRs in these cells mediate the anti-inflammatory and cytoprotective actions of glycine by antagonising the intracellular calcium increases that mediate the activation of these cells (Froh et al., 2002
; Ikejima et al., 1997
). Thus, by inhibiting the activity of immune cells, the systemic administration of glycine or GlyR potentiating agents could limit the damage inflicted by the systemic inflammatory immune response on essential biological molecules, cells and organs (Gundersen et al., 2005
).
Temporal Lobe Epilepsy
RNA-edited high affinity α2 and α3 GlyR transcripts were found to be upregulated in patients suffering from temporal lobe epilepsy (Eichler et al., 2008
, 2009
). In the same patients, transcript levels of the potassium chloride co-transporter type-2 (KCC2) were found to be downregulated. To determine whether these alterations may lead to temporal lobe epilepsy, the effects of changes in expression levels of the respective transcripts were investigated using a neuronal culture system. As expected, upregulation of high affinity GlyRs and downregulation of KCC2 resulted in depolarising tonic GlyR activity which shunted excitatory inputs, and rendered GABAergic synapses excitatory. This in turn led to an increased glutamatergic to GABAergic synapse ratio and a reduction in dendrite lengths and excitotoxicity, thus providing a possible mechanism for the increased neuroexcitability associated with temporal lobe epilepsy (Eichler et al., 2008
).
Novel GlyR subtype-specific potentiating agents are required as therapeutic lead compounds for epilepsy, movement disorders, chronic inflammatory pain and immunomodulation. On the other hand, antagonists specific for high affinity α2 and α3 GlyRs may be useful as therapeutic leads for temporal lobe epilepsy. In addition to clinical leads, subunit-specific pharmacological probes are also needed for establishing the presence and establish the roles of different GlyR isoforms in central nervous system regions (e.g., retina and spinal cord dorsal horn) that express a diversity of GlyR subtypes. Often the simplest way of identifying the presence and physiological role of a particular ion channel subtype is to use an isoform-specific inhibitor to eliminate its contribution to the complex suite of conductances active at any one time in a neuron.
Unfortunately, almost all known GlyR modulators also have potent effects on other receptor types (Lynch, 2009
) which limit their utility as probes for establishing the physiological role of different GlyR subtypes. Importantly, there are no compounds known to potentiate α3 GlyRs while having no effect on α1 GlyRs. Thus, the development of novel GlyR subunit-specific pharmacological probes is long overdue. To date there have been few, if any, published investigations describing systematic attempts to identify novel GlyR subtype-specific modulators.
Given the unusually high (>90%) amino acid sequence identity of α1 and α3 GlyR subunits in their extracellular and transmembrane receptor domains, it is relevant to consider whether pharmacological agents are likely to be found that discriminate strongly between these isoforms. Fortunately, there are two indications to suggest that such ligands may eventually be identified. First, using chimeras of α1 and α3 subunits, we identified the structurally divergent M4 transmembrane segment as a specific determinant of the large agonist efficacy difference between these two subtypes (Chen et al., 2009b
). This suggests that the lipid-exposed M4 domain may be a promising region for subtype-specific modulators to bind. Second, anandamide, N-arachidonyl-glycine and several synthetic cannabinoid agonists exhibit distinct pharmacological actions on α1 and α3 GlyRs (Yang et al., 2008
). For example, WIN55,212-2 has no effect on α1 GlyRs but potently inhibits α3 GlyRs. Although the location of the cannabinoid binding site is not yet known, these findings bode well for the existence of pharmacologically distinct modulatory sites on α1 and α3 GlyRs.
Automated Patch-Clamp Electrophysiology
Patch-clamping is the definitive means of assaying ion channel function. It not only offers an unparalleled signal-to-noise ratio but also tracks the effects of compounds in real time. This later feature permits complex effects of compounds (e.g., fast potentiation followed by slow inhibition) to be resolved. Several automated patch-clamp technologies have been successfully implemented (Finkel et al., 2006
; Lepple-Wienhues et al., 2003
; Mathes et al., 2009
; Milligan et al., 2009
). Although the technology is advancing steadily in terms of reliability, throughput and cost, it is still limited by high cost and modest throughput (Dunlop et al., 2008
). Thus, automated patch-clamp is probably best deployed as a means of confirming and quantitating the activity of compounds discovered by fluorescent assays (see below). Because automated patch-clamp technologies select cells at random for screening, it is generally necessary to create stable cell lines where all cells express the ion channels of interest in order to optimize data acquisition. Stably expressing cell line creation can be a slow, painstaking process, especially when one is interested in screening multimeric receptors.
Radioactive Assays
These can be separated into radioligand displacement assays and radiotracer flux assays. In the case of GlyRs, radioligand displacement assays involve displacing 3H-strychnine with unlabelled test compound (Young and Snyder, 1973
). There are several limitations to this technology. First, it provides no information about the mode of action (if any) of a compound. Second, it may not detect compounds that modify receptor function without displacing the radioligand. Finally, long incubations with agonists may promote a desensitised state with different pharmacology to the normal resting closed or activated states (Changeux and Edelstein, 1998
). Radioactive tracer flux assays detect the transmembrane flux of the radioactive anions, 125I− or 36Cl− (Kardos, 1993
; Venglarik et al., 1990
). I− is highly permeant through GlyRs (Fatima-Shad and Barry, 1993
). Being an assay of receptor function rather than binding, this technique overcomes some of the limitations of radioligand displacement assays. In general, radioactive assays are not optimal for high throughput (HT) drug discovery due to long incubation times and multiple processes (e.g., tracer loading, cell-wash and cell lysis steps) that limit HT, the high cost of materials, and the inconvenience associated with safe handling and disposal of radioactive materials.
Colorimetry
Transmembrane I− influx can be measured via a change in colour of a non-fluorescent cytoplasmic indicator (Tang and Wildey, 2004
). The rate of accumulation of intracellular I−, and hence cell colour, will depend on the degree to which the channels are activated. Because all reactions will eventually proceed to steady-state regardless of the agonist concentration, it is necessary to control the length of time that the reaction is allowed to proceed. This assay has the advantage of low cost and avoids the safety and environmental issues associated with radioactive materials. However, as with the radioactive tracer flux assay, its utility is limited by the requirement for tracer loading, cell wash and lysis steps. An analogous approach, in which Cl− influx precipitated an excess of intracellular Ag+ ions leading to a colour change (Gill et al., 2006
), may suffer the same limitations.
Voltage Sensitive Dyes (VSDs)
A wide range of VSDs is commercially available and the choice generally involves a trade-off between speed of response and dynamic range. In HT screening (HTS) applications, dynamic range is the prime consideration. A fluorescent membrane potential dye (marketed by Diagnostic Instruments Inc.) has successfully been employed to screen compounds against α1 GlyRs stably expressed in HEK293 cells (Jensen and Kristiansen, 2004
). In that study, ionic gradients were established such that GlyR activation induced a depolarisation and a consequent increase in fluorescence. The dye response was relatively slow, taking at least 30 s to reach steady-state, but it offered an excellent dynamic range.
High response speed and dynamic range can be simultaneously achieved using fluorescence resonance energy transfer (FRET). This technique involves the non-radiative transfer of energy from a donor fluorophore to an acceptor fluorophore provided the donor emission spectra and acceptor absorption spectra overlap and the respective fluorophores are in close proximity. When the donor is excited at its absorption wavelength, FRET causes the acceptor fluorescence to increase and donor fluorescence to decrease. It has been shown that a donor, CC2-DMPE, and an acceptor, DiBac2, produce a robust FRET at negative membrane potentials when both lie at the external membrane surface (Gonzalez and Tsien, 1997
). Upon depolarisation, DiBac2 crosses the membrane thereby increasing its distance from CC2-CPMPE and decreasing FRET efficiency. The subsequent fluorescence change occurs rapidly over a large dynamic range. This method has successfully been used to screen GABAARs (Adkins et al., 2001
) and GluClRs (Hamelin et al., 2005
). In both cases, cells were bathed in low-Cl- buffer so that GABAAR activation induced a Cl- efflux leading to depolarisation. This technique provides a rapid and sensitive indication of anionic receptor activation. However, the technique is expensive as it requires two exogenous fluorescent indicators. Also, because the plasma membrane concentrations of the respective fluorophores must be optimised individually for maximum FRET efficiency, this technique may require two dye incubation steps.
As a general point, exogenously applied dyes have several limitations. First, they constitute a significant recurrent expense and second, they require dye loading and (sometimes) cell-wash steps that limit HT. Third, and perhaps most seriously, lipophilic dyes are taken up by all cells regardless of whether or not they express the ion channel of interest. If, for example, only half the cells express the ion channel of interest then the dynamic range of the averaged fluorescence response is halved. Thus, to achieve its full dynamic range, all cells must respond to the dye. This requirement means that techniques involving exogenously applied indicators are suited primarily to homogeneous assays such as those involving stably expressing cell lines.
Genetically Encoded Anion Indicator
Yellow fluorescent protein (YFP), an engineered variant of green fluorescent protein, is quenched by small anions and is thus suited to reporting anionic influx into cells. A random mutagenesis approach identified two mutations, I152L and V163S, each of which greatly enhanced YFP anion sensitivity (Galietta et al., 2001a
). The I152L mutation confers a particularly high sensitivity to I− quench (Ki ∼ 3 mM). YFP-I152L has proved useful in screening compounds against the anion-conducting cystic fibrosis transmembrane regulator (Galietta et al., 2001b
; Yang et al., 2003
). It has also been applied to the GlyR and GABAAR (Kruger et al., 2005
). This assay has several advantages over the VSD assay. First, although both assays have similar signal-to-noise ratios and dynamic ranges, the YFP assay is faster by a factor of at least three in achieving a given percentage fluorescence change (Jensen and Kristiansen, 2004
; Kruger et al., 2005
). Second, as a propagable substance, YFP cDNA is cheaper. Third, the simultaneous transfection of YFP and ion channel cDNAs in separate plasmid vectors results in a high rate of transient co-expression of YFP and functional recombinant channels (Kruger et al., 2005
). Thus, the YFP-based assay does not require stably expressing cell lines to achieve its full dynamic range. Finally, as a genetically encoded probe, YFP is also suited to screening heterogeneous populations of isolated neurons where the YFP is transgenically expressed in a defined subset of cells. If an imaging-based detection system is used, this assay would also be suitable for ‘high-content’ screening (i.e., the correlation of multiple variables in the same cell). As an example of this, we have recently demonstrated the feasibility of screening a single compound against numerous GlyR receptor subtypes simultaneously via the YFP assay by using cell-permeant dyes to provide cells expressing a given receptor with a unique optical identifier (Gilbert et al., 2009c
).
Although genetically encoded fluorescent detectors of membrane potential are steadily being improved, at this stage their maximum voltage-induced fluorescence changes are typically <10% of the resting fluorescence level (Baker et al., 2008
; Perron et al., 2009
). This narrow dynamic range may be too small to yield robust readouts during HTS, and may explain why these probes have yet to be broadly implemented as drug discovery tools.
YFP-Based Primary Screening
Our laboratory employs YFP for primary HTS of large compound libraries or natural product fractions. For this purpose we have constructed a custom built robot comprising an inverted fluorescence microscope, an automated stage, an autosampler for liquid handling and a digital camera all under the control of Labview (National Instruments Corp, Austin, TX, USA) programs. The components of this device have previously been described in detail (Kruger et al., 2005
). Experiments are performed on adherent HEK293 cells in 384 well plates. The autosampler can deliver up to three different solutions (with or without removing the previous solution) from different sources to a single well, thus providing a wide range of liquid handling options. Although multiple solution exchanges in single wells is useful for assay development, we avoid it for HTS as it slows the screening process too much. The CCD captures images like those in Figure 1
A and image analysis is automated using customized DetecTiff� software (Gilbert et al., 2009b
). VSD and YFP screening technologies have also been successfully employed with commercial fluorescent plate readers (Jensen and Kristiansen, 2004
; Kruger et al., 2005
).
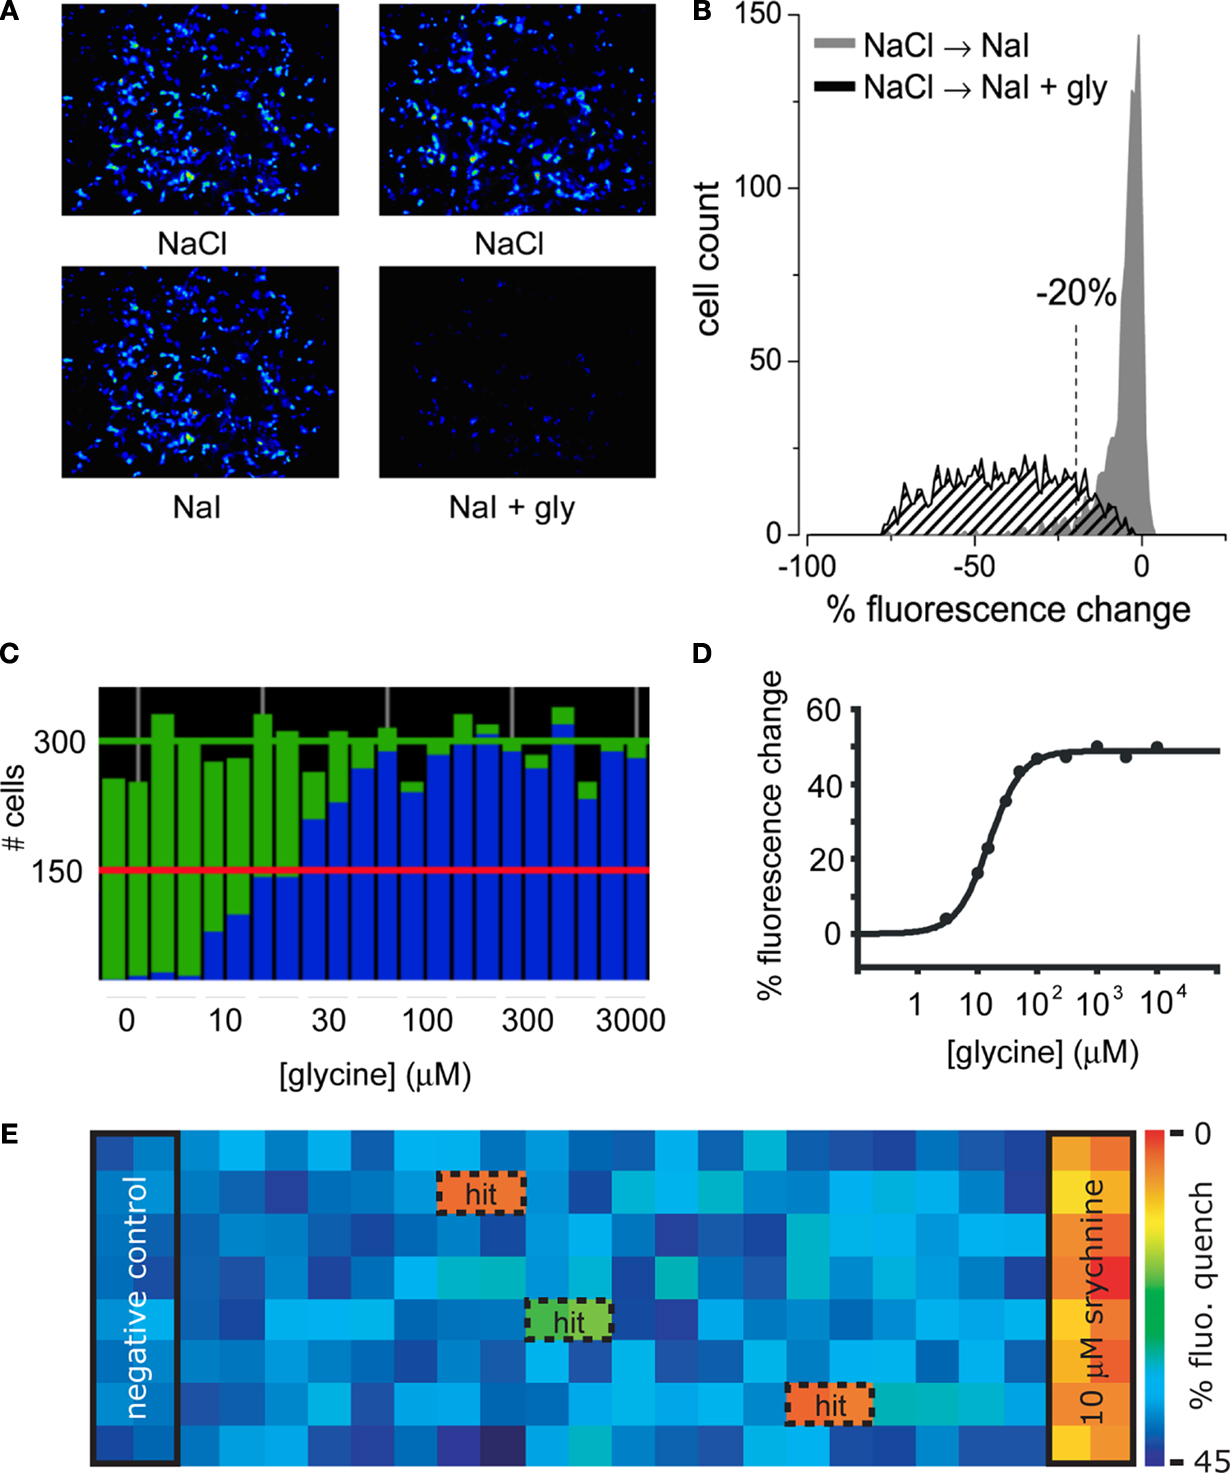
Figure 1. Screening GlyRs using YFP -I152L. (A) Images in the upper row were recorded in NaCl control solution whereas images in the lower row were recorded from the same wells 8 s after replacement with NaI alone (left image) or NaI + 1 mM glycine (right image). (B) Cell fluorescence distribution for experiments shown in (A). The ‘% fluorescence change’ is defined in the text. (C) Glycine dose–response as revealed by YFP fluorescence change. Each green histogram represents the total number of imaged fluorescent cells in a single well of a 384-well plate. Blue histograms represent the number cells per well that quenched by >20% upon glycine addition. From left, glycine concentrations were (in μM): 0, 3, 10, 15, 30, 50, 100, 300, 1000, 3000. Each was applied to two wells and every second value is shown. (D) Mean percentage fluorescence change of all fluorescent cells in (C) plotted against glycine concentration. Fitted EC50 = 22 μM. (E) ‘Heatmap’ of an actual screening experiment comprising eight rows of a 384-well plate, with ‘hits’ (i.e., fractions producing antagonistic activity) boxed and labelled. Experimental design is described in the text.
To prepare cells for experiments, we simultaneously transfect HEK293 cells with cDNAs for YFP-I152L plus the GlyR clone of interest. We have recently published a detailed comparison of five transient transfection methods employed routinely in the laboratory for this purpose (Gilbert et al., 2009a
). Once transfection is completed and the transfection reagent has been removed, around 2000 cells, suspended in 40 μl culture media, are plated into each well of a 384-well plate. Plates are then returned to the incubator and used for experiments 24–72 h later. Based on the proportion of fluorescent cells, transfection efficiency varies from 10 to 50%. As only those cells near the centre of the well are imaged, we are typically restricted to analysing 100–500 fluorescent cells per well (∼1000 cells total per image). As noted above, we routinely achieve an excellent correlation between cells expressing YFP and cells expressing GlyRs.
Sample images of cells expressing YFP-I152L and α1 GlyRs are shown in Figure 1
A. Imaged cells in the top and bottom rows were exposed to NaCl and NaI solutions, respectively. The images in the bottom rows were taken after an 8 s exposure to either NaI alone (bottom left panel) or NaI plus 1 mM glycine (bottom right panel). Figure 1
B quantitates the percentage fluorescence change produced by the addition of glycine. Percentage fluorescence change is defined as [(Ffinal/Finit) − 1) × 100 where Finit and Ffinal are the initial and final values of fluorescence, respectively. The experiment demonstrates that the YFP assay provides a robust indication of GlyR activation. To underscore this point, a sample experimental analysis output screen of a glycine dose–response experiment is shown in Figure 1
C. The green histograms indicate the number of fluorescent cells in each of 24 wells in a single row of a 384-well plate. The blue columns show the number of cells that displayed a >20% quench in response to the addition of control NaI plus glycine at the indicated concentrations. Each concentration was added to two adjacent wells, with concentrations increasing from left to right as indicated in Figure 1
C. This panel shows that almost all fluorescent cells displayed >20% quench at saturating glycine concentrations, supporting previous evidence for a strong correlation between YFP and GlyR expression. Figure 1
D shows an alternative analysis of the results presented in Figure 1
C, this time plotting mean percentage fluorescence change of all fluorescent cells against glycine concentration.
To demonstrate the robustness of this assay, Figure 1
E shows a sample outcome of an actual screening experiment. In this experiment, cells were pre-incubated with either no compound (‘negative control’ in wells 1 and 2), 10 μM of the antagonist strychnine (‘positive control’ in wells 23 and 24) or a natural product fraction with each fraction plated into two adjacent wells (wells 3–22). A control image was taken prior to glycine addition and a test image was taken 8 s after glycine addition. The mean percentage fluorescence change for all cells in each well was calculated as described above and translated into a colour according to the scale shown in Figure 1
E. Thus, the ‘warmer’ the colour, the greater the antagonist activity. This experiment yielded two strong hits as shown in orange, and a weaker hit as shown in green. We initially screen natural product fractions as antagonists as the dynamic range of an antagonist fluorescence response is typically much larger than it is for a potentiator response. Once a high affinity antagonist is identified, we isolate and screen analogues of this compound by automated patch-clamp electrophysiology to find subunit-specific positive and negative modulators.
Using this assay we have screened around 3000 natural product fractions against α1 GlyRs, yielding 27 active fractions. From these fractions we have identified at least four compound families with strong GlyR subunit-specific potentiating and inhibitory effects. From active fractions, we have so far identified 28 compounds with potent (nanomolar – low micromolar) effects on GlyRs as follows:
• 12 compounds that specifically potentiate α1 GlyRs,
• 1 compound that specifically potentiates α3 GlyRs,
• 2 compounds that potentiate both α1 and α3 GlyRs,
• 1 compound that specifically inhibits α1 GlyRs,
• 4 compounds that specifically inhibit α3 GlyRs and
• 8 compounds that inhibit both α1 and α3 GlyRs.
Generating Stably Expressing HEK293 Cell Lines
As automated patch-clamp electrophysiology requires stable cells lines expressing the channels of interest, we generated cell lines that stably express either α1 or α3 GlyRs. For this purpose, both human α1 and α3 GlyR subunit cDNAs were cloned into the pcDNA3.1 plasmid vector. Following transfection with linearised vector DNA, HEK293 cells were maintained for 14–21 days in selection medium containing 1 mg/ml of the selection antibiotic, G-418, and 10 μM strychnine. The strychnine was required to prevent the glycine in the culture medium from activating the GlyRs. The surviving cells were trypsinised, counted and diluted, so as to yield a suspension that was used to plate (on average) one individual clone into each well of several 96-well plates. Individual clones were then grown in the same selection medium for about 2 weeks. All wells identified as containing monoclonal colonies were screened for a functional response to 1 mM glycine using the YFP assay. In this screening several cell clones transfected with either α1 or α3 GlyR subunits exhibiting a significant response to glycine exposure were identified and then the selection process described above was repeated using these clones. Finally, after further testing, cells were split into 24-well plates, 6-well plates, 6 cm dishes and T75 flasks successively. All remaining clones were frozen at −80°C for later use. Clones of each subunit were then selected for further characterization in the patch-clamp and YFP assay.
Automated Patch-Clamp Electrophysiology
These recordings were performed using a Nanion Patchliner automated planar chip patch-clamp device (NPC-16A, Nanion Technologies GmBH, Munich, Germany). This device employs expendable planar glass ‘chips’ each consisting of a glass plate with 16 apertures embedded into a perspex microfluidic system which directs solutions to the internal and external sides of each aperture. The tiny volume of this microfluidic system is a major advantage of this system as it allows experiments to be conducted with extremely small quantities of compounds. For example, the external solution bathing the cells can be completely exchanged using 25 μl of new solution. Although chips permit 16 single cell recordings, only eight can be made simultaneously. The first step in forming the whole cell configuration is to inject a suspension of stably expressing cells into the microfluidic system thereby placing them at the external aperture surface. Then, by application of negative pressure to the opposite side of the aperture, a single cell is attached at random to the aperture. Contrary to the classical patch-clamp technique, it is the cell that is moved to the aperture and not the pipette that is moved to the cell. As with conventional patch-clamp, a seal is obtained by the application of suction in an automated manner and the membrane is then ruptured for whole cell access. The result is a low resistance electrical pathway to the inside of the cell allowing for whole cell patch-clamp recordings. Full experimental details of these standardized procedures, including compositions of internal and external solutions, are provided in recent reviews (Bruggemann et al., 2008
; Farre et al., 2009
; Milligan et al., 2009
).
Sample glycine dose–response relationships from HEK293 cells stably expressing either α1 or α3 GlyRs recorded using the planar chip device are shown in Figure 2
. The current recordings are comparable in quality to those generated by conventional patch-clamp and the glycine EC50 values generated using the planar chip device are comparable with those recorded in our laboratory using conventional electrophysiology (Figure 2
, legend). This suggests that both the stably expressing cell lines developed in our laboratory and the planar chip recording system are appropriate for quantitating the sensitivity of α1 and α3 GlyRs to compounds of interest. Indeed, we have used this device to generate averaged dose–response relationships for a total 36 compounds of interest at α1 and α3 GlyRs, each averaged from 3 to 8 cells. In broad agreement with a previous study (Milligan et al., 2009
), we typically experience a whole-cell recording success rate of around 80% of all cells sucked onto the aperture, with around 50% of recordings lasting for 10 min or more.
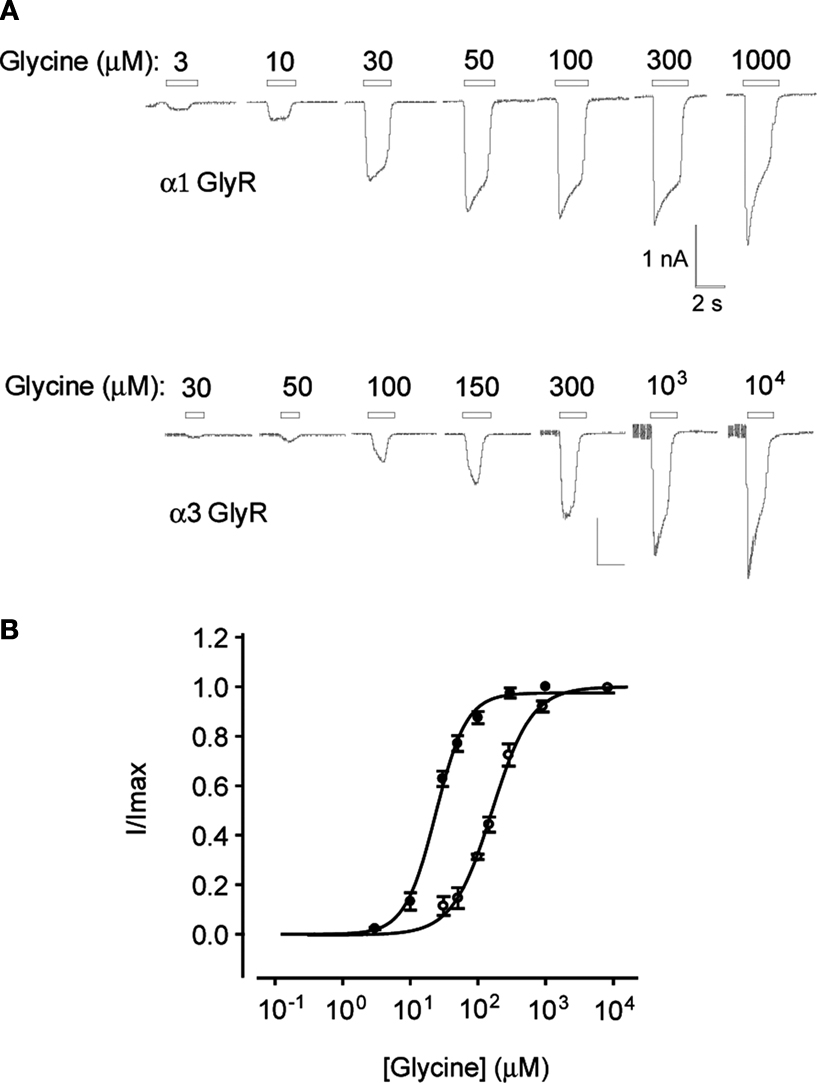
Figure 2. Planar whole-cell patch-clamp data from HEK293 cells stably expressing α1 or α3 GlyRs. (A) Current responses in cells expressing α1 and α3 GlyRs. Indicated glycine concentrations were applied for 2 s at 1 min intervals. (B) Averaged glycine dose–responses averaged from five cells expressing either α1 (filled symbols) or α3 GlyRs (unfilled symbols). Error bars represent standard errors and curves are Hill equation fits to the averaged data. Individual α1 GlyR dose–response curves were fitted a mean glycine concentration of 24 ± 2 μM and a Hill coefficient of 1.9 ± 0.2 (n = 5 cells). Both values were not significantly different to their respective means (30 ± 1 μM and 1.7 ± 0.2, n = 5) recorded by conventional patch-clamp of HEK293 cells transiently expressing α1 GlyRs (Chen et al., 2009a
). The α3 GlyR dose–responses were fitted with a mean glycine concentration of 166 ± 9 μM and a Hill coefficient of 1.4 ± 0.1 (n = 5 cells). In contrast, the respective mean values for α3 GlyRs recorded by patch-clamp of transiently transfected HEK293 cells were 309 ± 20 μM and 2.0 ± 0.1 (n = 5) (Chen et al., 2009a
).
Creation and Screening of a GlyR Random Mutant Library
It is not always possible to identify novel drug binding sites using site-directed mutagenesis. For example, at the GlyR it has not yet proved possible to identify the binding site for the non-glycinergic agonist, ivermectin. We are interested in identifying its binding site because, (1) it is commonly used as an anti-parasitic in agriculture, veterinary and human medical practice (Omura, 2008
) and (2) it activates the GlyR by a mechanism distinct from glycinergic agonists (Pless et al., 2007
) and thus may prove a useful tool for probing GlyR activation mechanisms. One way of discovering this and other intractable binding sites is to use HT methods to screen the drug of interest against a large library of randomly mutated GlyRs.
Random mutagenesis methods generally involve error-prone PCR and a range of strategies for implementing this approach have been developed (An et al., 2008
; Emond et al., 2008
; Fujii et al., 2006
). The approach we used was to create a library of randomly mutated α1 GlyR-pcDNA 3.1 clones using the GeneMorph II Random Mutagenesis Kit (Stratagene). Following manufacturers’ instructions, fragment PCR reaction conditions were optimized (750 ng template and 30 cycles of PCR) to yield a mutation frequency of one to two mutations per 1000 base pairs (15–20 clones from each PCR reaction were sequenced, covering more than 10,000 bp). The observed mutational spectra, which closely resembled that predicted for Mutazyme II, corresponded to one to three amino acid changes per receptor. The observed amino acid changes were scattered throughout the entire coding sequence with no evidence of clustering. Approximately 20–25% of the sequenced clones contained no mutations. A similar mutation rate was successfully employed in a similar screen of the TRPM8 channel (Bandell et al., 2006
). As this was deemed an appropriate mutation rate, we then used a commercial service (Australian Genome Research Facility, Brisbane, QLD, Australia) to grow 1536 clones derived from the same PCR reaction in 384-well format and then extract plasmid DNA of sufficient quality. A glycerol stock of each clone was also made. This process resulted in an average yield of around 100 ng plasmid DNA per clone.
Since all transfection procedures of which we are aware use at least 100 ng plasmid DNA regardless of cell number or culture media volume, it was necessary to develop a technique of reliably transfecting much smaller amounts of plasmid DNA into single wells of a 384-well plate. This technique is presented in the Supplementary Material. In brief, we scaled down a standard calcium phosphate transfection procedure and tested its transfection efficiency with differing amounts of YFP plasmid DNA. As shown in Figure 3
, the YFP transfection efficiency was found to be maximal at 10 ng plasmid DNA per well.
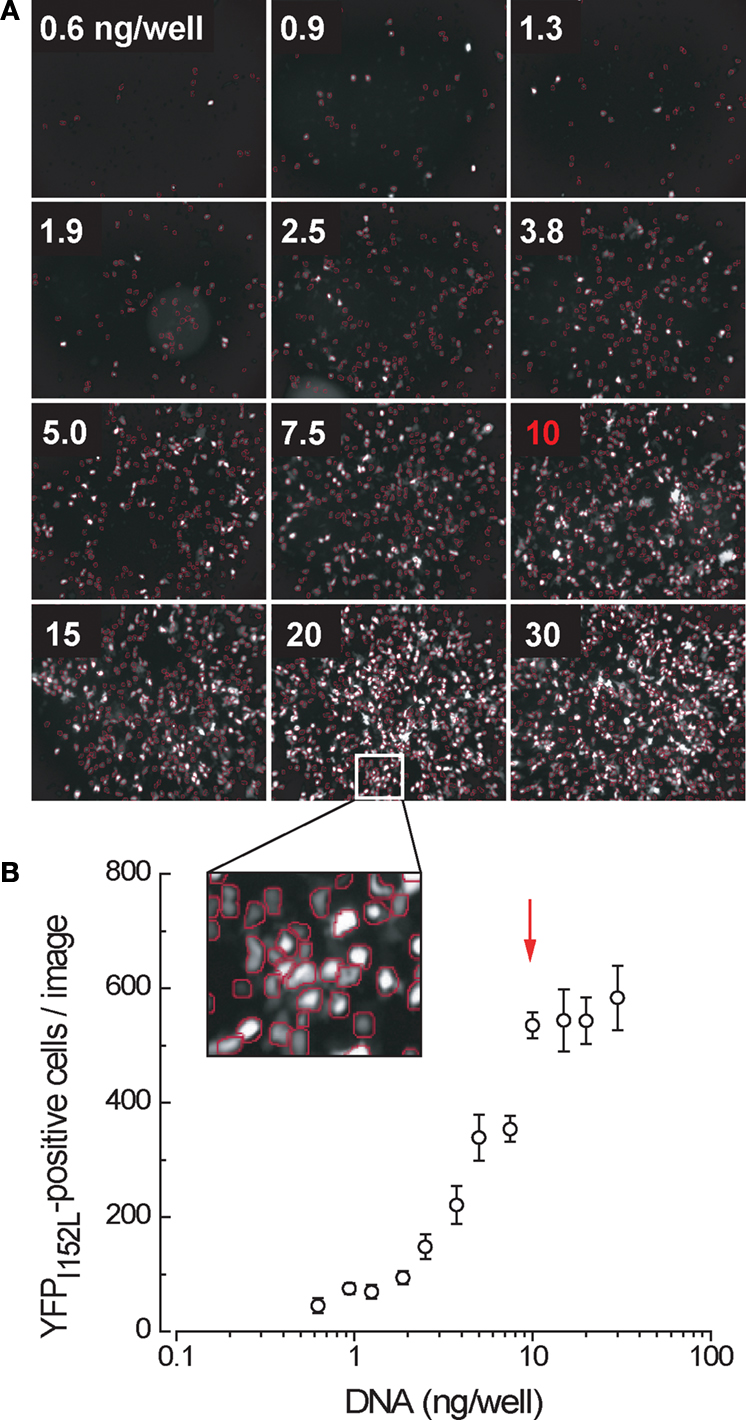
Figure 3. Yellow fluorescent protein expression in cells transfected in single wells of a 384-well plate as a function of the amount of cDNA transfected. (A) Sample results from a single experiment. All wells contained an equivalent number (∼5000) of cells. (B) Mean number of fluorescent cells per image, averaged from four independent experiments. Arrow denotes point of optimal transfection efficiency.
In a search for mutations that affect ivermectin sensitivity, we first added NaI containing 30 nM ivermectin to each well. This was followed by an application of 10 μM ivermectin and then one of 10 mM glycine. The rationale for this approach was that 30 nM ivermectin is subthreshold at the wild type (WT) α1 GlyR, whereas 10 μM is barely saturating (Shan et al., 2001
). Thus, quantitating variations in receptor responses to both of these concentrations should permit the detection of mutations that substantially increase or decrease ivermectin sensitivity. The final saturating glycine application was a control to ascertain the functional expression of GlyRs in the event that a mutation completely eliminated ivermectin sensitivity.
Sample Results of Random Mutant Screen
After a first round screen of a total of 1566 clones (1536 random mutants plus 30 site directed mutants previously generated in the laboratory), we identified 44 mutant clones that significantly changed ivermectin sensitivity. The effects of 20 of these clones were confirmed by a second round of fluorescence-based screening. From this pool of clones, we have so far confirmed by nucleotide sequencing and electrophysiology a total of four α1 GlyR mutations that significantly change ivermectin sensitivity. One of the mutations identified by this process was the highly conserved Y279F substitution in the extracellular M2-M3 linker domain. Examples of currents activated by the indicated concentrations of ivermectin and glycine in the WT and Y279F mutant α1 GlyRs are shown in Figure 4
A. Averaged ivermectin dose–responses for both receptors, with current magnitudes normalised to those activated by glycine in the same cell are presented in Figure 4
B. An averaged ivermectin dose–response for the Y279C mutant GlyR is also shown to indicate the specificity of the Y–F substitution in disrupting ivermectin sensitivity. Because this substitution involves simply the removal of a hydroxyl group, we hypothesise that Y279 is specifically involved in either the binding or gating mechanism of ivermectin. Experiments are currently underway to resolve the molecular basis of this effect. We expect these experiments may provide crucial insights into the binding site or mechanism of action of this important pharmaceutical agent.
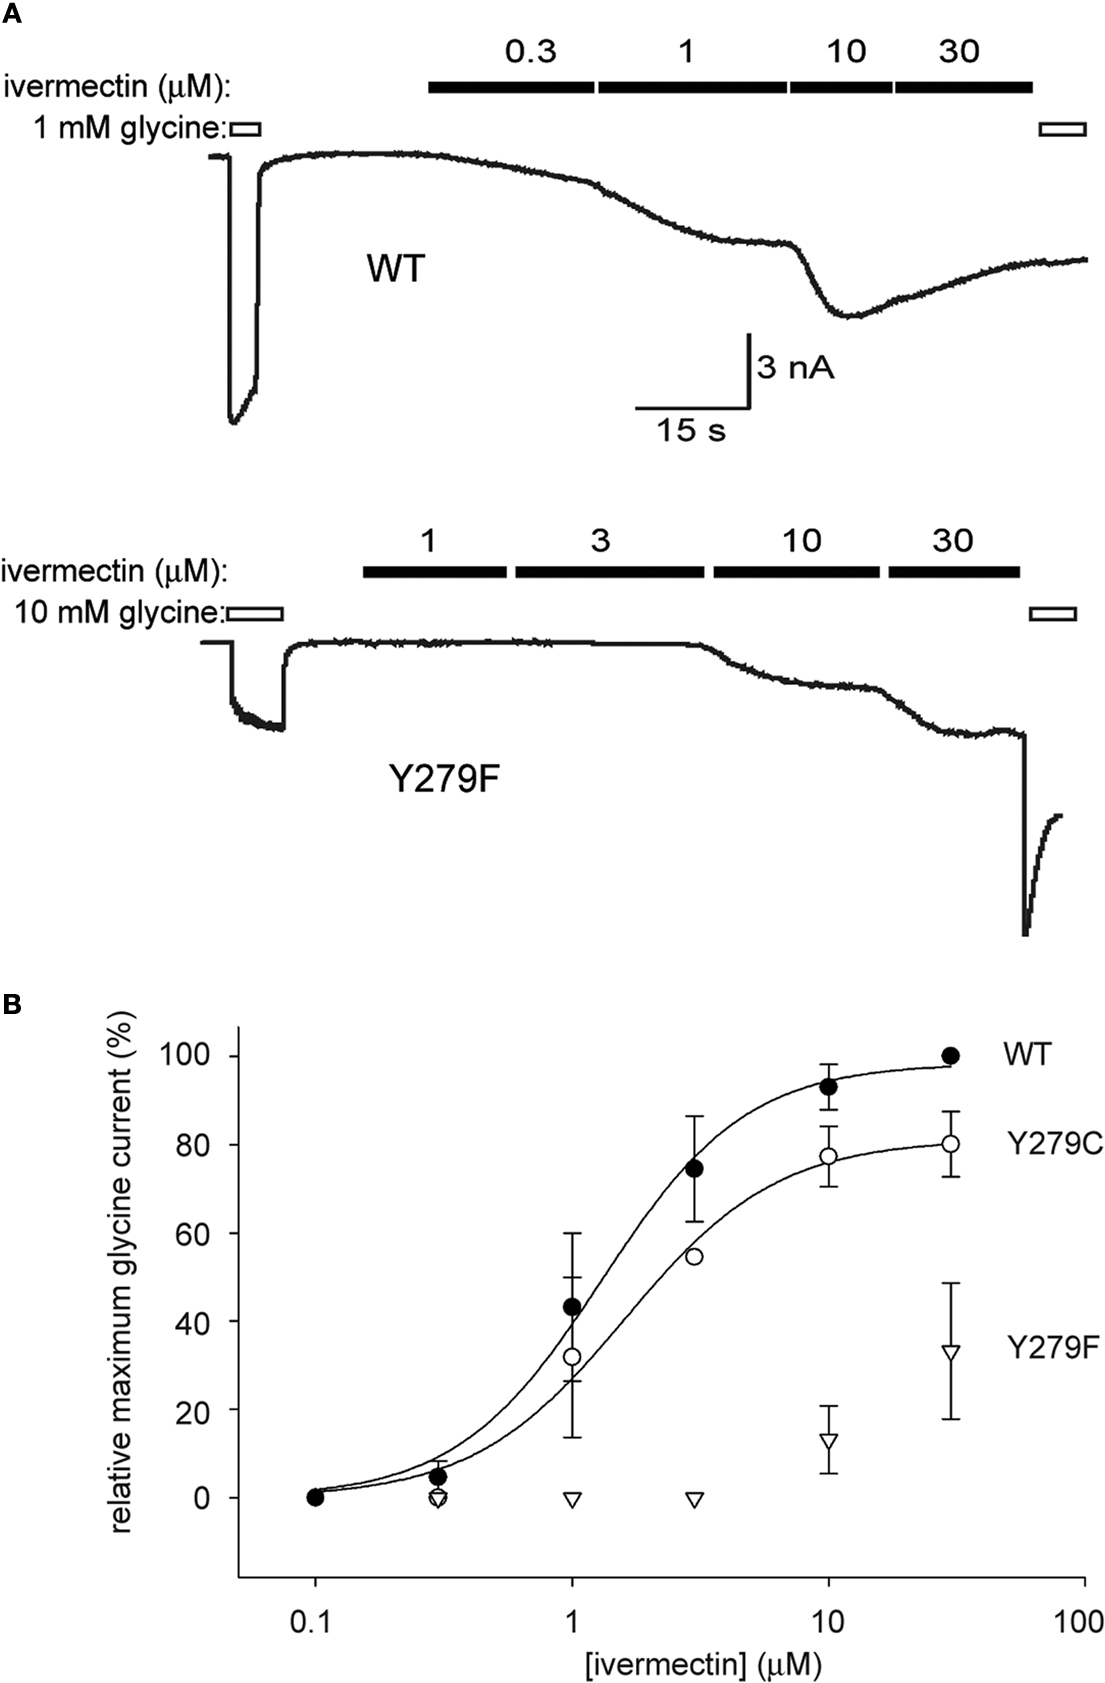
Figure 4. The Y279F mutation dramatically reduces α1 GlyR sensitivity to ivermectin. (A) Conventional whole-cell patch-clamp recordings from HEK293 cells transiently expressing unmutated or Y279F mutant α1 GlyRs (upper and lower panels, respectively). The indicated concentrations of glycine and ivermectin were applied as indicated by the unfilled and filled bars, respectively. Because ivermectin activation is irreversible, dose–responses were generated by successively applying increasing ivermectin concentrations. (B) Averaged ivermectin dose–responses each averaged from five cells expressing either WT α1 GlyRs (filled circles), Y279C mutant α1 GlyRs (unfilled circles) or Y279F mutant α1 GlyRs (triangles). Error bars represent standard errors of the mean and curves represent fits to the averaged data with the Hill equation. The Y to F mutation causes an approximately 50 fold reduction in ivermectin sensitivity.
Despite GlyRs emerging as potential drug targets for therapies aimed at movement disorders, chronic inflammatory pain, temporal lobe epilepsy and immunomodulation, we are not aware of any systematic, published attempts to discover new drugs active at these receptors. The first aim of this review was to consider various HTS-amenable methods that may be applicable to these receptors. We conclude that an anion sensitive YFP is an optimal method for first round screening and that automated electrophysiology of cell stably expressing GlyRs is a useful means of confirming activity and quantitating the actions of identified compounds. The second aim of this review was to demonstrate how these techniques are used in practice in our laboratory for the purpose of both discovering novel GlyR-active compounds and establishing their mechanisms of action.
The authors declare that the research was conducted in the absence of any commercial or financial relationships that could be construed as a potential conflict of interest.
This project was supported by the Australian Research Council and the National Health and Medical Research Council of Australia (NHMRC). J.W. Lynch is supported by an NHMRC Senior Research Fellowship.
The Supplementary Material for this article can be found online at http://www.frontiersin.org/molecularneuroscience/paper/10.3389/neuro.02/017.2009/
Adkins, C. E., Pillai, G. V., Kerby, J., Bonnert, T. P., Haldon, C., McKernan, R. M., Gonzalez, J. E., Oades, K., Whiting, P. J., and Simpson, P. B. (2001). alpha4beta3delta GABA(A) receptors characterized by fluorescence resonance energy transfer-derived measurements of membrane potential. J. Biol. Chem. 276, 38934–38939.
Eichler, S. A., Kirischuk, S., Juttner, R., Schafermeier, P. K., Legendre, P., Lehmann, T. N., Gloveli, T., Grantyn, R., and Meier, J. C. (2008). Glycinergic tonic inhibition of hippocampal neurons with depolarizing GABAergic transmission elicits histopathological signs of temporal lobe epilepsy. J. Cell Mol. Med. 12, 2848–2866.
Emond, S., Mondon, P., Pizzut-Serin, S., Douchy, L., Crozet, F., Bouayadi, K., Kharrat, H., Potocki-Veronese, G., Monsan, P., and Remaud-Simeon, M. (2008). A novel random mutagenesis approach using human mutagenic DNA polymerases to generate enzyme variant libraries. Protein Eng. Des. Sel. 21, 267–274.
Harvey, R. J., Depner, U. B., Wassle, H., Ahmadi, S., Heindl, C., Reinold, H., Smart, T. G., Harvey, K., Schutz, B., Abo-Salem, O. M., Zimmer, A., Poisbeau, P., Welzl, H., Wolfer, D. P., Betz, H., Zeilhofer, H. U., and Muller, U. (2004). GlyR alpha3: an essential target for spinal PGE2-mediated inflammatory pain sensitization. Science 304, 884–887.
Milligan, C. J., Li, J., Sukumar, P., Majeed, Y., Dallas, M. L., English, A., Emery, P., Porter, K. E., Smith, A. M., McFadzean, I., Beccano-Kelly, D., Bahnasi, Y., Cheong, A., Naylor, J., Zeng, F., Liu, X., Gamper, N., Jiang, L. H., Pearson, H. A., Peers, C., Robertson, B., and Beech, D. J. (2009). Robotic multiwell planar patch-clamp for native and primary mammalian cells. Nat Protoc 4, 244–255.