Computational reconstruction of pacemaking and intrinsic electroresponsiveness in cerebellar golgi cells
- 1 Department of Cellular and Molecular Physiological and Pharmacological Sciences, University of Pavia and CNISM, Italy
- 2 Theoretical Neurobiology, University of Antwerp, Belgium
- 3 Computational Neuroscience Unit, Okinawa Institute of Science and Technology, Japan
The Golgi cells have been recently shown to beat regularly in vitro (Forti et al., 2006. J. Physiol. 574, 711–729). Four main currents were shown to be involved, namely a persistent sodium current (I Na-p), an h current (I h), an SK-type calcium-dependent potassium current (I K-AHP), and a slow M-like potassium current (I K-slow). These ionic currents could take part, together with others, also to different aspects of neuronal excitability like responses to depolarizing and hyperpolarizing current injection. However, the ionic mechanisms and their interactions remained largely hypothetical. In this work, we have investigated the mechanisms of Golgi cell excitability by developing a computational model. The model predicts that pacemaking is sustained by subthreshold oscillations tightly coupled to spikes. I Na-p and I K-slow emerged as the critical determinants of oscillations. I h also played a role by setting the oscillatory mechanism into the appropriate membrane potential range. I K-AHP, though taking part to the oscillation, appeared primarily involved in regulating the ISI following spikes. The combination with other currents, in particular a resurgent sodium current (I Na-r) and an A-current (I K-A), allowed a precise regulation of response frequency and delay. These results provide a coherent reconstruction of the ionic mechanisms determining Golgi cell intrinsic electroresponsiveness and suggests important implications for cerebellar signal processing, which will be fully developed in a companion paper (Solinas et al., 2008. Front. Neurosci. 2:4).
Introduction
Oscillations are one of the most prominent features of brain activity (Buzsaki, 2006 ). Numerous neurons in the brain show pacemaker activity exploiting a variety of ionic mechanisms (Hutcheon and Yarom, 2000 ; Koch, 1999 ; Llinás, 1988 ; Yamada et al., 1998 ). In a well-known case represented by relay thalamic neurons (RTN), large low-voltage oscillations are generated by the interplay of h-current with low-threshold activated (LVA) calcium channels (Huguenard and McCormick, 1992 ; McCormick and Huguenard, 1992 ; McCormick and Pape, 1990 ). The h-current determines the depolarizing ramp leading to LVA channel activation and to the calcium spike, which triggers a spike bursts before inactivating and concluding the cycle. These pacemakers cannot be easily perturbed and drive fast sodium spike bursts. Some other, probably more diffused pacemaker neurons, show smaller oscillations in the subthreshold membrane potential region generating a regular low-frequency beating, usually in the theta-frequency band. These include several neuronal types in the basal ganglia and brain cortex (Bennett et al., 2000 ; Dickson et al., 2000a ; Surmeier et al., 2005 ; Wilson and Callaway, 2000 ). The mechanisms are thought to employ primarily persistent sodium currents in combination with some slow repolarizing mechanism, although oscillations driven by high-voltage activated calcium channels have also been reported. The variety of pacemaker mechanism may be related to the additional behaviors the neuron is able to express. It is therefore important to determine how a specific neuron generates pacemaking and how this combines with other aspects of electroresponsiveness.
The Golgi cell (Golgi, 1883 ) is an inhibitory interneuron regulating information flow in the granular layer circuit of cerebellum (Eccles et al., 1967 ; Marr, 1969 ), which has been recently shown to beat regularly in vitro (Forti et al., 2006 , see also Dieudonné, 1998 ). Electrophysiological and pharmacological analysis (Forti et al., 2006 ) showed that four main currents were involved, namely a persistent sodium current (I Na-p), an h current (I h), an SK-type calcium-dependent potassium current (I K-AHP), and a slow M-like potassium current (I K-slow). However, the precise role of these currents was unclear. In particular, both I Na-p and I h may be able to drive the oscillation and the repolarizing action of I K-AHP and I K-slow may also be redundant.
As a first step for investigating the mechanisms of Golgi cell excitability, we have developed a computational model incorporating state-of-the-art knowledge on Golgi cell ionic channels and electroresponsiveness. The model predicted that pacemaking was sustained by subthreshold oscillations generated by I Na-p and I K-slow. I h was less important but maintained the model into the appropriate membrane potential range for oscillation. The oscillations were tightly coupled to spikes thereby causing a prominent activation of I K-AHP and a stabilization of the pacemaker cycle. The combination with other currents, in particular a resurgent sodium current (I Na-r) and an A-current (I K-A), allowed a precise regulation of response frequency and delay. These results provide a coherent reconstruction of the ionic mechanisms determining Golgi cell intrinsic electroresponsiveness. The implications of this complex ionic complement will be further clarified in a companion paper (Solinas et al., 2007), in which I K-AHP and I K-slow will assume the additional and more specific roles of determining phase-reset and theta-frequency resonance.
Materials and Methods
This work presents a combined experimental and modeling analysis of Golgi cell electroresponsiveness. In order to develop a comprehensive hypothesis on how the Golgi cell generates its excitable response, an extensive re-analysis of patch-clamp recordings and pharmacological data obtained in a previous paper (Forti et al., 2006 ) has been complemented with a computational model. The model allowed us to investigate neuronal behaviors hard to resolve experimentally, like the apparent close coupling of spikes with intrinsic oscillatory mechanisms and the effect of persistent Na+ currents. Moreover, while conductance measurements and dynamic-clamp have been successfully applied to electrotonically compact neurons (e.g., in isolated Purkinje cells: Raman and Bean, 1997 ), the large clamp escape in Golgi cells in slices (data not shown) prevents the application of these methods.
Golgi cell modeling
A computational model of rat Golgi cell electroresponsiveness was constructed using the NEURON simulator (version 5.9; Hines and Carnevale, 2001 ). The model consisted of five compartments allowing for a minimal description of the Golgi cell electrotonic structure. The soma was connected to an “electrode” to reproduce realistic current-clamp conditions. All voltage- and Ca2+-dependent mechanisms (see below) were placed in the somatic compartment. With this approach, the model reproduced satisfactorily basic aspects of Golgi cell electroresponsiveness elicited by somatic current injection. It should also be noted that, although differences have been reported at the histochemical level (Geurts et al., 2001 ; Simat et al., 2007 ), the basic electroresponsive properties were homogeneous in a large majority of Golgi cells (Forti et al., 2006 , see also figures in this paper). Thus, we have reconstructed a “canonical” Golgi cell model which simulates the electrophysiological behavior for this major Golgi cell subgroup and lays within the scatter of physiological parameter values. The model was calibrated on the cellular response corrected for the liquid-junction potential.
The model included 12 voltage-dependent conductances placed into the soma (Table 1
). Gating kinetics were corrected using a Q10 = 5 for I Ca-LVA activation (Destexhe et al., 1994
) and a Q10 = 3 for all the other currents according to the relation  (Gutfreund et al., 1995
) to account for temperature differences between experimental recordings and the model (23°C). Nernst equilibrium potentials were calculated from ionic concentrations used in current-clamp recordings. Only the Ca2+ Nernst potential was updated during simulation. The maximum density voltage-dependent conductances were regulated to fit the Golgi cell responses to various stimulations (Achard and De Schutter, 2006
; Traub and Llinás, 1979
; Traub et al., 1991
; Vanier and Bower, 1999
).
(Gutfreund et al., 1995
) to account for temperature differences between experimental recordings and the model (23°C). Nernst equilibrium potentials were calculated from ionic concentrations used in current-clamp recordings. Only the Ca2+ Nernst potential was updated during simulation. The maximum density voltage-dependent conductances were regulated to fit the Golgi cell responses to various stimulations (Achard and De Schutter, 2006
; Traub and Llinás, 1979
; Traub et al., 1991
; Vanier and Bower, 1999
).
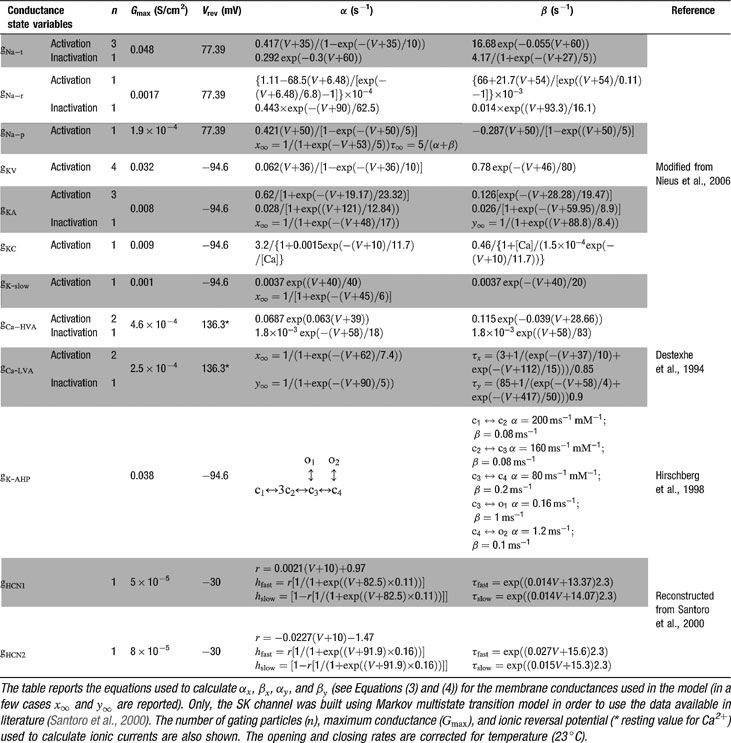
Table 1. Voltage-dependent conductance parameters.
Ionic currents were modeled following the Hodgkin and Huxley formulation of ion channel gating using mathematical methods reported previously (D'Angelo et al., 2001 ; Nieus et al., 2006 ). Voltage was obtained as the time integral of the equation (Yamada et al., 1998 )

where V is membrane potential, Cm membrane capacitance, gi are ionic conductances, and Vi reversal potentials (the subscript i indicates different channels), and iinj is the injected current. I AHP was simulated using a Markov gating scheme reproducing the dynamics reported by Hirschberg et al., (1998) , while all other membrane conductances were represented using Hodgkin–Huxley-like models (Hodgkin and Huxley, 1952 ) of the type

where Gmaxi is the maximum ionic conductance, xi and yi are state variables (probabilities ranging from 0 to 1) for a gating particle, and zi is the number of such gating particles in ionic channel i. x and y (the suffix i omitted) were related to the first order rate constants α and β by the equations

where α and β are functions of voltage. The equations used to parameterize α and β and the state variables  , for different ionic channels are shown in Table 1
. The state variable kinetics were
, for different ionic channels are shown in Table 1
. The state variable kinetics were
The intracellular Ca2+ concentration, [Ca2+], was calculated through the equation
where d is the depth of a shell adjacent to the cell surface of area A, βCa determines the loss of Ca2+ ions from the shell approximating the effect of fluxes, ionic pumps, diffusion, and buffers (De Schutter and Smolen, 1998 ; McCormick and Huguenard, 1992 ; Traub and Llinás, 1979 ), and [Ca2+]0 is the resting [Ca2+].
Model mechanisms
Passive properties and model structure. In cerebellar Golgi cells, charge displacement during voltage steps followed a tri-phasic trajectory (see Figure 1 ). According to Dieudonné (1998) , the fastest transient was related to the soma, the intermediate to the dendrites, and the slowest to the axon. According to proportions reported by Dieudonné (1998) the capacitances of soma, dendrites, and axon were set to 23, 32, and 90 pF, respectively, summing up to a total cell capacitance of 145 pF (Forti et al., 2006 ). The specific axial resistance of axon and dendrites was set to 100 Ω · cm (Roth and Häusser, 2001 ), the specific membrane resistance was set to 47.6 KΩ · cm2 (corresponding to the experimental determination of leakage reported below) and specific membrane capacitance was set at 1 μF∕cm2. Compartments equivalent to the complex structure of dendrites and axons (Koch, 1999 ; Yamada et al., 1998 ) were generated to comprise a spherical soma (diameter = 27 μm), a single axonal compartment (1200 μm long and 2.4 μm thick), and three dendritic compartments (each 113 μm long and 3 μm thick). With these parameters, input capacitance and input resistance in the model equaled those of Golgi cells and the model could appropriately reproduce current transients recorded in vitro in the subthreshold region (Figure 1 ). The micropipette was simulated as a passive cable with sealed end, null capacitance, infinite wall resistance and an axial resistance of 25 MΩ equivalent to “access resistance” (Neher and Sakmann, 1995 ).
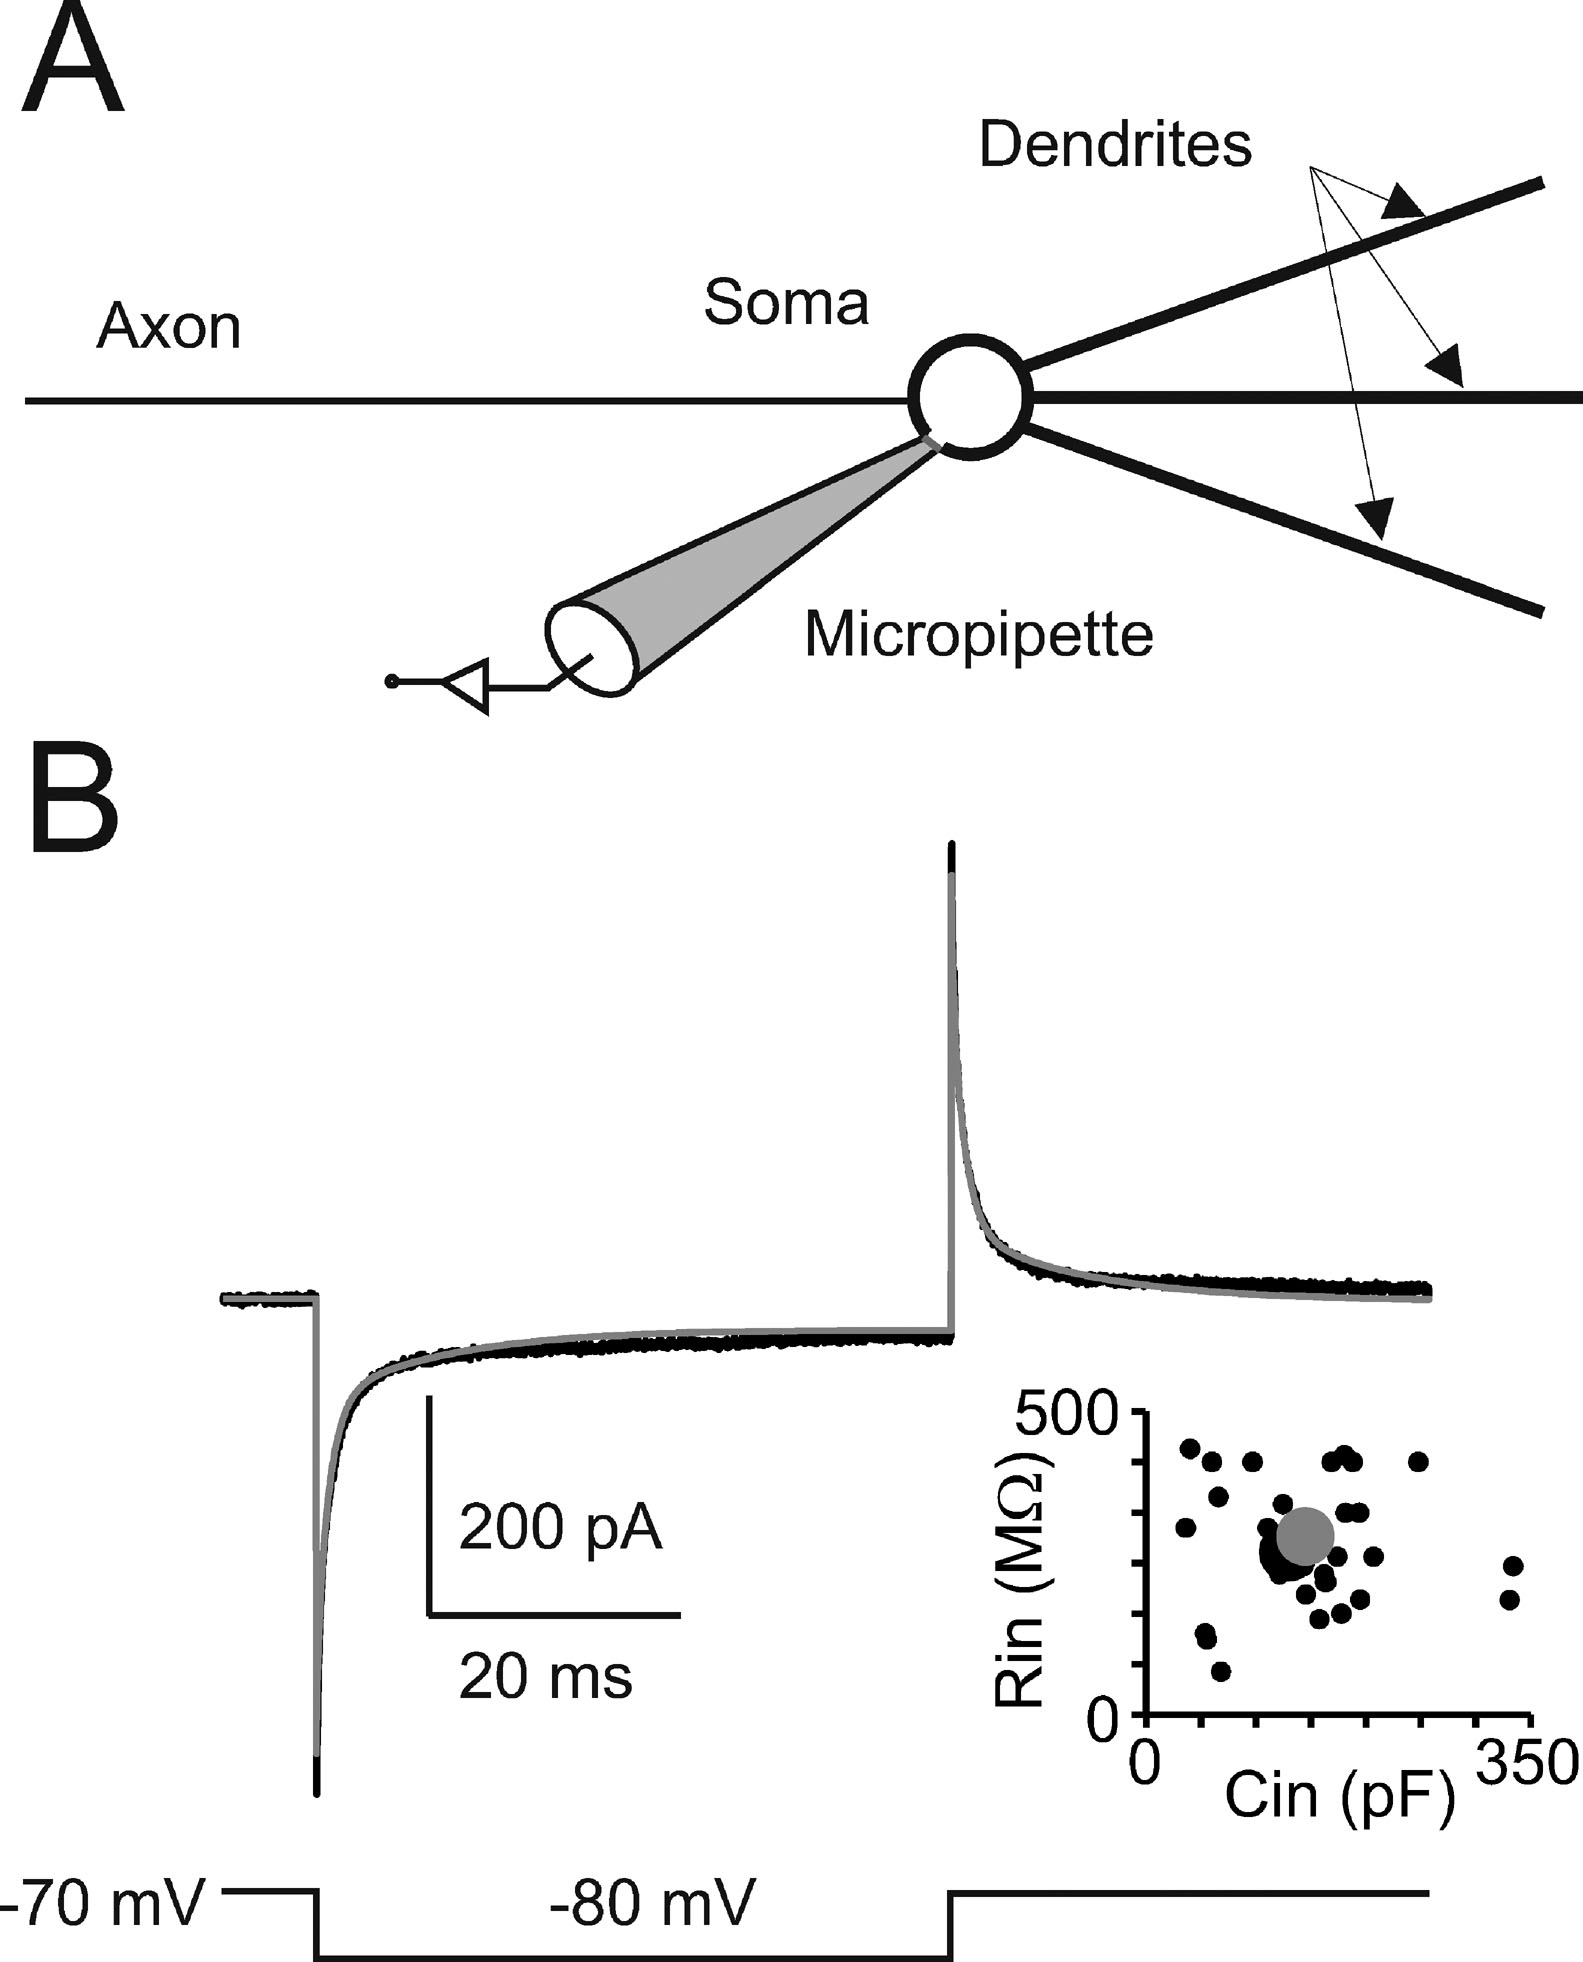
Figure 1. Passive Golgi cell properties. (A) Schematics of the minimal model built to reproduce cerebellar Golgi cell electroresponsiveness. The model has a spherical soma and processes representing the dendrites and axon. The soma is connected to a micropipette to simulate realistic recording conditions. (B) The recording (black trace) shows a current transient elicited in a Golgi cell by a 50-ms voltage step from −70 to −80 mV. The model (gray trace) faithfully matches the response. The plot shows the relationship between input resistance (Rin ) and input capacitance (Cin) in 39 Golgi cells (black circles, the larger one corresponding to the trace shown on top). The model prediction (large gray dot) falls in the middle of the experimental data distribution (p > 0.8, t-test).
Leakage. The leakage current (I Leak) was measured in the subthreshold region from VC recordings after application of the following ionic channel blockers (in mM): TEACl (40), BaCl2 (2), CdCl2 (0.2), CoCl2 (2), TTX (0.001), Apamin (0.05), Linopirdine (0.04), ZD7288 (0.01–0.1). All drugs were applied through general bath perfusion as described in Forti et al., (2006) . The currents obtained from voltage-step injection yielded a linear I–V plot (range −120 to −60 mV) maximum conductance of 21 μS∕cm2 and reversal potential at −60 mV (data not shown).
Voltage-dependent mechanisms. These were based on experimental observations including current-clamp (Forti et al., 2006 ) and preliminary voltage-clamp recordings. A first current set was needed to generate action potentials. This consisted in a standard description of INa-t and IK-V and was completed through the introduction of ICa-HVA and IK-C, which improved the fast phase (1–2 ms following the upstroke) of spike afterhyperpolarization (AHP) preventing Na+ channel inactivation and discharge blockage at high frequency. IK-A regulated the first spike delay and I Na-r intensified high-frequency discharge. I Ca-LVA was needed to enhance rebound depolarization. A second current set was needed to generate pacemaking and, according to previous experimental analysis (Forti et al., 2006 ), included I Na-p, I h, I K-slow, and I K-AHP. The procedures adopted to reproduce ionic channel gating (Hodgkin and Huxley, 1952 ; Neher and Sakmann, 1995 ) and set current density (Achard and De Schutter, 2006 ; Traub and Llinás, 1979 ; Traub et al., 1991 ; Vanier and Bower, 1999 ) are reported below.
Ih. The presence of Ih in Golgi cells was reported by Dieudonné (1998) and confirmed by Forti et al., (2006) . I h in Golgi cells is manifest during the application of hyperpolarizing current steps causing sagging inward rectification with both a rapid and a slow phase. Slow and fast response components were reproduced by two voltage-dependent mechanisms corresponding to HCN1 and HCN2 currents, respectively (Santoro et al., 2000 , see also Chan et al., 2004 ; Dickson et al., 2000b ; Luthi and McCormick, 1998 ; McCormick and Pape, 1990 ; McCormick and Huguenard, 1992 ). After regulating current densities to match the sag and the steady-state level of hyperpolarizing responses, the model generated a robust rebound depolarization, as observed experimentally (a reinforcement of the early rebound phase was obtained with ICa-LVA, see below).
INa-p. INa-p was matched to the I–V curve reported by Forti et al., (2006) . INa-p kinetics were derived from the model previously developed for cerebellar granule cells (D'Angelo et al., 2001 ; Magistretti et al., 2006 ; Nieus et al., 2006 ) and pyramidal cells (Gutfreund et al., 1995 ).
IK-slow. The presence of a slow repolarizing retigabine-sensitive M-like current (IK-slow) in Golgi cells was suggested by pharmacological observations (Forti et al., 2006 ). The IK-slow model was obtained from previous models (D'Angelo et al., 2001 ; Gutfreund et al., 1995 ) and maximum conductance was set in proportion to I Na-p (Nieus et al., 2006 ). I K-slow contributed to shape the ISI and spike frequency adaptation.
IK-AHP. The presence of a slow Ca2+-dependent repolarizing apamin-sensitive K+ current (encoded by SK-type channels; for a review see Bond et al., 2005 ; Stocker, 2004 ) sustaining the slower phase (peaking 30–40 ms after spike peak) of the spike AHP in Golgi cells was indicated by pharmacological observations (Forti et al., 2006 ). Although, in rat Golgi cells, mRNAs encoding the SK3 subtype are particularly abundant (Stocker and Pedarzani, 2000 ), the corresponding current in the model, I K-AHP, was simulated using the available SK2 model reported by Hirschberg et al., (1998) . I K-AHP was activated by Ca2+ entering through HVA Ca2+ channels (Marrion and Tavalin, 1998 ; Stocker, 2004 ). After regulating intracellular Ca2+ dynamics, I K-AHP was tuned in order to fit the slow AHP phase and spike frequency adaptation.
ICa-LVA. Preliminary observations suggest that Golgi cells express LVA calcium channels reinforcing rebound excitation on return from hyperpolarization (Forti, Cesana and D'Angelo, unpublished observations). Indeed, the model could not properly reproduce the initial reinforcement of rebound firing with I h alone. The I Ca-LVA model was taken from Destexhe et al., (1994) and current density adjusted to appropriately reinforce rebound excitation. Due to its voltage-dependent inactivation, I Ca-LVA did not contribute to any other excitable process of the Golgi cell.
Spike-related currents. The complement of spike-related currents was reconstructed with mechanisms taken from a previous granule cell model (D'Angelo et al., 2001 ; Nieus et al., 2006 ). The density of the transient Na+ current (I Na-t) was adjusted to reproduce the action potential threshold and overshoot. A preliminary investigation revealed that, as well as granule cells, Golgi cells also express a proportionate resurgent Na+ current (I Na-r) component (Magistretti, Castelli and D'Angelo, unpublished observations). Its insertion into the model was required to enhance the initial doublet in response to depolarization raising the maximum firing rate into the physiological range measured in vitro (up to ∼200 Hz, Forti et al., 2006 ). The delayed rectifier K+ current, I K-V, was needed to generate spike repolarization and balanced with I K-C to match the spike shape. The requirement of a Ca2+-dependent voltage-dependent K+ current, I K-C, emerged from the inability of I K-V to fully account for the fast phase of spike AHP and to guarantee Na+ channel re-priming at high discharge frequency. I K-A was needed to regulate spike delay in response to depolarizing current injection and during rebound excitation.
Ca2+dynamics. Ca2+ dynamics were adapted to yield Ca2+ transients of about 1 μM following spike-dependent opening of HVA channels (Gabbiani et al., 1994 ). Parameters used in Equation (6) (d = 200 nm, β Ca = 1.3, and [Ca2+]0 = 50 nM) were similar to those used in other neurons (e.g., De Schutter and Smolen, 1998 ; D'Angelo et al., 2001 ; Traub and Llinás, 1979 ; Traub, 1982 ). With this asset, there was calcium accumulation during high-frequency discharge but not when the model fired at its intrinsic pacemaker rhythm. The computed intracellular Ca2+ concentration [Ca2+]i activated I K-C just after the spike upstroke and generated the fast AHP. I K-AHP was activated using 1∕3 of the computed [Ca2+]i value on the assumption that local concentration is smaller on SK than on channels supporting I K-C (see Stocker (2004) for a discussion on effective local [Ca2+]i concentrations). This seems reasonable in view of the higher [Ca2+]i affinity of SK channel subtypes with respect to channels supporting the fast spike AHP (reviewed in Stocker, 2004 ). The slow dynamics of I K-AHP, which contributed to the slower phase of the spike AHP, was accounted for by slow channel closing kinetics rather than by the permanence of elevated Ca2+ levels. I K-AHP activation was enhanced during high-frequency repetitive discharge due to the associated Ca2+ build-up, thereby determining spike-frequency adaptation (see Figure 4 ). It should be noted that, in the model, I Ca-LVA was not allowed to contribute to the Ca2+ pool controlling I K-C and I K-AHP, since such a coupling would unrealistically depress rebound excitation (data not shown).
Membrane noise in vitro. In order to reproduce the ISI irregularity observed during Golgi cell recordings in vitro (CV ISI = 0.13, median value from loose cell-attached recordings, Forti et al., 2006 ; CV ISI = 0.16, median value from WCR, this study), Gaussian noise was added to the model in selected simulations aimed at reproducing the effect of apamin application (cf. Figures 2 E and 5 C). The NEURON random number generator was used to produce a sequence of numbers cast from a Gaussian distribution with 0 mean and unitary variance generating a sequence lacking temporal correlation. The random numbers were scaled by a 32 pA coefficient yielding a noise current injected into the soma. In the canonical model, this produced a CV ISI = 0.16.
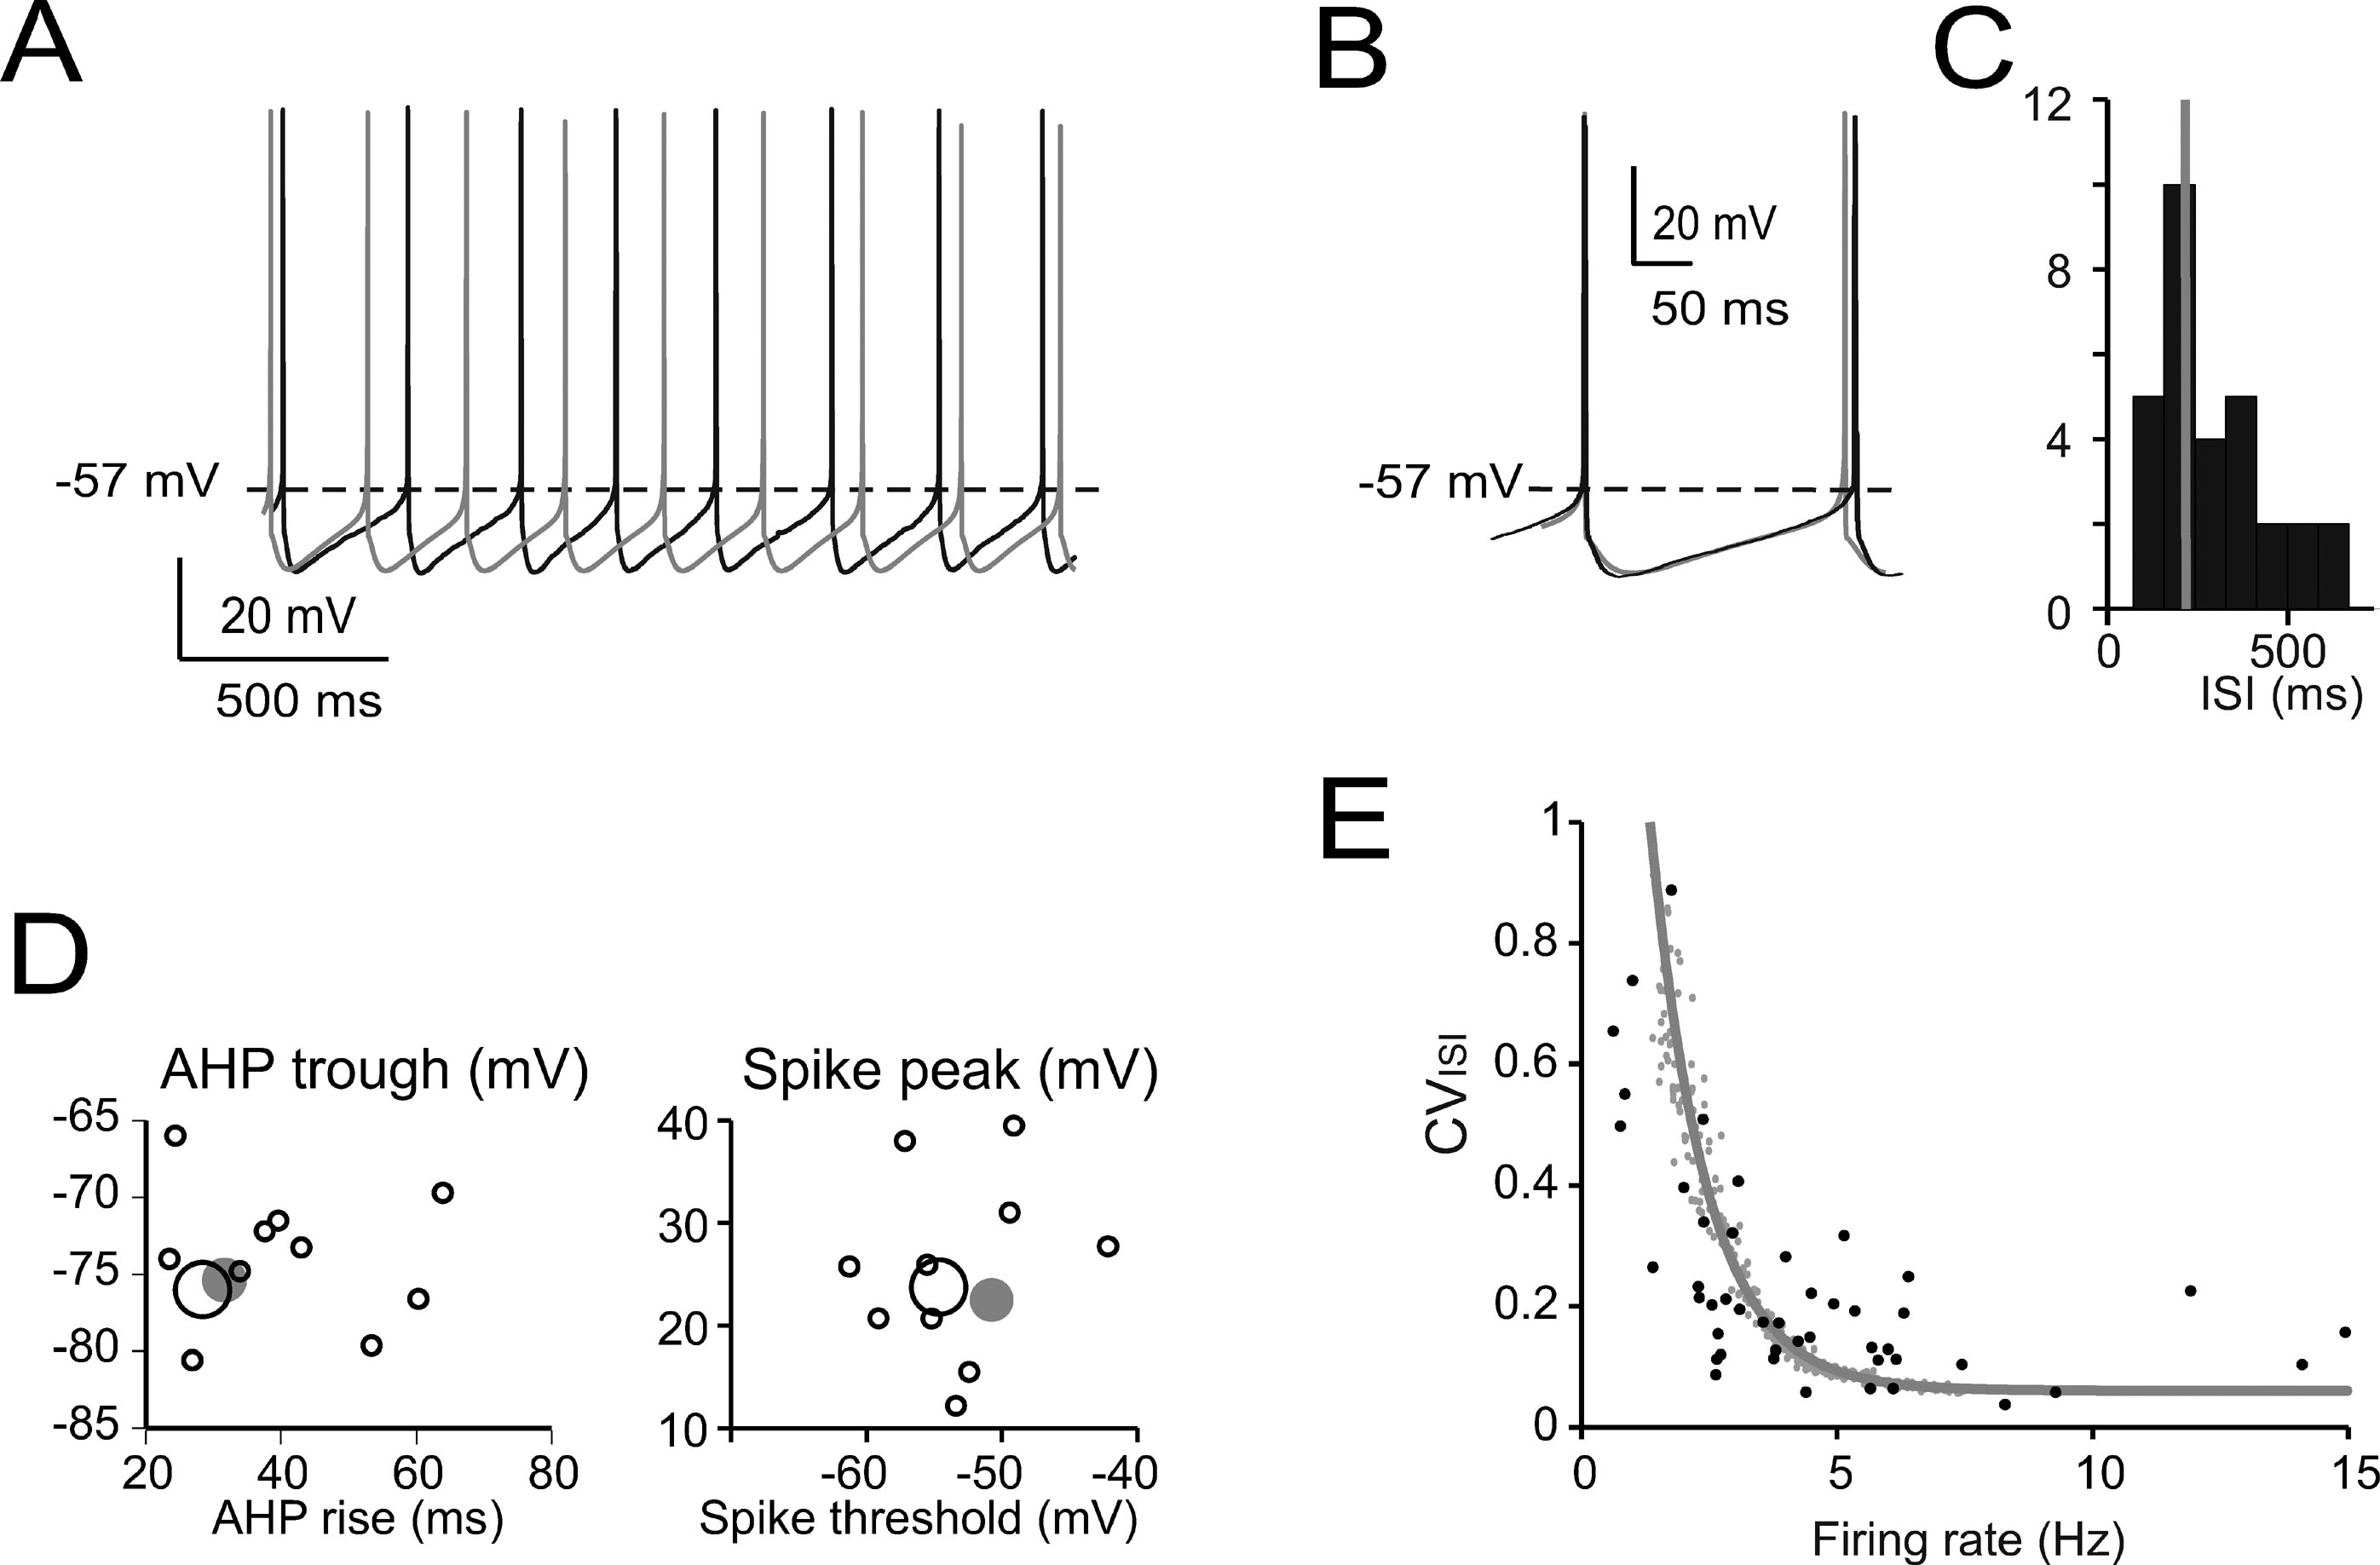
Figure 2. Pacemaking. (A) Pacemaker activity during Golgi cell WCR (black) and in the model (gray). (B) Enlarged view of interspike interval (ISI) taken from A. The model (leakage reversal potential −62 mV) faithfully follows the membrane potential of this specific Golgi cell. (C) Distribution of the ISI of spontaneously firing Golgi cells (mean of 20–50 ISI per cell; n = 32) during WCR. Note that the ISI in the model (gray bar) falls on the mode of the experimental data distribution. (D) Relationships among ISI parameters. Note that the model data points (large gray dots) fall within the distribution of spike amplitude versus spike threshold and within the distribution of AHP trough versus AHP rise-time measured experimentally (black circles, the larger ones corresponding to the trace in A–B). The model did not significantly differ from the data (p > 0.12, t-test). (E) The experimental relationship between CVISI and firing rate (n = 47 WCR) showed a negative correlation. The model was injected with a noisy current (32 pA SD, see Methods) and the spontaneous frequency was varied among the values observed during WCRs by changing the leakage reversal potential from −67 to −55 mV. Simulations (gray line) show that the model could appropriately fit the experimental measurements.
The Golgi cell model NEURON code is available from ModelDB (senselab.med.yale.edu∕ModelDb∕).
Data analysis
The processing of experimental and simulated traces was automated using dedicated scripts written in MATLAB (MathWorks, Natick, MA, USA). As in Forti et al., (2006) , spike threshold was detected at the point where the depolarization rate reached 5 mV∕ms. Spike maximum and minimum (AHP trough) were computed and the AHP rise-time was estimated as the time needed to reach the AHP trough from threshold crossing during the down phase of the spike. The sag amplitude was calculated as the difference between the minimum and steady-state value of membrane potential during responses to hyperpolarizing currents. Firing rate adaptation in response to depolarizing currents was calculated as the ratio of the steady-state and initial discharge frequency (i.e., the inverse of the last and first ISI).
The match of model to experimental data was evaluated by testing the null hypothesis that their difference was a random sample from a normal distribution (Lilliefors test) with mean equal to 0 and unknown variance (Student's t-test). All data are reported as mean ± SD.
Results
The Golgi cell was recently proposed to express a characteristic set of ionic currents (comprising I Na-p, I h, I K-AHP, and I K-slow; Forti et al., 2006 ). Each one of these is endowed with unique gating and kinetics properties (see for a comprehensive description Koch, 1999 ; Yamada et al., 1998 ): I Na-p activates rapidly with depolarization in the subthreshold region, I h slowly deactivates with depolarization, I K-AHP activates briskly upon Ca2+ entry and remains activated for tens of milliseconds, and I K-slow activates slowly and progressively in the subthreshold region during sustained depolarization.
In order to elaborate a hypothesis on how these ionic mechanisms interact, the electrophysiological and pharmacological analysis of intrinsic excitability was assisted by a computational model incorporating prototypical ionic current properties (see Methods, Figure 1 and Table 1 ).
Modeling the basic properties of Golgi cell electroresponsiveness
The basic properties of Golgi cell electroresponsiveness in acute brain slices (henceforth called in vitro) were inferred from the previous paper of Forti et al., (2006) and from novel WCR data, and could be summarized as follows. (i) Golgi cells paced rhythmically at a frequency between 1 and 8 Hz at room temperature (Figure 2 A). In the pacemaking regime, spikes were followed by a protracted AHP (Figure 2 B). The average ISI distribution obtained from different cells in WCR showed a prominent peak around 200 ms (Figure 2 C). There was no clear correlation between the rise-time and depth of AHP or between spike size and threshold (Figure 2 D). The variability of the ISI in each cell was inversely correlated with the average firing frequency (Figure 2 E), and was small (CV ISI = 0.16, median value from WCR). (ii) When injected with hyperpolarizing currents, Golgi cells showed sagging inward rectification and, at the end of hyperpolarization, generated a rebound excitation transiently intensifying spike generation (Figure 3 A). Rebound excitation consisted of an acceleration of spike frequency, which progressively decayed back to baseline levels. There was no clear correlation between the amplitude of the hyperpolarizing sag and the first spike delay or the duration of the first ISI (Figure 3 B). (iii) When injected with a depolarizing current, Golgi cells generated repetitive spike discharge showing fast adaptation at high-current intensity. At the end of discharge, Golgi cells generated an AHP (Figure 4 A). The first spike delay decreased progressively with current injection (Figure 4 B, left) while the firing rate increased (Figure 4 B, middle). The comparison of instantaneous frequencies at the beginning and end of discharges showed that adaptation could reduce firing frequency by 78 ± 4%. Inspection of Figure 4 A also showed that the discharge initiated with a high-frequency doublet and that most adaptation occurred after the first few spikes resulting in an adaptation that was inversely dependent on the initial firing rate (Figure 4 B, right).
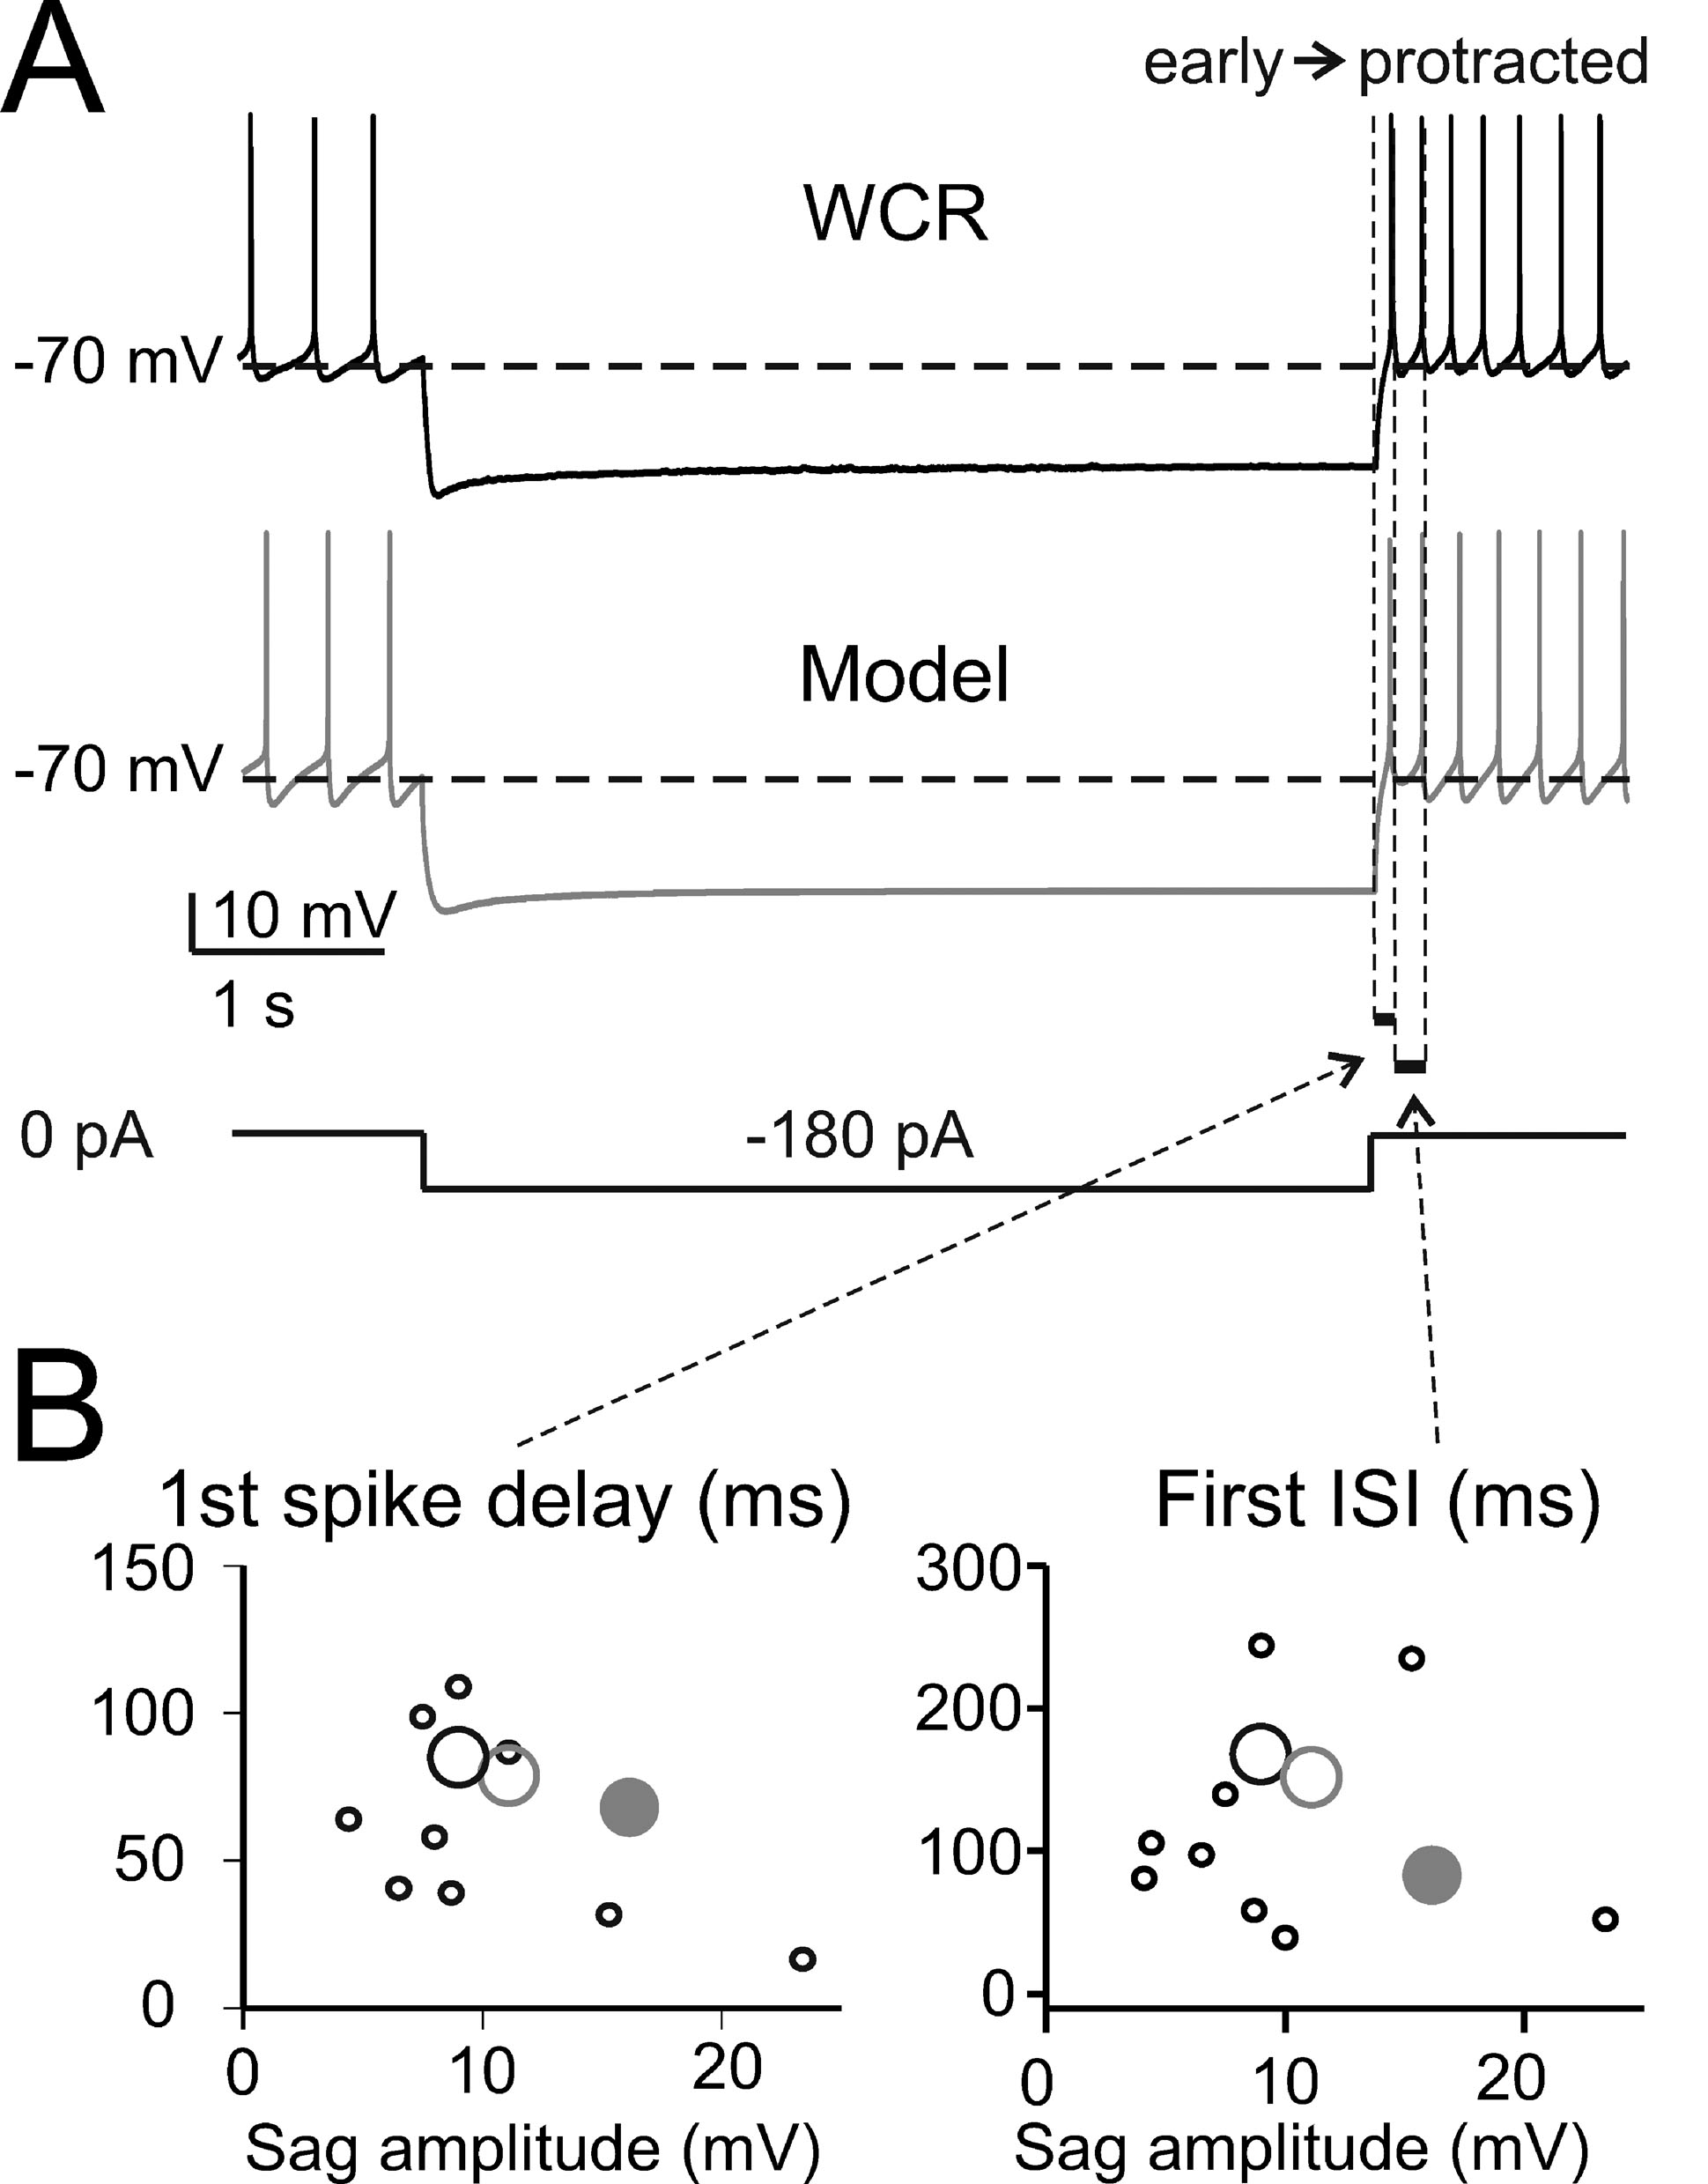
Figure 3. The response to hyperpolarization and rebound excitation. (A) The WCR from a Golgi cell shows sagging inward rectification in response to hyperpolarizing current injection and, at the end of the hyperpolarization, rebound excitation with an early and a protracted phase of intensified firing. Simulations of this specific experiment (parameters were adjusted to mimic the experimental trace in detail: leakage reversal potential −64.5 mV, IK-slow 90%, Ih-HCN1 60 %, Ih-HCN2 12.5 % of their value in the canonical model) show that the model could faithfully reproduce sagging inward rectification and rebound excitation (gray trace). The step-current protocol is shown at the bottom. (B) The plots report the time to first spike and the first ISI during rebound excitation as a function of sag amplitude in 10 Golgi cells (black circles, the larger one corresponding to the trace in A) stimulated using the protocol shown in A. Note that the canonical model (large gray dots) did not significantly differ from the data (p > 0.13, t-test). Even the model adjusted to match the specific trace shown in A (large gray circle, see details reported in A) falls within the experimental data scatter.
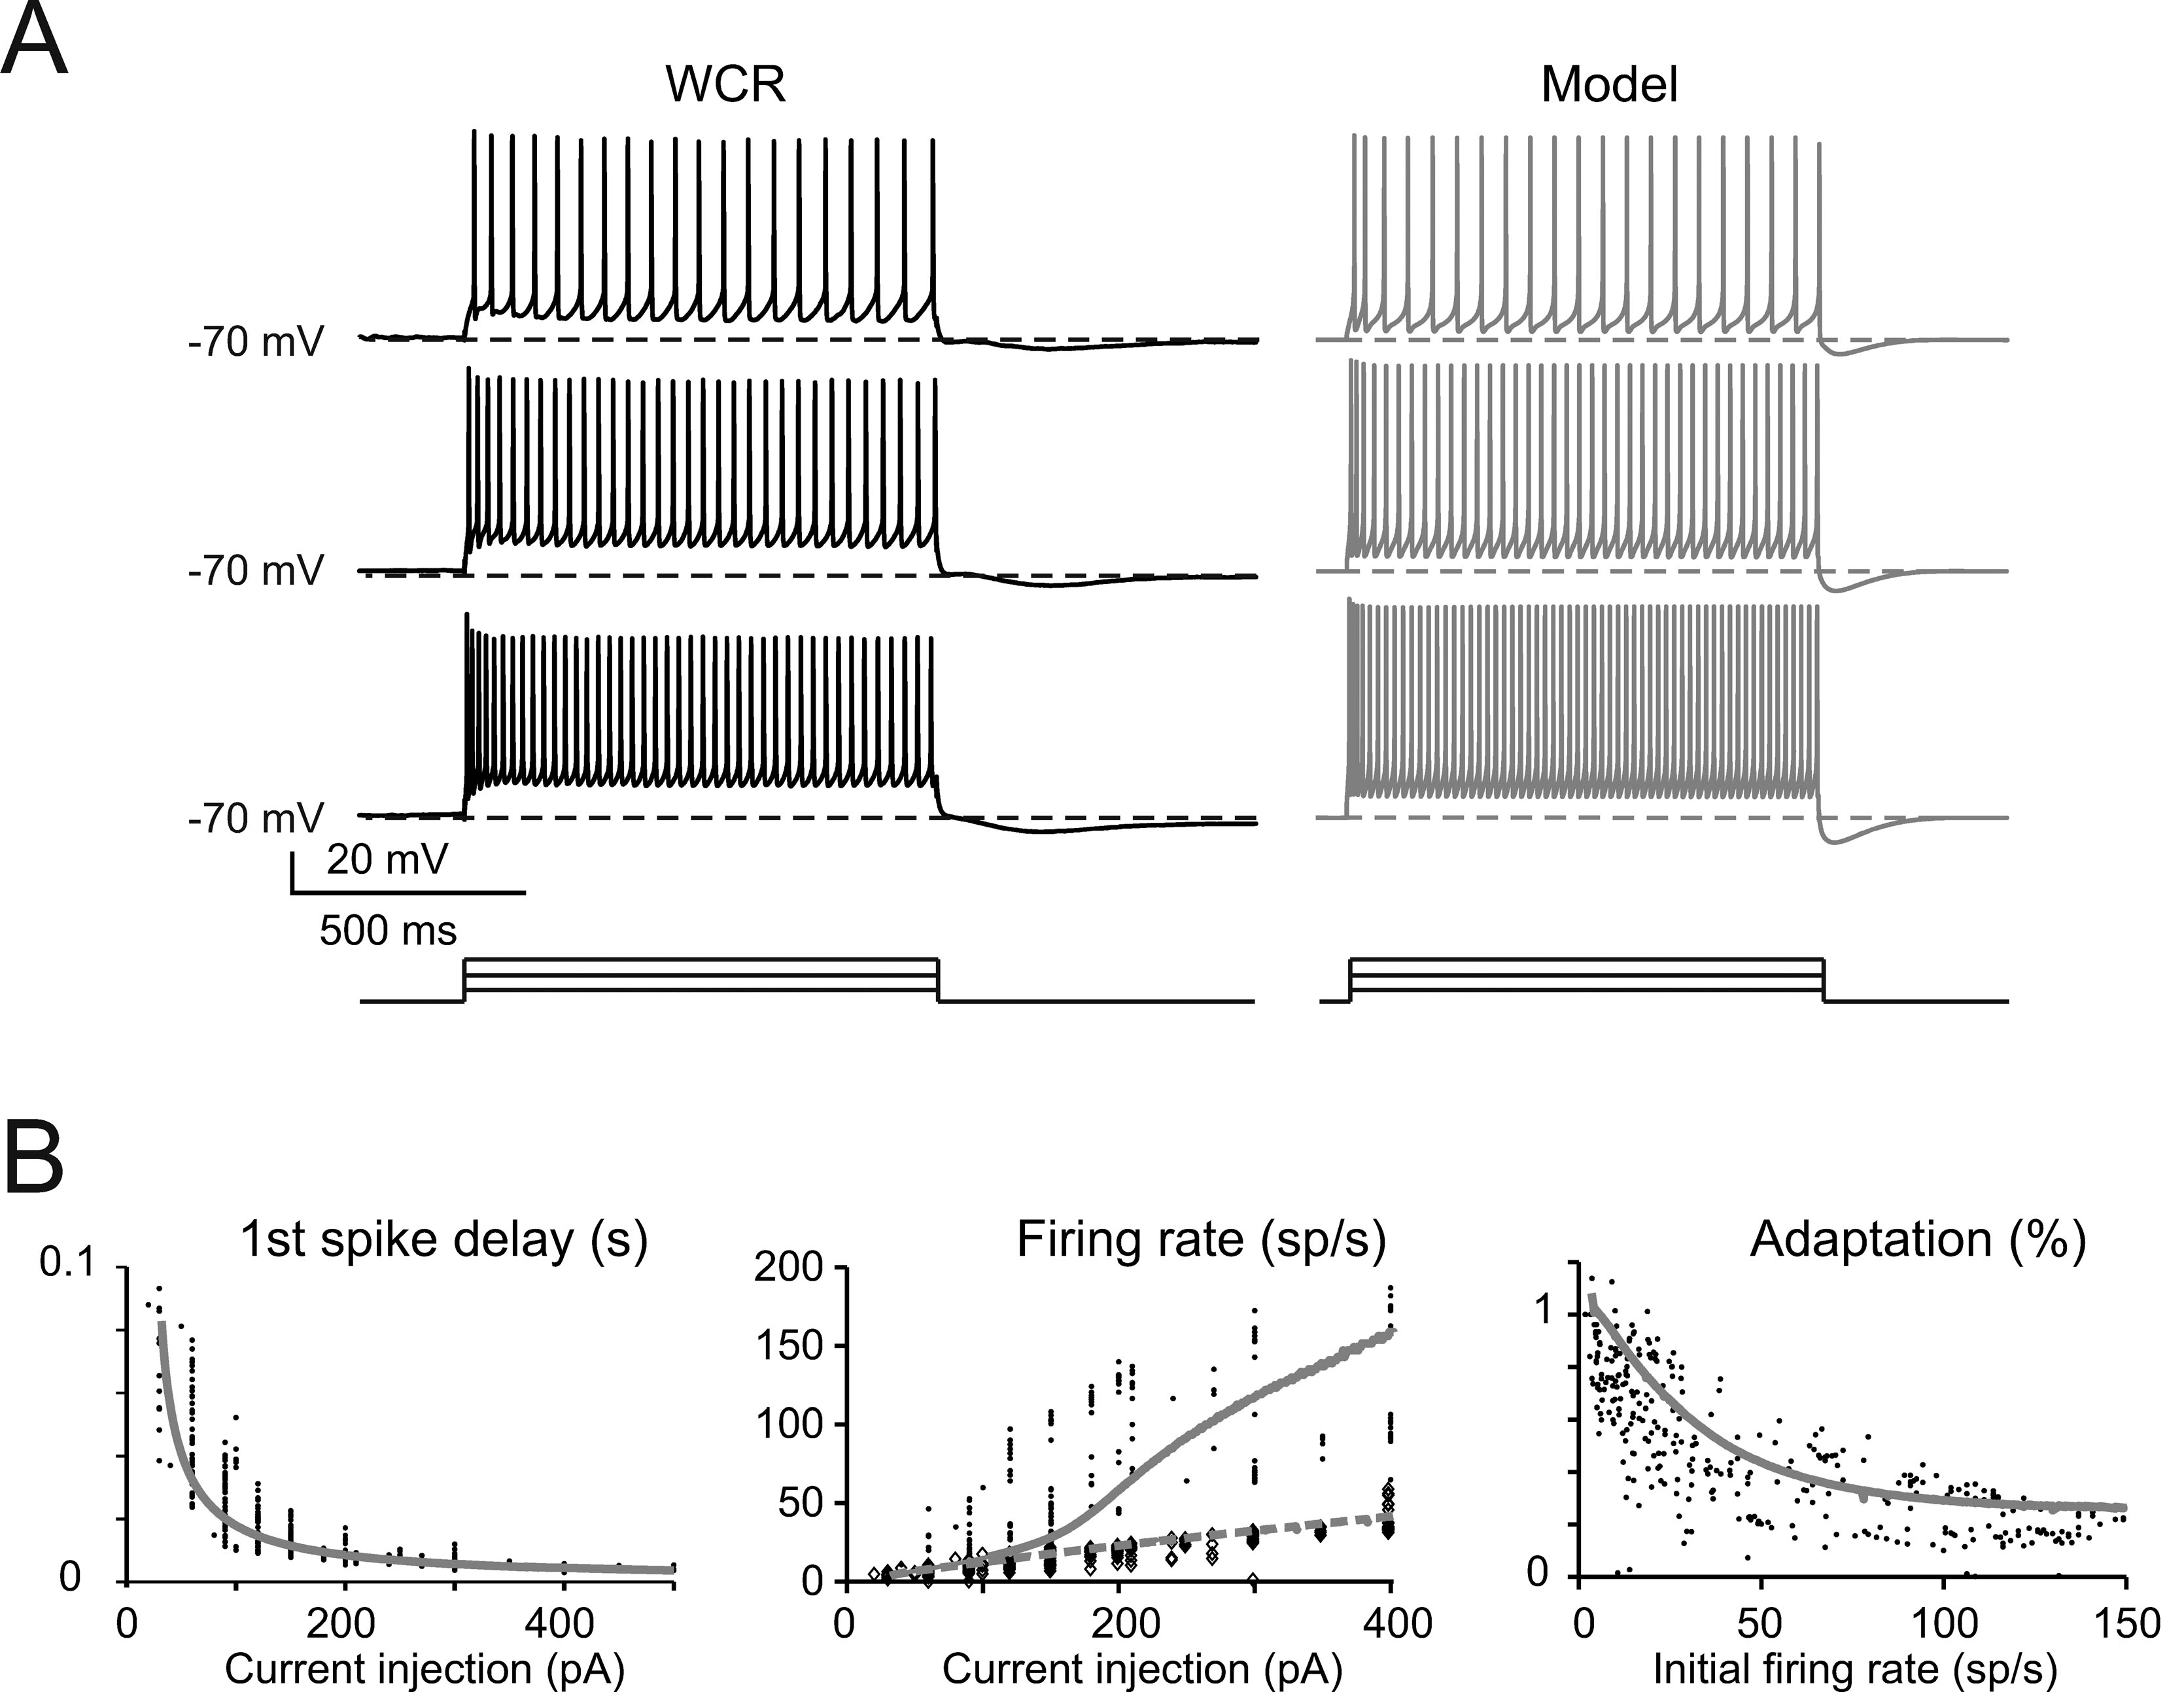
Figure 4. The response to depolarization. (A) The traces taken from a WCR in a Golgi cell show that firing frequency and adaptation increase with the intensity of current injection (from top to bottom: 150, 250, 350 pA). Simulations show that the model could faithfully reproduce this behavior (gray traces). Both the real cell and the model were held at −70 mV by injecting a hyperpolarizing current to prevent spontaneous firing (the step-current protocol is shown at the bottom). (B) In the plots, the response of the model (solid gray line) to current injection is compared to the data collected in experimental recordings (dots; n = 10 Golgi cells). Simulations (gray lines) show that the model could appropriately fit the experimental measurements of:
- first spike delay versus injected current (left: p > 0.1, t-test)
- instantaneous and steady-state frequency (the inverse of the first and last ISI, experimental data correspond to black dots and diamonds, modeling data correspond to solid and dashed gray lines, respectively) versus injected current (middle plot: p > 0.1, t-test)
- the adaptation factor (last ISI∕first ISI) versus initial firing rate (p > 0.9, t-test).
Since the inspection of data plots in Figures 1 –4 did not allow to discern subclasses of Golgi cells on the basis of pacemaking frequency, ISI shape, rebound excitation or discharge frequency, a “canonical” model was generated to simulate the average electrophysiological behavior. The model was able to quantitatively reproduce all the properties summarized above, as demonstrated in Figures 1 –4 . The average pacemaker frequency coincided with the mode of the experimental data distribution, and model predictions about spike shape, inward rectification, rebound excitation, firing delay, and frequency adaptation during depolarization fell within the experimental data distributions with p > 0.12 (t-test). It should be noted that the AHP at the end of a depolarization-induced discharge deviated from the shape observed in neurons (Figure 4 A) suggesting that the model does not completely represent the Ca2+ dynamics developing over longer time-scales. This is, however, a minor problem in the present context, since the physiological implications of AHP are considered in response to short depolarization and the model could indeed precisely predict the subsequent silent pause (see Solinas et al., 2007).
Testing the model versus pharmacological challenges
The adequacy of the model in terms of intrinsic mechanisms was further tested by comparison with pharmacological observations using specific ionic channel blockers (cf. Forti et al., 2006 ). A 50% I h reduction, simulating sub-maximal block by ZD7288, reduced the pacemaker frequency (73% of control) and slowed down the ISI trajectory (Figure 5 A), similar to in vitro observations. As expected from their gating properties reported in vitro, 50% I Na-p reduction arrested pacemaking (Figure 5 A). The action of retigabine, an agonist of M-type currents which reduced firing frequency and altered the ISI during current injection in vitro, was matched by a −6.5 mV shift in I K-slow activation (Tatulian et al., 2001 ) (Figure 5 B). Finally, since the most evident effect of the SK channel blocker apamin was to reduce pacemaker regularity, the role of I K-AHP in the model was investigated after adding noise, to reproduce the standard deviation of membrane potential during the ISI (Figure 5 C; see Methods for details). The simulated pacemaking thus acquired a slight irregularity (CV ISI = 0.16), which was markedly increased by I K-AHP blockage (CV ISI = 0.36), as observed in the experiments in vitro. It is thus probable that the AHP, by temporarily displacing membrane potential below threshold, prevents the perturbing action of stochastic channel gating and spontaneous synaptic currents in the subthreshold regime. In summary, simulations show that the model predictions for the effects of I Na-p, I k-slow, I k-AHP, and I h on pacemaking agree with pharmacological analysis in vitro.
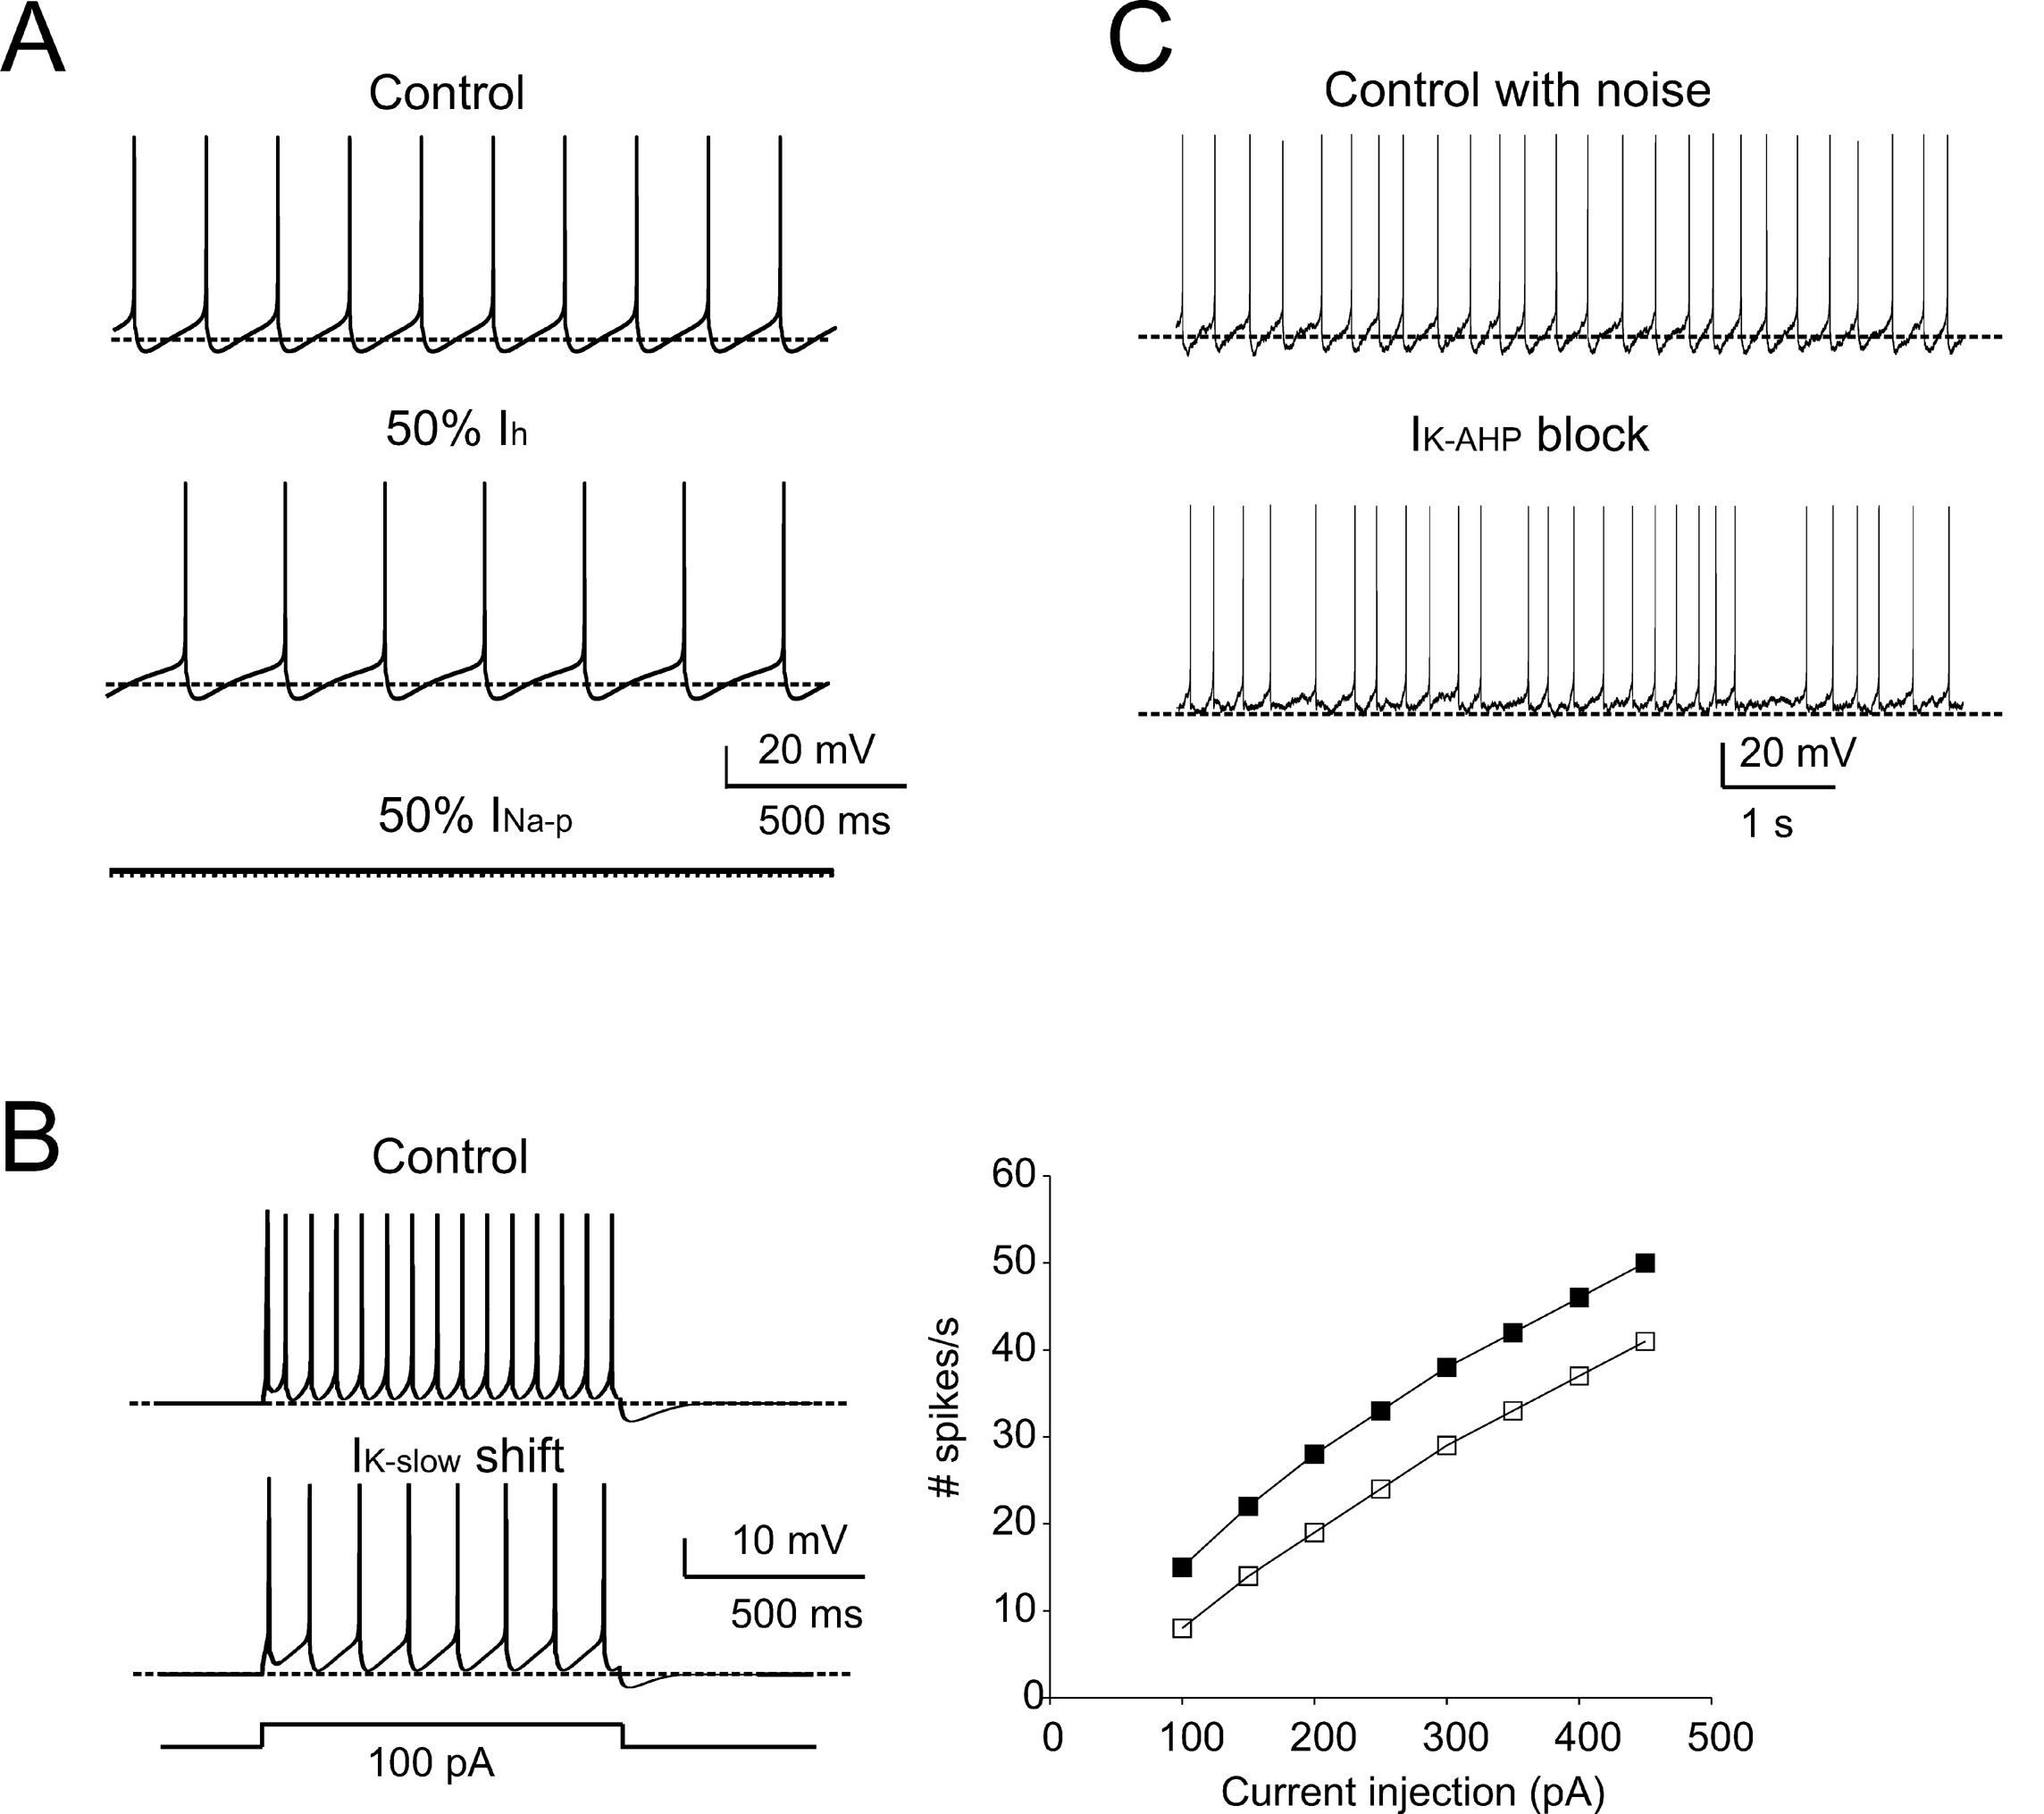
Figure 5. Pharmacology of pacemaking. The model predicted the effect of ionic channel blockage (Forti et al., 2006 ) on autorhythmic firing. (A) In these simulations, the control trace shows autorhythmic firing (same as in Figure 1 A, firing rate 5 Hz, CVISI = 0.0027), a 50% block of Ih (mimicking the effect of ZD7288) reduces the pacemaker frequency by 27%, and the partial block of INa-p prevents spontaneous firing. (B) In order to simulate retigabine effects on IK-slow reported by Forti et al., (2006) , IK-slow was modified by shifting its activation by −6.5 mV (from Tatulian et al., 2001 ). The model was then stimulated with 1-second current steps (100 pA) from -70 mV. The traces show that, following IK-slow changes, the model fires less action potentials than in control. The model response to current injection is shown for control (full squares) and IK-slow -shift conditions (empty squares). (C) The effect of membrane noise on firing was simulated by injecting Gaussian noise into the canonical model. In control conditions, the mean firing rate was unaffected, but CVISI was increased from 0.002 to 0.16. When IK-AHP was blocked, the mean firing rate did not significantly change (from 5 to 5.7 Hz, p > 0.05, t-test). Conversely, CVISI changed from 0.16 to 0.36 (cf. Forti et al., 2006 ). The traces show that pacemaker irregularity is markedly increased by IK-AHP blockage (the dashed lines indicate the −70 mV level).
Model currents and intracellular calcium
The model currents and intracellular calcium changes during Golgi cell activity are shown in Figure 6 . The currents dominating the ISI during pacemaking were small (≤5%) compared to those generating the spikes. During the ISI, I Na-p showed a progressive increase, while I h remained almost constant. I k-AHP was driven by the spike, arose rapidly and then decreased toward the middle of the ISI. I k-slow was driven by depolarization in the second part of the ISI and showed a progressive increase. It should be noted that I Ca-HVA activated during the spike upstroke. During pacemaking, intracellular Ca2+ returned to basal levels within an ISI, but during high-frequency bursts Ca2+ could accumulate and thereby intensify and protract I K-AHP activation. Spike-frequency adaptation during discharge elicited by current injection was caused by I K-AHP and I K-slow. Rebound excitation was determined by I h deactivation and intensified by I Ca-LVA. Certain currents accurately regulated the responses to current injection (Figure 7 ). During depolarization, I K-A delayed the first spike and I Na-r enhanced the initial doublet. As well as during depolarization, I K-A contributed to regulate the delay of rebound excitation (data not shown).
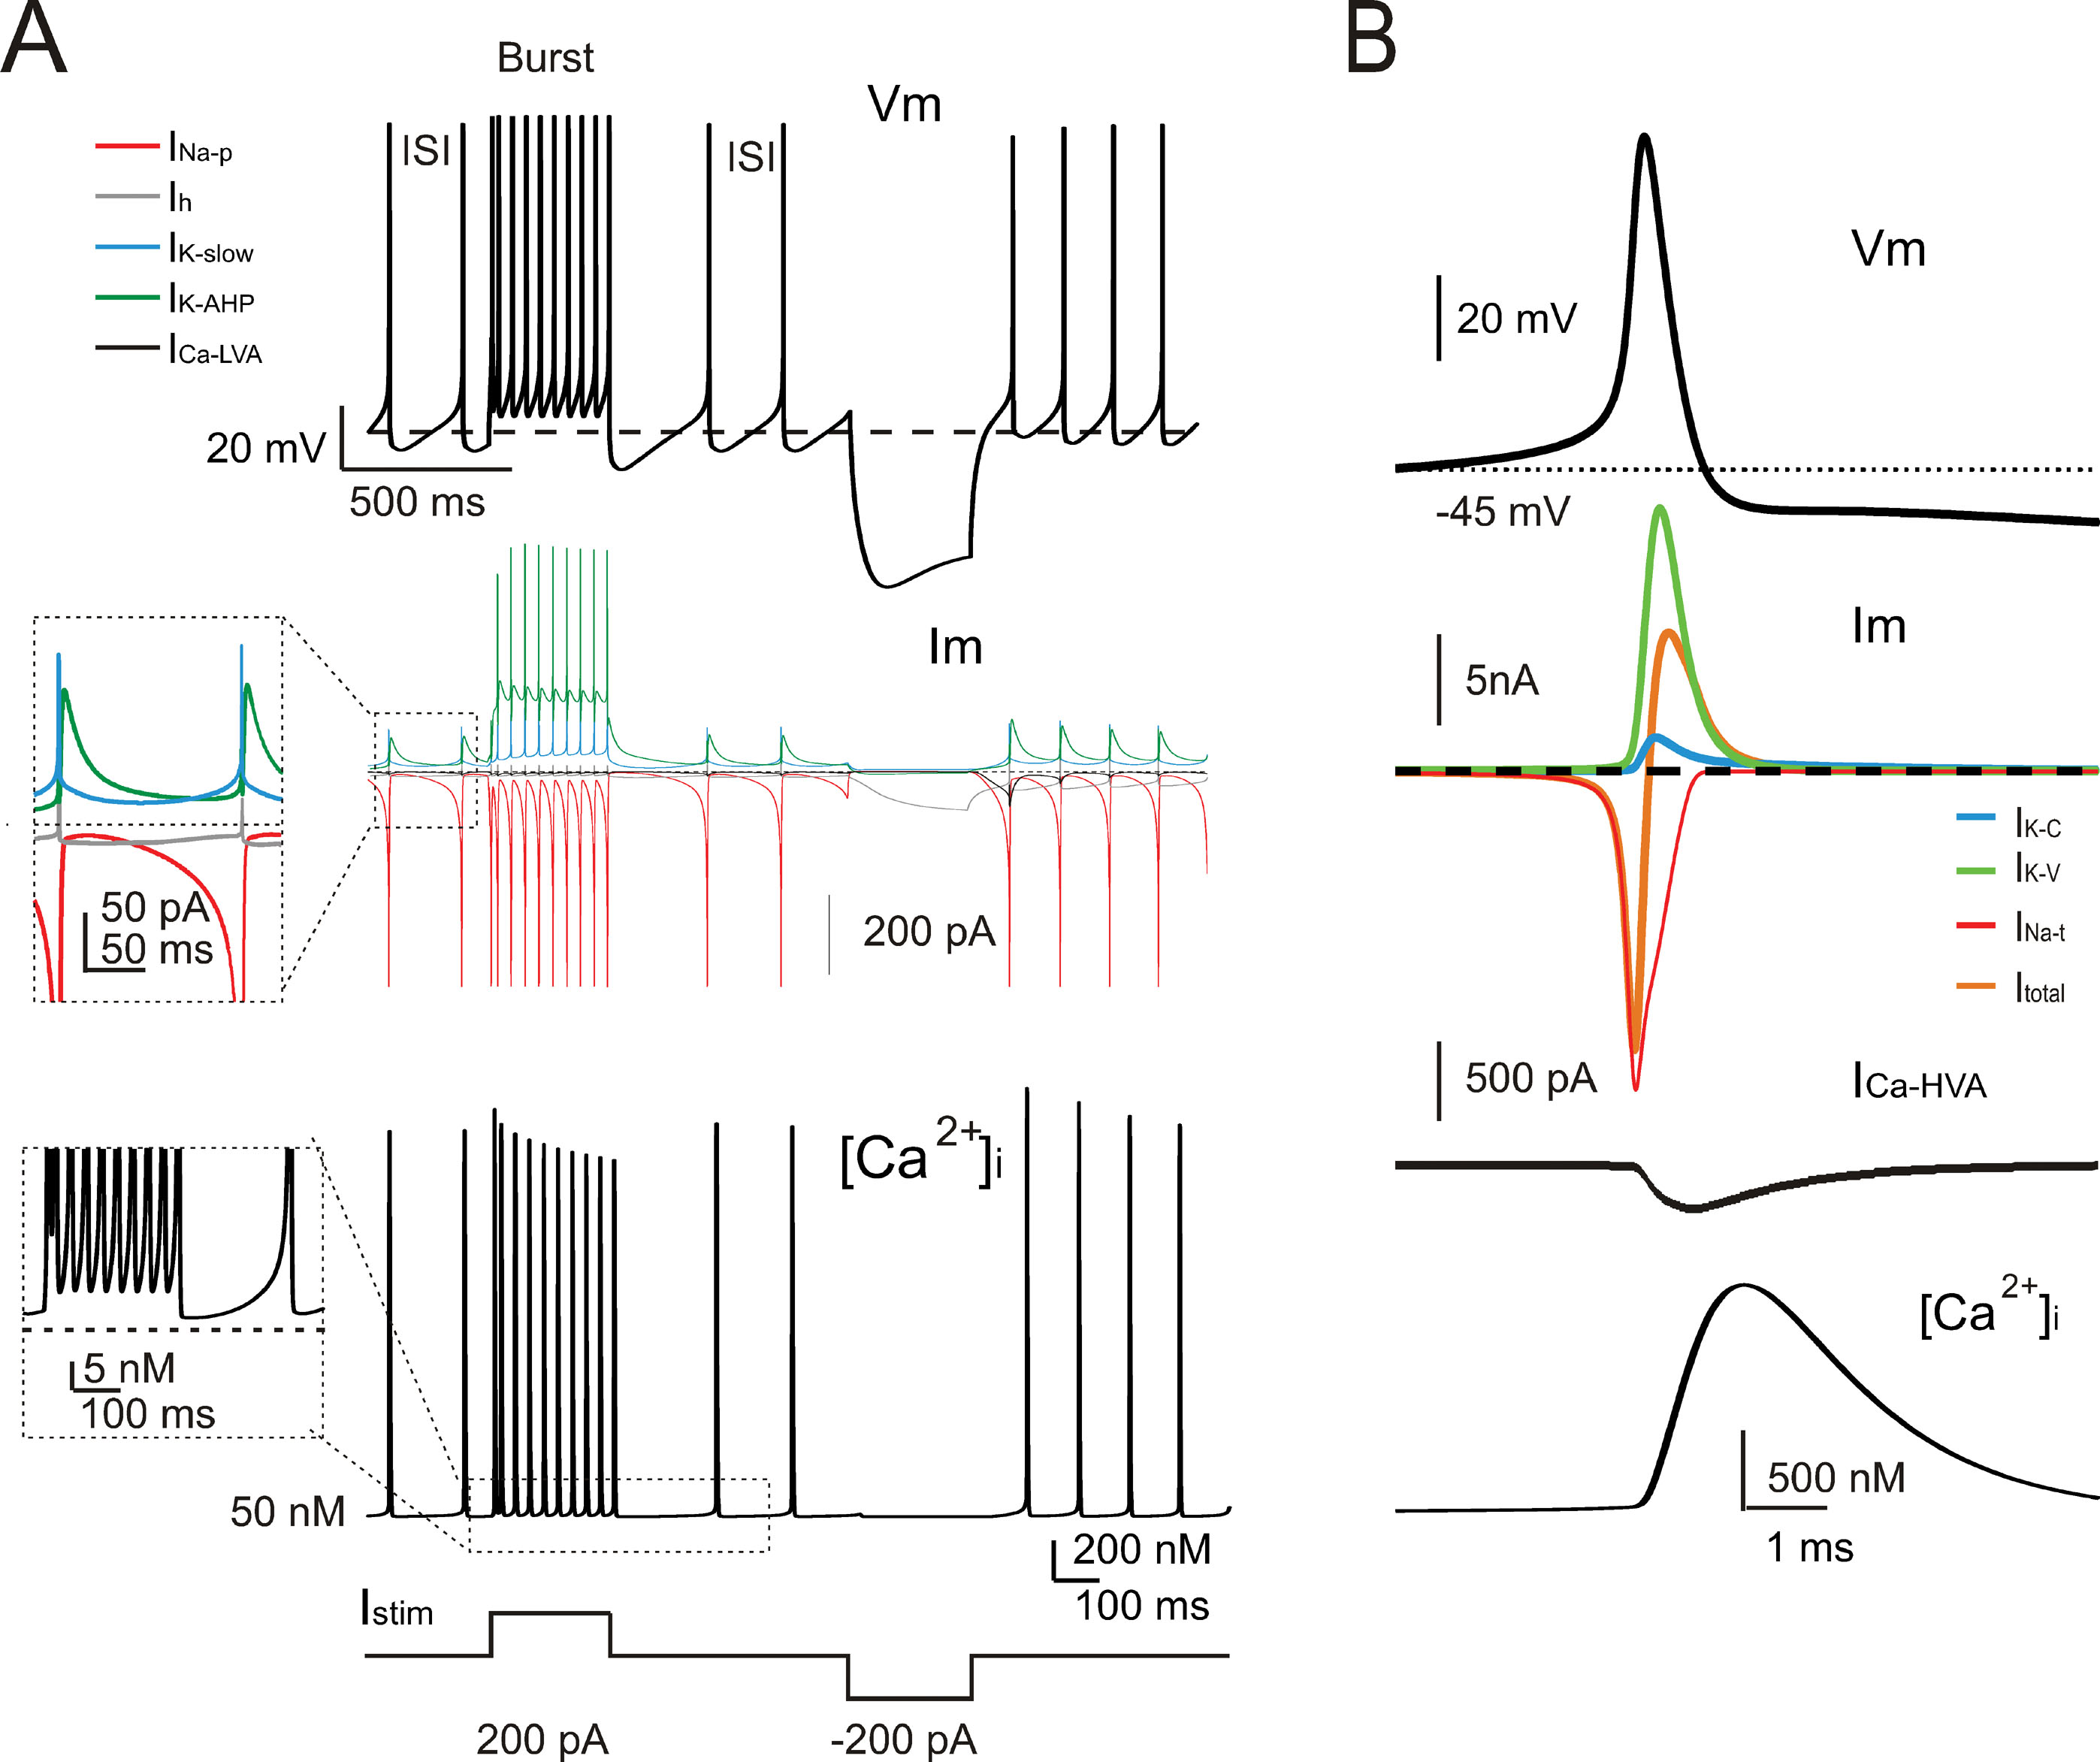
Figure 6. Ionic currents and intracellular calcium changes. (A) The traces show the model response during alternated phases of pacemaking, depolarization, and hyperpolarization (the injected current is shown at the bottom). The voltage trace (Vm) shows the membrane potential change. The current traces (Im) show the ionic currents in the ISI. It should be noted that INa-p, IK-AHP, and IKslow, but not Ih, show a marked voltage-dependent modulation during the pacemaker cycle. The calcium ([Ca2+]i ) trace shows that [Ca2+]i is promptly reset to its background level of 50 nM following a transient increase during the spike. The inset shows the [Ca2+]i accumulation in coincidence with the high-frequency bursts and spike frequency adaptation. (B) The traces enlarge the model response during a single action potential (Vm). The ionic currents primarily responsible for action potential generation (Im) and the Ca2+currents (ICa-HVA) are shown along with the [Ca 2+] i transient. Note the delayed activation of the repolarizing mechanisms and of the slow time course of [Ca2+]i transient. INa-t, IK-C, and IK-V are much larger than currents governing the ISI (cf. panel A).
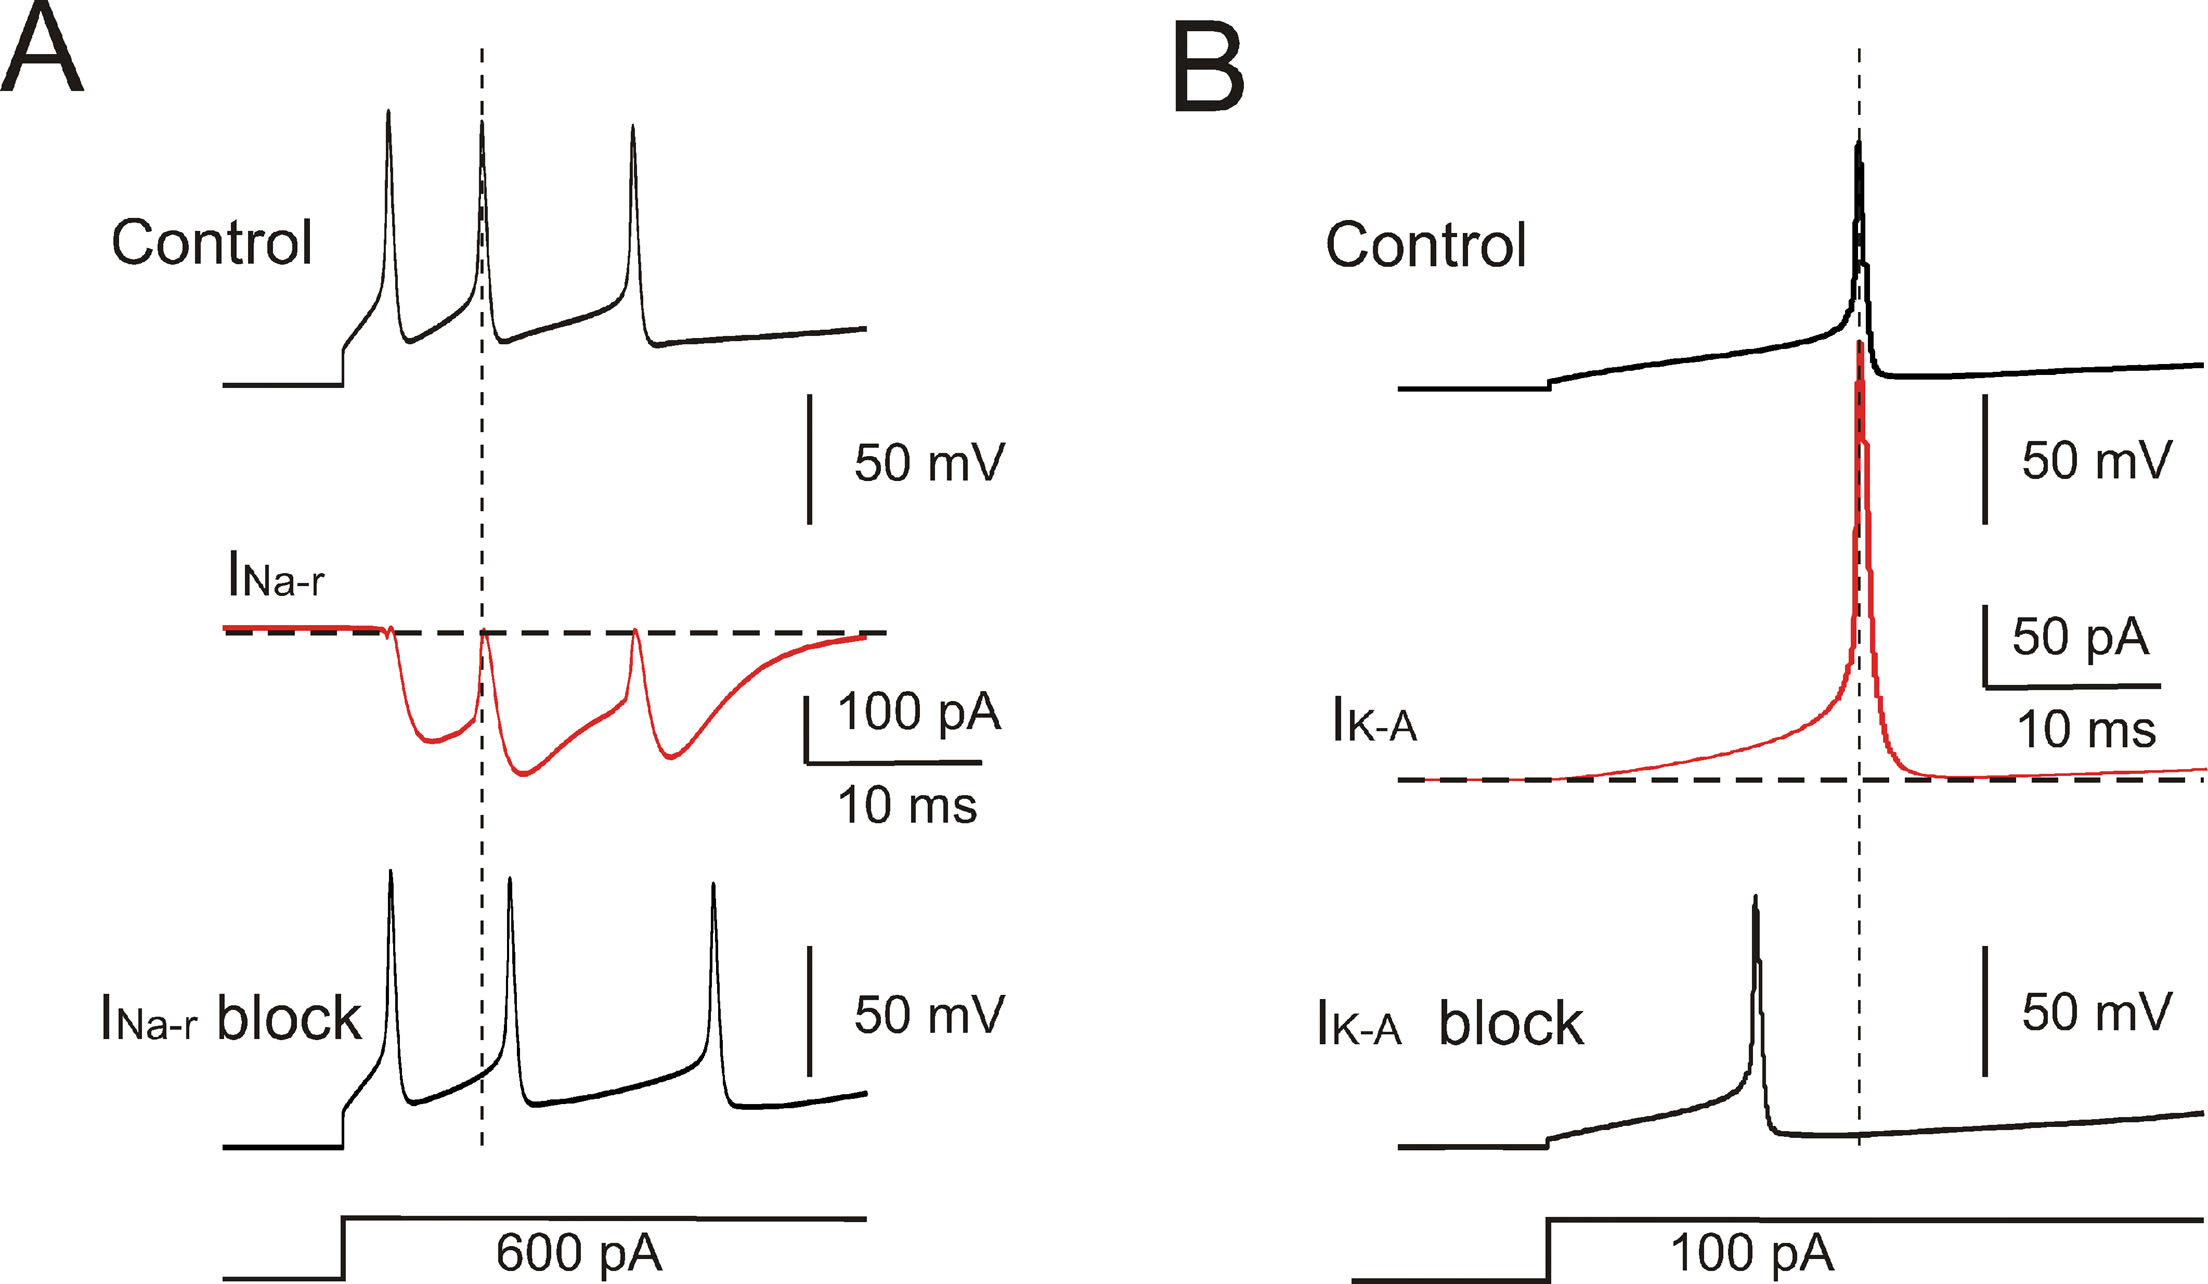
Figure 7. Ionic currents controlling response intensity and latency. (A) Effect of INa-r on the first two spikes elicited by a depolarizing current step. The model was hyperpolarized to −70 mV by tonic current injection and a step current injection of 600 pA elicited an initial firing rate of 200 Hz. INa-r block (middle trace) increased the first ISI (2 ms increase) reducing the initial firing rate to 142 Hz. INa-r did not affect the 1st spike latency but its activation after the 1st spike could accelerate membrane depolarization and generation of the 2nd spike. (B) The model was hyperpolarized to −70 mV by tonic current injection and then injected with a step current of 100 pA. The 1st spike latency was 18 ms and was reduced by IKA blockage to 12 ms. The lower traces show the stimulus protocols.
Robustness and the canonical neuron
The simulations we have presented till now lead to two conclusions. (i) Although the currents introduced into the model (on the basis of experimental observations) controlled characteristic aspects of electroresponsiveness (see also Solinas et al., 2007), they could have multiple and redundant effects. (ii) The canonical Golgi cell model is one that succeeds in approximating the behavior of the experimental population of Golgi cells. The robustness of this model should be tested by checking its ability to reproduce the variability of behaviors measured in different cells when varying model parameters. We therefore measured robustness of the model by assessing its ability to maintain typical Golgi cell characteristics when key parameters were varied. This aspect is shown in Figure 8 , in which certain current densities or the time constant of [Ca2+]i are modified in turn. The analysis in Figure 8 confirms the relative importance of different currents in generating Golgi cell behavior reported in Figure 5 . The model was quite sensitive to changes in I Na-p conductance, followed by changes in I K-slow. Calcium dynamics, determined by the conductance of I Ca-HVA and the decay constant β Ca were also relatively important, while the model was quite insensitive to changes in I h conductance. An example was presented in Figure 3 , in which some parameters were modified to adapt the canonical model to mimic an individual Golgi cell response in detail. Notice that a more extended robustness assessment (Achard and De Schutter, 2006 ; Druckmann et al., 2007 ) would imply also testing the effect of conjoint variations of free parameters. This is a complex task that may be addressed in future research.
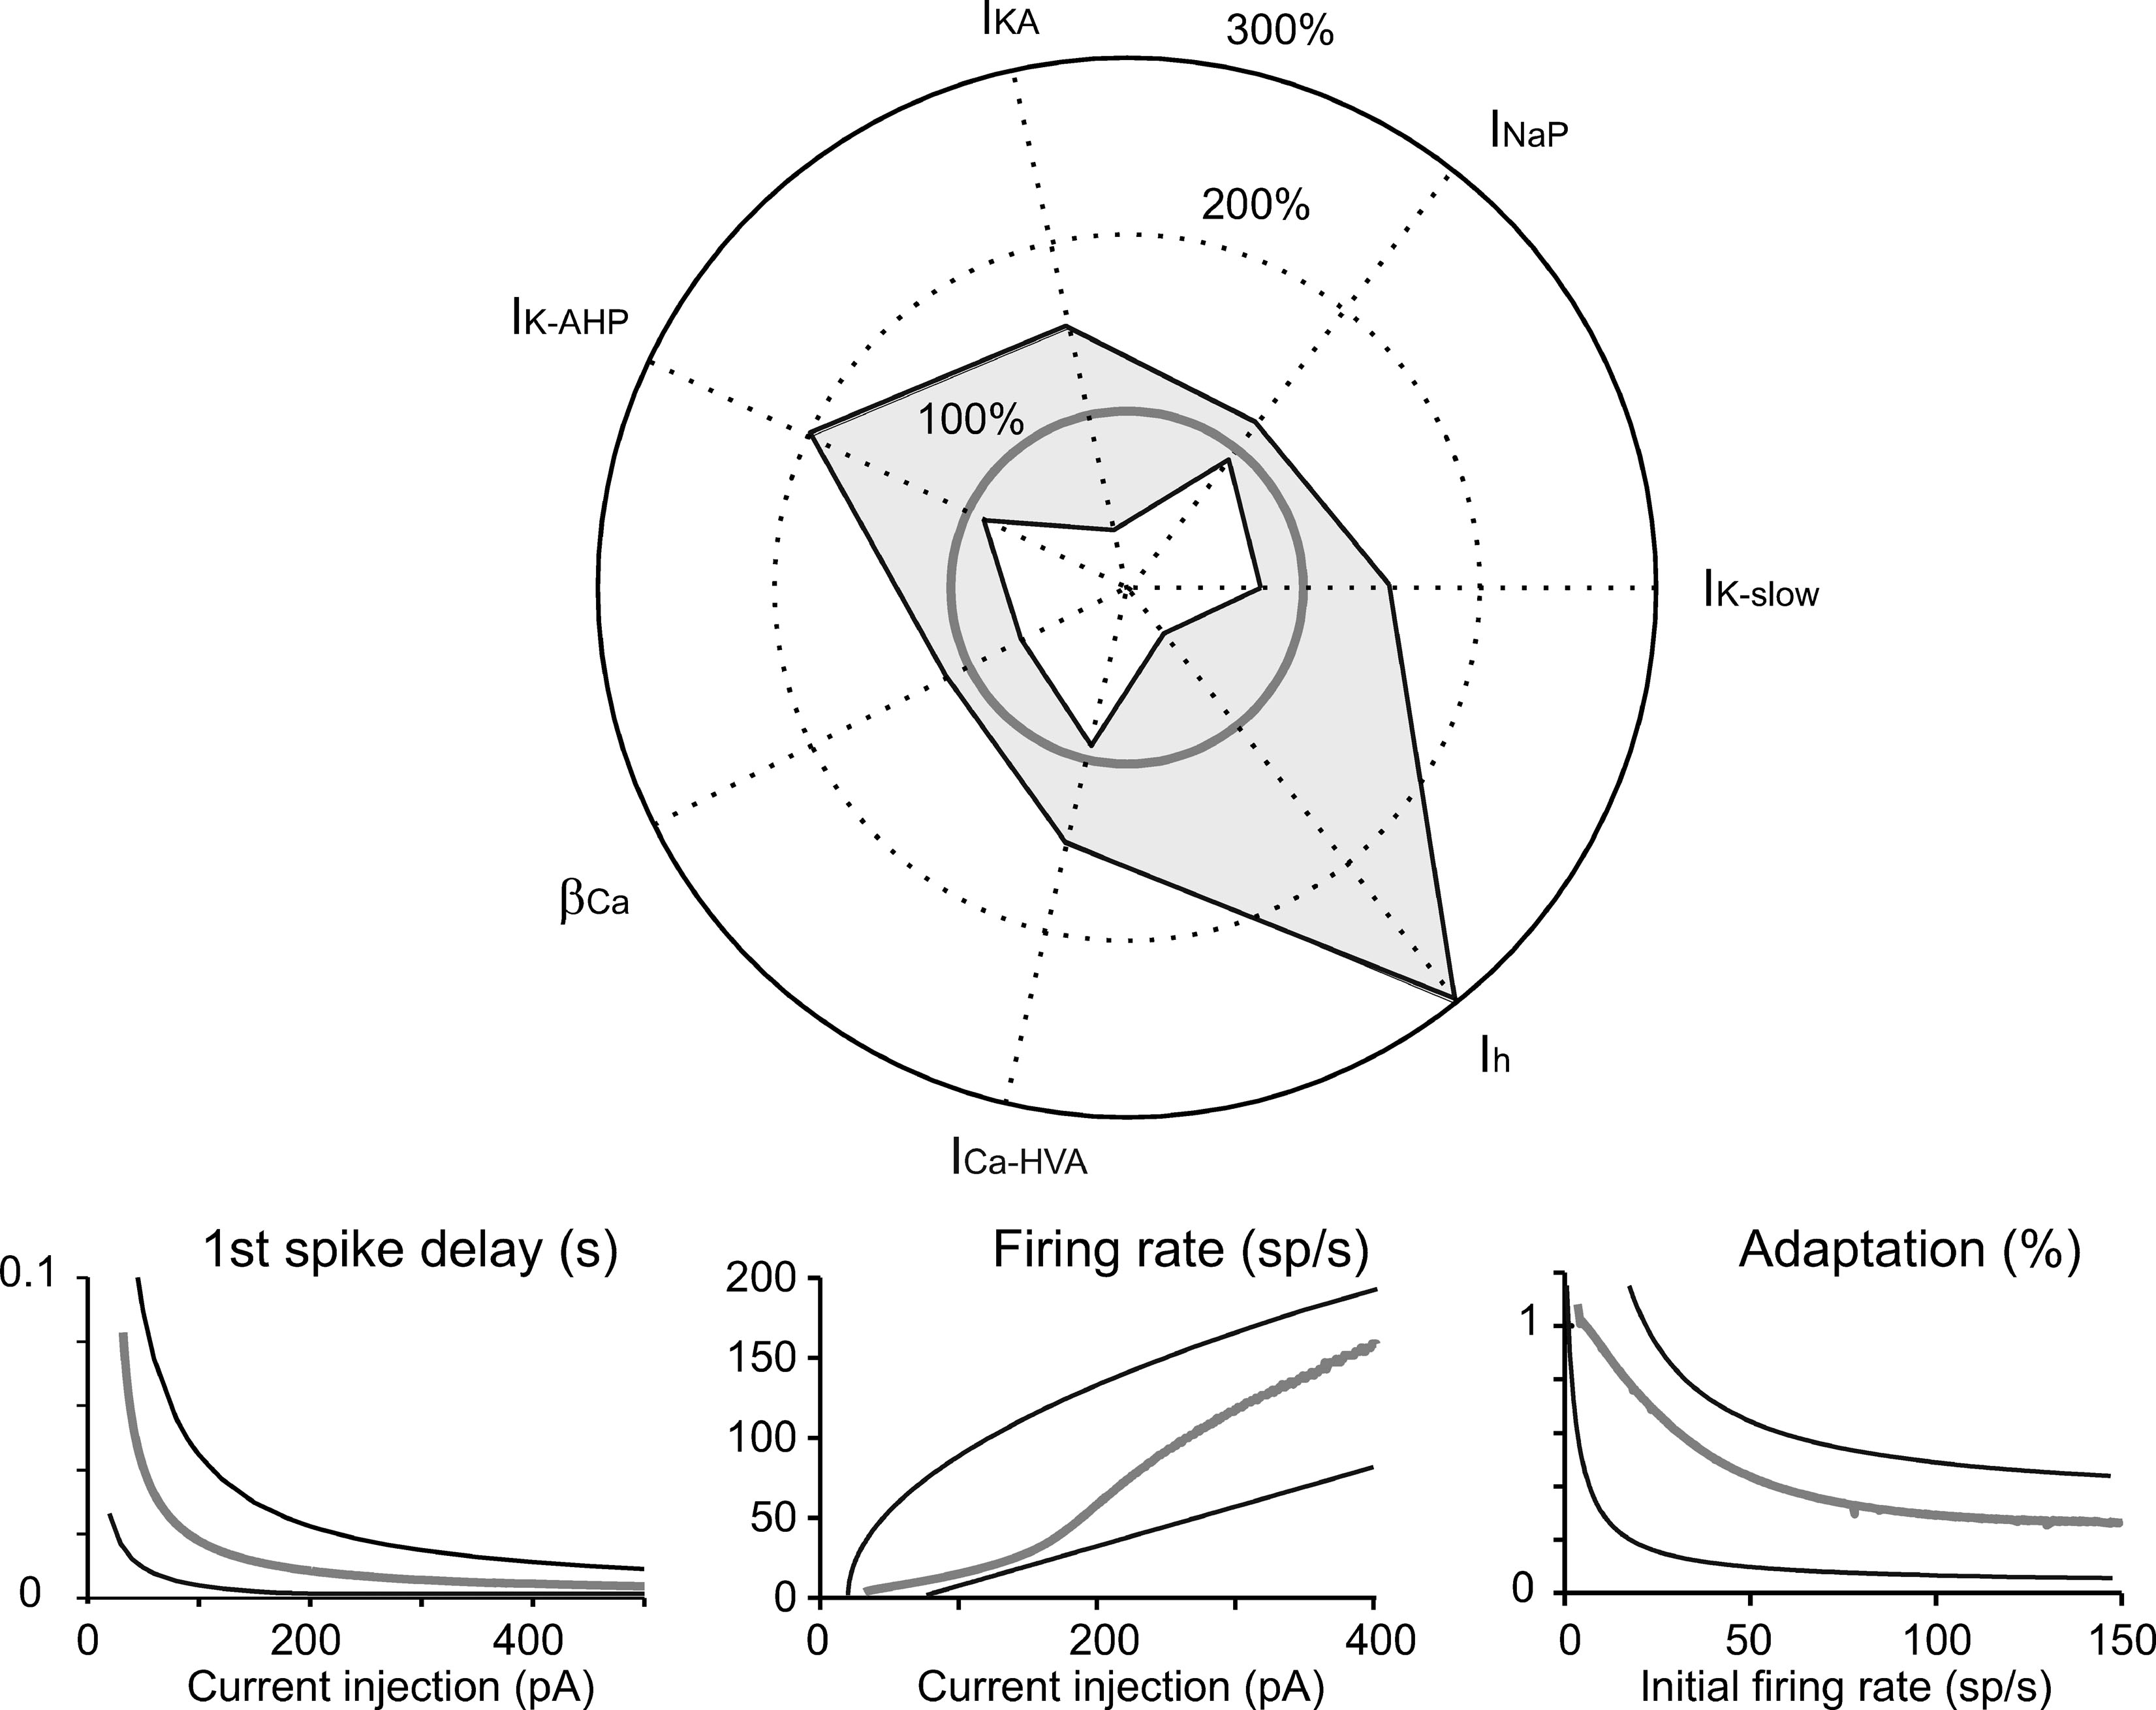
Figure 8. Robustness of the model. Tests of robustness of the model against changes in individual parameters. Polar plot: The maximum conductance of IK-slow, INa-p, IKA, IK-AHP, ICa-HVA, and Ih, as well as βCa, were modified in turn. The changes covered (in 30 steps) the range from total block (center of the polar plot) to threefold increase (outer solid circle) in the canonical model value (thick gray line). Model simulations were obtained using the protocols described in Figures 2 –4 . The thin black lines delimiting the light gray area show the minimum and maximum parameter changes (percentage of canonical model values), which maintained the model within the boundaries of Golgi cell characteristic response. Lower panels: Results were considered to conform to Golgi cell behavior on the base of five criteria. (i) The pacemaker frequency had to fall in the range 0.5–9 Hz. (ii) The first spike latency triggered by the rebound excitation had to fall in the range 30–100 ms. (iii–v) The response to current injection had to show first spike latency, initial firing rate, and spike frequency adaptation within the boundaries reported in the panels. Thin black lines are boundaries derived from the envelope of data points in Figure 4 B and the thick gray line shows the canonical model behavior.
Coupling of subthreshold membrane potential oscillations with spikes
Given the good response of the model over a wide range of experimental behaviors, it could be used to predict the mechanism of pacemaking. In several neurons (e.g., in amygdaloid neurons (Papae and Driesang, 1998 ), in enthorinal cortex neurons (Alonso and Llinás, 1989 ; Dickson et al., 2000a ), or in inferior olivary neurons (Llinás and Yarom, 1986 )) pacemaking is clearly related to subthreshold membrane potential oscillations. However, these could not be isolated in WCRs by gradually hyperpolarizing Golgi cells with steady currents. This situation clearly resembles that observed in subthalamic neurons, in which pacemaking was extremely regular and subthreshold oscillations could not be decoupled from spikes (Bevan and Wilson, 1999 ). In the model, after switching-off spike-related mechanisms (i.e., I Na-t, I K-V, and I K-C), subthreshold oscillations (30 mV peak-to-peak centered around threshold) emerged at nearly the same frequency (5 vs. 4.46 Hz) of spontaneous firing (Figure 9 A). Several putative mechanisms might be responsible for these subthreshold oscillations in Golgi cells, exploiting the specific properties of the two depolarizing currents, I Na-p and I h, and of the two slow repolarizing currents, I K-slow and I K-AHP. The role of each of these currents was considered in turn.
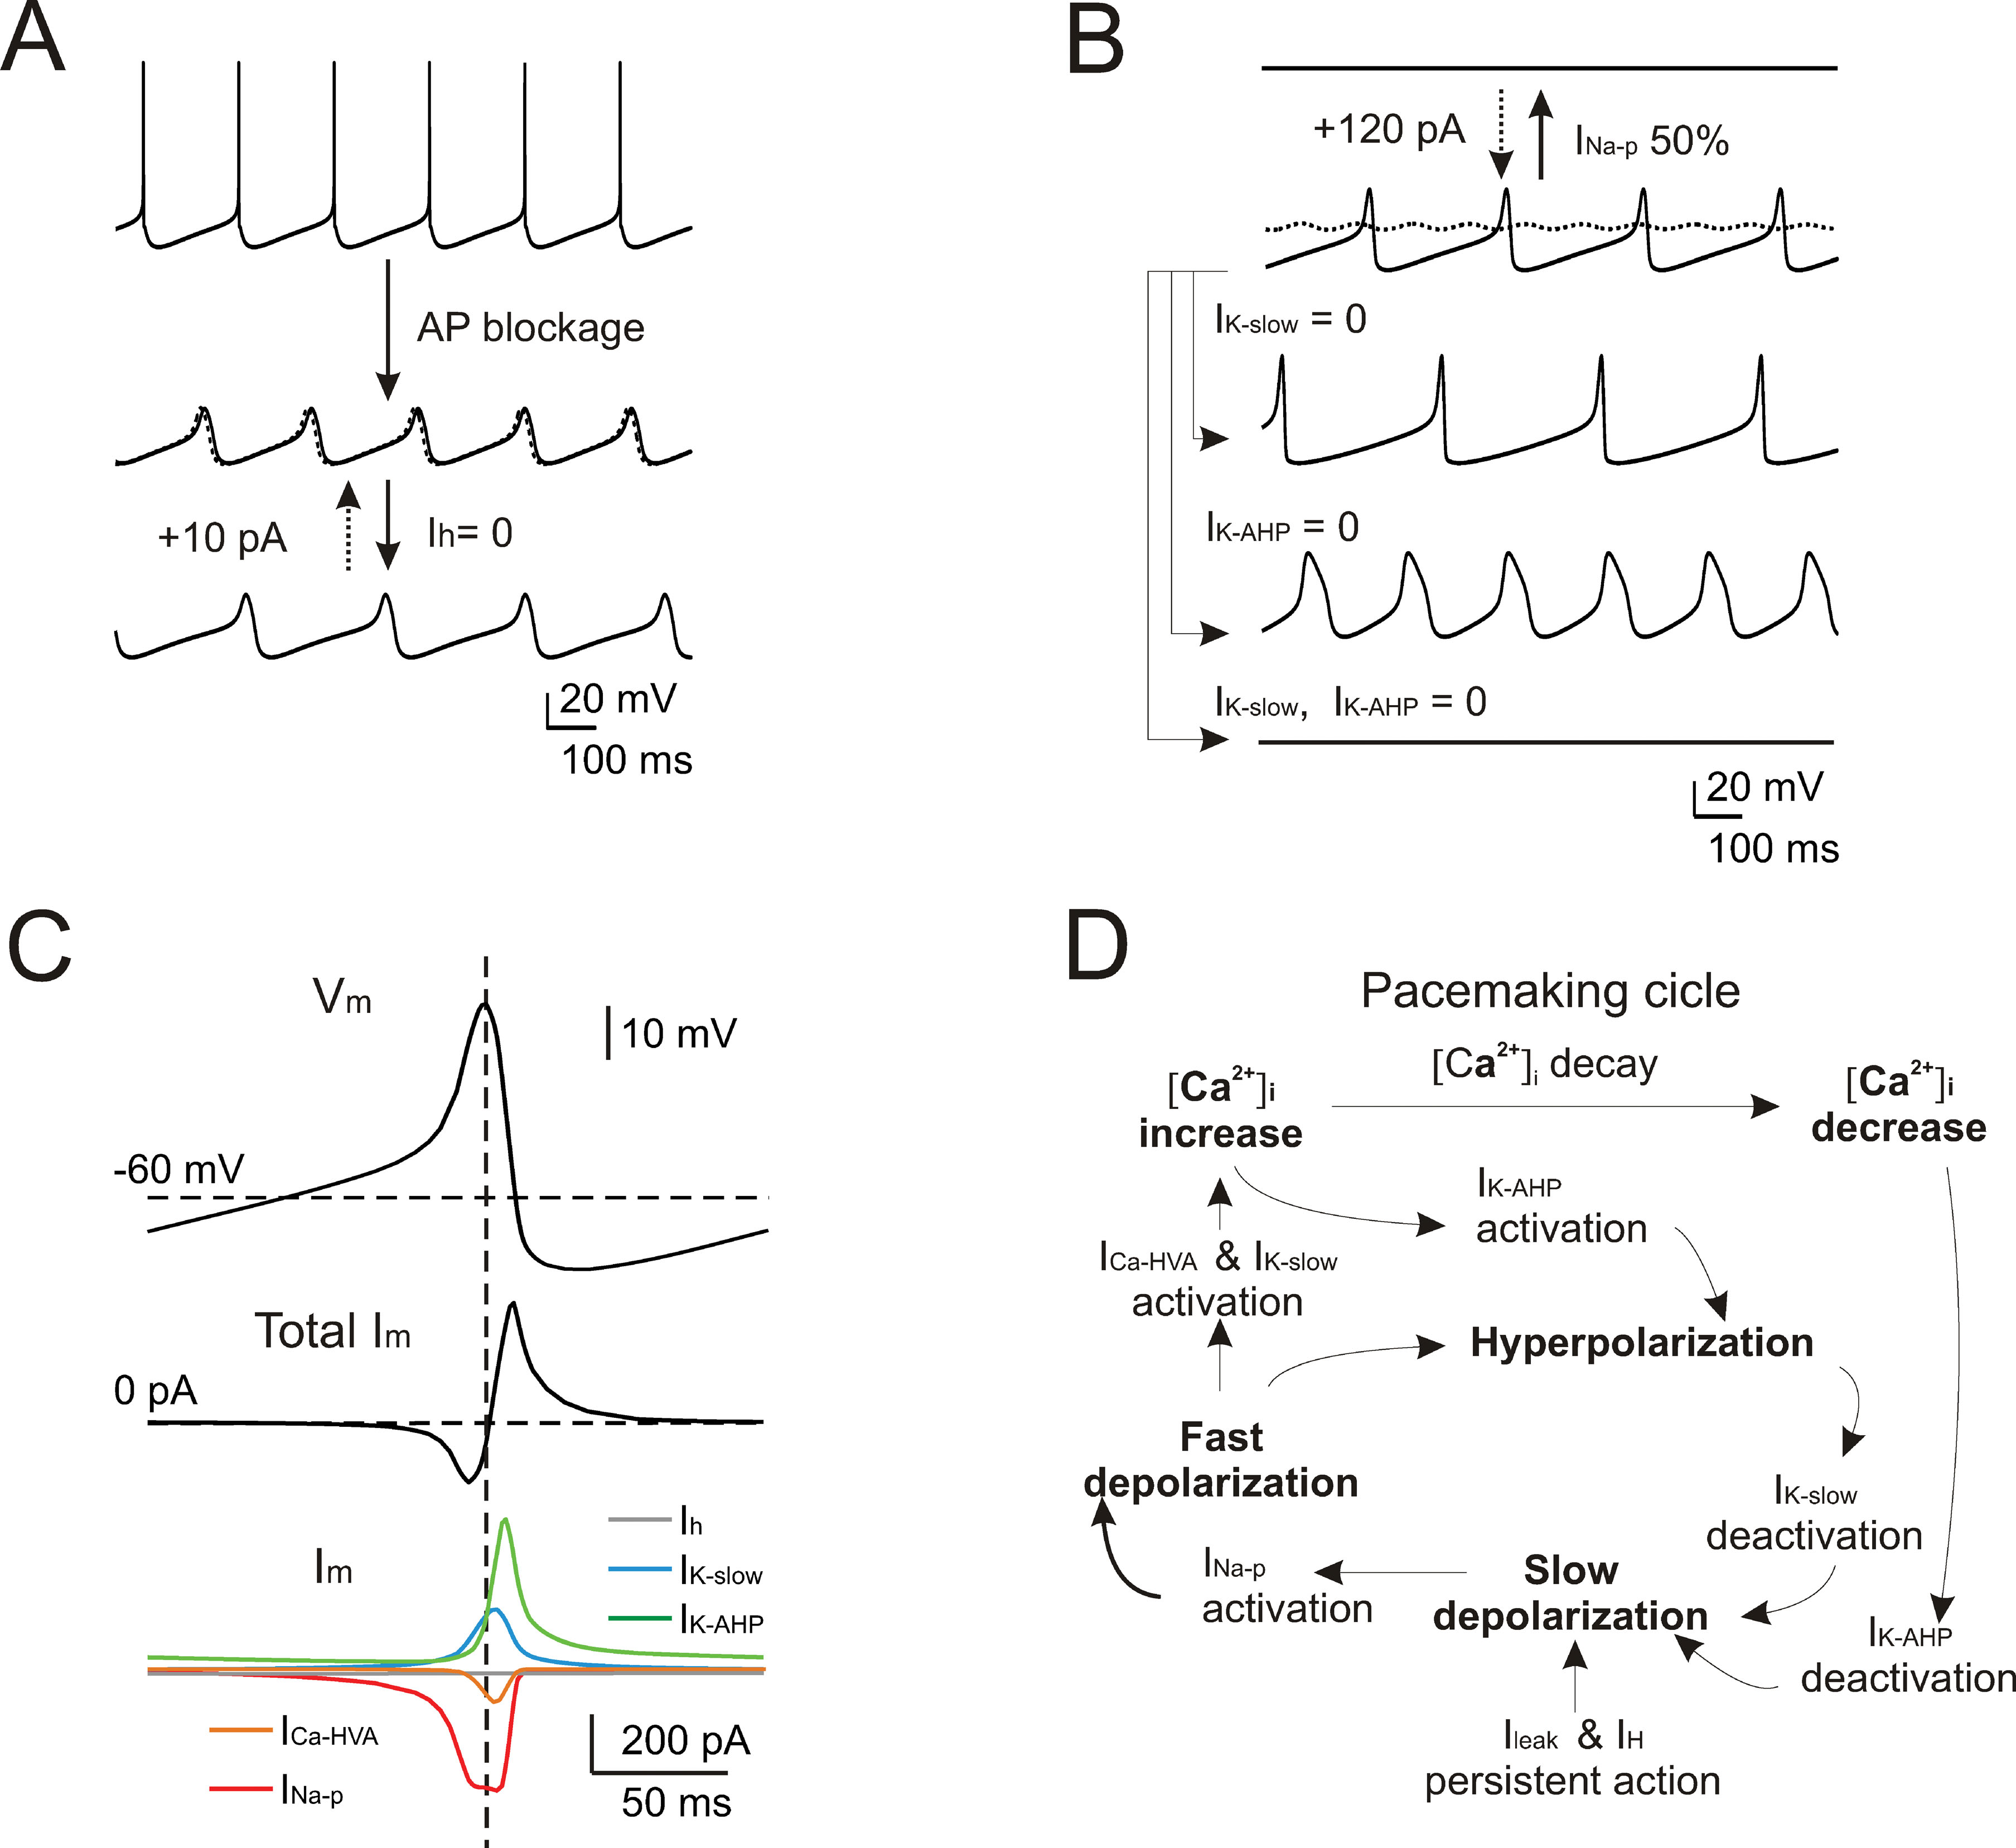
Figure 9. Subthreshold oscillations and spike coupling. In order to investigate the mechanisms of subthreshold oscillations, simulations were performed after blocking the currents generating the spike (INa-t, IK-V, and IK-C ). (A) The simulated traces show that preventing action potentials lead to the emergence of subthreshold pacemaker oscillations slightly slower than in the spiking regime (4.46 vs. 5 Hz). Upon 100% Ih blockage, the oscillation frequency is reduced (3.3 Hz) but the effect is reversed with the injection of a tonic depolarizing current (dashed trace). (B) The simulated traces (all voltage-dependent currents blocked except for INa-p, IK-AHP, ICa-HVA, and IK-slow) show that subthreshold pacemaker oscillations are interrupted by blocking INa-p and that only marginal recovery is obtained by injecting a tonic depolarizing current (dashed trace). Either blocking IK-AHP or IK-slow deforms the oscillation trajectory, while their simultaneous block causes the oscillation to cease. (C) The voltage and current traces are shown as a function of time during a full oscillation cycle (all voltage-dependent currents blocked except for INa-p, IK-AHP, ICa-HVA, and IK-slow ). (D) Schematic showing the cascade of processes that generate pacemaking in the Golgi model.
Blocking either I Na-p or I h modified the subthreshold oscillations although in quite a different way. By blocking I h, the oscillation slowed down (from 4.46 to 3.3 Hz) and the original frequency could be restored by injecting a tonic depolarizing current (Figure 9 A). Conversely, following 50% I Na-p reduction, the oscillation disappeared. In this case, a large tonic current injection compensated the partial block only to a very small degree (Figure 9 B). Concerning the repolarizing feedback, blocking either I K-slow or I K-AHP increased oscillation amplitude but with opposite effects on frequency (I K-slow block reducing it to 2.9 Hz and I K-AHP block increasing it to 4.5 Hz), while blocking both I K-slow and I K-AHP led to a cessation of oscillation (Figure 9 B).
The results reported in Figure 9 A, B suggest that I Na-p and I h played distinct roles in Golgi cell subthreshold oscillations. The current plots in Figure 9 C and the phase diagram in Figure 8 D show that I Na-p underwent pronounced modulation during the cycle, while I h did not. Thus, while the brisk I Na-p activation was able to drive the cycle, the slow activation of I h provided a nearly tonic depolarization setting the cell into the appropriate membrane potential range. Concerning feedback repolarization, both I K-slow and I K-AHP, which also showed pronounced dynamics during the cycle (Figure 9 C, D), contributed to the feedback repolarization. The differential action of the two K+ currents on cycle shape and frequency reflected their different voltage dependence and kinetics. It should be noted that the subthreshold oscillation reached potentials normally visited by spikes (about −30 mV, cf. Figure 2 A), so that I K-AHP could be activated causing a rapid and intense repolarization.
In accordance with the pharmacological tests reported in Figure 5 and the mechanisms reported in Figure 6 , simulations shown in Figure 9 suggested that pacemaking was driven by subthreshold oscillations tightly coupled to spikes.
Discussion
In this paper, we show that the theta-frequency pacemaking of cerebellar Golgi cells observed in vitro (Forti et al., 2006 ) can be explained by a computational model based on a mechanistic reconstruction of the underlying ionic processes. The model predicted that pacemaking depended on the actions of four ionic currents, I h, I Na-p, I K-AHP, and I K-slow (Forti et al., 2006 ): I h brought membrane potential into the pacemaker region where the I Na-p∕I K-AHP∕I K-slow interaction generated pacemaking. Moreover, following hyperpolarization, I h and I Ca-LVA caused rebound excitation. In response to a depolarization, I K-A helped setting the delay for spike activation and I Na-r (Afshari et al., 2004 ; Magistretti et al., 2006 ) enhanced the initial doublet, whose separation from the rest of the discharge was sharpened by adaptation caused by I K-AHP and I K-slow. Calcium-dependent regulation of ionic currents played also a critical role. By being coupled to I K-C, I Ca-HVA enhanced the fast phase of spike AHP thereby resetting the spiking mechanism and sustaining high-frequency discharge. By being coupled to I K-AHP, I Ca-HVA enhanced the slow phase of spike AHP and spike-frequency adaptation during repetitive discharge.
The numerous currents revealed experimentally allowed the model to simultaneously control multiple aspects of electroresponsiveness, ranging from pacemaking to various response patterns elicited by depolarization and hyperpolarization. Each current could be attributed a characteristic role, as further explained in the following paper (Solinas et al., 2007), despite the apparent redundancy of some mechanisms (e.g., of I K-AHP and I K-slow, which are both slow-repolarizing currents, or I Na-p and I h, which could both sustain pacemaking). Moreover, the model allowed to define a typical, or “canonical,” Golgi cell electroresponsive pattern covering an extended experimental set of recordings (Forti et al., 2006 ). Apparently, histochemical differences (Geurts et al., 2001 ; Simat et al., 2007 ) did not remarkably impact on basic electroresponsiveness. Although the present model could be improved by more detailed analysis of channel gating and calcium dynamics in Golgi cells, it is a clear advancement over previously published models (Maex and De Schutter, 1998 ).
Pacemaking in the model was sustained by subthreshold oscillations caused by I Na-p coupling with slow repolarizing currents, resembling mechanisms observed in some basal ganglia neurons (see Surmeier et al., 2005 for review). The I Ca-HVA–I K-AHP system influenced the oscillations but, unlike in a model of dopaminergic neurons of the substantia nigra (Wilson and Callaway, 2000 ), it was not essential for pacemaking. Although a careful experimental characterization of Na+ and Ca2+ currents in Golgi cells remains to be done, we point out that pharmacological block of SK channels generating I K-AHP did not arrest pacemaking in vitro (Forti et al., 2006 ). I h in our model proved critical to keep the oscillatory mechanisms in the appropriate membrane potential range for activation. This does not exclude that specific regulation of I h reversal potential might enable I h to take more actively part to oscillatory dynamics, as proposed for subthreshold oscillations in entorhinal neurons (Dickson et al., 2000a ) and for pacemaking in cholinergic interneurons (Bennett et al., 2000 ). Finally, I h and I Ca-LVA did not give raise to any low-threshold pacemaking (Huguenard and McCormick, 1992 ; McCormick and Huguenard, 1992 ; McCormick and Pape, 1990 ) in Golgi cells but rather played a substantial role in rebound excitation, as also proposed for subthalamic neurons (Chan et al., 2004 ; Pennartz et al., 1997 ).
It may appear surprising that Golgi cell pacemaking was not associated with evident subthreshold oscillations, as it has been reported in, for example, amygdaloid neurons (Pape and Driesang, 1998 ), enthorinal cortex neurons (Alonso and Llinás, 1989 ; Dickson et al., 2000a ) or inferior olivary neurons (Llinás and Yarom, 1986 ). The model predicted that subthreshold oscillations in Golgi cells are tightly coupled to spikes, resembling the case of subthalamic neurons (Bevan and Wilson, 1999 ). Since pacemaking in the model maintained a similar frequency with or without spikes, the oscillation controlled the pace. Coupling of pacemaker oscillations to spikes was reinforced and regularized by I K-AHP. This effect became clear after introducing noise in the model to mimic in vitro recordings, which are affected by stochastic channel gating. In the noisy regime, pacemaking remained rather regular until I K-AHP was switched off, thereby imitating the effect of I K-AHP blockage by apamine (Forti et al., 2006 , for a similar effect see also subthalamic nuclear neurons: Bevan and Wilson, 1999 ; Hallworth et al., 2003 ). The regularizing action of I K-AHP occurs therefore through a repeated phase-reset of the pacemaker cycle, a concept fully developed in the continuation of this work (Solinas et al., 2007).
The intrinsic excitable properties of Golgi cells could have relevant implications for cerebellar signal processing. The basal discharge may become irregular in vivo due to synaptic noise suggesting that, similar to what was observed in a Purkinje cell model (De Schutter and Bower, 1994 ; Jaeger et al., 1997 , see also Shin et al., 2007 ), in vivo Golgi cell spiking is still sustained by intrinsic pacemaking (see Solinas et al., 2007). The Golgi cell responses to protracted depolarizing pulses in vitro is characterized (after the initial burst) by a sustained discharge with a frequency depending on the intensity of the input. The modulation of response frequency would allow the Golgi cell to follow the temporal evolution of sensory-motor patterns (Miles et al., 1980 ). This confirms that the short-lasting Golgi cells spiking responses to long duration stimuli observed in vivo (Tahon et al., 2005 ) are due to depression of afferent input, as opposed to intrinsic mechanisms. Moreover, the presence of mechanisms enhancing the initial spike burst and regulating its initiation may be relevant for exerting precisely timed inhibitory effects on granule cells. An extended investigation of the effect of the ionic channel complement is presented in the companion paper (Solinas et al., 2007) showing that I K-AHP and I K-slow appear primarily involved in causing phase-reset and resonance, respectively. The model has therefore the ability to predict Golgi cell responses in various operating condition and appears as a useful tool for large-scale simulations of the cerebellar network.
Conflict of Interest Statement
The authors declare that the research was conducted in the absence of any commercial or financial relationships that could be construed as a potential conflict of interest.
Acknowledgements
This work was supported by grants CEREBELLUM (QLG3-CT-2001-02256) and SENSOPAC (FP6-IST028056) of the European Commission, by CNISM and Fondazione CARIPLO of Italy, by UA and FWO of Belgium, and by OIST of Japan. L.F. was the percipient of an INGENIO fellowship from the European Social Fund, Ministero del Lavoro e della Previdenza Sociale and Regione Lombardia of Italy.
References
Achard, P., and De Schutter, E. (2006). Complex parameter landscape for a complex neuron model. PLoS Comput. Biol. 2, e94.
Afshari, F. S., Ptak, K., Khaliq, Z. M., Grieco, T. M., Slater, N. T., McCrimmon, D. R., and Raman, I. M. (2004). Resurgent Na currents in four classes of neurons of the cerebellum. J. Neurophysiol. 92, 2831–2843.
Alonso, A., Llinás, R. R. (1989). Subthreshold Na+-dependent theta-like rhythmicity in stellate cells of entorhinal cortex layer II. Nature 342, 175–177.
Bennett, B. D., Callaway, J. C., and Wilson, C. J. (2000). Intrinsic membrane properties underlying spontaneous tonic firing in neostriatal cholinergic interneurons. J. Neurosci. 20, 8493–8503.
Bevan, M. D., and Wilson, C. J. (1999). Mechanisms underlying spontaneous oscillation and rhythmic firing in rat subthalamic neurons. J. Neurosci. 19, 7617–7628.
Bond, C. T., Maylie, J., and Adelman, J. P. (2005). SK channels in excitability, pacemaking and synaptic integration. Curr. Opin. Neurobiol. 15, 305–311.
Chan, C. S., Shigemoto, R., Mercer, J. N., and Surmeier, D. J. (2004). HCN2 and HCN1 channels govern the regularity of autonomous pacemaking and synaptic resetting in globus pallidus neurons. J. Neurosci. 24, 9921–9932.
D'Angelo, E., Nieus, T., Maffei, A., Armano, S., Rossi, P., Taglietti, V., Fontana, A., and Naldi, G. (2001). Theta-frequency bursting and resonance in cerebellar granule cells: experimental evidence and modeling of a slow K+-dependent mechanism. J. Neurosci. 21, 759–770.
De Schutter, E., and Bower, J. M. (1994). An active membrane model of the cerebellar Purkinje cell: II. Simulation of synaptic responses. J. Neurophysiol. 71, 401–419.
De Schutter, E., and Smolen, P. (1998). Calcium dynamics in large neuronal models. In Methods in Neuronal Modeling From Ions to Networks , 2 edn, K. C. Segev, ed. (Cambridge, MA, MIT Press). pp. 211–250.
Destexhe, A., Contreras, D., Sejnowski, T. J., and Steriade, M. (1994). A model of spindle rhythmicity in the isolated thalamic reticular nucleus. J. Neurophysiol. 72, 803–818.
Dickson, C. T., Magistretti, J., Shalinsky, M., Hamam, B., and Alonso, A. (2000a). Oscillatory activity in entorhinal neurons and circuits. Mechanisms and function. Ann. N. Y. Acad. Sci. 911, 127–150.
Dickson, C. T., Magistretti, J., Shalinsky, M. H., Fransén, E., Hasselmo, M. E., and Alonso, A. (2000b). Properties and role of I(h) in the pacing of subthreshold oscillations in entorhinal cortex layer II neurons. J. Neurophysiol. 83, 2562–2579.
Dieudonné, S. (1998). Submillisecond kinetics and low efficacy of parallel fibre-Golgi cell synaptic currents in the rat cerebellum. J. Physiol. 510, 845–866.
Druckmann, S., Banitt, Y., Gidon, A. A., Schürmann, F., Markram, H., and Segev, I. (2007). A novel multiple objective optimization framework for constraining conductance-based neuron models by experimental data. Front. Neurosci. 1, 7–18.
Eccles, J. C., Ito, M., Szentágothai, J. (1967). The cerebellum as a neuronal machine (Berlin, Springer.).
Forti, L., Cesana, E., Mapelli, J., D'Angelo, E. (2006). Ionic mechanisms of autorhythmic firing in rat cerebellar Golgi cells. J. Physiol. 574, 711–729.
Gabbiani, F., Midtgaard, J., Knöpfel, T. (1994). Synaptic integration in a model of cerebellar granule cells. J. Neurophysiol. 72, 999–1009.
Geurts, F. J., Timmermans, J., Shigemoto, R., and De Schutter, E. (2001). Morphological and neurochemical differentiation of large granular layer interneurons in the adult rat cerebellum. Neuroscience 104, 499–512.
Golgi, C. (1883). Sulla fina anatomia degli organi centrali del sistema nervoso IV. Sulla fina anatomia delle circonvoluzioni cerebellari. Riv. Sper. Freniatr. Med. Leg. Alien. Ment. 9, 1–17.
Gutfreund, Y., Yarom, Y., and Segev, I. (1995). Subthreshold oscillations and resonant frequency in guinea-pig cortical neurons: physiology and modelling. J. Physiol. 483, 621–640.
Hallworth, N. E., Wilson, C. J., and Bevan, M. D. (2003). Apaminsensitive small conductance calcium-activated potassium channels, through their selective coupling to voltage-gated calcium channels, are critical determinants of the precision, pace, and pattern of action potential generation in rat subthalamic nucleus neurons in vitro. J. Neurosci. 23, 7525–7542.
Hines, M. L., and Carnevale, N. T. (2001). NEURON: a tool for neuroscientists. Neuroscientist 7, 123–135.
Hirschberg, B., Maylie, J., Adelman, J. P., and Marrion, N. V. (1998). Gating of recombinant small-conductance Ca-activated K+ channels by calcium. J. Gen. Physiol. 111, 565–581.
Hodgkin, A. L., and Huxley, A. F. (1952). A quantitative description of membrane current and its application to conduction and excitation in nerve. J. Physiol. 117, 500–544.
Huguenard, J. R., and McCormick, D. A. (1992). Voltage clamp simulations of currents involved in rhythmic oscillations in thalamic relay neurone. J. Neurophysiol. 68, 1373–1383.
Hutcheon, B., and Yarom, Y. (2000). Resonance, oscillation and the intrinsic frequency preferences of neurons. Trends Neurosci. 23, 216–222.
Jaeger, D., De Schutter, E., and Bower, J. M. (1997). The role of synaptic and voltage-gated currents in the control of Purkinje cell spiking: a modeling study. J. Neurosci. 17, 91–106.
Llinás, R., and Yarom, Y. (1986). Oscillatory properties of guinea-pig inferior olivary neurones and their pharmacological modulation: an in vitro study. J. Physiol. 376, 163–182.
Llinás, R. R. (1988). The intrinsic electrophysiological properties of mammalian neurons: insights into central nervous system function. Science 242, 1654–1664.
Luthi, A., and McCormick, D. A. (1998). H-current: properties of a neuronal and network pacemaker. Neuron 21, 9–12.
Maex, R., and De Schutter, E. (1998). Synchronization of Golgi and granule cell firing in a detailed network model of the cerebellar granule cell layer. J. Neurophysiol. 80, 2521–2537.
Magistretti, J., Castelli, L., Forti, L., D'Angelo, E. (2006). Kinetic and functional analysis of transient, persistent and resurgent sodium currents in rat cerebellar granule cells in situ: an electrophysiological and modelling study. J. Physiol. 573, 83–106.
Marrion, N. V., and Tavalin, S. J. (1998). Selective activation of Ca2+-activated K+ channels by co-localized Ca2+ channels in hippocampal neurons. Nature 395, 900–905.
McCormick, D. A., and Pape, H. C. (1990). Noradrenergic and serotonergic modulation of a hyperpolarization-activated cation current in thalamic relay neurones. J. Physiol. 431, 319–342.
McCormick, D. A., and Huguenard, J. R. (1992). A model of the electrophysiological properties of thalamocortical relay neurons. J. Neurophysiol. 68, 1384–1400.
Miles, F. A., Fuller, J. H., Braitman, D. J., and Dow, B. M. (1980). Long-term adaptive changes in primate vestibuloocular reflex. III. Electrophysiological observations in flocculus of normal monkeys. J. Neurophysiol. 43, 1437–1476.
Nieus, T., Sola, E., Mapelli, J., Saftenku, E., Rossi, P., D'Angelo, E. (2006). LTP regulates burst initiation and frequency at mossy fiber-granule cell synapses of rat cerebellum: experimental observations and theoretical predictions. J. Neurophysiol. 95, 686–699.
Pape, H. C., and Driesang, R. B. (1998). Ionic mechanisms of intrinsic oscillations in neurons of the basolateral amygdaloid complex. J. Neurophysiol. 79, 217–226.
Pennartz, C. M. A., Bierlaagh, M. A., and Geurtsen, A. M. S. (1997). Cellular mechanisms underlying spontaneous firing in rat suprachias-matic nucleus: involvement of a slowly inactivating component of sodium current. J. Neurophysiol. 78, 1811–1825.
Raman, I. M., and Bean, B. P. (1997). Resurgent sodium current and action potential formation in dissociated cerebellar Purkinje neurons. J. Neurosci. 17, 4517–4526.
Roth, A., Häusser, M. (2001). Compartmental models of rat cerebellar Purkinje cells based on simultaneous somatic and dendritic patch-clamp recordings. J. Physiol. 535, 445–472.
Santoro, B., Chen, S., Luthi, A., Pavlidis, P., Shumyatsky, G. P., Tibbs, G. R., and Siegelbaum, S. A. (2000). Molecular and functional heterogeneity of hyperpolarization-activated pacemaker channels in the mouse CNS. J. Neurosci. 20, 5264–5275.
Shin, S.-L., Hoebeek, F. E., Schonewille, M., De Zeeuw, C. I., Aertsen, A., and De Schutter, E. (2007). Regular patterns in cerebellar Purkinje cell simple spike trains. PLoS ONE 2, e485.
Simat, M., Parpan, F., and Fritschy, J.-M. (2007). Heterogeneity of glycinergic and gabaergic interneurons in the granule cell layer of mouse cerebellum. J. Comp. Neurol. 500, 71–83.
Solinas, S., Forti, L., Cesana, E., Mapelli, J., De Schutter, E., D'Angelo, E. (2008). Fast-reset of pacemaking and theta-frequency resonance patterns in cerebellar Golgi cells: simulations of their impact in vivo. Front. Neurosci. 2: 4.
Stocker, M. (2004). Ca2+-activated K+ channels: molecular determinants and function of the SK family. Nat. Rev. Neurosci. 5, 758–770.
Stocker, M., and Pedarzani, P. (2000). Differential distribution of three Ca2+-activated K+ channel subunits, SK1, SK2, and SK3, in the adult rat central nervous system. Mol. Cell Neurosci. 15, 476–493.
Surmeier, D. J., Mercer, J. N., and Chan, C. S. (2005). Autonomous pacemakers in the basal ganglia: who needs excitatory synapses anyway? Curr. Opin. Neurobiol. 15, 312–318.
Tahon, K., Volny-Luraghi, A., and De Schutter, E. (2005). Temporal characteristics of tactile stimuli influence the responce profile of cerebellar Golgi cells. Neurosci. Lett. 390, 156–161.
Tatulian, L., Delmas, P., Abogadie, F. C., and Brown, D. A. (2001). Activation of expressed KCNQ potassium currents and native neuronal M-type potassium currents by the anti-convulsant drug retigabine. J. Neurosci. 21, 5535–5545.
Traub, R. D. (1982). Simulation of intrinsic bursting in CA3 hippocampal neurons. Neuroscience 7, 1233–1242.
Traub, R. D., Llinás, R. R. (1979). Hippocampal pyramidal cells: significance of dendritic ionic conductances for neuronal function and epileptogenesis. J. Neurophysiol. 42, 476–496.
Traub, R. D., Wong, R. K., Miles, R., and Michelson, H. (1991). A model of a CA3 hippocampal pyramidal neuron incorporating voltage-clamp data on intrinsic conductances. J. Neurophysiol. 66, 635–650.
Vanier, M. C., and Bower, J. M. (1999). A comparative survey of automated parameter-search methods for compartmental neural models. J. Comput. Neurosci. 7, 149–171.
Keywords: Golgi cell, pacemaking, cerebellum, granular layer, modeling
Citation: Sergio Solinas, Lia Forti, Elisabetta Cesana, Jonathan Mapelli, Erik De Schutter and Egidio D'Angelo (2007). Computational reconstruction of pacemaking and intrinsic electroresponsiveness in cerebellar golgi cells. Front. Cell. Neurosci. 1:2. doi: 10.3389/neuro.03/002.2007
Received: 30 August 2007;
Paper pending published: 21 September 2007;
Accepted: 7 December 2007;
Published online: 30 December 2007
Edited by:
Alexander Borst, Max-Planck-Institute of Neurobiology, GermanyReviewed by:
Hermann Cuntz, University College London, UKYosef Yarom, Hebrew University, Israel
Copyright: © 2007 Solinas, Forti, Cesana, Mapelli, De Schutter and D'Angelo. This is an open-access article subject to an exclusive license agreement between the authors and the Frontiers Research Foundation, which permits unrestricted use, distribution, and reproduction in any medium, provided the original authors and source are credited.
*Correspondence: Egidio D'Angelo, Department of Cellular and Molecular Physiological and Pharmacological Sciences, University of Pavia and CNISM, Via Forlanini 6, I-27100 Pavia, Italy. e-mail: dangelo@unipv.it