Reconstructing the population activity of olfactory output neurons that innervate identifiable processing units
1
Graduate School of Life and Environmental Sciences, University of Tsukuba, Ibaraki, Japan
2
Research Center for Advanced Science and Technology, The University of Tokyo, Tokyo, Japan
3
Department of Mechano-Informatics, Graduate School of Information Science and Technology, The University of Tokyo, Tokyo, Japan
We investigated the functional organization of the moth antennal lobe (AL), the primary olfactory network, by integrating single-cell electrophysiological recording data with geometrical information. The moth AL contains about 60 processing units called glomeruli that are identifiable from one animal to another. We were able to monitor the output information of the AL by recording the activity of a population of output neurons, each of which innervated a single glomerulus. Using compiled in vivo intracellular recordings and staining data from different animals, we mapped the odor-evoked dynamics on a digital atlas of the AL and geometrically reconstructed the population activity. We examined the quantitative relationship between the similarity of olfactory responses and the anatomical distance between glomeruli. Globally, the olfactory response profile was independent of the anatomical distance, although some local features were present. Olfactory response profiles of superficial glomeruli were approximately similar, whereas those of deep glomeruli were different with each other, suggesting network architectures are different in superficial and deep glomerular networks during olfactory processing.
In order to analyze a complex brain circuit, it is necessary to compile data obtained from different experimental animals because it is not possible to monitor all biological parameters of the brain at the same time in a single experiment. In order to compare neurophysiological data, some anatomical landmarks are required, including brain areas such as the hippocampus and frontal lobe, layers and columns in the cortex, and characteristic dendritic and axonal morphology. The ability to identify the same anatomical structures in different animals makes it possible to integrate experimental data with precise resolution. For example, individual columns in the primary somatosensory cortex are identifiable across different animals and the physiological data obtained with barrel coordinates can be analyzed and integrated with single-column resolution (Kerr et al., 2007
). The reverse-engineering approach, which involves the reconstruction of the dynamics of whole parts of systems based on neurophysiological data collected from different experiments using referential geometric information, can facilitate analysis of complex or large-scale brain networks. One target for such a holistic approach would be the reconstruction of entire or large parts of networks of the mammalian brain with particular detail (Denk and Horstmann, 2004
; Markram, 2006
). Another possibility would be to reconstruct relatively simple networks, such as the invertebrate nervous system, with neurons that can be identified reliably from one animal to another (Comer and Robertson, 2001
; Marder and Bucher, 2007
).
The reverse-engineering approach is useful for analyzing insect neural circuits because their neurons are easily identified and their structure is relatively simple. Pioneering work has been done in the cricket cercal system (Jacobs and Theunissen, 1996
, 2000
; Troyer et al., 1994
) where mapping the preferred direction of primary sensory afferents on their morphology has revealed the functional organization of the mechanosensory representation. Heinze and Homberg (2007)
demonstrated the neuronal representation of polarized vision using a compilation of intracellular data based on spatially distinct columnar structures. Their study mapped the preferred orientation of neurons innervating the central body on identifiable columns. These studies reconstructed sensory representations using static parameters obtained from electrophysiological recordings. Here, we reconstructed a sensory representation based on compiled electrophysiological recordings and temporal patterns in the moth olfactory system.
The antennal lobe (AL) is the first station for olfactory processing in the insect brain and it is the functional and anatomical equivalent of the mammalian olfactory bulb (OB) (Christensen and White, 2000
; Hildebrand and Shepherd, 1997
; Shepherd et al., 2004
). The AL and the OB have discrete anatomical maps composed of multiple processing units called glomeruli (Buck, 1996
; Wachowiak et al., 2004
). Whereas the murine OB has about 1800 glomeruli (Royet et al., 1988
), there are relatively few glomeruli (40–160) in the ALs of most holometabolous insect species (Anton and Homberg, 1999
). Because of this simplicity, it is possible to identify individual glomeruli in the AL from one animal to another (Galizia et al., 1999
; Laissue et al., 1999
), making the AL a useful model for investigating olfactory processing and a suitable neural system for the reverse-engineering approach. Olfactory receptor neurons (ORNs) that express the same receptor protein project to a single glomerulus, or a limited number of glomeruli, in the AL (Vosshall et al., 2000
) and the OB (Mombaerts et al., 1996
; Treloar et al., 2002
). The convergent organization of ORNs might effect signal amplification and reliable responses of downstream neurons (Bhandawat et al., 2007
). Projection neurons (PNs, AL output neurons), analogs of the mitral cells of the OB, transmit olfactory information encoded in the AL to higher-order centers in the protocerebrum (Homberg et al., 1988
; Marin et al., 2002
; Tanaka et al., 2004
; Wong et al., 2002
). PNs encode olfactory information via spatially and temporally organized population activities (Christensen et al., 2000
; Daly et al., 2004
; Laurent, 2002
; Stopfer et al., 2003
; Yamada, 1971
). PNs that innervate the same glomerulus show similar response profiles in their firing rates (Bhandawat et al., 2007
; Hansson et al., 1992
; Kanzaki et al., 2003
; Reisenman et al., 2005
; Schlief and Wilson, 2007
; Wilson et al., 2004
) and precise spike timing (Lei et al., 2002
). Synchronized firing across neurons that innervate the same glomerulus has also been observed in the activity evoked in mitral cells (Christie et al., 2005
; Schoppa, 2006
; Schoppa and Westbrook, 2001
) and the spontaneous activity of juxtaglomerular cells in rodent OB slices (Karnup et al., 2006
).
Recording the activity of PNs that innervate a single glomerulus would enable us to monitor output information from the AL at glomerulus-level resolution. To reveal the functional organization of odor-evoked population activity, we performed intracellular recordings of a population of PNs in the brain of the silkmoth, Bombyx mori. We reconstructed a population activity using data from multiple individual experiments by identifying individual glomeruli and mapping the firing rate changes of the PNs onto a digital atlas. Using this reconstructed population activity, we quantitatively analyzed the relationship between the olfactory response profile and the anatomical distance between glomeruli.
Animals
We chose the silkmoth, B. mori (Lepidoptera: Bombycidae), to reconstruct a population activity of PNs because its AL has relatively few PNs (∼300) and the method for morphological identification of its glomeruli has been established (Kazawa et al., 2004
). Moths were reared at 26°C and 60% relative humidity and fed an artificial diet. Adult male moths were used at 2–7 days post eclosion to eliminate the effects of maturation on olfactory processing in the AL (Huetteroth and Schachtner, 2005
; Wang et al., 2005
).
Electrophysiology
After cooling the moths (4°C, 30 min) to achieve anesthesia, the abdomen, legs, wings, and dorsal side of the thorax were removed. Each moth was fixed in a plastic chamber and its head was immobilized using a notched plastic yoke slipped between the head and thorax. The brain was exposed by opening the head capsule and removing the large tracheae; the intracranial muscles were removed to eliminate brain movement. The AL was surgically de-sheathed to facilitate insertion of the microelectrode. Electrodes were filled with 5% Lucifer Yellow CH (LY) solution (Sigma, St Louis, MO, USA) in distilled water for staining neurons. The resistance of the electrodes was ∼150 MΩ. A silver ground electrode was placed on the head cuticle and the brain was superfused with saline solution (in mM): 140 NaCl; 5 KCl; 7 CaCl2; 1 MgCl2; 4 NaHCO3; 5 trehalose; 5 N-tris (hydroxymethyl) methyl-2-aminoethanesulfonic acid (TES); and 100 sucrose (pH 7.3). The electrodes were inserted using a micromanipulator (Leica Microsystems, Wetzlar, Germany) and the incoming signal was amplified (MEZ-7200; Nihon Kohden, Tokyo, Japan), monitored with an oscilloscope (VC-9; Nihon Kohden, Tokyo, Japan), and recorded on a DAT recorder (RD-125T; TEAC, Tokyo, Japan) at 24 kHz. The acquired signals were converted using an analog-to-digital converter and stored on a computer (Quick Vu 2; TEAC, Tokyo, Japan).
Olfactory Stimulation
Three main odorants were used for stimulation: 84.8 μg of cis-3-hexen-1-ol (purity >97%; catalog H0124), 86.2 μg of linalool (purity >98%; catalog L0048), and 88.8 μg of citral (purity >93%; catalog D0672) from Tokyo Chemical Industries (Tokyo, Japan). These compounds comprise the volatile components of the mulberry leaf, which is the host plant of the silkworm (Hamamura et al., 1961
). A 5-μl solution of the odorant was applied to a piece of filter paper (1 cm × 2 cm) and inserted into a glass stimulant cartridge (5.5-mm tip diameter). The distance between the filter paper and the exit of the cartridge was approximately 7 cm. Odor stimulus was applied to the antenna ipsilateral to the AL impaled by the microelectrode, and the exit of the cartridge was positioned 1.5 cm from the antenna. Compressed pure air was passed through a charcoal filter into the stimulant cartridge and each stimulus was applied at 500 ml/min (approximately 35 cm/s), similar to the airflow speed when silkmoths flap their wings (Loudon and Koehl, 2000
). The interval between puffs was at least 10 s. An exhaust tube was placed on the opposite side of the stimulant cartridge to remove odors (inner diameter, 4.5 cm; 15 cm from the antenna; approximately 55 cm/s). All stimulant cartridges were sealed with a Teflon sheet and stored at −20°C; they were brought to room temperature prior to each recording session. Each odorant was tested at least twice in all experiments. We used solenoid valves (MTV-31-M6; Takasago Electric, Nagoya, Japan) and an interface board (Digidata 1200; Axon Instruments, Foster City, CA, USA) to control stimulus cartridge selection, stimulus duration, and intervals with a custom-made program written in BASIC.
Three-Dimensional Reconstruction of a Single Neuron
We stained each neuron using an iontophoretic injection of LY and a constant hyperpolarizing current (approximately −1 to −5 nA) for 1–3 min. After staining, the brain was superfused with saline solution containing 200 mM sucrose. This procedure slightly enlarges the borders between the glomeruli and facilitates glomerular identification. If the borders between the glomeruli were unclear, we performed additional background staining with tetramethylrhodamine (D3308; Molecular Probes, Eugene, OR, USA). The brain was fixed for 4–10 h at room temperature in 4% paraformaldehyde in 0.1 M phosphate buffer (pH 7.3) with 10% sucrose, dehydrated in an ethanol series, and cleared in methyl salicylate. Each stained neuron was imaged frontally using a confocal imaging system (LSM510; Carl Zeiss, Jena, Germany) with plan apochromat ×40 (numerical aperture = 1.0) objectives. Whole mounts of the LY-stained neurons were examined at 458-nm excitation wavelength with a long-pass emission filter (>475 nm). Serial optical sections were acquired at 0.7-μm intervals through the entire depth of the neuron and three-dimensional reconstructions of the labeled neurons were created from these sections. Glomeruli were identified morphologically and named according to a previously described method (Kazawa et al., 2004
; Figures 1
A,B). We first classified all glomeruli into six groups. We have established an identification method using neuronal tracts in the AL as anatomical landmarks. Thirty-nine of all 60 ± 2 glomeruli were perfectly identifiable. However, a group of glomeruli in the anterior-dorsal region showed variability across animals. A standard AL has 11 glomeruli in this region; others have 10 or 12 (Kazawa et al., 2004
). We included PNs that innervated glomeruli in this region (DLTG, AD01, AD02, AD03, AD04, AD05, AD06, AD07, AMTG, DMTG, and VMTG) only when the standard 11 glomeruli were present.
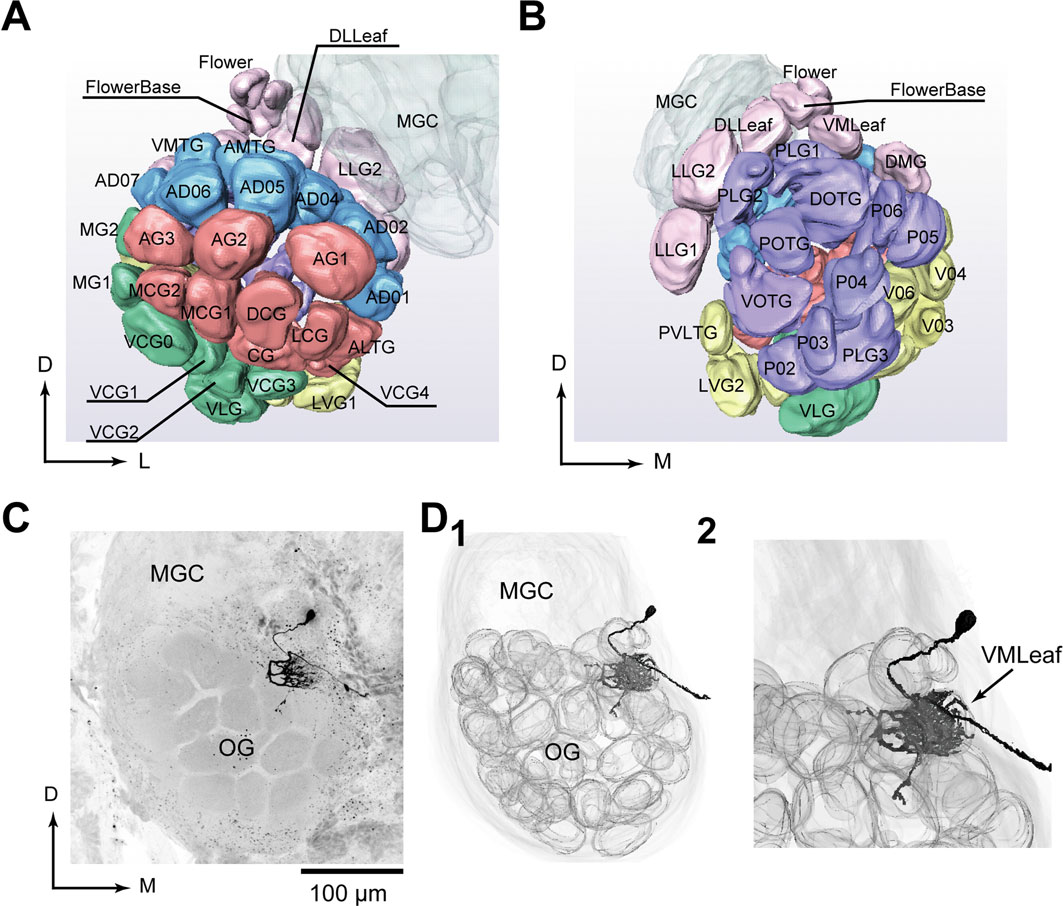
Figure 1. Morphological atlas of olfactory glomeruli. (A) Anterior view of the digital atlas of the AL. Names of glomeruli are shown. (B) Posterior view of the atlas. (C) Confocal image of a uniglomerular projection neuron (PN) with dendritic arborizations confined to the dorsomedially-located glomerulus, VMLeaf. This PN innervated the entire region of a glomerulus and ran through the inner antenno-cerebral tract. Two additional branches innervating outside the glomerulus were observed. Its soma was located in the medial cell cluster. (D1) Three-dimensional reconstruction of the same neuron with glomerular structure. (D2) Higher magnification of (D1). D, dorsal; M, medial; MGC, macroglomerular complex; L, lateral; OG, ordinary glomeruli.
Data Analysis
The action potentials were timed and the mean firing rates were calculated using custom programs developed using C language (C++ builder; Borland Software Corporation, Cupertino, CA, USA). Responses were divided into 50-ms time bins and the mean firing rates during each bin were calculated. To increase statistical efficiency (Kass et al., 2003
), we applied a Gaussian filter (bandwidth of three bins) to the firing rate histogram. To evaluate trial-to-trial variability, we calculated the Pearson correlation coefficients of firing rates between stimulus onset and 1 s after stimulus onset (20 bins) from different trials of the same neuron (Figures 2
D,E). To evaluate the similarities in the response profiles of different PNs, we calculated correlation coefficients for each period from 1 s before stimulus onset and 6 s after stimulus onset (Figure 3
B). Sixty time bins from the responses to the three odors were used for the calculation. To evaluate the binning effect on the response similarity, we calculated the correlation coefficients of firing rates from stimulus onset to 1 s after stimulus onset with different bin sizes (5, 10, 25, 50, 100, 200, and 500 ms; Figure 3
C). To visualize the olfactory response of the pooled data, we mapped firing rate changes on individual glomeruli in the digital standard AL using pseudo color (Figure 4
). We used principal component analysis (PCA), a method of standard linear dimensionality reduction, to visualize high-dimensional data of the firing rates of the PN population (Chapin and Nicolelis, 1999
; Joliffe, 1986
; Stopfer et al., 2003
; Figure 5
). Input data for PCA in Figures 5
A,C were taken from the matrix of firing rates of PNs in response to three odors (each row and column represents time and neurons, respectively). To quantify the differences between PNs’ responses to different odors, we calculated the Euclidean distance between the firing rates of a PN population at each time point (Figure 5
B).
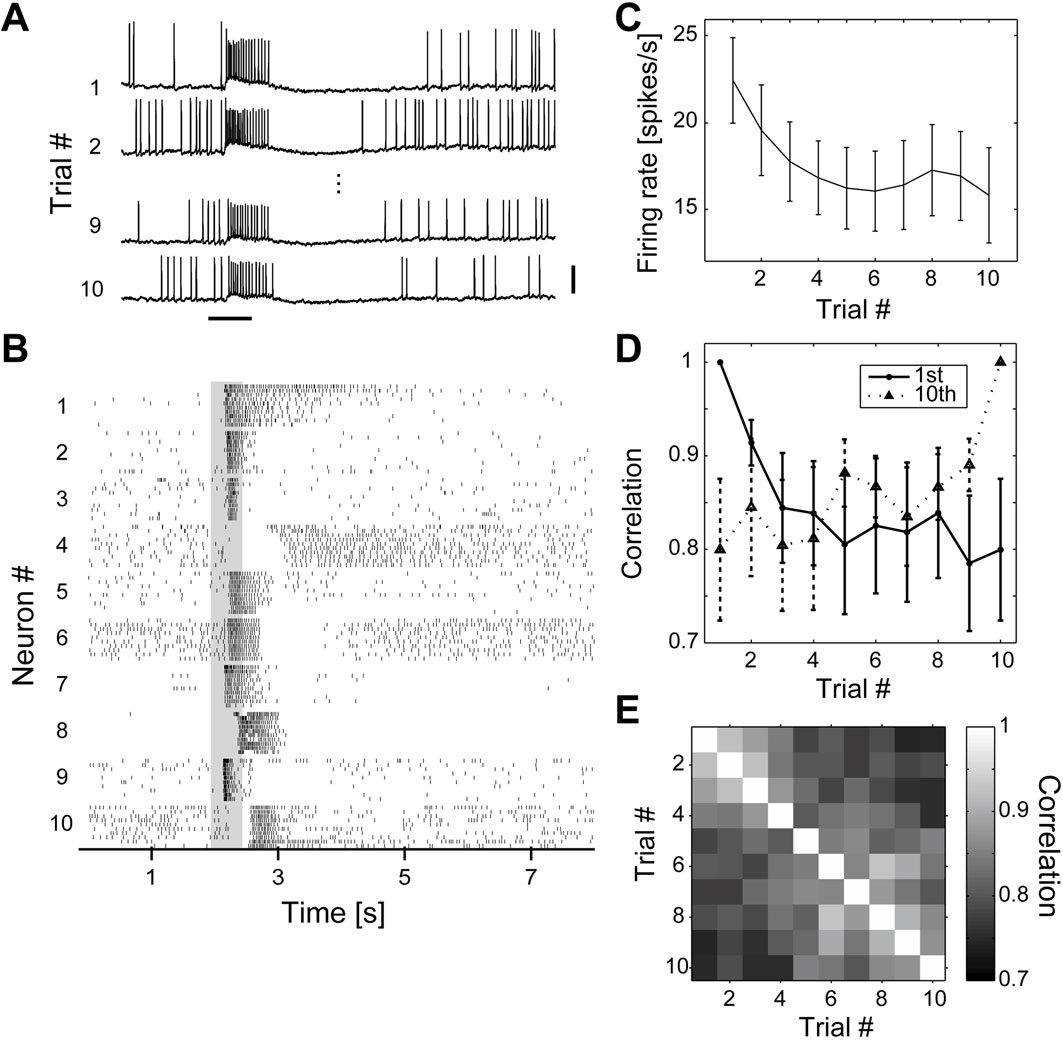
Figure 2. Trial-to-trial variability of olfactory responses. (A) Olfactory responses of a single PN to 10 successive stimuli at 0.1 Hz. Stimulus duration was 0.5 s. Scale bars = 0.5 s, 10 mV. (B) Olfactory responses of 10 different PNs to 10 successive stimuli of cis-3-hexen-1-ol. The gray region indicates the period of odor presentation. (C) Mean firing rate of PNs in response to olfactory stimuli as a function of trial number (n = 15). The number of spikes during the 1 s following stimulus onset were counted. (D) Pearson correlation coefficients of olfactory responses as a function of trial number (n = 15 PNs). Solid and broken lines represent the correlation between each trial and 1st and 10th trials, respectively. (E) Mean correlation coefficients across different trials (n = 15 PNs). We first calculated the correlation across trials in each neuron and then averaged them across all neurons. Close trial numbers showed higher correlation.
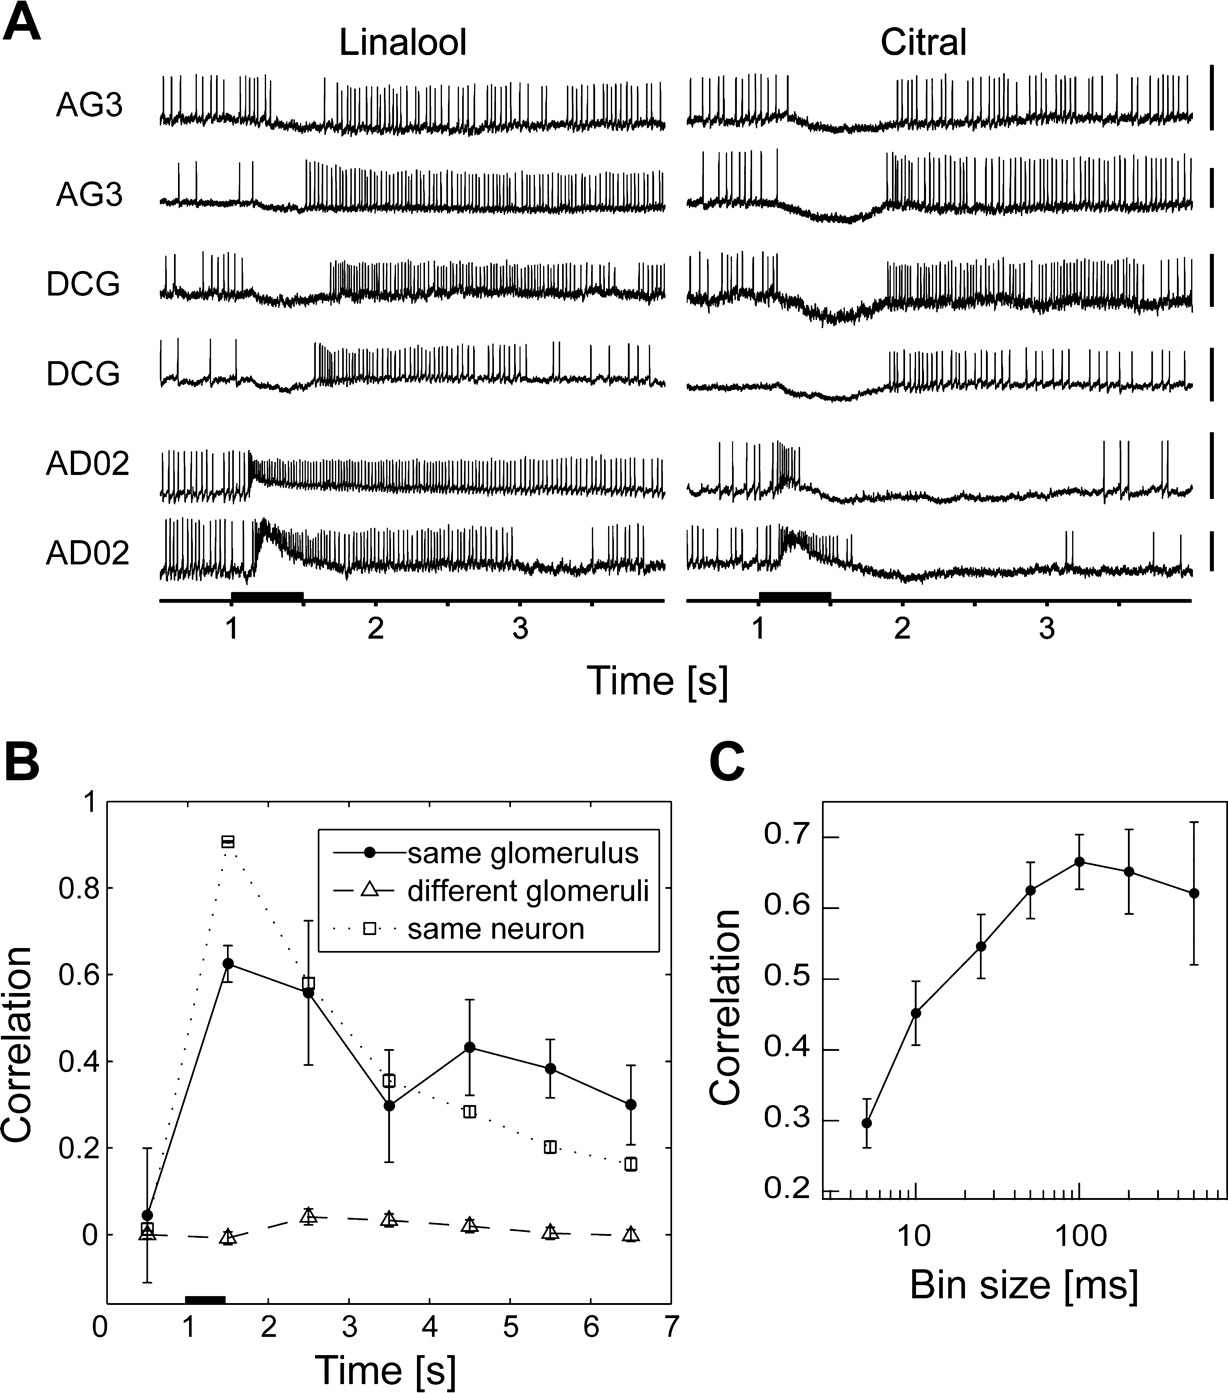
Figure 3. Odor-evoked temporal profiles of PNs that innervate the same glomerulus are significantly alike. (A) Olfactory responses of three pairs of PNs innervating the glomeruli, AG3, DCG, and AD02. Each trace shows the response to the first applications of linalool and citral. Scale bars = 10 mV. (B) Pearson correlation coefficient as a function of time. The graph shows temporal changes in the correlation coefficient of the firing rate of the bins from 1 s before stimulus onset, in steps of 1 s. The black bar represents stimulus duration (500 ms). The black and gray solid lines represent the correlation of firing rates of pairs of PNs innervating the same glomerulus (n = 7 pairs from 11 neurons) and different glomeruli (n = 554 pairs from 34 neurons), respectively. The broken line represents the correlation of firing rates of pairs of responses from the same neurons in different trials (n = 780 pairs from 45 neurons). Pairs innervating the same glomerulus showed significantly correlated firing rates after stimulus onset (p < 0.01, Student’s t-test). (C) Correlation between PNs innervating the same glomerulus as a function of bin size. We calculated the Pearson correlation coefficients of firing rates with different bins (5, 10, 25, 50, 100, 200, and 500 ms). Responses to three odors were used for the calculation.
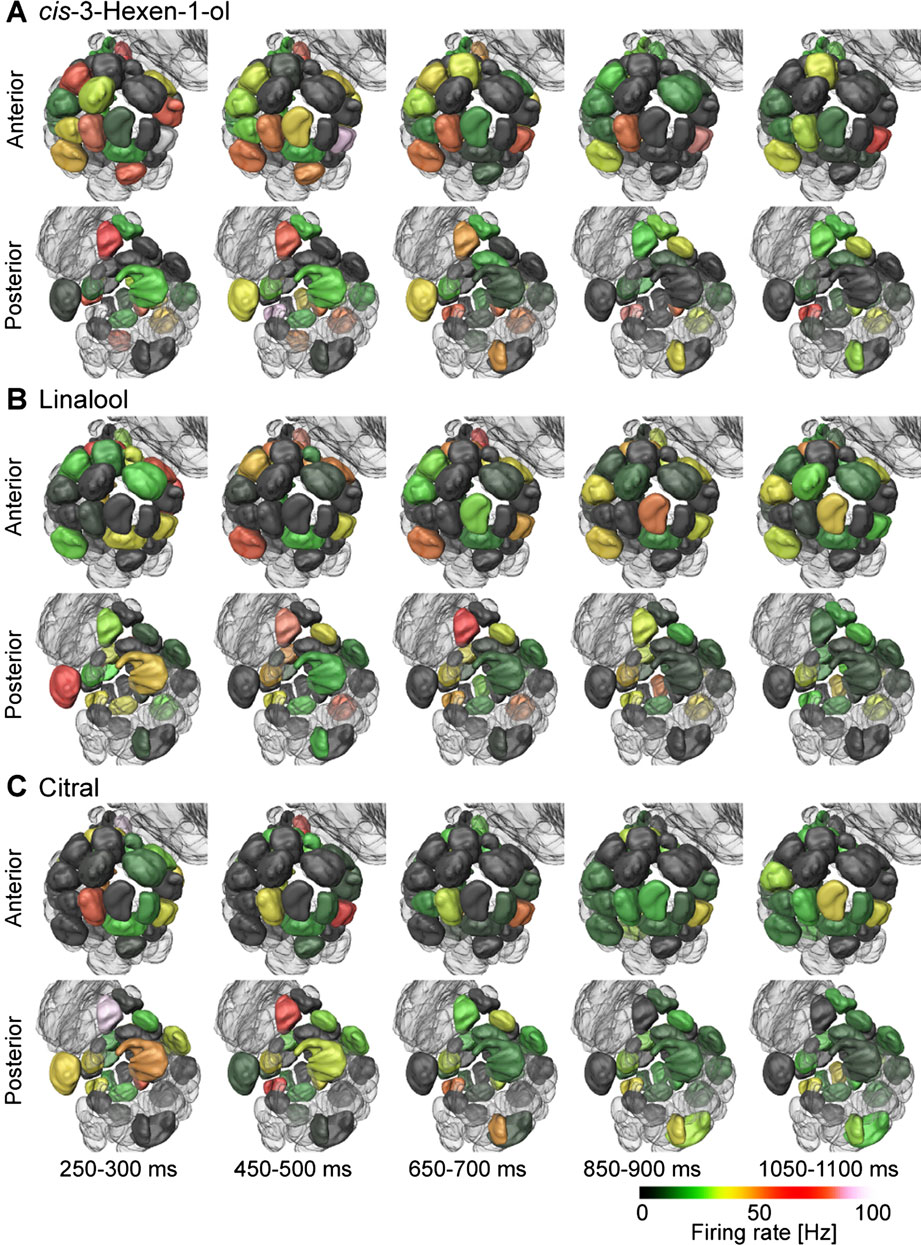
Figure 4. Reconstructed geometry of odor-evoked firing activity. Anterior and posterior views of reconstructed population activities in response to cis-3-hexen-1-ol (A), linalool (B), and citral (C). The color within each glomerulus represents the average firing rate from baseline of the innervating PNs. The glomeruli that we did not record are transparent in color. Responses at 250–300, 450–500, 650–700, 850–900, and 1050–1100 ms after stimulus onset are shown in the same row.
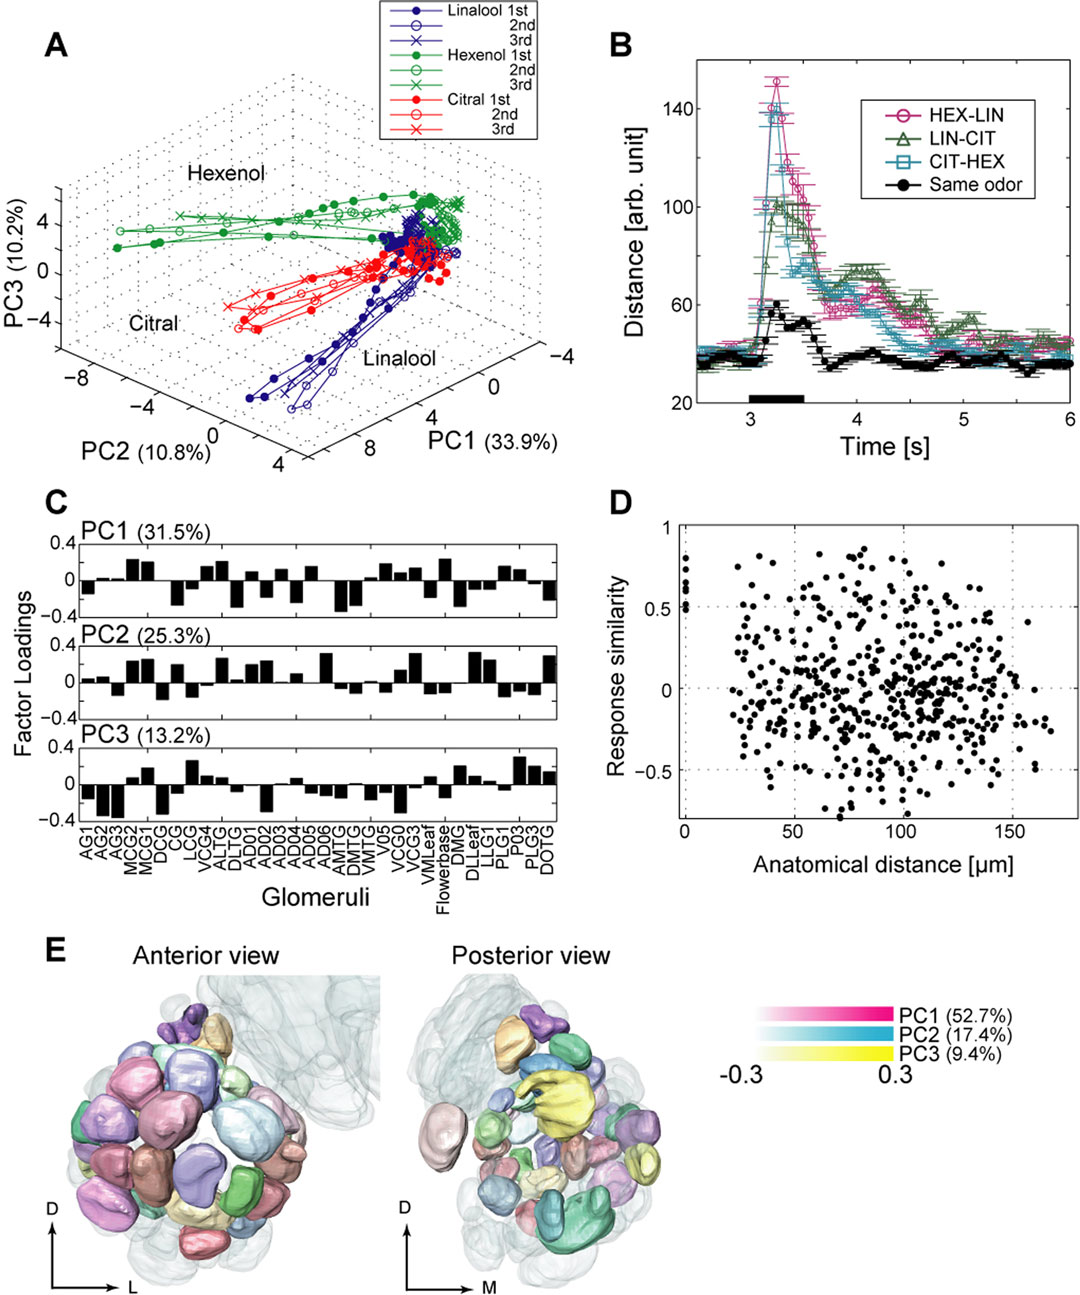
Figure 5. Organization of evoked network activity in the AL. (A) Illustration of the trajectories representing PN population activity over time in response to cis-3-hexen-1-ol (green), linalool (blue), and citral (red). For each odor, 47 PN spike sequences were divided into consecutive 50-ms time bins and the number of spikes in each bin was counted. We viewed the 47-dimensional vector as odor representation by the PN population. To visualize the 47-dimensional vector, we applied principal component analysis (PCA) to the vector and used the first three PCs for the graph. The variance captured by the first three PCs was 54.0% of the total. Each representation evolved in an odor-specific manner. (B) Euclidean distance between odor representations as a function of time. We calculated the Euclidean distance between the 47-dimensional vectors used in (A). Each trace showed similar profiles. The distances increased by about 100 ms after stimulus onset, peaking at 250–300 ms after stimulus onset (150–200 ms after response onset). At 550–750 ms, possibly in sustained stimulus presentation, the distances began to stabilize. From about 1000 ms after stimulus onset, the distances remained stable and at higher levels than before stimulation. (C) Distribution of factor loadings for PCs 1–3. Glomeruli are ordered roughly from anterior to posterior (right to left in the graph). We applied PCA to the 32-dimensional vector as in (A). The firing rates of PNs innervating the same glomerulus were averaged. (D) Response similarity as a function of anatomical distance between glomeruli. We used Pearson correlation coefficients of the responses of pairs of PNs to represent response similarity. Firing rates from the stimulus onset to 1 s after the stimulus onset (20 time bins) were used (the same value used in Figures 2
D, 2
E, and 3B
). Pairs of PNs innervating different glomeruli show no strong correlation (r = –0.0556, n = 496). (E) Anterior and posterior views of the color map of the olfactory response profile. First, we calculated correlation coefficients for all pairs of 32 glomeruli (32 × 32 matrix). To visualize the 32-dimensional vectors, PCA was used and vectors were embedded in the color space defined by the first three PCs (magenta, blue, and yellow for PCs 1–3, respectively). Glomeruli were labeled by the color defined in the PC space. PCs 1–3 account for 79.5% of the total variance. Similarly colored glomeruli have similar response profiles; differently colored glomeruli have different response profiles
.
To examine the relationship between the olfactory response profile and the anatomical distance, we plotted response similarity between pairs of PNs, the correlation coefficient of firing rates from stimulus onset to 1 s after stimulus onset, against the anatomical distance between the pair of innervated glomeruli in the standard AL (Figure 5
D). We used PCA to visualize olfactory response profiles of individual glomeruli (Figure 5
E). Input data for PCA in Figure 5
E were taken from the matrix of correlations for all pairs of PNs innervating different glomeruli (each row and column represents a different glomerulus). Similar response patterns resulted in similar values; thus, a pair of glomeruli with similar PCs had similar response profiles. We visualized the first three PCs using pseudo color (Figure 5
E). PCA was performed using functions from MATLAB’s Statistics Toolbox (The MathWorks Inc., Natick, MA, USA). Graphs were created using MATLAB or Igor Pro (WaveMetrics, Lake Oswego, OR, USA). We used image-processing software to map firing rates or factor loading of PCs onto the digital atlas (AMIRA 3.0; Mercury Computer Systems, San Diego, CA, USA).
Morphological Characterization of a Projection Neuron Population
First, we examined whether we could probe the AL output at glomerulus-level resolution. The moth brain contains uniglomerular and multiglomerular PNs that innervate single and multiple glomeruli, respectively. To reconstruct odor-evoked population activity at glomerulus-level resolution, we recorded from uniglomerular PNs only because multiglomerular PNs receive mixed information from multiple glomeruli. Of the 172 PNs that were stained successfully, 137 mainly innervated a single glomerulus (Figures 1
C,D1); the other 35 PNs innervated two or more glomeruli and in some cases, almost all glomeruli. The smooth processes of the uniglomerular PNs were entirely inside the glomerulus and additional processes, the putative output terminals, were located outside the glomerulus (Figure 1
D2; Abel et al., 2001
; Sun et al., 1997
). Therefore, we could probe AL output at glomerulus-level resolution and we used these data to analyze olfactory processing in the AL.
Evaluation of Response Variability
To reconstruct the population activity using data from different experiments, trial-to-trial variability must be low; therefore, we examined the reliability of the olfactory responses of uniglomerular PNs (Figure 2
A). Figure 2
B shows raster plots of spike timing of 10 different uniglomerular PNs in response to 10 successive stimuli of cis-3-hexen-1-ol at 0.1 Hz. The first olfactory presentation for this series was the first experience for the moths following eclosion. Different PNs showed different slow temporal response patterns to the same odor. Single odorants elicited various temporal patterns of PNs, with periods of excitation and inhibition. Because ORNs in the silkmoth and other moth species show simple excitatory or inhibitory responses to odors (Pophof, 1997
; Shields and Hildebrand, 2001
), the emergence of various temporal patterns of PN olfactory responses was generated by the circuit properties of the AL (Lemon and Getz, 2000
; Wilson et al., 2004
). In almost all cases, PNs exhibited reliable responses and there were no drastic changes in the response patterns. We examined the evoked firing rates across trials (Figure 2
C) and found a slight decrement in the evoked firing rate as the number of trials increased. The decrement in spiking activity with repeated trials could reflect habituation or increased computation efficiency during olfactory processing (Stopfer and Laurent, 1999
; Grill-Spector et al., 2006
). We examined the relationship between response correlation and the trial-to-trial difference. Figure 2
D represents the correlation between any of the 10 trials with the 1st and 10th trials. We used the first 20 bins from stimulus onset to calculate the Pearson correlation coefficient. The correlation between successive trials was high (r = 0.8779 ± 0.0082; mean ± standard error of the mean, n = 135) and the correlation between non-successive trials almost equally as high (r = 0.8391 ± 0.0053, n = 540; Figures 2
D,E). Thus, the odor-evoked firing rate change of PNs across different trials was reliable, although the spike number decreased slightly (Figure 2
C). Because evaluating both physiology and morphology by intracellular recording is technically difficult, we performed two or three trials per stimulus for most of the experiments conducted during this study.
To reconstruct the population activity using data from different experimental animals, the response pattern of outputs from the same glomerulus must be conserved or remain similar across animals. Although a considerable number of studies have suggested that output neurons from the same glomerulus have similar response profiles (Bhandawat et al., 2007
; Buonviso and Chaput, 1990
; Hansson et al., 1992
; Kanzaki et al., 2003
; Lei et al., 2002
; Reisenman et al., 2005
; Schlief and Wilson, 2007
; Wilson et al., 2004
), we examined the response patterns of different PNs that innervated the same glomeruli in B. mori. We recorded from four pairs and one trio of PNs innervating the same glomeruli (AG3, DCG, DLTG, AD02, and Flowerbase; Figures 1
A,B) and found that the olfactory response profiles for the pairs of PNs were similar (Figure 3
A). When we tested the similarity of olfactory response profiles by the firing rate (Figure 3
B) from stimulus onset to 1 s after onset, the mean correlation coefficient between pairs off PNs innervating the same glomerulus (n = 7 pairs) was significantly higher than that for PNs innervating different glomeruli (n = 554 pairs; p < 0.01, Student’s t-test). We chose the 50-ms time bin for reconstruction because the correlation decreased when we used a smaller bin size (Figure 3
C). These results indicate that the output information from different PNs that innervate the same glomerulus is similar, suggesting that olfactory representations in the AL are nearly identical across individuals. Conservation of olfactory responses across individual animals allowed us to compile data obtained from different moths.
Geometrical Reconstruction of Network Activity
Using compiled data from a set of PNs, we mapped the firing rate change on a digital atlas (Figure 4
; Supplemental Movie 1). The firing rates of uniglomerular PNs from 32 different glomeruli (about half of the 60 ± 2 glomeruli) were transformed into pseudo colors and mapped in their glomerular positions on the digital atlas of B. mori. The lighter colors indicate that uniglomerular PNs from each glomerulus increased their firing rates. Our reconstruction of firing rate dynamics included information from deep glomeruli (∼140 μm), which is one of the advantages of this study over most calcium imaging experiments. The spatial distribution patterns of the outputs of glomeruli by excitable uniglomerular PNs were dynamic and the spatial maps in response to different odors differed. Different odors elicited distinct spatial firing patterns with overlapping glomeruli.
Organization of Evoked Network Dynamics
Next, we analyzed the reconstructed population activity. We considered odor representation as a vector in a virtual coding space. The coding space was defined by the firing rates of 47 PNs for which we had tested all odors at least three times. We analyzed the high dimensional data of the firing rate matrix (time × neuron) using PCA, a linear dimensionality reduction method. We projected the first three PCs to allow visualization (Figure 5
A). These three PCs explained 54.0% of the total variance and contained considerable information for olfactory discrimination. Figure 5
A shows the trajectories of the evolution of PN activity in response to three odors – cis-3-hexen-1-ol (green), linalool (blue), and citral (red) – from stimulus onset to 2 s after onset. After stimulus onset, vectors for different odors moved away from each other in the PC space; therefore, PN population activity evolved in an odor-specific manner. Notably, the trajectories were similar across trials, whereas the firing rates decreased with repeated trials (Figure 2
D). Next, we calculated the Euclidean distance between vectors in each time bin (Figure 5
B). Each trace showed a similar profile. The distances increased at 100 ms after stimulus onset and peaked at 250–300 ms after stimulus onset (150–200 ms after response onset). The distances became more stable at 1000 ms after stimulus onset but remained higher than prior to stimulation. Vectors for different odors maintained their distance even after stimulus offset. Some PNs showed olfactory-evoked activity that lasted several seconds (Figures 2
B and 3
A), and the maintenance of distance in Figure 5
B resulted mainly from these lasting activities. One possible role for odor-evoked lasting activity is working memory, that is, the active maintenance of transient sensory input (Goldman-Rakic, 1995
; Hasselmo and Stern, 2006
). In rat OB slices, some types of interneurons show lasting activity in response to transient electrical stimulation (Inoue and Strowbridge, 2007
; Pressler and Strowbridge, 2006
).
To identify the glomeruli important for discriminating the odors used in this study, we again performed PCA. The coding space was defined by the firing rate of PNs innervating 32 different glomeruli (supplied by 38 PNs). The values of PNs innervating the same glomerulus were averaged (AG3, DCG, DLTG, AD02, and Flowerbase). The first three PCs explain 70.0% of the total variance. Figure 5
C represents the distributions of factor loadings for PCs 1–3. Glomeruli were ordered roughly from the anterior to posterior (right to left) in Figure 5
C. The glomeruli with large factor loadings were not concentrated in specific regions (that is, in the anterior region) but were distributed over the entire AL. This means that each subregion in the AL contains processing units that are sufficient for discriminating odors, suggestive of the robust architecture of the AL glomerular network for olfactory processing.
Next, we examined the relationship between olfactory response profile and anatomical distance between glomeruli. We calculated the Pearson correlation coefficients from 20 bins of firing rates from stimulus onset to 1 s after onset. We used this temporal correlation to represent response similarity (r = −0.0040 ± 0.0153; n = 496). This index is often used to analyze functional magnetic resonance imaging data as functional connectivity (Eguíluz et al., 2005
). We measured the anatomical distance between the geometrical centers of glomeruli innervated by a pair of PNs using the digital atlas (Kazawa et al., 2004
) and found no clear correlation between the response similarity and the anatomical distances between glomeruli (Figure 5
D; r = −0.0566; n = 496). Although the anatomical distance did not strongly affect the global olfactory response profile of PNs, response similarity tended to be relatively low for pairs of PNs situated far from each other.
To examine this relationship in further detail, we visualized the olfactory response profile on the digital atlas of a standard AL (Mikula and Niebur, 2006
). We applied PCA to the matrix in which each element represented the Pearson correlation coefficient of firing rate change between PNs from different glomeruli. Each row in the matrix represented the similarity profile of a single glomerulus to all other glomeruli. Figure 5
E shows the color map of the response profiles. To visualize high dimensional data, we used factor loadings of the first three PCs. The first three PCs explain 79.5% of the total variance and are shown in pseudo colors. Similar colors in Figure 5
E indicate similar olfactory response profiles. Although the color distribution was complicated, two spatial features emerged: glomeruli located medio-anteriorly (superficial region of the AL) had similar response profiles (purple-colored glomeruli) and glomeruli located posteriorly (deep region of the AL) had different olfactory response profiles (that is, yellow-, orange-, pink-, and dark cyan-colored glomeruli). The response profiles of deep glomeruli differed from those of superficial glomeruli, and the response profiles tended to change along the axis connecting the superficial to the deep regions (the antero-posterior axis).
We measured the olfactory responses of uniglomerular PNs from different animals of the same species. We found that the response profiles of PNs that innervate the same glomerulus were similar (Figure 3
) and we reconstructed odor-evoked population activity of these PNs based on their firing rates (Figure 4
). The identification of glomeruli as anatomical landmarks enabled us to reconstruct the population activity using geometrical information. Using this reconstructed population activity, we examined the quantitative relationship between olfactory response profile and the anatomical distance between glomeruli and found that the olfactory response profiles were globally independent of the anatomical distance between the glomeruli (Figure 5
).
Response Variability: Technical Considerations
Several technical limitations should be addressed. Firstly, due to response variability across different animals, the temporal resolution was limited to ∼20 Hz (Figure 3
C) and we could not analyze fast temporal code (Laurent and Naraghi, 1994
). Many factors influence this variability, although we controlled some experimental conditions such as the number of days after eclosion and the insect’s olfactory experience prior to the experiment. Olfactory processing is modified by intrinsic and extrinsic factors such as circadian rhythm (Gatellier et al., 2004
), intracranial concentration of neuromodulators (Kloppenburg and Mercer, 2008
), the mechanosensory input (Zeiner and Tichy, 1998
), and temperature (Zeiner and Tichy, 2000
). Moreover, neurons change their response properties or connectivity in an experience-dependent or activity-dependent fashion (Arevian et al., 2008
; Cheetham et al., 2007
; Le Bé and Markram, 2006
; Stopfer and Laurent, 1999
). In order to render more precise reconstructions, we should control for the age of the animals, stimulus sequence, temperature, and humidity. One way to improve the temporal resolution would be to refer to the odor-evoked oscillation of the local field potential as a temporal landmark (Laurent, 2002
). If this were possible, we could obtain both fast and slow temporal patterns simultaneously. Secondly, the accessibility to neurons was low. This issue could be resolved by using transgenic animals such as Drosophila that express fluorescent markers in neurons of interest (Tamura et al., 2000
; Yamagata et al., 2008
). Targeted recording from genetically labeled neurons could facilitate data compilation (Jacobs et al., 2000
; Jayaraman and Laurent, 2007
; Margrie et al., 2003
; Seki and Kanzaki, 2008
).
Comparison with Imaging Studies
We observed that reconstructed odor-evoked activity was dynamic and that the spatial patterns of the activated glomeruli were dispersed (Figure 4
), as reported in many imaging-based studies (Joerges et al., 1997
; Galizia and Menzel, 2000
; Wang et al., 2003
). The population activities evoked by the terpene molecules linalool and citral were relatively similar as compared to that evoked by the aliphatic alcohol, cis-3-hexen-1-ol (Figures 4 and 5
A,B), suggesting that chemically similar compounds are encoded similarly. This result is consistent with that from a calcium imaging study in another moth species (Hansson et al., 2003
) showing that molecules from the same chemical group elicited similar activity. Although we obtained results similar to those from imaging studies, our reverse-engineering approach has several advantages. First, our spatial map was based on firing rates, which are different from calcium signals. While calcium imaging can monitor the activity of multiple neurons, the calcium signal does not always reflect spiking activity (Moreaux and Laurent, 2007
). Second, we used sharp glass microelectrodes so that we could probe the olfactory response of PNs innervating deep glomeruli. Due to the deflection of excitation and emission light in biological tissue, obtaining optical recordings from deep neurons is difficult. Most of the optical imaging studies report the activity of glomeruli located on the surface of the AL. A two-photon microscope can record the activity at deep depths. However, there are few reports concerning the olfactory response profile of deep glomeruli (Wang et al., 2003
).
Organization of Evoked Network Activity
We quantitatively evaluated the relationship between olfactory response profiles and the anatomical distance between glomeruli (Figure 5
D). Globally, the olfactory response profile was independent of the anatomical distance (Figure 5
D). Pairs of PNs innervating adjacent glomeruli (range: about 20–40 μm) showed diverse values (Figure 5
D). Lateral excitatory interaction could have played a major role in distance-independent functional organization (Aungst et al., 2003
; Christie and Westbrook, 2006
; Olsen et al., 2007
; Root et al., 2007
; Shang et al., 2007
). Silencing the ORNs by genetic engineering has revealed that there is excitatory lateral interaction in the Drosophila AL and the excitatory action from some glomeruli appears to reach the entire AL. In addition, the magnitude of the excitatory connection is independent of the anatomical distance between glomeruli (Olsen et al., 2007
). This spatial feature differs from the center-surround organization observed in the OB (Imamura et al., 1992
; Luo and Katz, 2001
; Yokoi et al., 1995
). The major difference between AL and OB is size, which provides a possible explanation for the distance independence of the olfactory response profile. Various types of functional connections could have evolved because the insect AL is highly compressed in a small physical space (∼1.2 × 106 μm3 in B. mori; Kazawa et al., 2004
). Recently, the distance-independent organization of lateral interaction in the OB has been reported (Cleland and Sethupathy, 2006
; Willhite et al., 2006
).
Additionally, we found that shallow glomeruli had response profiles that were similar to one another and deep glomeruli had response profiles that differed from one another (Figure 5
E). These data suggest the possibility that shallow and deep glomeruli work in different ways during olfactory processing: shallow glomeruli work coordinately whereas deep glomeruli work independently. In this study, the number of samplings from PNs that innervated deep glomeruli was small. Further sampling from deep glomeruli is required to reveal the functional organization of the AL in more detail.
The reverse-engineering approach used in this study involves the compilation of single-cell electrophysiological data and the integration of these data with referential geometric information using anatomical landmarks. This approach could also be applicable to a system that does not have distinct anatomical landmarks. Image processing techniques based on the gross shape of the brain or neuropil might allow comparisons of the neuronal morphology of different animals (Armstrong et al., 1995
; Bjaalie et al., 2005
; Brandt et al., 2005
; Jefferis et al., 2007
; Troyer et al., 1994
). The combination of image processing technique and compiled single-cell recording data will be useful to the investigation of the population activity in large-scale brain network.
The authors declare that the research was conducted in the absence of any commercial or financial relationship that should be construed as a potential conflict of interest.
This research was supported by a grant from a Grant-in-Aid for Scientific Research (B) from the Ministry of Education, Culture, Sports, Science and Technology. We wish to thank Mr. Tomoki Kazawa for technical assistance in glomerular identification and in the use image-processing software. We also thank Drs. Hirokazu Takahashi, Koutaroh Okada, Evan S. Hill, Laureline Gatellier, Yoichi Seki, and S. Shuichi Haupt for their suggestions and critical comments on this manuscript.
A movie is attached to the on-line version of the paper found at the journal website,www.frontiersin.org/neuralcircuits/paper/ 10.3389/neuro.04/001.2008.
Kazawa, T., Terada, M., Seki, Y., Namiki, S., and Kanzaki, R. (2004). Identification of ordinary glomeruli of Bombyx mori facilitates the understandings of neural pathways of antennal lobe neurons. In 14th International Symposium on Olfaction and Taste/38th Japanese Association for Taste and Smell. Abstracts, p 145.
Tamura, T., Thibert, C., Royer, C., Kanda, T., Abraham, E., Kamba, M., Komoto, N., Thomas, J. L., Mauchamp, B., Chavancy, G., Shirk, P., Fraser, M., Prudhomme, J. C., and Couble, P. (2000). Germline transformation of the silkworm Bombyx mori L. using a piggyback transposon-derived vector. Nat. Biotechnol. 18, 81–84.