1
Department of Neuroscience and Pharmacology, University of Copenhagen, Copenhagen, Denmark
2
Section for Neuroscience, Department of Experimental Science, Lund University, Lund, Sweden
Whole-cell recordings were obtained from mossy fibre terminals in adult turtles in order to characterize the basic membrane properties. Calcium imaging of presynaptic calcium signals was carried out in order to analyse calcium dynamics and presynaptic GABA B inhibition. A tetrodotoxin (TTX)-sensitive fast Na+ spike faithfully followed repetitive depolarizing pulses with little change in spike duration or amplitude, while a strong outward rectification dominated responses to long-lasting depolarizations. High-threshold calcium spikes were uncovered following addition of potassium channel blockers. Calcium imaging using Calcium-Green dextran revealed a stimulus-evoked all-or-none TTX-sensitive calcium signal in simple and complex rosettes. All compartments of a complex rosette were activated during electrical activation of the mossy fibre, while individual simple and complex rosettes along an axon appeared to be isolated from one another in terms of calcium signalling. CGP55845 application showed that GABA B receptors mediated presynaptic inhibition of the calcium signal over the entire firing frequency range of mossy fibres. A paired-pulse depression of the calcium signal lasting more than 1 s affected burst firing in mossy fibres; this paired-pulse depression was reduced by GABA B antagonists. While our results indicated that a presynaptic rosette electrophysiologically functioned as a unit, topical GABA application showed that calcium signals in the branches of complex rosettes could be modulated locally, suggesting that cerebellar glomeruli may be dynamically sub-compartmentalized due to ongoing inhibition mediated by Golgi cells. This could provide a fine-grained control of mossy fibre-granule cell information transfer and synaptic plasticity within a mossy fibre rosette.
Mossy fibres constitute one of the important input pathways to the cerebellum (Eccles et al., 1966
). The mossy fibre rosette is the presynaptic element in the cerebellar glomerulus (Cajal, 1888
), a unit of information transfer, which additionally is formed by granule cell dendrites and GABAergic Golgi cell axonal terminals. In order to understand input processing to the cerebellum, the physiological properties of the glomerulus are of importance, and the anatomical organization suggests that each glomerulus is a semi-autonomous unit, isolated in chemical terms from the surrounding cellular elements by a glial sheath (Eccles et al., 1967
; Palay and Chan-Palay, 1974
; Jakab and Hamori, 1988
). The presynaptic rosettes are classified as “simple” or “complex” depending on whether they are spherical or have a complex, branched structure (Cajal, 1888
, 1926
; Craigie, 1926
; Mugnaini et al., 1974
; Palay and Chan-Palay, 1974
). Modulation of mossy fibre Ca2+ influx can occur due to presynaptic GABA B receptors controlling calcium influx during low-frequency mossy fibre activation; this effect was only noticeable following prolonged Golgi cell activation in slices (Mitchell and Silver, 2000
). However, taking advantage of the more intact network available in the turtle cerebellum preparation, we wished to further analyse the timecourse of presynaptic GABA B modulation.
Presynaptic modulation could be considered glomeruli-specific processes, controlled by the local level of synaptic activity in each glomerulus. However, the large extent and branched structure of complex rosettes suggests that local modulation of, e.g. Ca2+ influx may take place within a rosette. The information carried by a mossy fibre show a large degree of divergence, since each rosette may contact up to more than 100 granule cells (Mugnaini et al., 1974
; Palay and Chan-Palay, 1974
). This makes it of interest to analyse whether the input to the granule cells is uniform or can be modulated by localised changes in presynaptic rosette function within a glomerulus.
Therefore, the presynaptic effects of GABA B receptor activation were characterized using high-speed calcium imaging of simple and complex rosettes. While a large amount of physiological information exists on the other cellular elements of the cerebellum, until recently (Rancz et al., 2007
) little direct electrophysiological information was available regarding mossy fibres. In order to provide a basis for the interpretation of mossy fibre calcium imaging experiments, and in order to facilitate comparisons with mammalian physiology, we complemented the imaging experiments with whole-cell patch clamp recordings from individual mossy fibres. We analysed pharmacologically some of the basic electrophysiological properties for the first time by the use of whole-cell recordings, to supplement a previous analysis using extracelluar recordings from mammalian mossy fibre terminals (Maffei et al., 2002
).
Electrophysiological recordings and imaging were done in an in vitro preparation of the adult turtle cerebellum at physiological temperature. This is of importance since sub-physiological temperatures seriously affect presynaptic function (Micheva and Smith, 2005
; Klachko and Stevens, 2006
; Kushmerick et al., 2006
). An additional advantage of this preparation is the ability to maintain the entire cerebellum in vitro (Chan and Nicholson, 1986
); therefore, the synaptic connectivity is not disturbed by slicing procedures.
Parts of these findings have appeared in abstract form (Midtgaard and Jörntell, 1999
; Thomsen et al., 2007
).
Preparation
Adult (carapace length 20–25 cm) turtles (Trachemys scripta elegans) were deeply anesthetized with pentobarbitone (100 mg/kg, im) and decapitated. The surgical procedures comply with Danish legislation and are approved by the controlling body under the Danish Ministry of Justice. The brain was dissected out and transferred to oxygenated Ringers fluid. For electrophysiological experiments, the cerebellum was then isolated. “Blind” patch recordings (cf. Blanton et al., 1989
) were obtained either in the intact cerebellum or in 800 μm parasagittal slices cut on a Vibratome. For visually guided patch recordings from mossy fibres, 250 μm thick parasagittal slices were used. Dissections and experiments were done at room temperature (22–25°C) which is within the physiological temperature range for turtles (∼15–35°C; Gatten, 1974
). For calcium imaging experiments, the cerebellum and the brainstem were isolated and loading of calcium indicator was performed as described below.
The tissue was transferred to the recording chamber (1 ml) and superfused with oxygenated Ringer solution (1 ml/min) composed of (in mM): 120 NaCl, 15 NaHCO3, 5 KCl, 3 CaCl2, 2 MgCl2, and 20 glucose, pH 7.6, bubbled with 98% O2/2% CO2, as described previously (Midtgaard, 1992
; Gabbiani et al., 1994
).
Electrophysiology
Recording electrodes (15–25 MΣ) were filled with a solution of (in mM): 127 KCH3SO4 or K-gluconate, 1.53 Mg-gluconate, 3.7 MgCl2, 5 HEPES, 5 Na+-HEPES and 2 Na2-ATP, pH adjusted to 7.5 with KOH (all chemicals from Sigma). The data presented here were not adjusted for the liquid junction potential between recording electrode and bath. An Ag/AgCl electrode (Clark Electromedical, UK) was used as reference electrode in the bath. Tetrodotoxin (Alomone Labs), picrotoxin (Sigma) and CGP55845 (Tocris, UK) were added to the Ringer solution as indicated in the text. 4-Aminopyridine (4-AP; Sigma) and CoCl2 (Sigma) were added to Ringer solution for at least 20 min each, before the records shown were taken. In other brain regions, GABA A receptors modulate presynaptic release (Engelman and MacDermott, 2004
; Alle and Geiger, 2007
) and Golgi cells use GABA as a transmitter (Ito, 1984
; Dugué et al., 2005
; Simat et al., 2007
). In order to avoid interference from ionotropic GABA receptors, of particular concern during local GABA application (see below), our experiments were conducted in the presence of picrotoxin, a non-competitive antagonist of primarily GABA A-Rs (Yang et al., 2007
), as indicated in the text (cf. Mitchell and Silver, 2000
). The tissue was weighed down in the recording chamber by small silver wires. In some cases the thicker slices were glued to a Sylgard (Dow Corning, NJ, USA) support using cyanoacrylate glue. Patch electrodes were placed by micromanipulators (Luigs and Neumann, Germany) in the granule cell layer under visual guidance, using a Zeiss Axioscope FS equipped with 2× or 4× dry objectives for blind recordings and a 63×/0.9 water-immersion objective for visually-guided patching of individual axons using Dodt Infracontrast (Luigs and Neumann). Data were recorded in current clamp mode using an Axoclamp 2A (DC-10 kHz; Axon Instruments, CA, USA) and subsequently digitized using the Digidata A/D board and pClamp (both Axon Instruments) at digitization rates at or above 10 kHz.
Electrical stimulation of mossy fibres was achieved either by using a pair of twisted, Teflon-coated platinum-iridium wires (100 μm diameter) using pulses of 50 μs duration (up to 300 μA), and placed in the granule cell layer in the same parasagittal plane as the mossy fibre recorded from, or by two Ag/AgCl electrodes (1 ms pulses, up to 10 mA) placed at opposite ends of the cerebellum along the sagittal axis. Both types of stimulus electrodes were connected to a constant current source (Isolator 11; Axon Instruments, CA, USA).
For anatomical identification of axons recorded from electrophysiologically, biocytin (5 mM) or Lucifer Yellow CH (5 mM) was included in the pipette solution. For biocytin staining, the tissue was fixed overnight in 4% paraformaldehyde with 0.2% glutaraldehyde, subsequently incubated with avidin–biotin complex (DAKO, Denmark) and Triton X (Sigma), and reacted with diaminobenzidine (Sigma) (Horikawa and Armstrong, 1988
). The tissue was then dehydrated and mounted (Permount, Sigma) on standard microscope slides with coverslips. In tissue processed this way, significant shrinkage occur, as reported previously (Grace and Llinás, 1985
); in the turtle cerebellum, dimensions are reduced by about 50% (not shown). No attempt to correct for shrinkage was made in the figures presented here. For illustration, Neurolucida (Microbrightfield, MA, USA) was used to trace fibres in order to provide an overview of the axon trajectory in the granule cell layer. For Lucifer Yellow CH staining, the axons were in some cases (visually guided patch recordings) imaged alive, whereas for blind patch recordings the tissue was fixed in 4% paraformaldehyde overnight. In some cases the tissue was recut to thinner slices using a Vibratome before dehydration; in other cases the axon was photographed directly in the intact cerebellum following dehydration and clearing using standard histological procedures.
For acceptance into this study, the axons had to display a stable resting potential when no bias current was passed and had to be able to generate Na+-spikes repetitively when stimulated with trains of short depolarizing pulses at 10–100 Hz. A total of 17 axons were accepted; two of these recorded by visually guided patching in thin slices. The remaining experiments were done by blind patch recordings in the granule cell layer, since visualisation of mossy fibre rosettes was difficult in the granule cell layer, due to presence of heavily myelinated axons in this layer, which in turtles also functions as the white matter found in the mammalian cerebellar cortex (Mugnaini et al., 1974
). All axons were silent unless intracellular or extracellular stimulation was applied, and then only one action potential was evoked per depolarizing stimulus (see Results). This was in contrast to Golgi and granule cells in the granule cell layer which displayed spontaneous and evoked synaptic potentials and robust repetitive Na spike firing, spontaneously and/or in response to depolarization (Midtgaard, 1992
; Gabbiani et al., 1994
). Seven mossy fibres out of the 17 recordings included here were recovered for anatomical identification; all recordings conformed to the electrophysiological criteria described above. Membrane time constants were measured as the time taken to reach 63% of the maximum voltage deflection during a small-amplitude hyperpolarizing current pulse, and spike amplitudes were measured from the resting membrane potential.
Calcium Imaging
For anterograde labelling of mossy fibres, the calcium indicator Calcium Green-1 dextran (molecular weight 5 kD; Molecular Probes, OR, USA) was dissolved in physiological saline at a concentration of 40 mM. Two microlitres of this solution was pressure-injected into the brainstem and the cerebellar peduncles using a glass pipette with a ∼20 μm diameter tip (Beierlein et al., 2004
). Both sides of the brainstem were injected, primarily corresponding to the position of the vestibular nuclei along the fourth ventricle (Künzle, 1983a
) up to the peduncles. However, it was commonly observed that the dye spread to other areas in the brainstem, making it likely that fibres other than vestibulo-cerebellar axons were labeled in this study (Künzle, 1982
, 1983b
). The brainstem-cerebellum preparation was left to incubate overnight at 5°C in a sealed container with Ringer solution. This ensured adequate time for the dye to fill the mossy fibres. The following day the cerebellum was carefully separated from the brainstem and placed in the recording chamber ventral side up. Fine silver wires were placed transversely over the peduncles and near the caudal tip of the cerebellum for mechanical stabilization. For fluorescence imaging, a Polychrome light source (TILL Photonics, Germany) and a Sensicam (640 × 480 pixels; PCO, Germany) were used together with 63×/0.9 water immersion objective (Zeiss, Germany). This resulted in each pixel covering an area of 0.17 μm on each side at full camera resolution. However, 2 × 2 pixel binning was commonly used, and for high-speed imaging (up to 100 Hz) 4 × 4 or 8 × 8 pixel binning was applied. In some cases a 0.5× lens was added in front of the camera to enlarge the field of view. Axons were readily visible from the ventral surface of the cerebellum through the ependymal cell layer, and could sometimes be followed for up to ∼1 mm. As indicated in Figure 1
, rosettes were often widely spaced along the axon. Mossy fibres were identified based on their predominantly parasagittal course and the occasional occurrence of complex rosettes. In contrast, Purkinje cell axons are placed deeper in the cerebellum, just below the Purkinje cell layer, and display few boutons in the granule cell layer (Mugnaini et al., 1974
); furthermore, the labelling procedure is commonly expected only to label axons anterogradely (Beierlein et al., 2004
). The mossy fibres usually had a diameter of ∼1–2 μm, consistent with anatomical data (Mugnaini et al., 1974
). In this way we could image activity-related fluorescence signals from presynaptic terminals of myelinated CNS axons in the intact adult cerebellum. Forty mossy fibres were included in this study. Axons were accepted for analysis if they displayed a robust increase in fluorescence when the fibres were activated electrically, and if they could follow repetitive activation at 10–100 Hz. For the intensity of fluorescence excitation used in the present experiments, bleaching was measured as the decrease in fluorescence during a 5-s long illumination without electrical stimulation, and was 0.58% per second of illumination (n = 4, SD ± 0.43%). The data were not corrected for this bleaching. A series of pictures was collected for each stimulation, consisting of a number of reference pictures, followed by pictures accompanied by electrical stimulation. The electrical stimulation was synchronised with picture acquisition. Background fluorescence was measured in a region away from the axon of interest, and for each picture the background was subtracted from the raw fluorescence of the axon under study. Four to six prestimulus pictures were averaged and used as reference. dF/F (%) was calculated as 100 × (Factive − Freference)/Freference. Images were analysed using custom written routines in IDL (ITT Visual Information Solutions); additional data analysis was performed using Origin (Microcal, MA, USA), including analysis of fluorescence decay time constants. Decay time constants were considered to be bi-exponential if the fast and the slow time constants differed by more than a factor of four. The data shown here are for the most part an average of the responses to four identical stimulations. For illustration, pseudocolor dF/F images were spatially smoothed using a 3 × 3 median filter. Mossy fibre complex rosettes often extend substantially in the z-axis. It was therefore rare to find a complex rosette that could be imaged in toto in one focal plane. Therefore, Z-stacks were recorded by stepping the microscope 1 μm in the focus axis by a PC program controlling the Luigs and Neumann microscope z-axis drive. For each focal plane, one or several picture series were acquired during electrical stimulation. For illustration of rosette anatomy, a maximum intensity projection of the z-stack was used as a basis. However, for clarity, additional picture montage was undertaken using data from individual focal planes as indicated in the text.
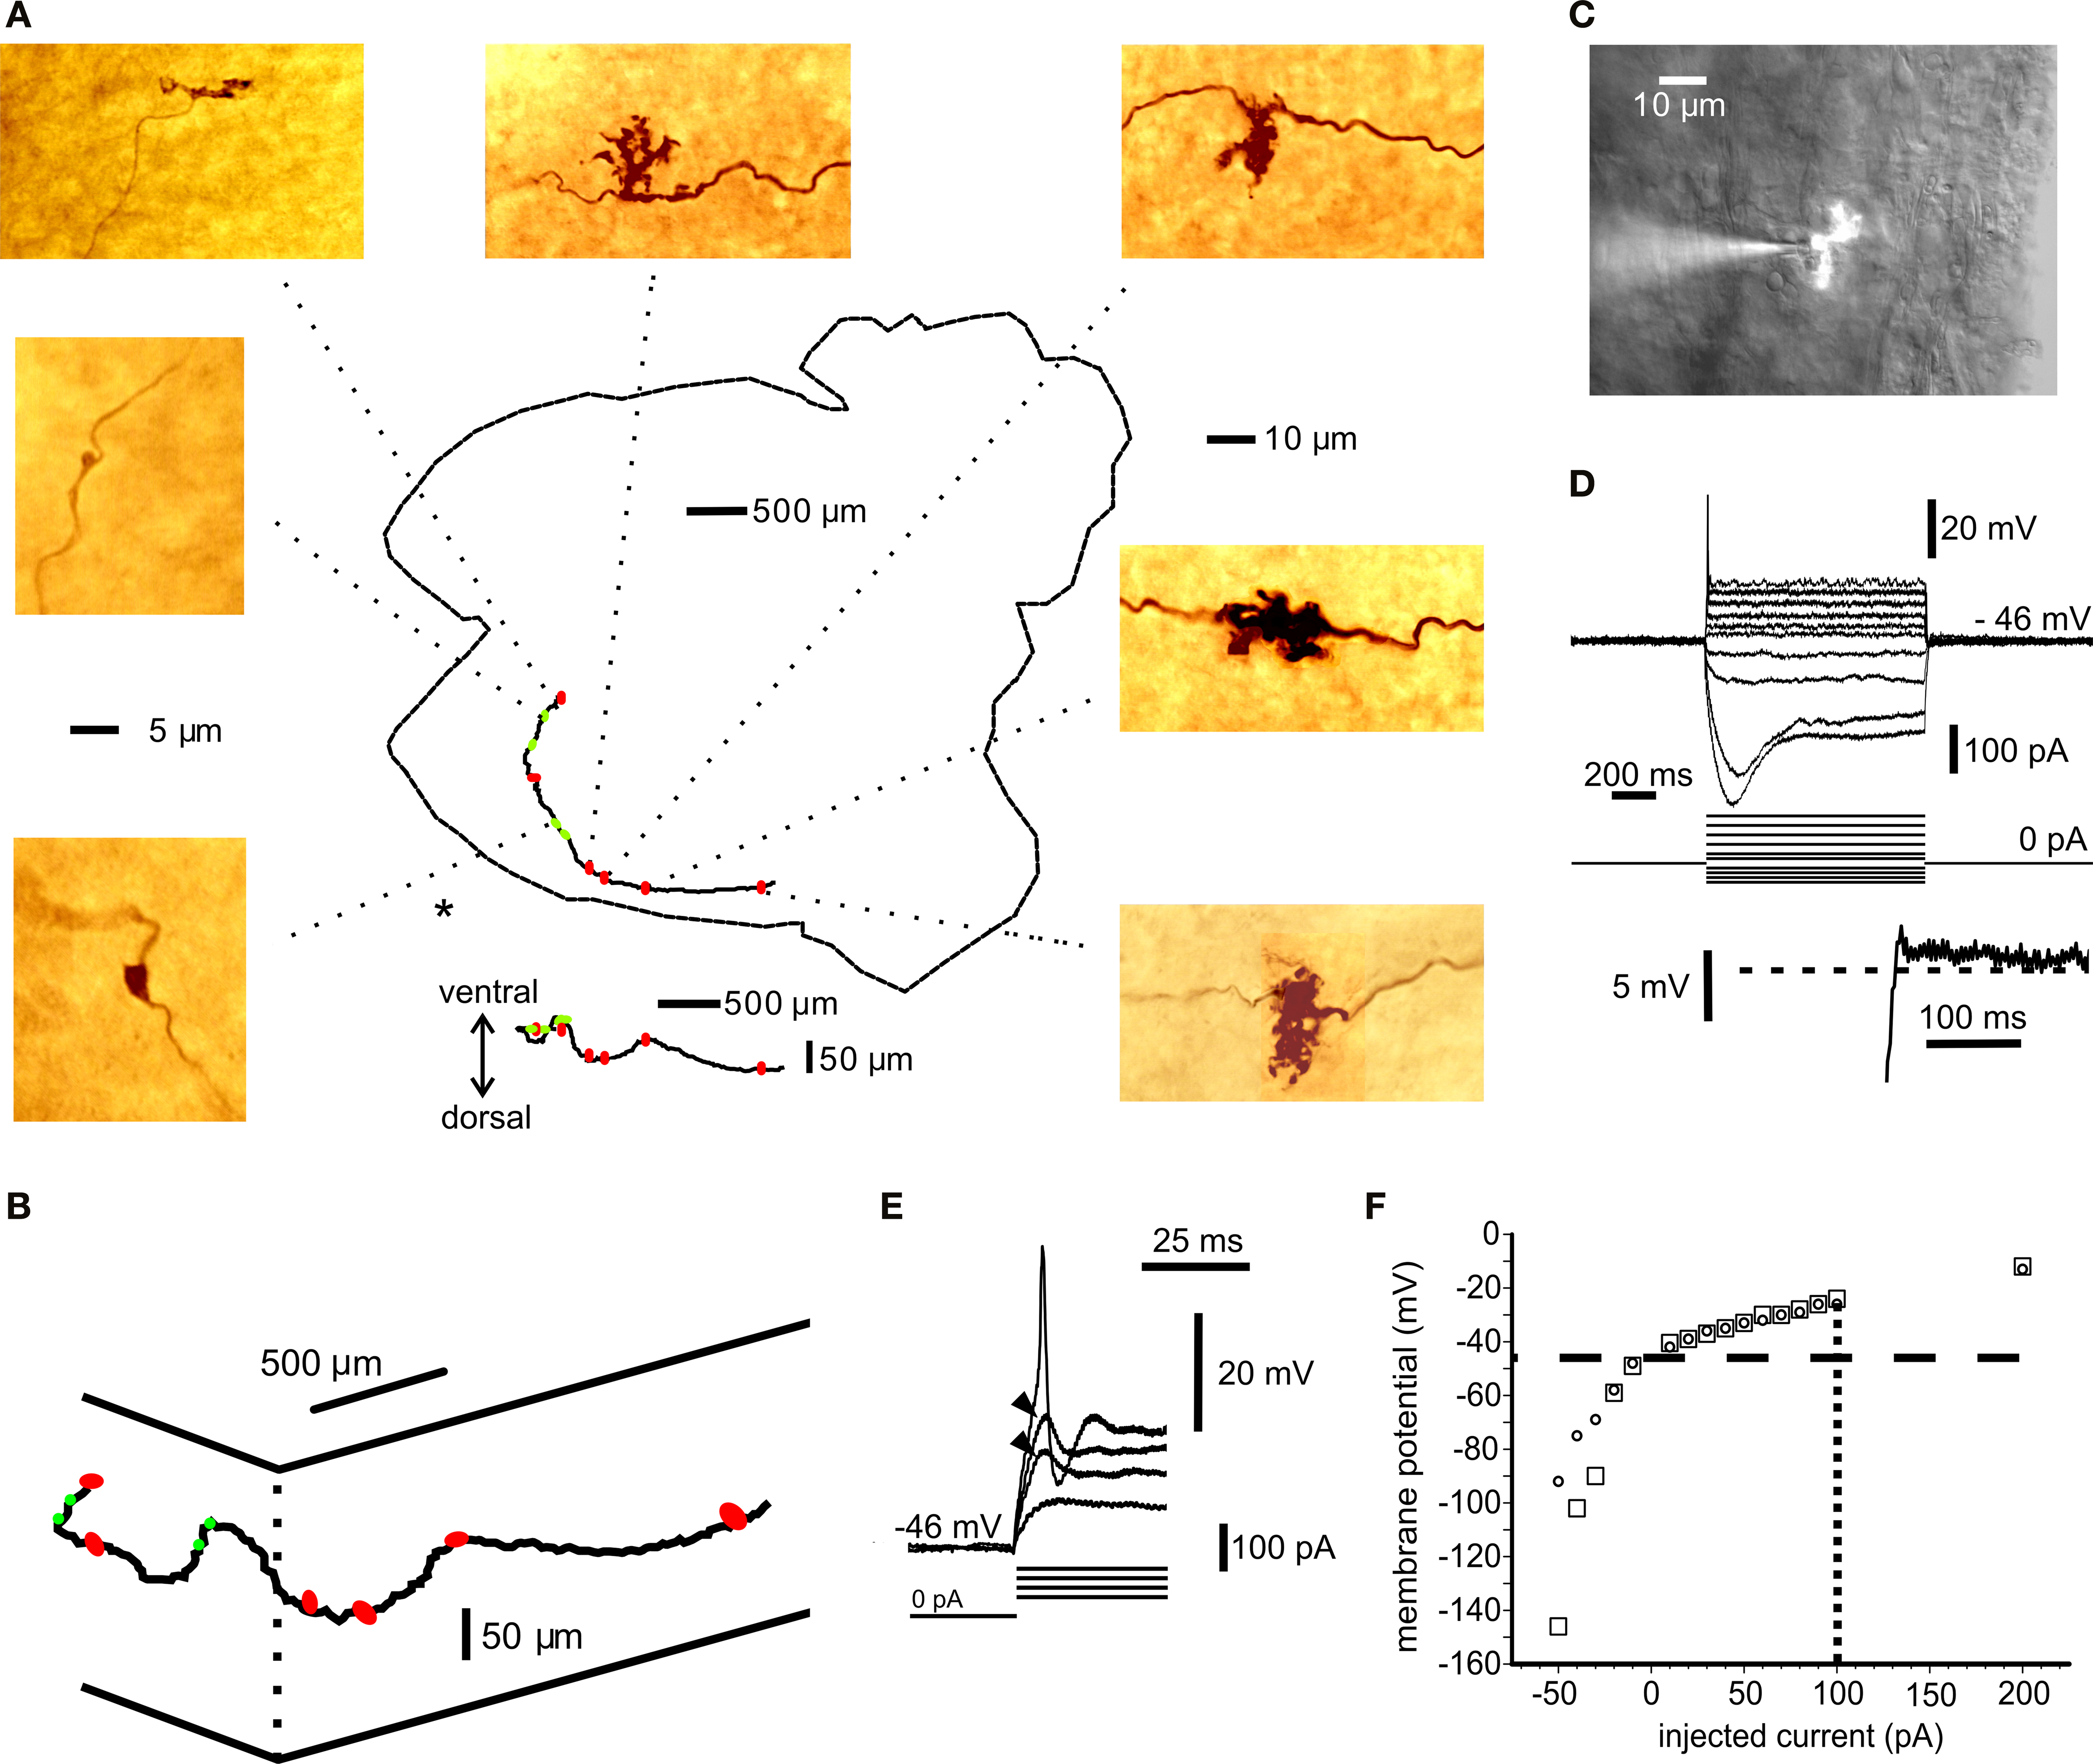
Figure 1. Anatomical and electrophysiological identification of mossy fibres. (A) Montage of a mossy fibre trajectory in the whole-cerebellum preparation. The axon was injected with biocytin and reacted with DAB. The cerebellum is viewed from the ventral (ependymal) side. The cerebellar outline is indicated, including the cerebellar peduncles (right). The caudal tip (to the left) has been cut in two with a small sagittal incision to facilitate flattening of the tissue during fixation. The axon was traced using Neurolucida and the position of each identifiable rosette is indicated by red oval (complex rosette) or green circle (simple rosette) superimposed on the cerebellar outline. Below the cerebellar profile is the vertical projection of the Neurolucida tracing to show the dorsal–ventral variations in the mossy fibre trajectory. Colour pictures show representative rosettes. Some of the complex rosettes cannot be resolved in detail due to closely packed branching. All dimensions are measured in the mounted, dehydrated tissue. The 5-μm scale applies to the simple rosettes above and below the scale bar; the 10-μm scale applies to the remaining rosettes. (B) 3-D diagram of Neurolucida mossy fibre tracing from (A). Elevated (ventral) view approximately from the position indicated by “*” in (A). Complex rosettes indicated by red symbols, simple rosettes indicated by green symbols. (C) Montage of bright field image and fluorescence picture of mossy fibre rosette patch recording in a cerebellar slice. Axon injected with Lucifer Yellow. (See also Video in Supplementary Material). (D) I–V curves for axon in (B). Inset below shows rebound depolarization following the largest hyperpolarizing pulse in (D). (E) Local, subthreshold responses (arrowheads) and spike at the beginning of depolarizing pulse in (D). Spike amplitude in (D) and (E) low-pass filtered by recording electrode. (F) Summary graph of I–V responses in (D) at steady state (circles) and at 100 ms after pulse-onset for depolarizing pulses (squares). In the hyperpolarizing direction the peak values are indicated by squares. Data points from additional sweeps are included in (F), omitted for clarity from (D). Resting membrane potential −46 mV (horizontal, dashed line); spike current threshold +100 pA (vertical, dotted line).
Local GABA Application
In order to analyse the local processing within a cerebellar glomerulus, GABA was applied locally prior to electrical activation of the mossy fibre. GABA (1 mM; Sigma) was dissolved in Ringers fluid and pressure ejected from a glass pipette (tip diameter ∼5 μm) using 15–25 ms air pulses (0.5–1 psi). To control for ejection of GABA, 10 μM Alexa-568 (Molecular Probes) was added to the pipette content. Using excitation at 488 nm and a bandpass (center: 535 nm, bandwidth: 45 nm; Omega Optical) emission filter for calcium imaging, the pressure and puff-duration used produced a minimal increase in background fluorescence due to Alexa; this puff-related signal was corrected using the fluorescence signal from pressure ejections not accompanied by electrical stimulations. Care was taken not to include glomeruli where movement artefacts caused by the GABA ejection interfered with image recording and analysis. Data from four glomeruli were accepted into this paper.
Statistics
Data are expressed as means ± standard deviation (SD), and significance levels were tested using Student’s paired t-test. Unless otherwise noted, the significance level used was 0.05.
Electrophysiological Properties of Mossy Fibre Rosettes
The basic cerebellar circuitry, including the glomerular structure, is highly conserved in different species (Cajal, 1888
, 1926
; Craigie, 1926
; Mugnaini et al., 1974
; Palay and Chan-Palay, 1974
). In the turtle cerebellum, mossy fibres mainly course along the anterior–posterior direction in the granule cell layer following their entry through the cerebellar peduncles (Mugnaini et al., 1974
), but fibres can make significant course changes in the coronal plane (Figure 1
).
Mossy fibres are myelinated, but myelination is interrupted at the presynaptic rosettes (Mugnaini et al., 1974
; Palay and Chan-Palay, 1974
). Extracellular recordings have previously been made from elements in the turtle cerebellar granule cell layer, including mossy fibres (Walsh et al., 1972
, 1974
). We obtained whole cell recordings from mossy fibres by blind patch in the intact cerebellum (Blanton et al., 1989
) in 15 cases and by visually guided patch in thin slices in two cases. The fibres were identified by the inclusion of biocytin or a fluorescent dye in the recording pipette and their distinct electrophysiological properties (see Materials and Methods; Figure 1
A: whole mount fibre; Figure 1
C: visually patched fibre; Movie in Supplementary Material). The recordings from visually identified rosettes revealed similar firing patterns as blind recordings. For a subset of randomly selected fibres, the resting potential was −53.4 mV (SD ± 5.3; n = 7), the input resistance for hyperpolarizing current pulses at rest was 1064 MOhm (SD ± 285; n = 7) and the membrane time constant was 22.3 ms (SD ± 16.3; n = 7). A strong outward rectification was present just above the resting potential and subthreshold for spike initiation, while hyperpolarizing current steps revealed a much larger steady state input resistance and a pronounced inward rectification, followed by a repolarizing overshoot (Figures 1
D,F). The inward and outward rectifying properties are similar to the responses seen in other types of axons (Bostock, 1995
; Geiger and Jonas, 2000
), including cerebellar mossy fibres in mammals (Rancz et al., 2007
). In addition, at identified presynaptic terminals, a local response subthreshold for spike initiation was observed (Figure 1
E). Spike-amplitude was 66.9 mV (SD ± 14.6, n = 7) and duration 1.22 ms (half-width; SD ± 0.38; n = 7). The basic electrophysiological responses of mossy fibres have been described by Rancz et al. (2007)
, and extracellular recordings have been used to characterize membrane conductances in mammalian mossy fibre terminals (Maffei et al., 2002
). In order to characterize the underlying conductances using whole-cell recordings, we analysed the pharmacology of some fundamental electrophysiological properties found in mossy fibres. TTX (10 μM) abolished the local potential and the fast spike (n = 6; Figures 2
A,B).
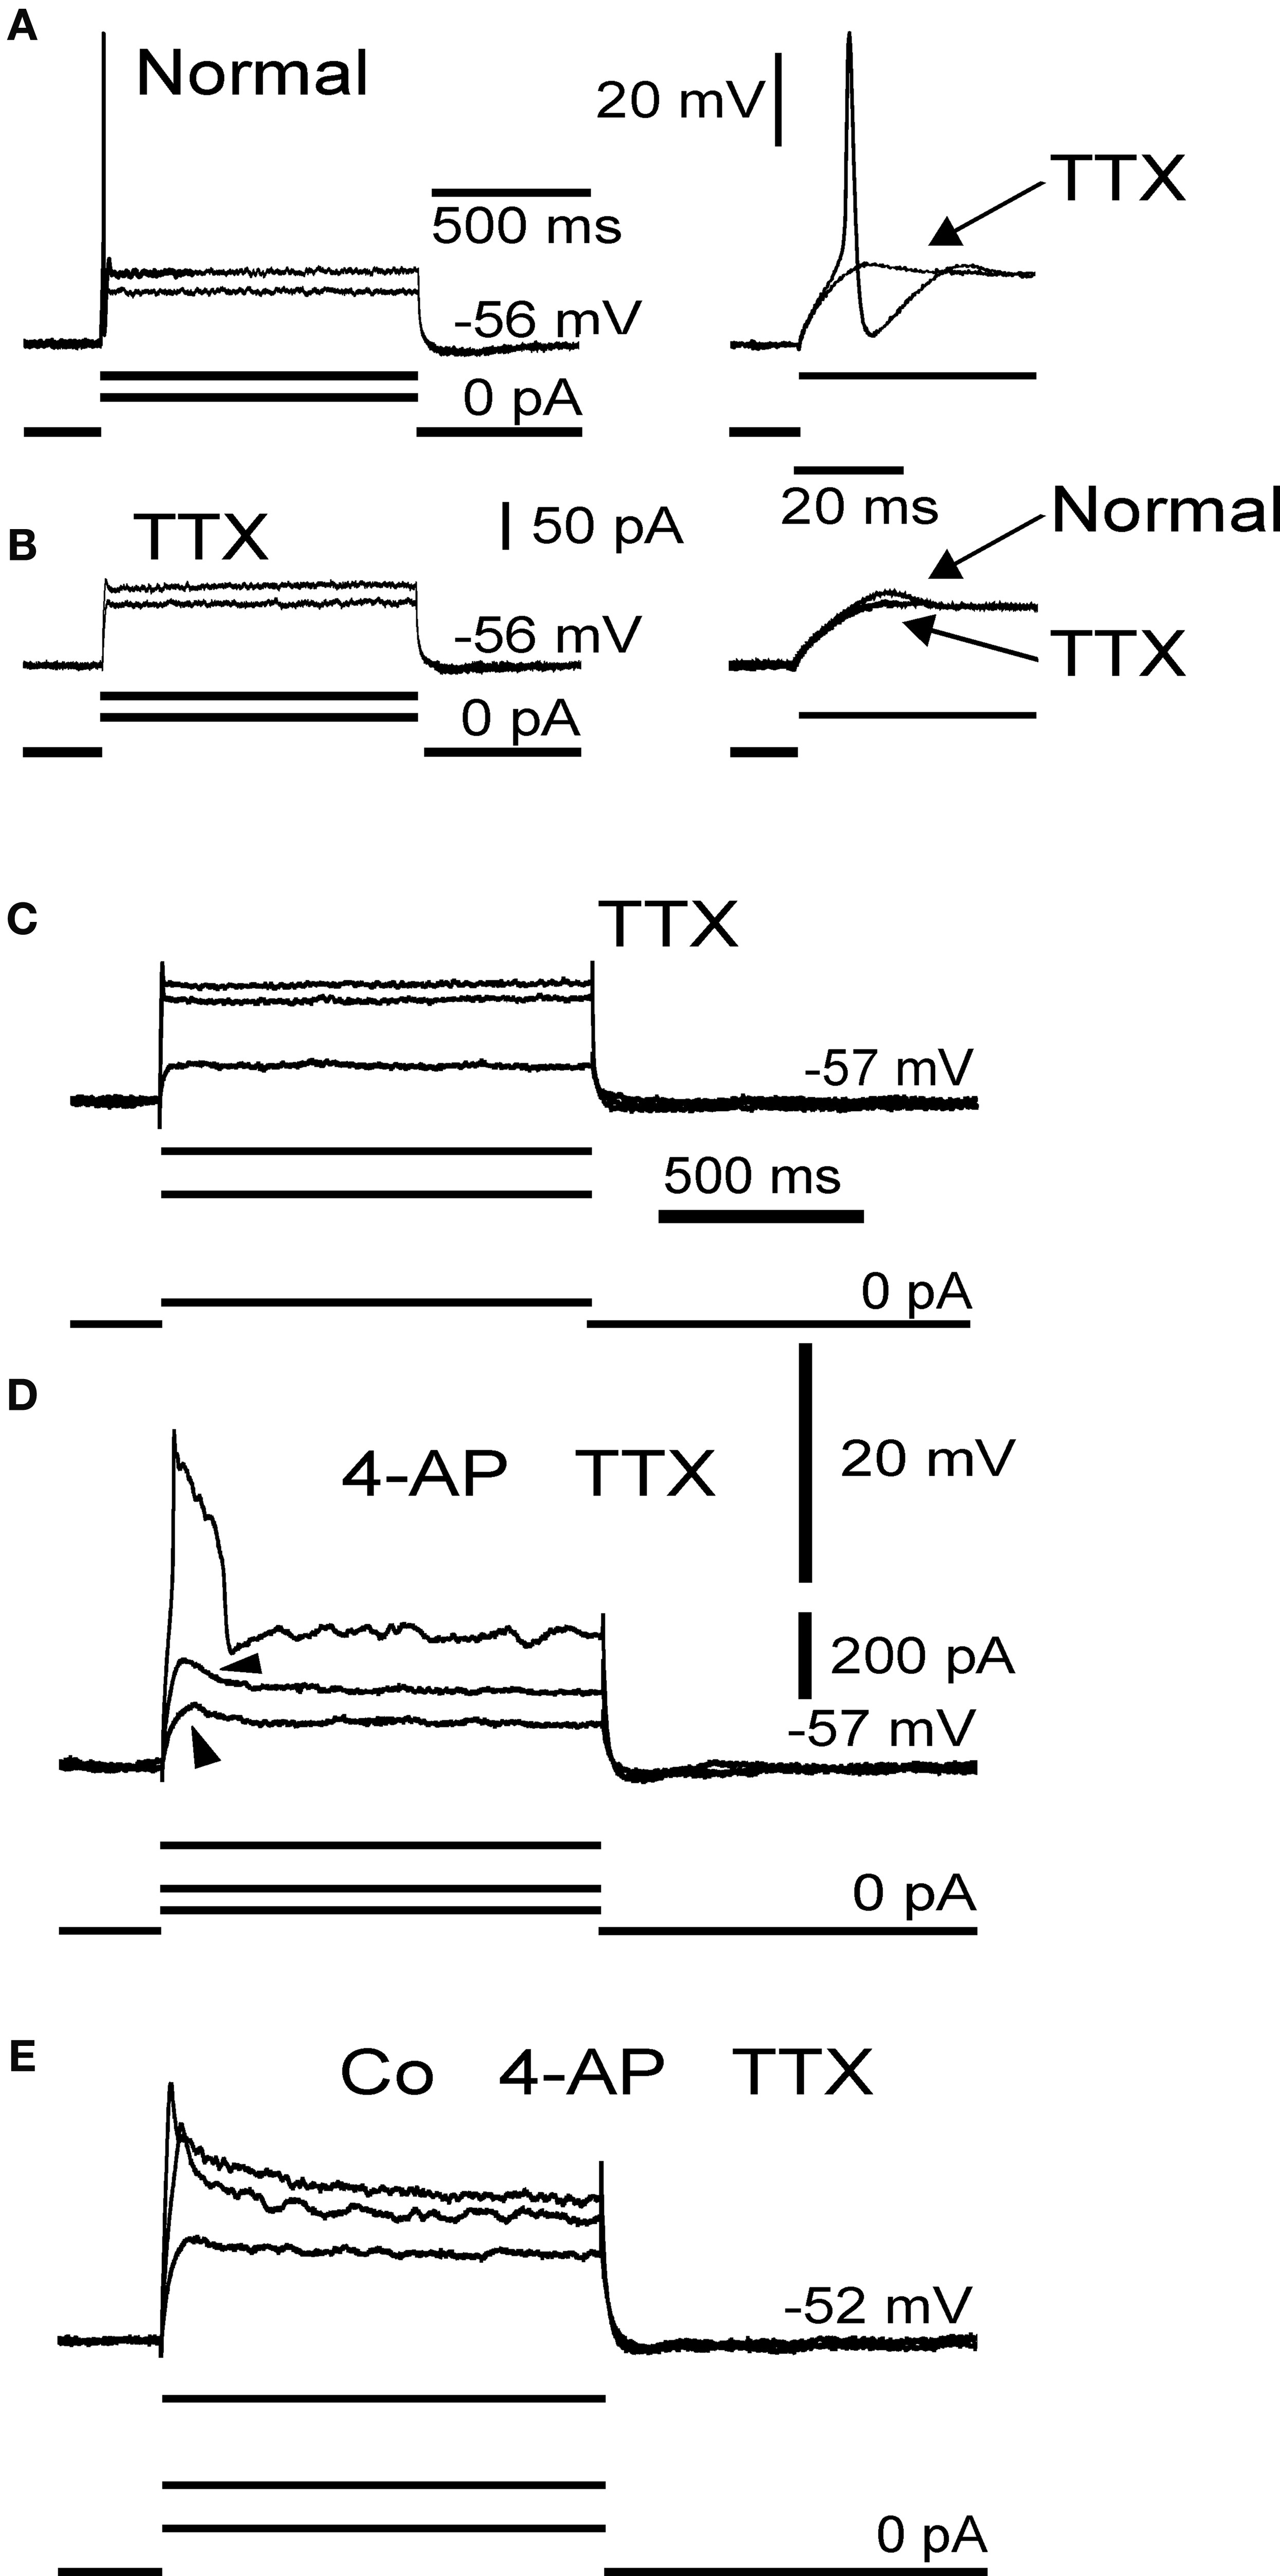
Figure 2. Electrophysiological membrane properties in mossy fibre rosettes. Responses to sub- and suprathreshold depolarization in normal medium (A) and in 10 μM TTX (B). Inset to right in (A) shows suprathreshold responses in normal medium and in TTX (arrow). Inset to right in (B) shows local response in normal medium (arrow) and the effect of TTX (arrow) on the local response. (C) Control sweeps in 10 μM TTX. (D) Addition of 4-AP (1 mM) results in local responses (arrowheads) and a large long lasting spike, which was blocked by Co2+ (E); 3 mM. (A), (B) and (C–E) from two different axons.
Following addition of TTX, the strong outward rectification remained, with little evidence of regenerative inward currents (Figures 2
B,C). However, addition of 4-AP (1 mM), a potassium channel blocker, reduced the strong outward rectification and revealed a large spike and subthreshold responses (n = 4; Figure 2
D). This spike and the subthreshold responses were abolished by addition of the calcium channel blocker Co2+ (2 mM, n = 3; Figure 2
E), indicating that they were regenerative responses due to voltage-gated calcium channels. This is consistent with previous data showing the presence of high-threshold voltage gated (N, P/Q-type) calcium channels in mammalian mossy fibre terminals (Mitchell and Silver, 2000
; Maffei et al., 2002
) and other presynaptic terminals such as the calyx of Held (see Schneggenburger and Forsythe, 2006
for review). The effect of 4-AP on mossy fibre axon and bouton excitability is consistent with effects on potassium currents seen in other axons and presynaptic terminals (cf. Southan and Robertson, 1998
; Tan and Llano, 1999
; Dodson et al., 2003
; Ishikawa et al., 2003
; Schneggenburger and Forsythe, 2006
).
Extracellular stimulation evoked an all-or-none Na+ spike (Figure 3
A). Using long depolarizing current pulses, only one spike was evoked at the onset of stimulation (Figures 1
C and 2
A). However, mossy fibres followed high-frequency repetitive stimulation when short stimulation pulses were used (Figures 3
C–E). Turtle mossy fibres started to show spike initiation failures when the stimulus frequency exceeded ∼125 Hz. Thus, the stimulation frequencies routinely used in this study (∼10–100 Hz) cover most of the mossy fibre firing frequency range in turtles.
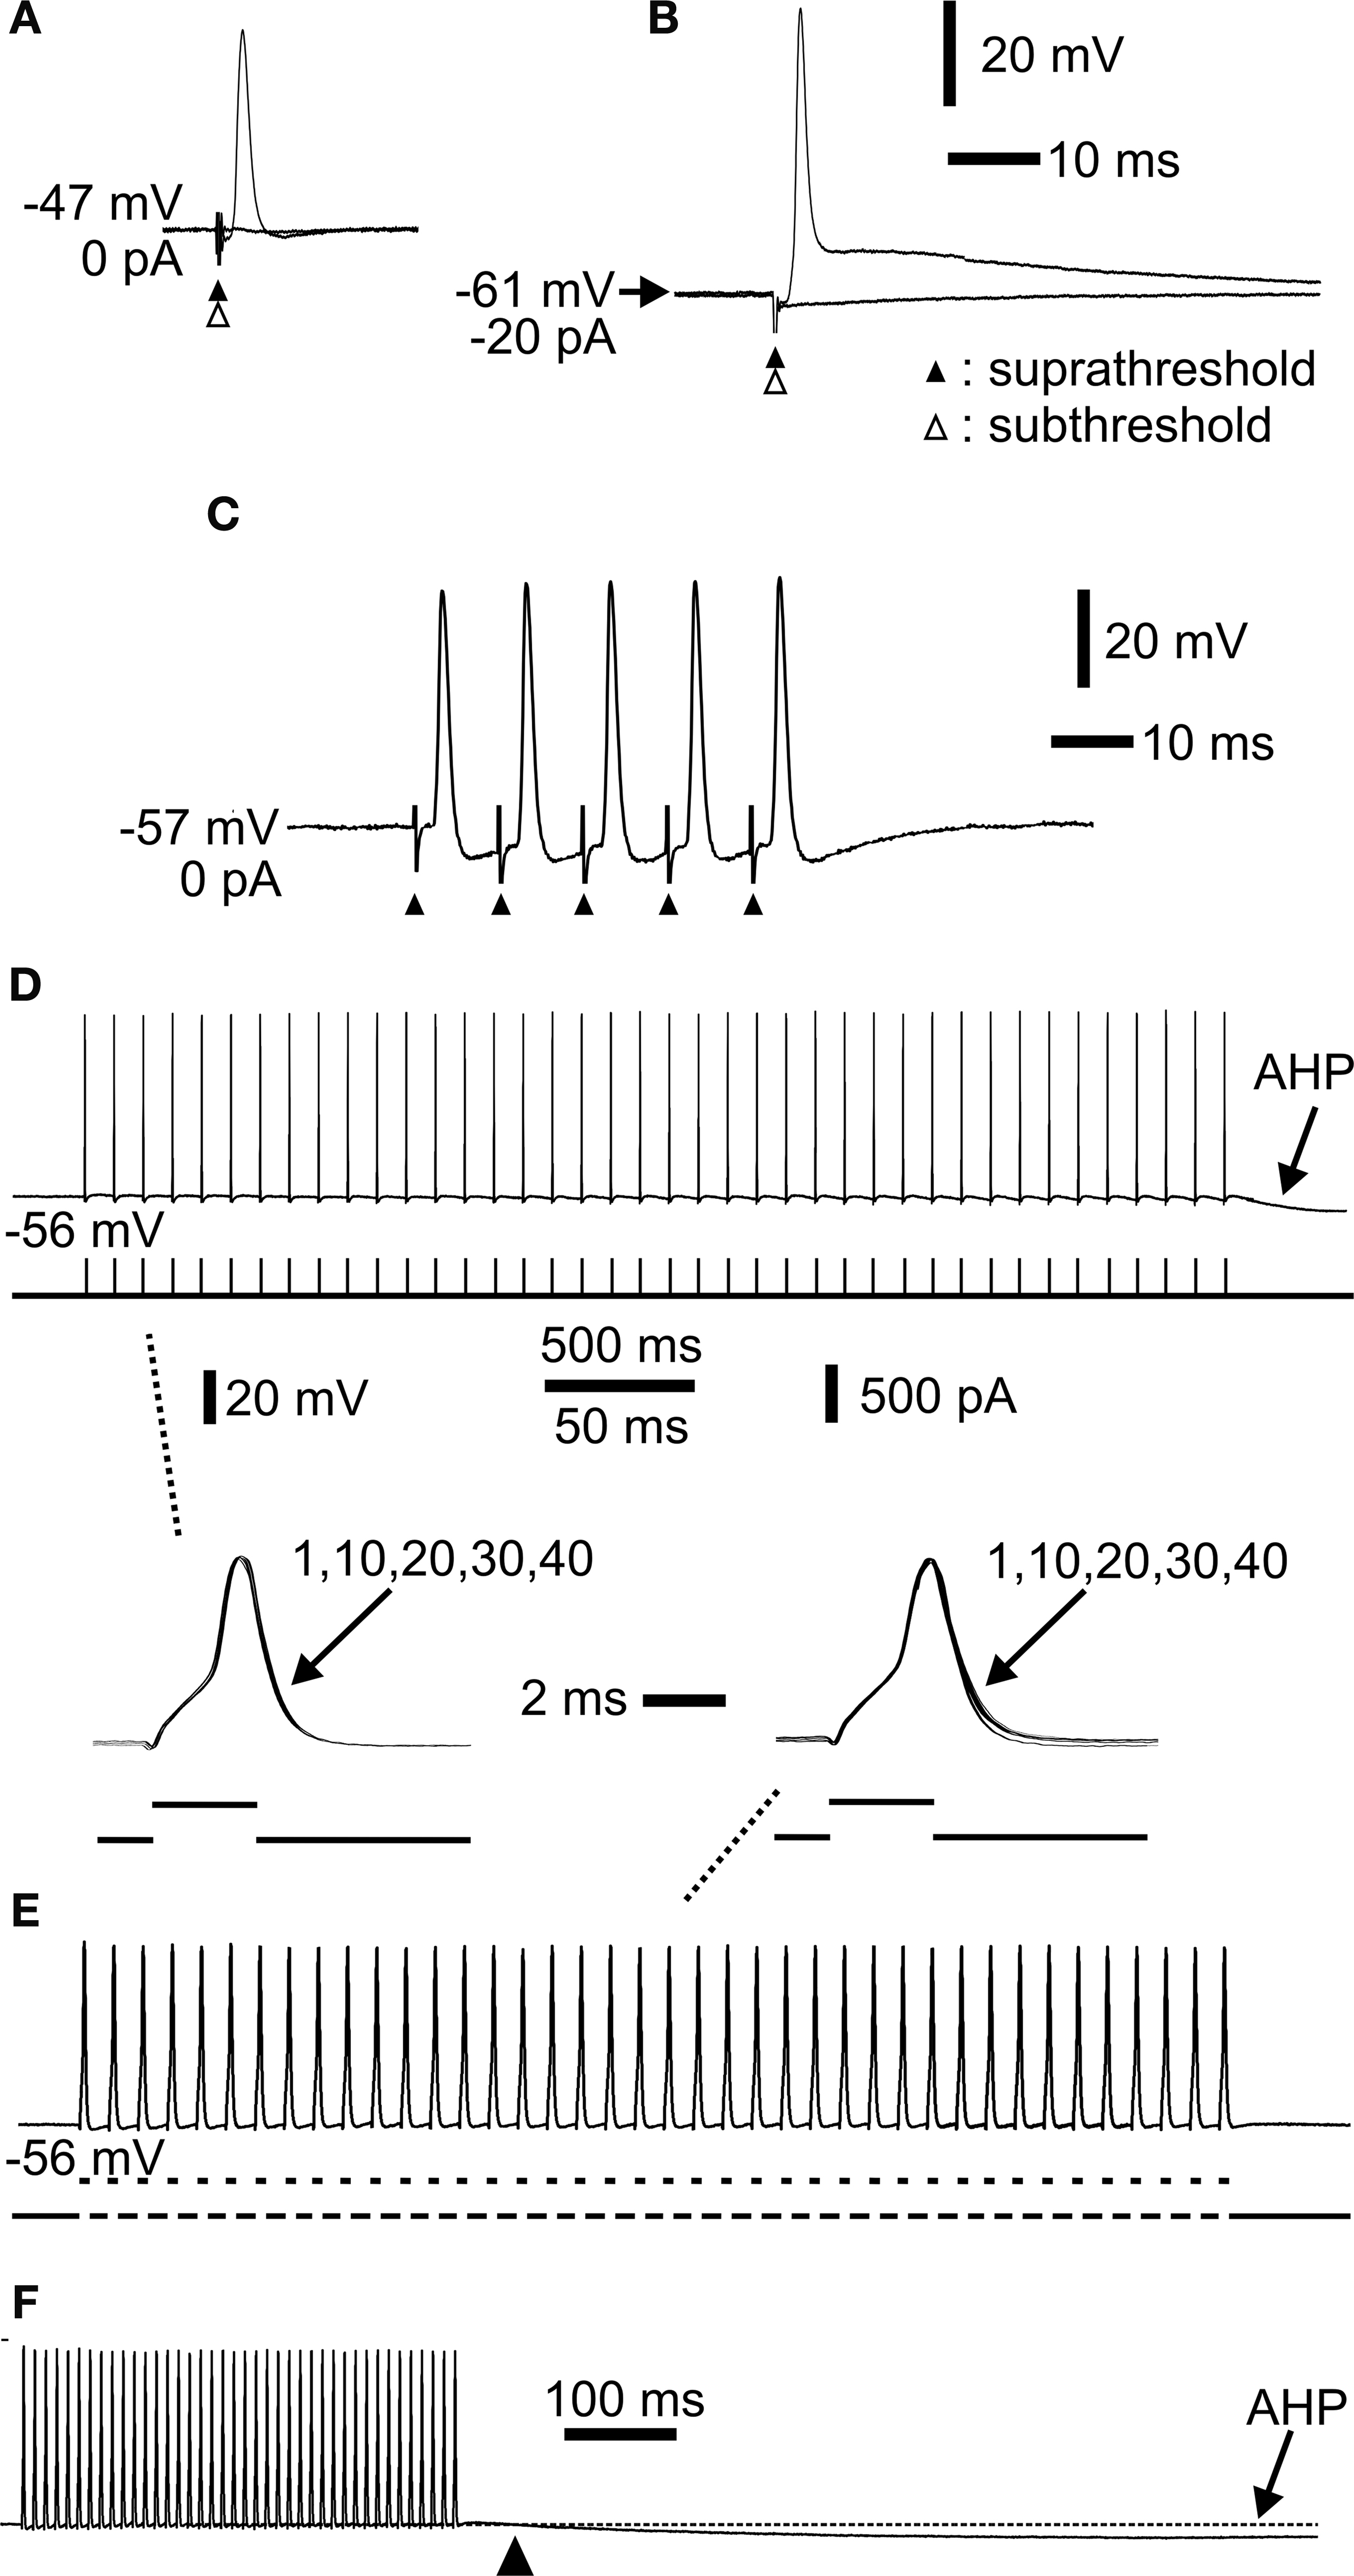
Figure 3. Extracellular stimulation and repetitive spiking of mossy fibres. (A) Extracellular sub- (open arrowhead) and suprathreshold (closed arrowhead) stimulation showing all-or-none spike. (B) Hyperpolarization by constant current injection through the electrode shows a robust spike. Lowering the extracellular stimulus intensity (open arrow head) shows the all-or-none nature of the spike. (C) Repetitive activation at 100 Hz. The spikes readily followed the stimulation. Each stimulus is indicated by an arrowhead. (D) Repetitive activation at 10 Hz by a train of short current pulses injected intra-axonally through the recording electrode. Note afterhyperpolarization (AHP) following cessation of activation. Inset below to the left (indicated by dashed line) shows spike 1, 10, 20, 30 and 40 superimposed. No change in spike amplitude or duration was observed. (E) Repetitive activation at 100 Hz by a train of short current pulses injected intra-axonally. Inset above to the right (indicated by dashed line) shows spike 1, 10, 20, 30 and 40 superimposed. (F) The same sweep as in (E) at a slower sweep speed where the AHP had time to develop (arrowhead indicates start of AHP). Same voltage and current calibrations in (D), (E), (F) and insets between (D) and (E). Separate time calibrations are indicated between insets, and in (F), respectively. (A), (B), (C), and (D–F) from three different axons.
Mammalian mossy fibres in vivo may fire for prolonged periods (van Kan et al., 1993
), while intense burst activity may sometimes occur at very high frequencies (Jörntell and Ekerot, 2006
). It was therefore of interest to characterize the spiking pattern of mossy fibres during continuous repetitive activation and during shorter bursts. Long-lasting repetitive spiking in hippocampal mossy fibres increases spike width and transmitter release due a cumulative inactivation of I-A type potassium currents (Geiger and Jonas, 2000
). Since such currents may be 4-AP sensitive and may therefore be present in cerebellar mossy fibres (Figure 2
), it was of interest to analyse the Na+ action potentials during repetitive Na+ spike firing. Little or no change in spike amplitude and duration was observed at stimulation frequencies between 10 and 100 Hz, and number of stimulations up to 40 (Figures 3
D,E). Thus, compared to hippocampal mossy fibres (Geiger and Jonas, 2000
), little activity-dependent modulation of electrophysiological spike parameters seemed to occur in cerebellar mossy fibres for stimulation frequencies covering a substantial part of the firing frequency range. One electrophysiological effect of repetitive spiking was notable, however. Prolonged spiking was followed by an afterhyperpolarization (AHP; Figures 3
D,F), lasting up to more than 5 s depending on the frequency and number of preceding Na+ spikes. The AHP was abolished by TTX together with the spiking (not shown; n = 6). Such an AHP is commonly found in axons, due to Na+/K+ pump activity (Gordon et al., 1990
; Morita et al., 1993
; Debanne, 2004
; Kim et al., 2007
). In principle, long-lasting AHPs could lead to spike propagation failure (for review, see Koester and Sakmann, 2000
; Debanne, 2004
). However, the mossy fibres followed stimulation with little sign of spike initiation failure (Figures 3
D,E). In conclusion, adult cerebellar mossy fibres seemed electrophysiologically capable of reliable information transfer with little activity-dependent changes in spike parameters or spiking patterns over the range of firing frequencies used in our subsequent imaging experiments.
Presynaptic Calcium Signalling
Fluorescence imaging of simple and complex mossy fibre rosettes
Next, we wished to examine the local calcium dynamics at individual presynaptic rosettes, since this may provide a basis for local modulation of information transfer from mossy fibres to granule and Golgi cells. Therefore, we filled mossy fibres with dextran-coupled Calcium Green-1 (Beierlein et al., 2004
; see Materials and Methods) in order to image fluorescence signals from individual rosettes during electrical stimulation of mossy fibres.
Spatial distribution of calcium signals. Complex rosettes were defined as structures having side branches from the main axon (Figures 1 and 4
A; Mugnaini et al., 1974
). Extracellular electrical stimulation of mossy fibres elicited an all-none-increase in fluorescence signal when using single shocks and when using trains of stimuli (Figure 4
B). The stimulus-evoked increase in fluorescence was abolished by TTX (Figure 4
B). Together, the results in Figure 4
B indicate that the fluorescence signal was due to all-or-none Na+-dependent action potentials. Spontaneous calcium transients were not observed, in line with an absence of spontaneous spiking in patch-recordings from the axons. Complex rosettes showed a parallel increase in fluorescence from the part of the rosette along the axon as well as from the side branches and satellite boutons (Figures 4
C,D). No stimulus-evoked increase in fluorescence was apparent over the axon proper (Figures 4
C,D). This was observed for single stimuli as well as for trains of stimuli, and suggests that a complex rosette functions as a unit with regard to action potential activation of the different sub-compartments, i.e. branches and satellite boutons.
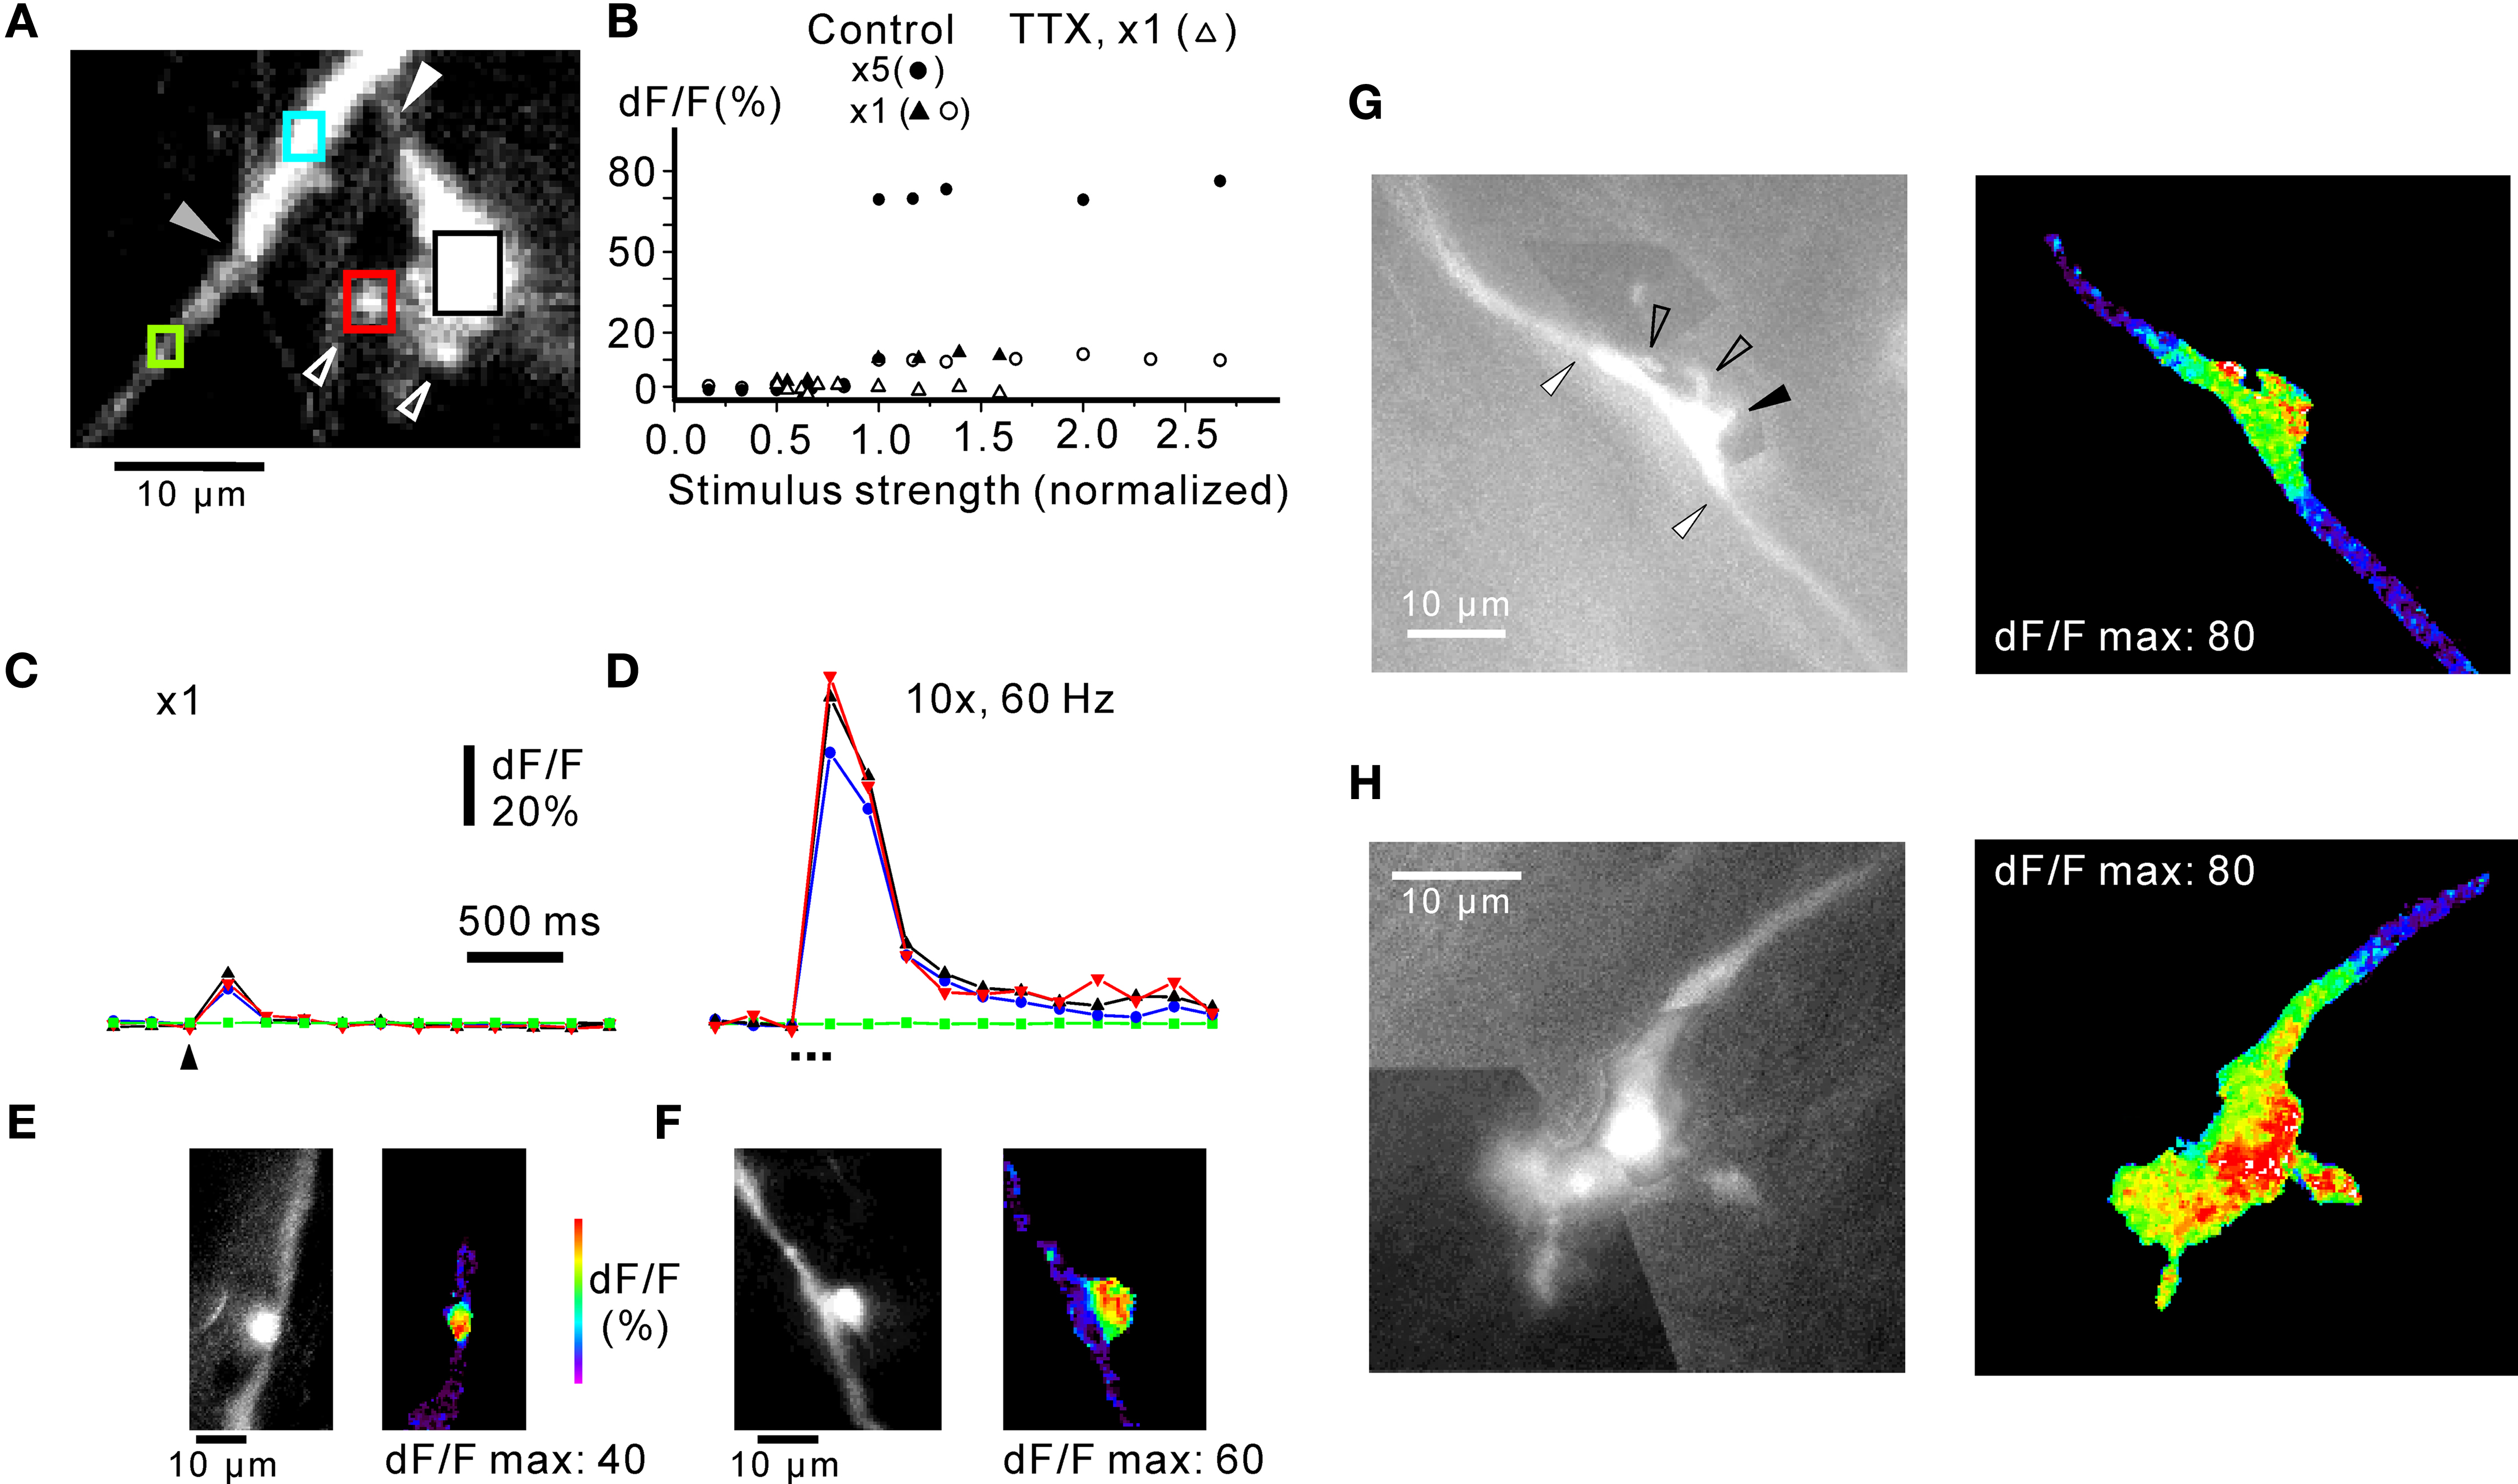
Figure 4. Distribution of calcium signals in mossy fibre rosettes. (A) Complex rosette with large sidebranch connected to the axon via a small, narrow “neck” (white arrowhead). Small “satellite” boutons connected to the large sidebranch are indicated with open arrowheads. The transition between the axon proper (lower left) and the rosette along the axon (upper right) is indicated by the grey arrowhead. (B) Responses from rosette in (A) to extracellular stimulation with one shock (open circles) and five shocks at 50 Hz (black circles). Stimulus strength was normalized to threshold value. The same stimulus threshold was found for one shock and for five shocks. Both single and repetitive stimulations resulted in an all-or-none response, consistent with an action potential underlying the fluorescence signal. TTX (10 μM) abolished the all-or-none response (control: black triangles; TTX: open triangles). Responses with circles and triangles from two different axons. (C) Changes in fluorescence signals from rosette in (A) to a single stimulus. The regions of interest are indicated by coloured squares in (A), corresponding to the coloured lines in (C). Note locations responding with a similarly sized increase in fluorescence (rosette along the axon, blue; large sidebranch, black; satellite bouton, red), while no signal was observable over the axon (green). (D) Responses of the same locations to 10 stimuli at 60 Hz. Note the lack of response in the axon (green) and that all other locations show a robust increase in fluorescence. Frame rate in (C) and (D): 200 ms. (E, F) maximum fluorescence signals recorded from simple rosettes in response to five shocks at 50 Hz. The simple bouton in (F) was slightly offset from the axon (cf. Figure 1
). Note the highly localised fluorescence signal. (G) Complex rosette en passage with small sidebranches (open arrowheads). One sidebranch projected out of the focal plane (black arrowhead). The transitions between the rosette and the axon are indicated by white arrowheads. Pseudocolour picture to the right represents maximum response to five shocks at 50 Hz. For three rosettes, stimulated with five shocks at 50 Hz, the decay from maximum dF/F at the rosette declined along the mossy fibre axon proper with a length constant of 1.7 μm, SD ± 1.1 μm. (H) Terminal complex rosette. The terminal rosette consisted of a series of enlargements along the axon, and small satellite boutons connected through fine stalks. For clarity, black-and-white pictures of complex rosettes in (G) and (H) are montages of pictures taken at different focal planes in a z-stack. Colour picture shows maximum response to five shocks at 50 Hz. Frame rate in (G) and (H) 200 ms. Responses in (C) is an average of four picture series. Experiments in (A)–(D) in 30 μM picrotoxin and 50 μM CGP55845.
Simple rosettes were enlargements in-line with the axon (Figures 1
A and 4
E; Mugnaini et al., 1974
) or slightly offset in relation to the axon (Figures 1
A and 4
F). In both cases, stimulus-evoked calcium transients were confined to the anatomically defined rosette, with little spread along the axon. Complex rosettes could display intricate 3-dimensional branching and/or could extend for up to about 100 μm along the axon (cf. Mugnaini et al., 1974
), and such rosettes were difficult to image in toto. However, in other cases smaller complex rosettes could be illustrated more readily (Figure 4
G). Several small side branches were given off (see also Movie in Supplementary Material; Mugnaini et al., 1974
), some them projecting out of the focal plane. Stimulus-evoked fluorescence signals were readily detected in the small side-branches (Figure 4
G, right panel). Terminal rosettes (Figure 4
H) were found in six cases. They often branched elaborately and were difficult to visualize in their full extent (Mugnaini et al., 1974
; Palay and Chan-Palay, 1974
). Other terminal rosettes were more confined (cf. Figure 1
A; cf. Mugnaini et al., 1974
). Figure 4
H shows a terminal rosette consisting of a series of bouton-like structures, with occasional fine branches terminating in small boutons. In a few terminal rosettes, such small “satellite” boutons were detected up to 10–15 μm from a parent axon, apparently connected to it by a very fine fibre, sometimes with several boutons en passage (cf. Palay and Chan-Palay, 1974
). However, the fine threadlike fibre was often difficult to image in its full extent. As for the complex rosettes en passant, all side branches and small “satellite” boutons of terminal rosettes showed stimulus-induced fluorescence signals (Figure 4
H, right panel).
In conclusion, mossy fibres show action potential-evoked calcium signals in simple and complex rosettes. Side branches and satellite boutons showed robust calcium signals, and all compartments appeared to be activated in parallel (cf. Figures 4
C,D). All mossy fiber regions which displayed a stimulus-evoked calcium signal corresponded to the anatomical description of complex and simple rosettes (Mugnaini et al., 1974
), while regions corresponding to the axon proper, i.e. the myelinated part where only spike conduction takes place, showed little or no calcium signals. The data also showed that calcium signalling in simple and complex rosettes was highly localised, as relatively sharp transitions (Figures 4
E–G) between zones with fluorescence increases and the axon were commonly observed. This indicates that individual simple and complex rosettes along a fibre (Figure 1
) are effectively isolated in terms of calcium signalling since the average distance between rosettes is 15–20 μm (Mugnaini et al., 1974
; Palay and Chan-Palay, 1974
). In this aspect these relatively thick myelinated CNS axons appear similar to fine unmyelinated axons (Koester and Sakmann, 2000
; Collin et al., 2005
).
For single shocks, the relative change in fluorescence (dF/F) was for simple rosettes 11.2% (SD ± 9.2, n = 13). Following stimulation, only two out of nine boutons (22%) analysed showed a mono- exponential fluorescence decay, while in other boutons a bi-exponential decay was best fitted, with the fast time constant of 156 ms (SD ± 68, n = 5) and a slow decay time-constant was 3711 ms (SD ± 2540, n = 5). The proportion of boutons with single- versus bi-exponential fluorescence decay was comparable to findings in other brain regions (35%: Koester and Sakmann, 2000
). For a short train of stimuli (five shocks, 50 Hz) in simple rosettes, the fast decay time constant was 160 ms (SD ± 60, n = 5) and the slow decay time-constant was 1349 ms (SD ± 606, n = 5). For complex rosettes, the fast decay time constant was 136 ms (SD ± 101, n = 4) and the slow decay time-constant was 1414 ms (SD ± 1024, n = 4). All the data were obtained in the presence of CGP55845 (60 μM), in order to block presynaptic GABA B receptors (see below), and picrotoxin (25 μM).
Responses to repetitive mossy fibre activation
In order to examine the time-dependence of the fluorescence signal, fibres were stimulated repetitively at rates covering a wide range of firing frequencies while the signal was measured at high frame rates (Figures 5
A,B).
The fluorescence response increased with the number of stimuli at 100 Hz, close to the maximum frequency for turtle mossy fibres. In order to resolve the contributions to each response in a stimulus train, the fibres were activated at 50 Hz, while being imaged at high speed (100 Hz; Figure 5
B). Each mossy fibre activation gave a noticeable increase in the fluorescence signal (Figures 5
B and 6
A). To summarize these findings, stimulus-response curves were constructed for different numbers of stimuli at low stimulation frequency (12.5 Hz), medium frequency (50 Hz) and near-maximal frequency (100 Hz; Figure 5
C). At 12.5 Hz, a near-plateau in fluorescence change was eventually reached after 30 to 40 stimulations, but responses to individual stimuli could still be seen (Figure 6
A), consistent with the individual spike response to each stimulus (Figures 3
D,E). A similar tendency to plateauing of the calcium signal has been shown to be due to an increased rate of calcium removal from the cytosol at high calcium concentrations (Ohnuma et al., 1999
). The fluorescence signal did not reach a plateau during long-lasting activation at 50–100 Hz, but the rate of rise of the dF/F signal decreased somewhat during the stimulus train. The continued increase in dF/F during long-lasting intense stimulation suggests that calcium indicator saturation (Beierlein et al., 2004
) was not reached. In order to simplify the analysis in most of the experiments below, the number of stimuli was chosen to be well below the levelling-off of the response curves seen at the higher frequencies. In conclusion, mossy fibres produce spike-burst related fluorescence signals where the contribution of each spike can be discerned, and the imaging system was able to follow the responses over a range of activation frequencies covering a large part of the frequency range of turtle mossy fibre firing.
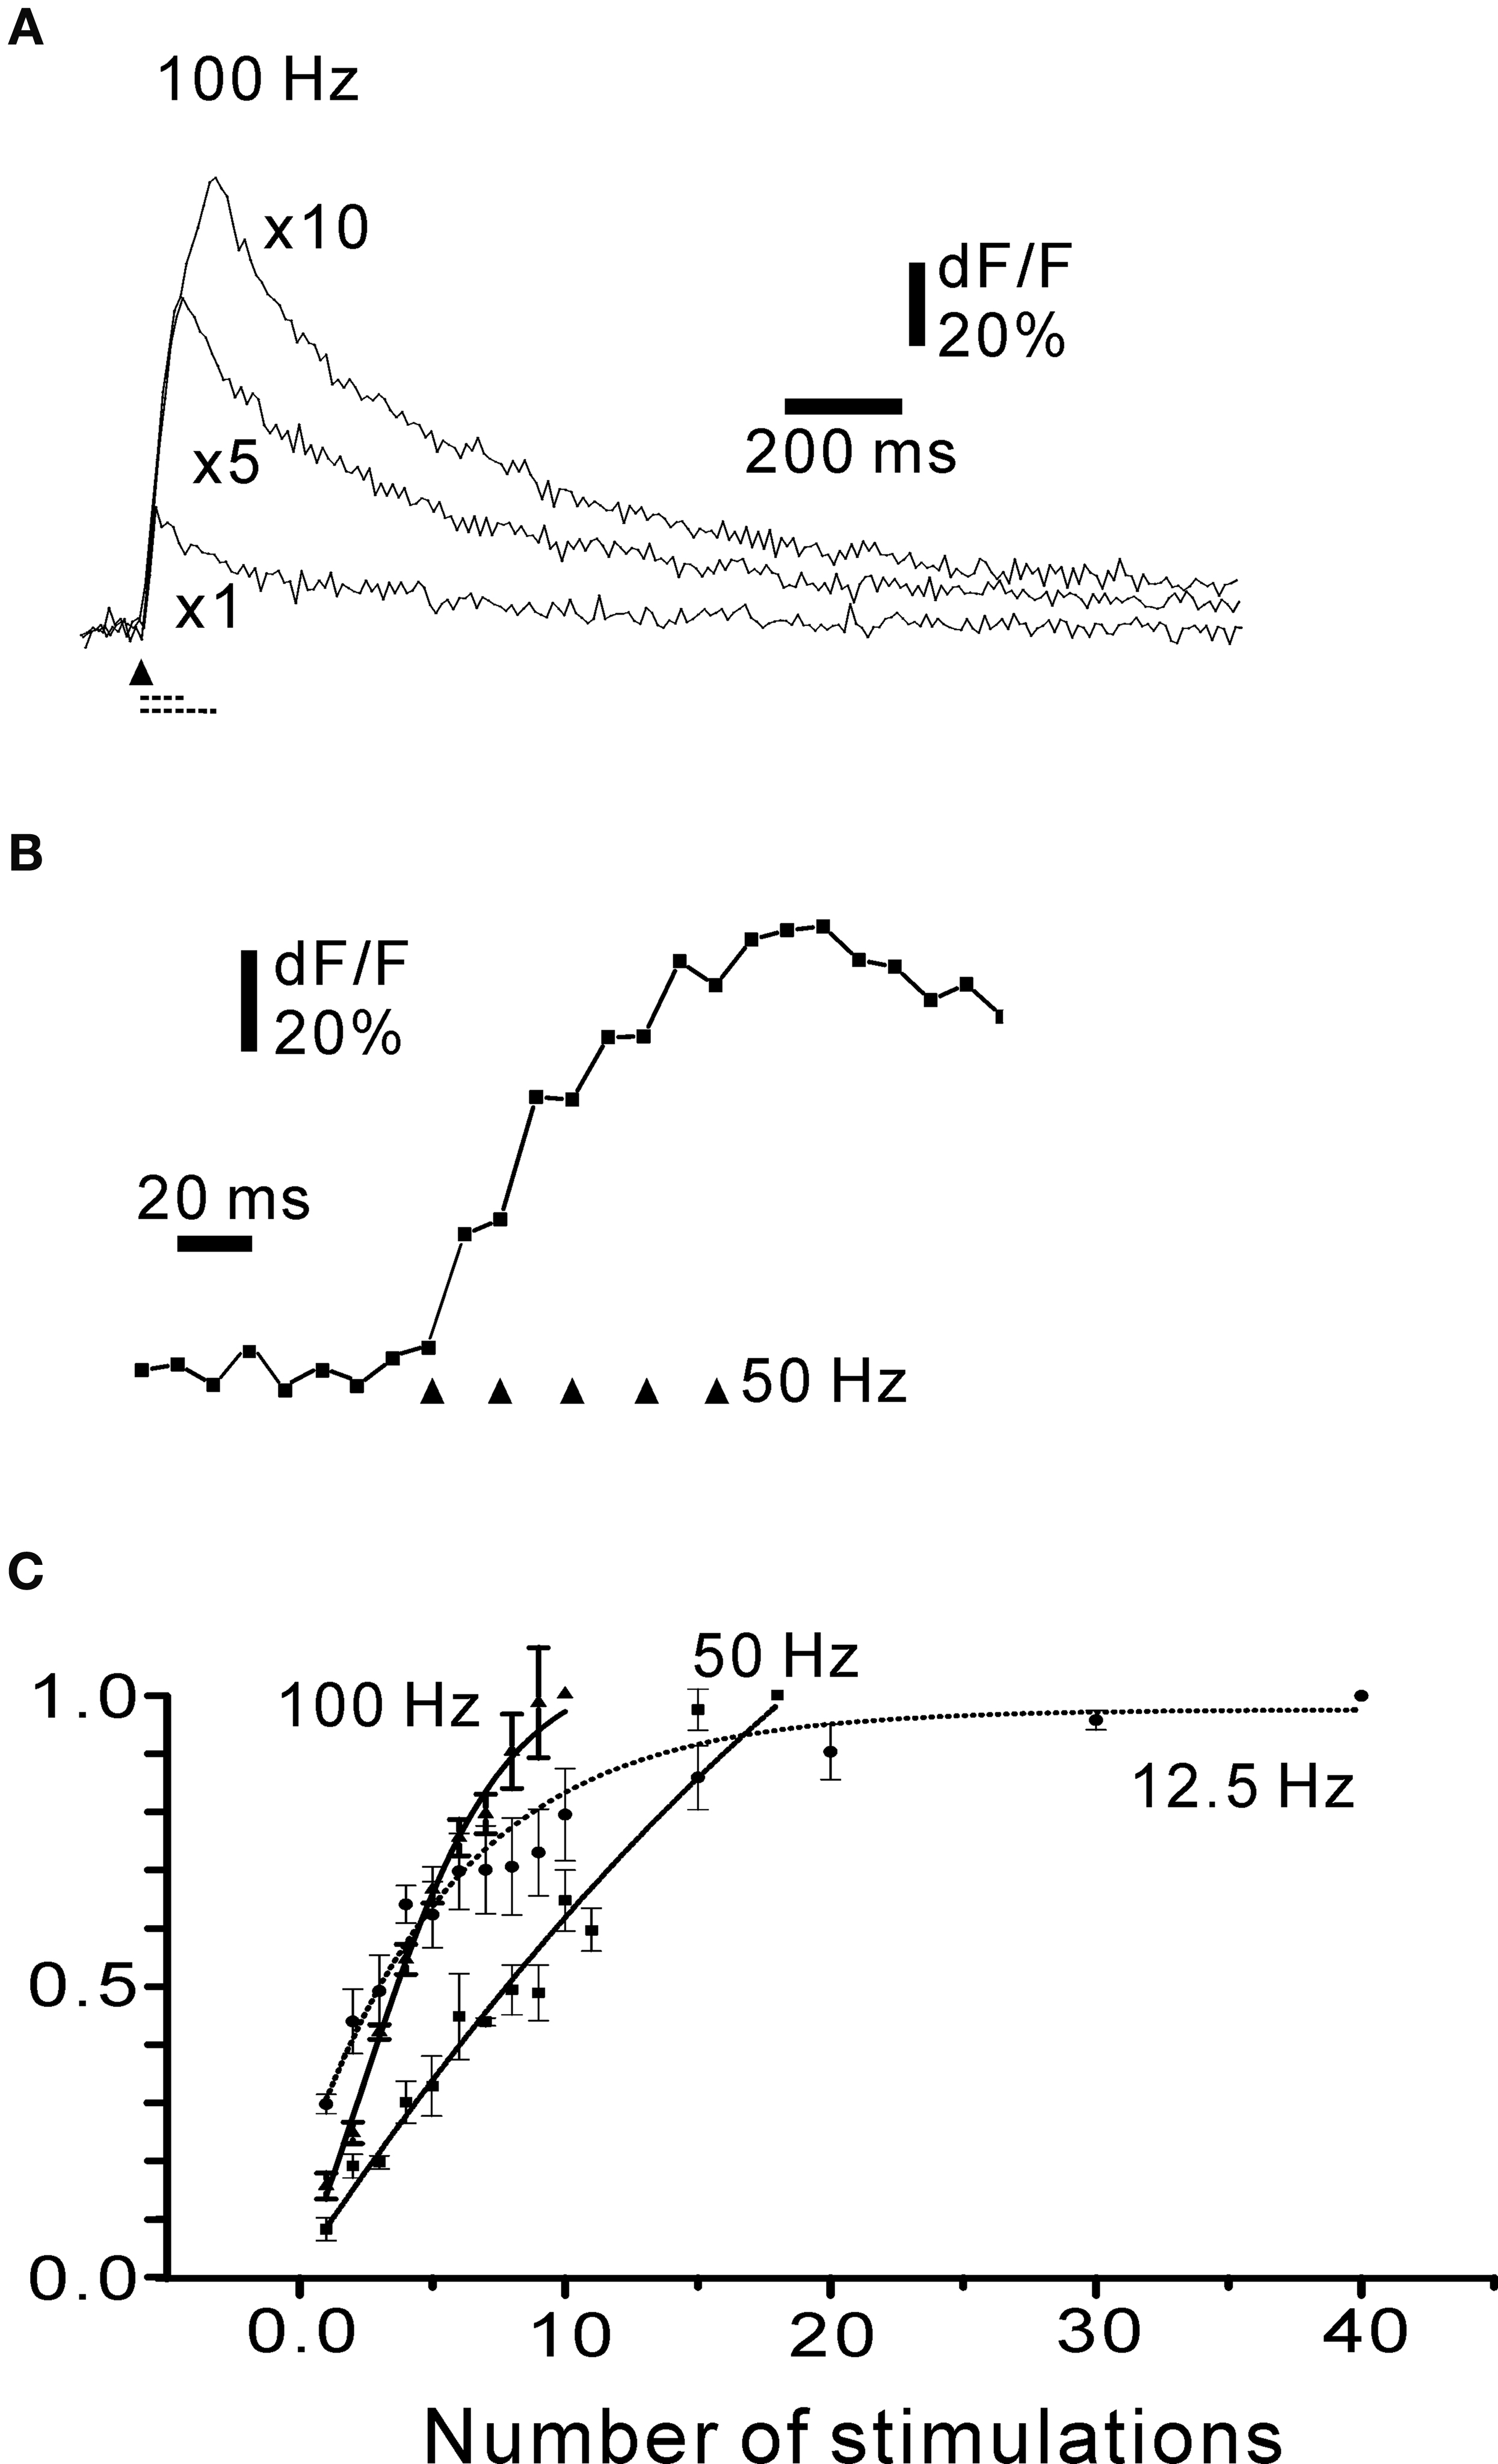
Figure 5. Time course of rosette fluorescence signal. (A) Cumulative responses to 1, and to 5 and 10 stimuli at 100 Hz. (B) Rising phase of five stimulations at 50 Hz. Note that each stimulation resulted in a noticeable increase in fluorescence. (A, B) Simple rosette; frame rate 100 Hz. (C) Summary plot of the time course of fluorescence signals as a function of the number of stimuli at three frequencies covering most of the frequency range of turtle mossy fibres. Symbols: square: 12.5 Hz; triangle: 50 Hz; circle: 100 Hz. The curves were normalized to the maximum response for each frequency: note for instance, that the actual maximal response (as dF/F) for 12.5 Hz would be lower than for 50 and 100 Hz. Each point is the average of at least four axons. All responses in (A)–(C) obtained in the presence of 30 μM picrotoxin and 50 μM CGP55845. Traces in (A), (B) and responses in (C) are averages of four picture series.
GABA B Receptor Modulation of Mossy Fibre Calcium Signalling
In slices, activation of GABA-B receptors reduces presynaptic calcium currents in hippocampal (Wu and Saggau, 1995
) and cerebellar mossy fibres, resulting in a diminished mossy fibre excitatory postsynaptic current (EPSC) in granule cells (Mitchell and Silver, 2000
). In the cerebellum, this effect was most pronounced at low frequencies of mossy fibre activity, with little effect above ∼10 Hz (Mitchell and Silver, 2000
). Spillover of GABA from Golgi cell axonal terminals were most likely responsible for this presynaptic inhibition, and long-lasting (more than 1 s) high-frequency firing of a single Golgi cell was required. We wished to examine the requirements for presynaptic GABA B modulation of mossy fibres in the intact cerebellar network. Baclofen (100 μM) inhibited the stimulus-evoked peak fluorescence signal from rosettes by 8% (five stimuli at 50 Hz; SD ± 3; n = 3 boutons; p < 0.005; cf. Mitchell and Silver, 2000
). Addition of CGP55845 showed that low-frequency activation of mossy fibres (12.5 Hz; Figure 6
A) was affected by GABA B inhibition. The GABA-source was most likely Golgi cells being activated during the mossy fibre stimulation in a fast feedforward manner (Kanichay and Silver, 2008
).The onset of the GABA B effect was analysed by examining the individual responses to mossy fibre activation (Figure 6
B) using data from high speed calcium imaging (Figure 6
A). Each peak value was the average of four separate sweeps used for statistical comparison. On average, for all fibres, the effect of GABA B inhibition was evident after 180 ms (SD ± 57). Inhibition was evident already at the first stimulus in one rosette, and after 260 ms in all rosettes (Figure 6
). The onset time of the GABA B effect was further tested using higher stimulation frequencies, in order to cover the frequency range of turtle mossy fibres. Analysis of the responses to stimulation at 50 and 100 Hz showed that GABA B receptors could control the very early part of the fluorescence response (Figures 6
D,F), in line with the observation that CGP55845 affected a single mossy fibre response in some cases. On average, traces in CGP55845 differed significantly (p < 0.05) from control traces after 68.8 ms (n = 5; SD ± 41) at 50 Hz and 47.1 ms (n = 8; SD ± 38) at 100 Hz stimulation frequency. The experimental results indicate that GABA B receptor activation was effective over the entire range of mossy fibre firing frequencies and maintained an effect during continuous mossy fibre activity. Furthermore, our results show that presynaptic GABA B inhibition in cerebellar glomeruli can have a rapid onset within a few tens of milliseconds.
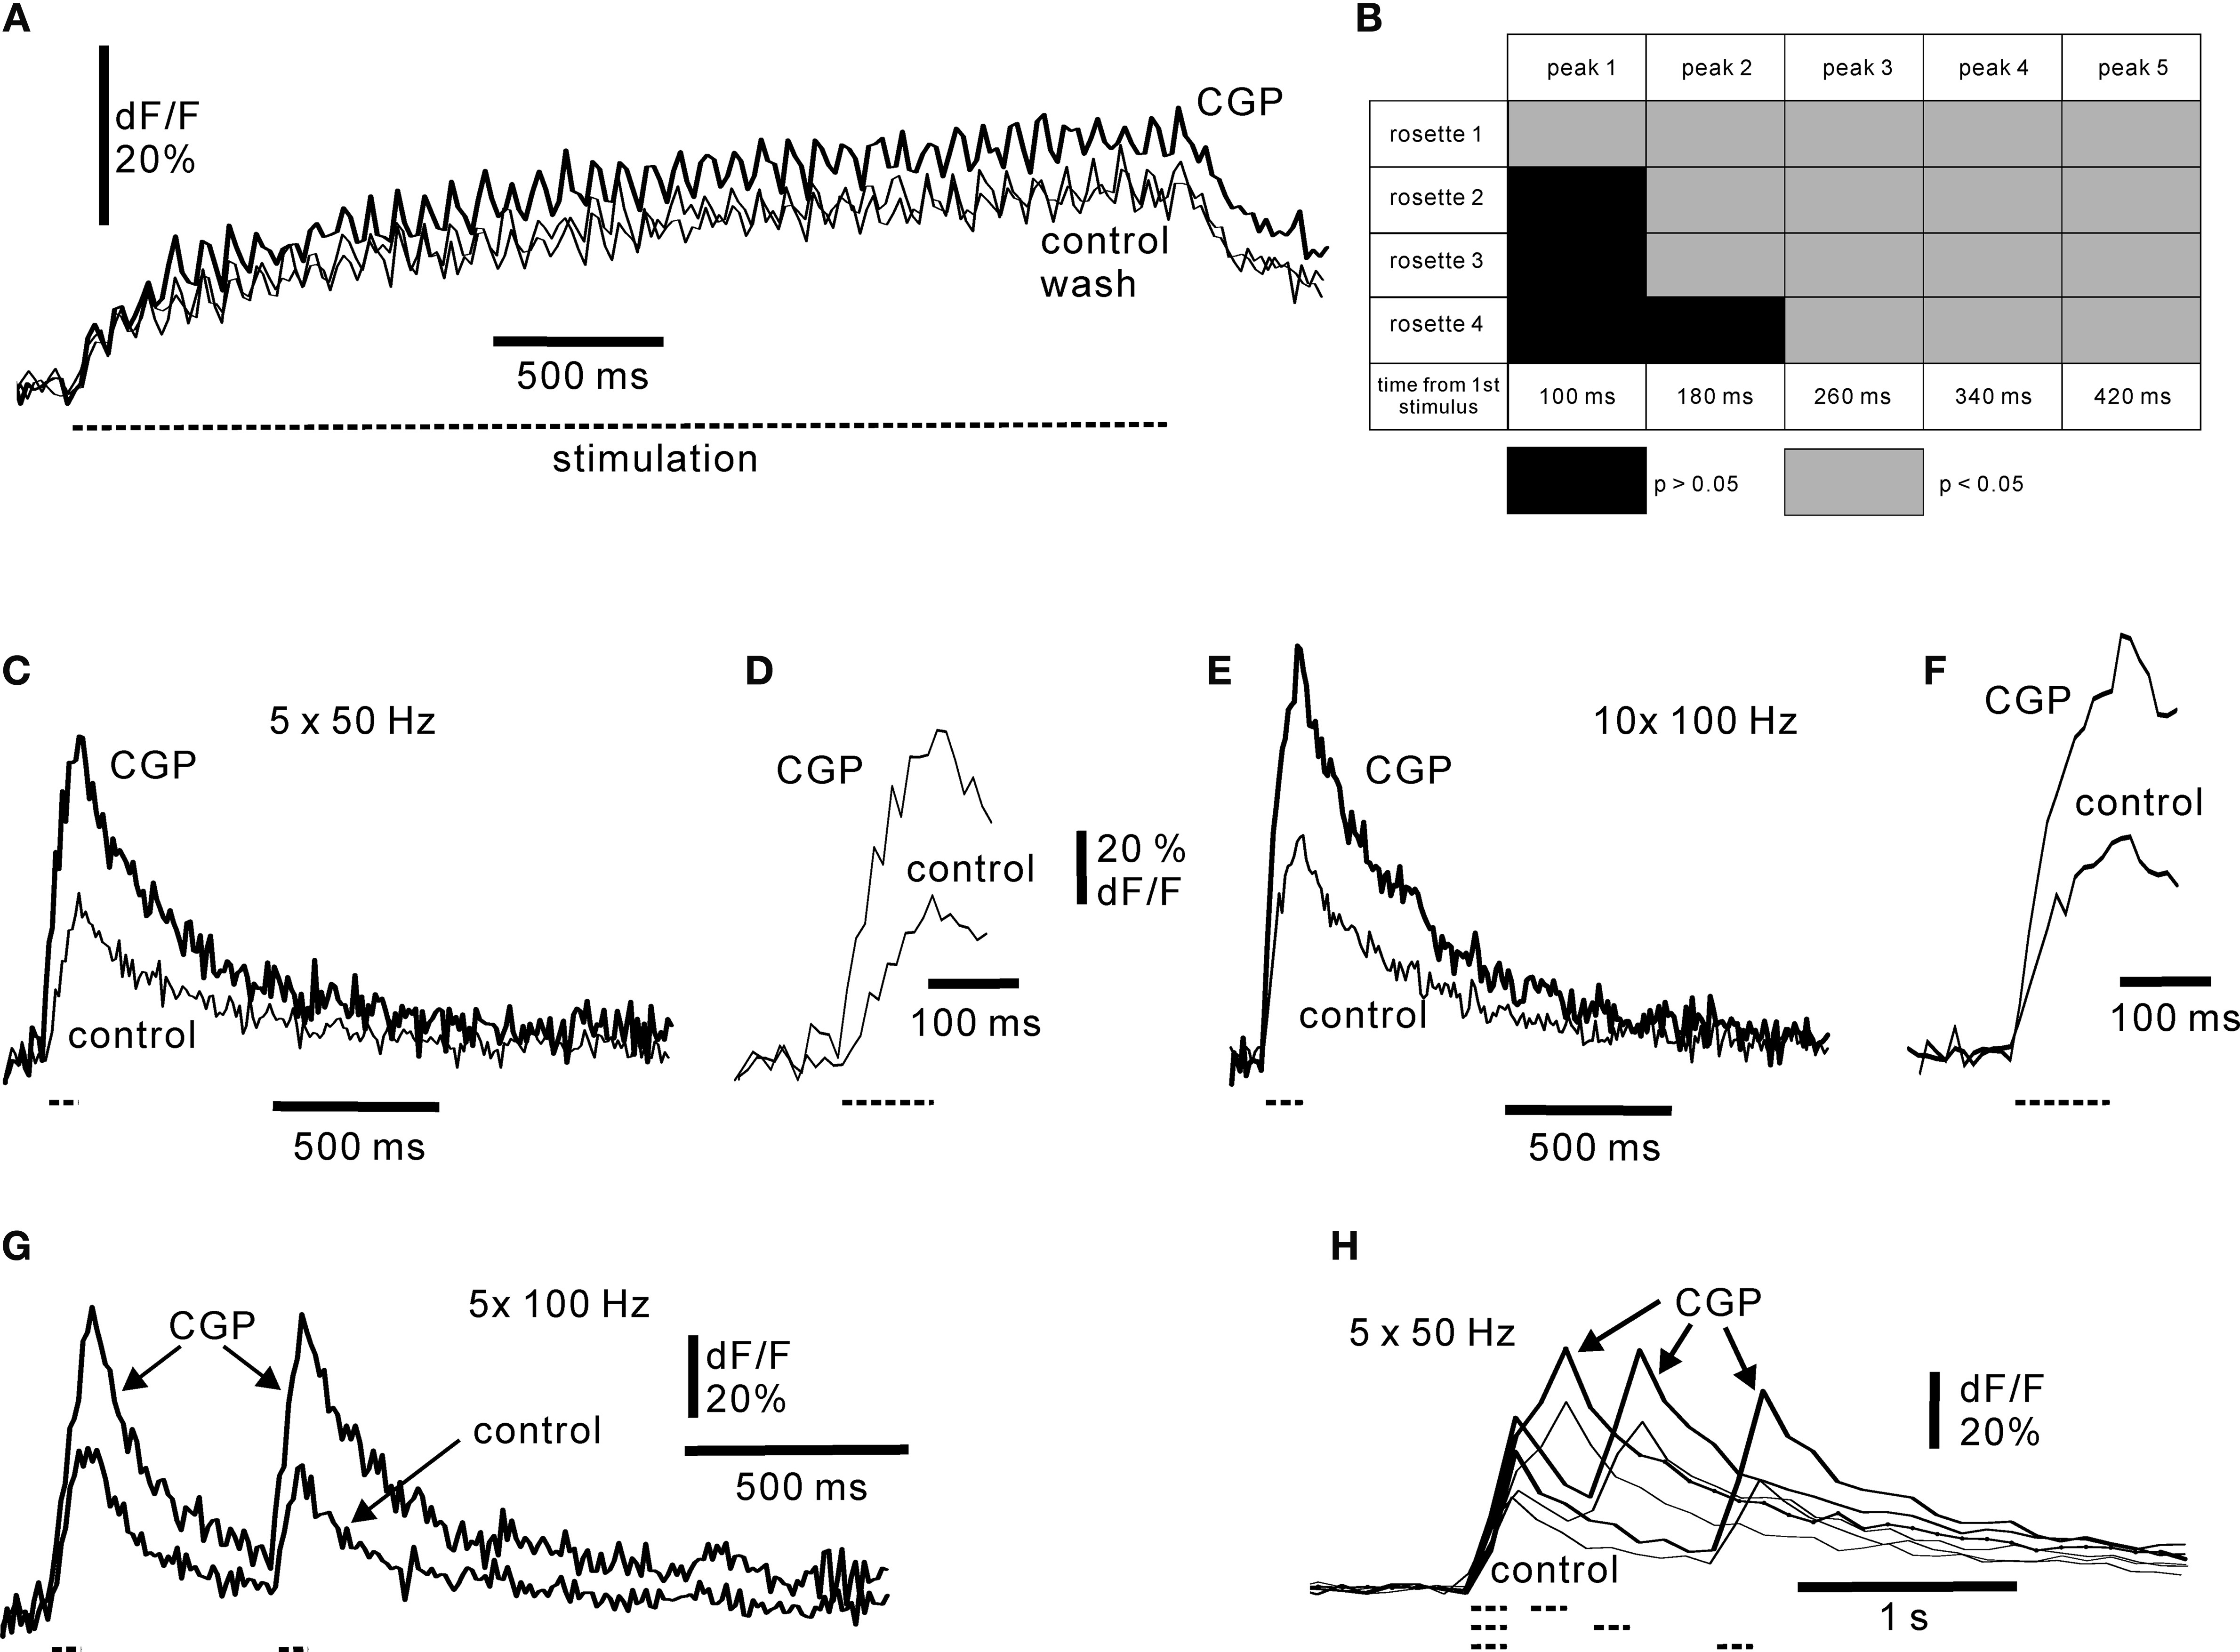
Figure 6. Responses of mossy fibre rosettes to GABA B receptor activation. (A) Repetitive activation of mossy fibre with 12.5 Hz in control medium, in CGP55845 (50 μM) and following wash of CGP55845. Duration of stimulus train is indicated by dashed line below the sweeps. Each trace is the average of four picture series. Simple rosette. Frame rate 50 Hz. (B) Time course of onset of GABA B activation at 12.5 Hz for four axons. For each mossy fibre stimulation the peak fluorescence values of the four controls were compared with the four peak values obtained in CGP55845. Non-significant differences are indicated by black, and significant differences (p < 0.05) are indicated by light grey. Note that all axons showed significant GABA B inhibition after the third stimulus, ∼260 ms. (C) Response to 50 Hz stimulation, five shocks. (E) Response to 100 Hz stimulation, 10 shocks. (D, F) Show the onsets of stimulation at an expanded time scale: note that control responses and responses in CGP55845 diverged early, indicating a rapid onset of GABA B receptor activation in control. Duration of the stimulus train is indicated by dashed line below the trace. (G) Paired-pulse stimulation of mossy fibres at 100 Hz. Note the large effect of CGP55845 on the first burst. (H) Duration of paired-pulse depression examined by varying the inter-burst interval from 200 ms to 1 s. Each burst consisted of five shocks at 50 Hz; the duration and occurrence of the bursts are indicated below the figure by dashed lines. All experiments in 30 μM picrotoxin. CGP55845 concentration: 50 μM. Frame rate (C) and (H): 50 Hz; (E–G): 100 Hz.
Mossy fibres are active in vivo both continuously and as shorter lasting high-frequency bursts (van Kan et al., 1993
; Garwicz et al., 1998
; Jörntell and Ekerot, 2006
). We therefore examined the effect of GABA B-Rs on shorter bursts. In particular, shorter bursts allowed to test the duration of the GABA B effect by a paired-pulse stimulation paradigm. A pronounced paired-pulse depression of the second burst occurred at interstimulus intervals up to 1 s (Figures 6
G,H) in 11 axons out of 15 tested at this long interval. For all intervals, paired pulse depression was observed in 17/18 simple rosettes and in 6/7 complex rosettes. Consequently, the paired-pulse data from the two types of rosettes were combined for subsequent analysis. Using the peak amplitude of the first burst in control medium and with CGP55845 as reference, respectively, the amplitude of the second burst was for 50 Hz intra-burst stimulation 0.71 (SD ± 0.14; n = 6 axons) at 200 ms inter-burst interval, 0.79 (SD ± 0.13; n = 11 axons) at 500 ms and 0.76 (SD ± 0.19; n = 10 axons) at 1 second in control medium, and 0.93 (SD ± 0.13), 0.99 (SD ± 0.16) and 1.01 (SD ± 0.15) in the presence of CGP55845 (50 μM). The differences between control and sweeps in the presence of CGP55945 were significant at p = 0.005. For intra-burst stimulation at 100 Hz (Figure 6
G), the amplitude of the second burst was 0.90 (SD ± 0.28; n = 8) at 500 ms intra-burst interval in control conditions, and 0.94 (SD ± 0.22) in the presence of 50 μM CGP55845. The difference was significant at p = 0.005. Note that this analysis may appear to underestimate the effect of GABA B inhibition on the second burst, as the first burst often increased in amplitude when CGP55845 was applied (Figures 6
C–H; on average to 1.7 times of control; n = 15 fibres). The long-lasting effect of the first burst suggests that short bursts of 50–100 Hz Golgi cell spiking observed in vivo (van Kan et al., 1993
) may lead to prolonged aftereffects. In conclusion, GABA B receptor activation resulted in a paired-pulse depression of mossy fibres inputs in the adult, intact cerebellum. This sets a time window for ongoing presynaptic integration of mossy fibre information in the cerebellum.
Local Calcium Signalling in Complex Rosettes
The large size and often structure of complex rosettes suggest that local modulation of calcium dependent processes such as transmitter release could take place, since calcium diffusion is restricted in axons (Collin et al., 2005
). Localised modulation of calcium entry in a rosette could in principle occur due to localised presynaptic plasticity or local modulatory effects due to presynaptic transmitter effects. For instance, differential activity of Golgi cells innervating the same glomerulus (Fox et al., 1967
; Mugnaini, 1972
) could result in a non-uniform extracellular GABA signal in a glomerulus. This could lead to differential calcium influx in the rosette innervating that glomerulus. In order to test this possibility, we pressure-applied GABA to one part of large complex rosettes before electrical stimulation of the axon (Figure 7
), using a stimulus interval of 300 ms, similar to the time frame for a robust paired-pulse depression (cf. Figures 6
G,H). Picrotoxin was present throughout in order to block any potential presynaptic GABA A receptors (Engelman and MacDermott, 2004
; Alle and Geiger, 2007
).
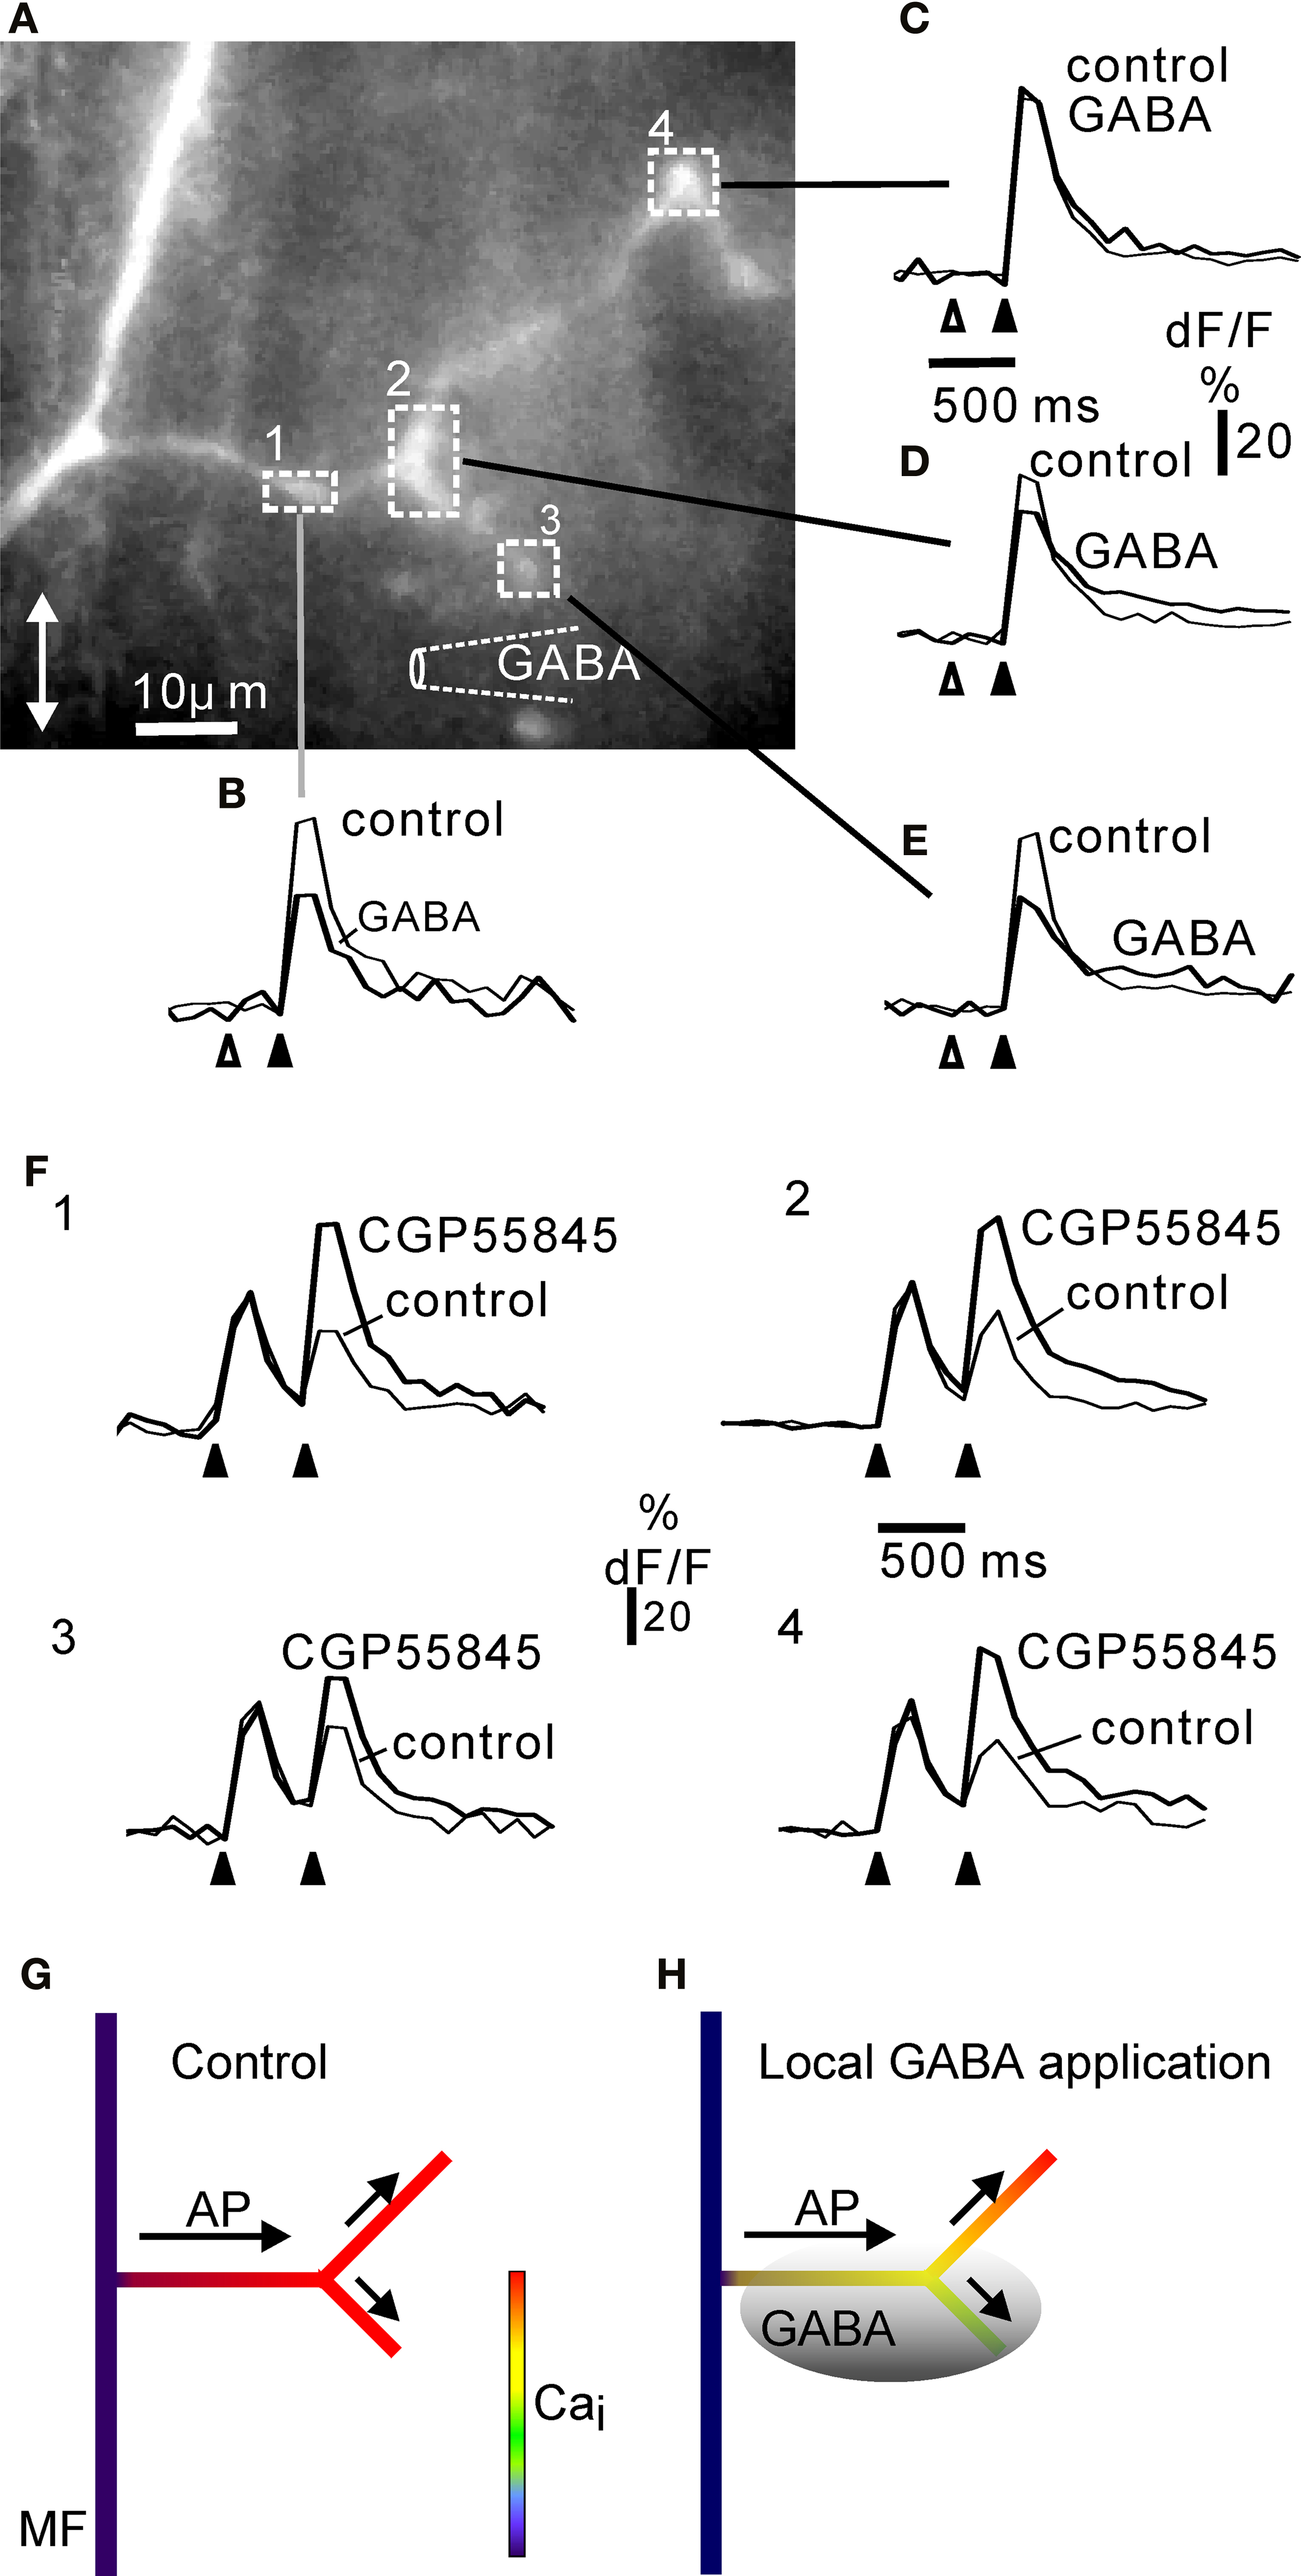
Figure 7. Local inhibition of calcium signalling in complex rosettes by focal activation of GABA B receptors. (A) Complex rosette branching off a mossy fibre axon (cf. Figure 1
). The position of the GABA pipette is indicated diagrammatically. For each region of interest indicated by the square boxes 1–4, the fluorescence signals to five electrical stimuli at 50 Hz (black arrowhead below dF/F traces) are shown as control and 300 ms after a GABA puff (open arrowhead). Each trace is the average of at least three trials. In location 4 (C), GABA had no effect, whereas in location 1–3 (B), (D, E) prior GABA application depressed the fluorescence response to subsequent electrical activation. The results suggest that proximal regions affected by GABA (1, 2) did not prevent the action potentials from propagating to more distal regions (4, (C)) unaffected by GABA. All regions showed a CGP55845-sensitive paired-pulse depression at inter-burst intervals of 500 ms (F), 1–4; panel numbers correspond to regions in (A). The rosette was confined to the side branches: the axon showed no fluorescence signal increase, while the whole extent of the side branches gave a fluorescence response to electrical stimulation, similar to other complex rosettes shown. The size of this rosette was comparable to the lateral extent of rosettes in fixed and dehydrated tissue (Figure 1
). In other experiments (not shown) similar results were obtained in complex rosettes along the axon: local GABA application at one end of long rosette (cf. Mugnaini et al., 1974
) resulted in local reduction in electrically-evoked fluorescence signals near the GABA-containing pipette. GABA pipette puff duration: 25 ms. Frame rate 10 Hz. CGP55845 concentration: 50 μM. All experiments in 30 μM picrotoxin. Double-headed arrow in (A) indicates the cerebellar sagittal direction. (G) Summary diagram of widespread calcium signal in control situation (no GABA application prior to electrical stimulation of mossy fibre), cf. panels (B–E). (H) Diagram of local GABA application prior to electrical activation (shaded grey; cf. panels (B–E)) reducing the calcium signal from some branches of the complex rosette. The depolarization, e.g. an action potential (AP), spreads (arrows) from the parent mossy fibre (MF) through rosette branches with calcium signals inhibited by local GABA B receptor activation, to branches showing no GABA B effect.
The rosette responded to a burst of stimuli with a fluorescence increase at all locations. However, local GABA application reduced the fluorescence signal at locations close to the puff-pipette (Figures 7
A–E). The inhibitory effect of GABA application was not due to lack of GABA-responsiveness in parts of the rosette, as paired-pulse depression (cf. Figure 6
) was observed at all locations, and was attenuated by CGP55845 (Figure 7
F). The maximal local effect of GABA in four complex rosettes was 40.7% (SD ± 7.2, n = 4) reduction of dF/F compared to control. In conclusion, a complex rosette may be functionally subdivided with regard to local GABA control of calcium signalling.
We analysed the electrophysiological responses and the calcium signalling in cerebellar mossy fibres in the adult, intact cerebellum at physiological temperature for turtles, i.e. 15–35°C. Whole-cell recordings from rosettes characterized the basic electrophysiological properties, including TTX-sensitive subthreshold responses and repetitive Na+ spike firing. Addition of 4-AP revealed voltage-sensitive calcium responses, identified by their sensitivity to Co2+. In the intact cerebellum, calcium imaging revealed Na+ spike-associated calcium signals from simple and complex rosettes. This calcium signal was reduced by GABA B-R activation over entire firing frequency range of mossy fibres in turtles (up to ∼125 Hz). In the presence of picrotoxin, local GABA application showed that calcium influx in a complex rosette could be regulated locally, suggesting that large rosettes may be functionally compartmentalized by GABAB receptor activation.
Electrophysiological Properties of Mossy Fibres
The whole-cell recordings revealed that adult turtle cerebellar mossy fibre electrophysiology was similar to young mammalian cerebellar mossy fibres (Maffei et al., 2002
; Rancz et al., 2007
) and other axons in the PNS and the CNS (Bostock, 1995
; Geiger and Jonas, 2000
). For instance, our results (Figure 2
) indicate that high-threshold voltage-gated calcium channels are present in turtle mossy fibre terminals, consistent with previous results in mammals (Mitchell and Silver, 2000
; Maffei et al., 2002
). Further points of species similarity are suggested by a strong, persistent outward rectification activated just above resting membrane potential, and an inward rectification which was seen during hyperpolarization (Figure 1
; Bostock, 1995
; Geiger and Jonas, 2000
; Rancz et al., 2007
). In mammalian hippocampal axons, A-like currents have been reported to influence spike propagation (Debanne, 2004
) and duration (Geiger and Jonas, 2000
). However, while 4-AP increased excitability (Figure 2
), suggesting that A-like conductances could be present in cerebellar mossy fibres, repetitive Na+ spike firing did not reveal a significant increase in spike-width for the stimulation parameters used here (Figure 3
), in contrast to the cumulative I-A inactivation which presumably affects all release sites in hippocampal mossy fibres (Geiger and Jonas, 2000
). The effect of 4-AP may, however, also indicate that other types of potassium channels are present (Southan and Robertson, 1998
; Tan and Llano, 1999
; Dodson et al., 2003
; Ishikawa et al., 2003
); for instance, TEA-sensitive currents have previously been shown to control excitability in mammalian mossy fibre terminals (Maffei et al., 2003
). Further experiments are needed to clarify this issue. Propagation failure at branch-points may be due to A-currents (Debanne, 2004
), but we did not routinely observe axonal branching, even though mossy fibres in turtles (Mugnaini et al., 1974
) and mammals (Wu et al., 1999
; Sultan, 2001
) possess collaterals; consequently, this leaves open the possibility for information filtering at these sites. Another mechanism for activity-dependent changes could be propagation failure due to spike-induced AHPs, as seen in a variety of vertebrate and invertebrate axons (for review, see Debanne, 2004
). While cerebellar mossy fibres and other vertebrate axons possess such AHP (Figure 3
; Gordon et al., 1990
; Morita et al., 1993
; Kim et al., 2007
), spike failures during prolonged activity were not observed in our experiments (Figure 3
). In conclusion, our data indicate that the electrophysiological properties of adult mossy fibres ensure the distribution of the incoming information to the presynaptic terminals with a high degree of robustness, over the entire range of firing frequencies. This electrophysiological information shows, where comparable data exist (Maffei et al., 2002
; Rancz et al., 2007
), that the properties of mossy fibres are evolutionarily highly conserved. In addition, in the present study, it provided a background for the subsequent calcium imaging experiments.
In all of the complex rosettes imaged with calcium indicator, spiking evoked an all-or none fluorescence signal from all side-branches in parallel (Figure 4
). Thus, we did not detect regions that would not be activated during action potentials. This suggests that a complex rosette is electrically compact during Na+ spiking, with uniform activation of all parts of the rosette, including the fine branches and satellite boutons.
GABA B Modulation of Rosette Calcium Signalling
We examined GABA B-R modulation of mossy fibre terminals in the intact cerebellar circuitry. Previous slice experiments in mammals established that mossy fibre Ca2+-channels are inhibited by baclofen and Golgi cell-mediated GABA B-R activation (Mitchell and Silver, 2000
). In these experiments, single Golgi cells had to be activated at high firing frequencies for at least 1 s before an effect on the MF-granule cell EPSP was detectable, and maximum EPSC depression was observed after ∼5 s of Golgi cell activity. Shorter (250 ms) high-frequency spiking of Golgi cells did not have any effect (Mitchell and Silver, 2000
). In our experiments, the average onset time of mossy fibre GABA B inhibition was ∼50–70 ms. In some cases (∼40%) no depression of mossy fibre output transmission was observed (Mitchell and Silver, 2000
), while we observed a GABA B-R effect in 16 out of 21 mossy fibres tested (24% non-responders to addition of GABA B receptor antagonist). The reasons for the differences in responsiveness and onset kinetics between our data and the slice experiments are not clear, since the distribution of GABA B receptors in turtles is similar to mammals (Albin and Gilman, 1992
), but in our experiments it is likely that several Golgi cells projecting to a glomerulus (Fox et al., 1967
; Mugnaini, 1972
) are activated by the electrical stimulus, perhaps creating a larger spillover of GABA than the activation of individual Golgi cells by Mitchell and Silver (2000)
. GABA diffusion out of the slice preparation may result in a less effective spillover, and severed Golgi cell axons may account for the occasional failure to activate depression of the mossy fibre-granule cell transmission (Mitchell and Silver, 2000
). Finally, the slice data were obtained in very young rats (P12–13), while our data were obtained in adult animals. The glomerulus, including the glial wrapping, undergoes postnatal developmental maturation (Hamori and Somogyi, 1983
; Mitchell and Silver, 2000
). This may result in differences in extracellular diffusion of GABA. In our experiments, GABA B receptors modulated mossy fibre calcium signals at high firing frequencies (Figure 6
), where little or no GABA B receptor effect on mossy fibre-granule cell transmission was observed previously (Mitchell and Silver, 2000
). This apparent difference could be due to species or age differences. Future experiments combining presynaptic mossy fibre calcium imaging with electrical recordings from corresponding postsynaptic granule cells may resolve this issue. Recent results in mammals show that the GABA concentration in a glomerulus is sufficient to activate GABA B-Rs at Golgi cell axonal terminals (Mapelli et al., 2009
), and extracellular GABA in a glomerulus may not only result from Golgi cell spiking, but also result from non-spike related release (Rossi et al., 2003
), resulting in phasic as well as tonic GABA A-R mediated inhibition of granule cells (Rossi and Hamann, 1998
). These data may explain the results (Figure 6
) indicating that the mossy fibre calcium signal occasionally appeared to be under tonic inhibition.
The GABA B-R activation was long-lasting (Figure 6
), giving rise to a paired-pulse depression similar to GABA B effects in other brain regions (Wachowiak et al., 2005
). Since mossy fibres may fire in short bursts (van Kan et al., 1993
; Garwicz et al., 1998
; Jörntell and Ekerot, 2006
), this paired-pulse depression may be particularly relevant for modulation of information transfer at the mossy fibre synapse and the occurrence of temporal contrast, in line with the adaptation of sensory inputs to other brain regions. Our results also indicate that presynaptic GABA B-Rs can have a significant effect during the maintained mossy fibre firing commonly observed in vivo (van Kan et al., 1993
).
An interesting possibility is that the presynaptic GABA B-Rs could influence the induction and presynaptic expression of long-lasting changes in the strength of mossy fibre-granule cell synapses, such as long-term potentiation (LTP) or long-term depression (LTD) (Maffei et al., 2002
; Sola et al., 2004
; Gall et al., 2005
; Pan et al., 2009
).
Presynaptic modulation (cf. Schneggenburger and Forsythe, 2006
) of cerebellar mossy fibres appears to be more complex than GABA B-R mediated control of calcium influx: activation of A1 adenosine receptors reduced transmitter release without a noticable effect on presynaptic calcium currents (Maffei et al., 2002
). In contrast to these reductions of mossy fibre output, nitric oxide provides – through LTP induction – a persistent increase in presynaptic currents at mossy fibre terminals (Maffei et al., 2003
).
Golgi cells may not only affect mossy fibres by indirect means such as spillover (Mitchell and Silver, 2000
), but very rare but direct synaptic connections to mossy fibres rosettes have been reported (Palay and Chan-Palay, 1974
). The significance of these connections is unknown, but they could produce highly localised GABA A-R, glycine-R and GABA B-R mediated modulation of a rosette, similar to results involving GABA A-Rs in hippocampal axons (Alle and Geiger, 2007
).
The often extensive branching and large extent of many complex rosettes (Figure 1
; Mugnaini et al., 1974
; Palay and Chan-Palay, 1974
) suggested that localised signal processing may take place within a rosette, in analogy with local calcium signalling in dendritic branches and spines. A dynamic compartmentalization of mossy fibre rosettes could occur due to, e.g. localised GABAB-R activation. In order to test this, GABA was applied locally to only a part of a rosette, resulting in a regional decrease in the stimulus-evoked calcium signals (Figure 7
). In contrast, activation of the mossy fibre spike invariably resulted in a widespread, uniform rosette calcium signal. More focal electrical stimulation in the granule cell layer than we could achieve in the present study may allow to test whether differential activation of the Golgi cells projecting to a glomerulus (Fox et al., 1967
; Mugnaini, 1972
) can induce compartmentalization of the calcium signalling in a rosette. Analysis of calcium signals from cerebellar mossy fibre and squid synaptosomes (Serulle et al., 2007
) has indicated how, ultimately, presynaptic calcium microdomains set the lower limit for local presynaptic calcium signalling and compartmentalization at a scale corresponding to the size and separation of active zones (Xu-Friedman and Regehr, 2003
). Pressure-applied GABA, as in our experiments, spreads for comparatively much longer distances. Future experiments with more focal GABA application using optical GABA-uncaging (Trigo et al., 2009
) might allow to analyse the spatial relationship between GABA B-receptor activation and local regulation of presynaptic calcium influx in finer detail, on a spatial scale of a few micrometers, taking into account the extracellular diffusion of GABA within a glomerulus (cf. Rossi and Hamann, 1998
).
If the axonal territories of Golgi cells do not overlap completely within a large complex glomerulus (Figure 8
; cf. Figures 1 and 7), the restricted extracellular GABA diffusion within a glomerulus at physiological temperature (cf. Mitchell and Silver, 2000
) opens the possibility that a large glomerulus may be functionally compartmentalized by local differences in extracellular GABA concentration, depending on the spatial activity pattern of Golgi cells. In this way, presynaptic inhibition by Golgi cell-mediated feedback- and lateral-inhibition to a particular glomerulus may finely regulate the mossy fibre input to specific granule cell subpopulations contacting this glomerulus (Figure 8
). Evidence has previously been obtained in the cat that Golgi cell inhibition of separate mossy fibre inputs could be due to anatomically very specific distribution patterns of Golgi cell axons (Precht and Llinás, 1969
), but it is presently not clear if this may be related to the scenario proposed in Figure 8
. Compartmentalization of a glomerulus by Golgi cell activity (Figure 8
B) may hypothetically lead to differential LTP/LTD induction (cf. Gall et al., 2005
) at different mossy fibre-granule cell synapses in this glomerulus (cf. D’Angelo et al., 1999
), due to spatially specific and varying degrees of Golgi cell-mediated inhibition (cf. Eccles et al., 1966
; Precht and Llinás, 1969
; Gabbiani et al., 1994
) of voltage-dependent calcium influx in different granule cells belonging to the glomerulus. This would increase the cerebellar information storage capacity at the glomerular level compared to a scenario where each glomerulus functions as a unit. This hypothesis could be directly tested in future LTP/LTD-induction experiments by recording simultaneously from two granule cells belonging to the same glomerulus.
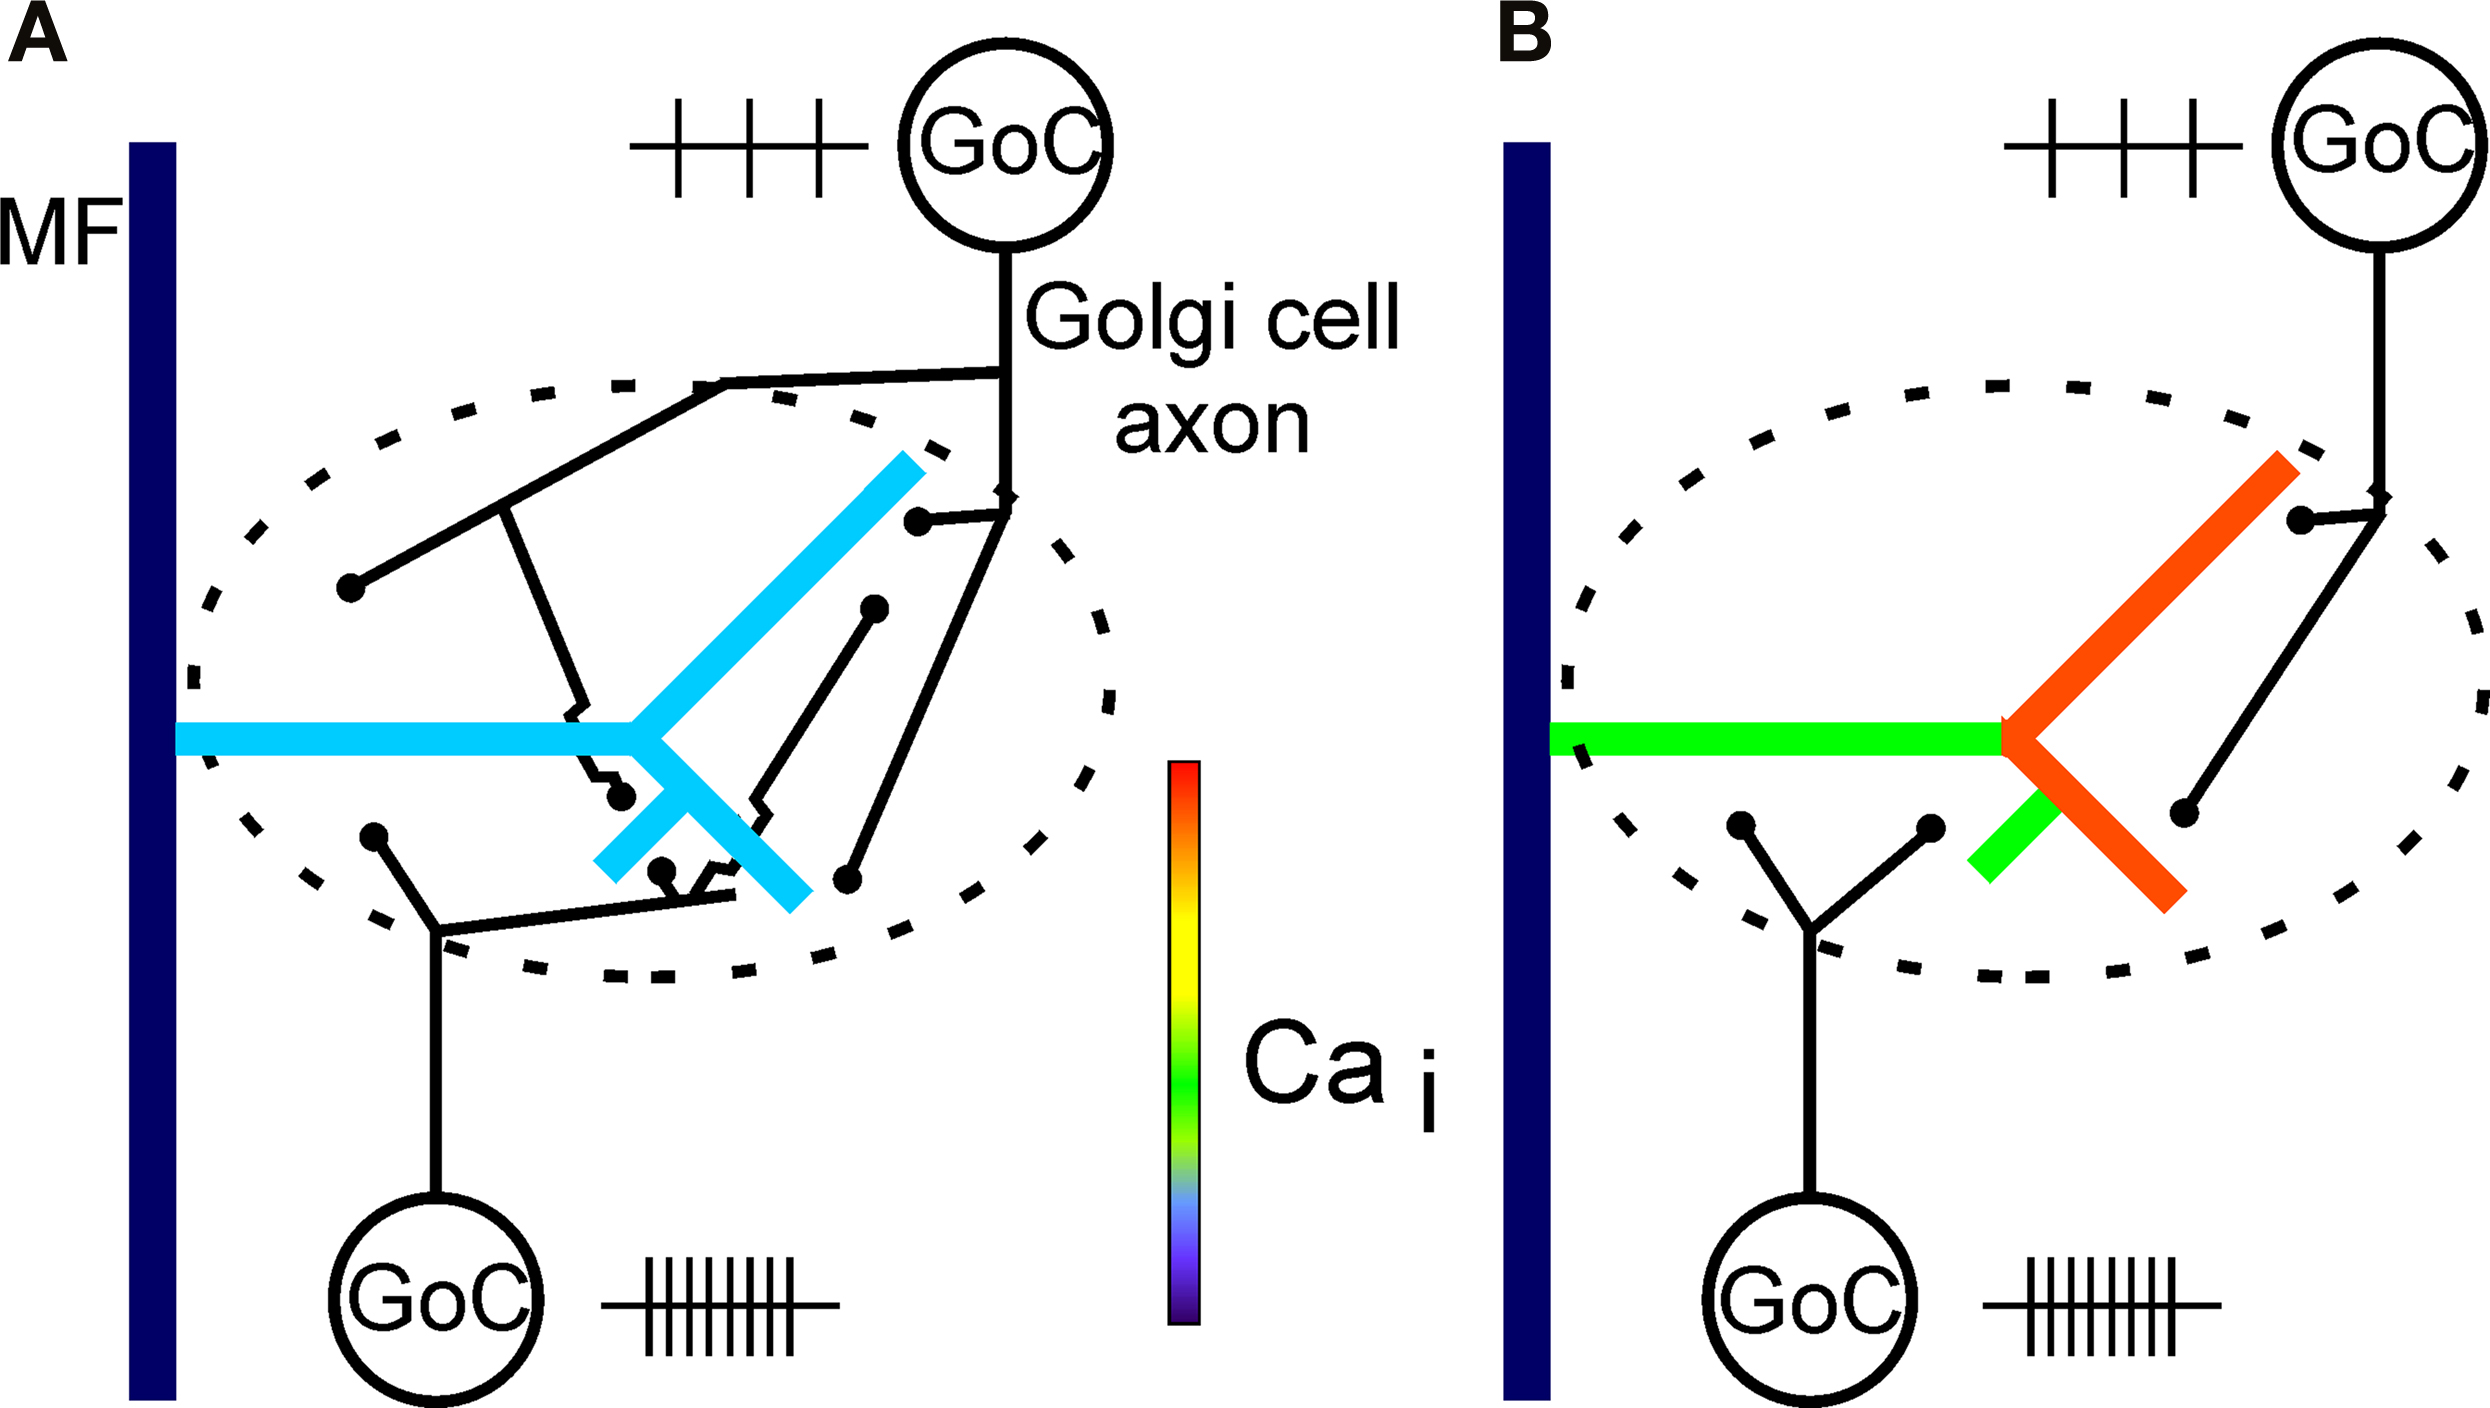
Figure 8. Diagram of hypothetical Golgi cell innervation patterns in a glomerulus with a complex mossy fibre rosette. (A) In one possible scenario, Golgi cells (GoC) innervating the same glomerulus overlap in their axonal innervation territory, making a large glomerulus a functional entity. The global presynaptic inhibition of the rosette is due to summation of activity of all Golgi cells innervating the glomerulus. Control situation for (A) and (B) with no Golgi cell inhibition is indicated in Figure 7
G. (B) In another scenario, no or marginal overlap of Golgi cell axons occur within a large glomerulus. Different compartments of a large complex rosette could in this way be subject to local presynaptic inhibition by different Golgi cell populations. This indicates that control of input to the cerebellar cortex could be more fine-grained than suggested by the scenario in (A), where an entire glomerulus functions as an input unit. Future anatomical analysis may allow to differentiate between these alternatives. In (B), the relative activity levels (indicated by the number and spacing of small vertical lines close to each cell) of Golgi cells may dynamically control presynaptic calcium influx in different branches of a rosette. Feedback as well as lateral-inhibition by Golgi cells could functionally compartmentalize the glomerulus. Note that the Golgi cells in the diagrams (A) and (B) represent two different cell populations and are not an indication of the actual number of Golgi cells innervating a glomerulus. Note also that the innervation scenarios depicted in (A) and (B) could be considered to illustrate opposite ends of a spectrum.
While in many cases each presynaptic bouton in the CNS contacts only one postsynaptic cell, often with several release sites, as for instance the calyx of Held (Schneggenburger and Neher, 2005
), some types of boutons may contact several cells, for instance the cerebellar mossy fibre rosette (Mugnaini et al., 1974
; Palay and Chan-Palay, 1974
). It will be of interest to see whether neighboring release sites to different postsynaptic cells may be individually regulated, both in terms of presynaptic modulation of transmitter release and in terms of synaptic plasticity. To this end, development of new calcium probes (Qiu et al., 2008
), perhaps targetable to active zones, would be of importance, and to further analyse the spatial activation of branched, complex presynaptic terminals, voltage sensitive indicators (Qui et al., 2008
) might be useful.
The authors declare that the research was conducted in the absence of any commercial or financial relationships that could be construed as a potential conflict of interest.
This work was supported by Becketts Foundation, Carlsberg Foundation, DADES Foundation, the Danish Medical Research Council, Lundbeck Foundation, Novo Nordisk Foundation, the Swedish MRC, the Swedish Medical Society and Teggers Minnesfond.
The supplementary material for this article can be found online at http://www.frontiersin.org/neuralcircuits/paper/10.3389/neuro.04/001.2010/
Supplementary Video
Sequence of images of a living mossy fibre filled with Lucifer Yellow in a slice of the cerebellar cortex. Each image was taken at a different depth from the cut surface of the slice using computer-controlled stepping of the microscope z-axis. Z-axis distance between images was 2 micrometers. Same mossy fibre as shown in figures 1
C–E.