Different sources of nitric oxide mediate neurovascular coupling in the lateral geniculate nucleus of the cat
1
Neuroscience and Motor Control Group, University of A Coruña and Biomedical Institute of A Coruña, A Coruña, Spain
2
Department of Mathematics, Campus de Elviña, University of A Coruña, A Coruña, Spain
Understanding the link between neuronal responses (NRs) and metabolic signals is fundamental to our knowledge of brain function and it is a milestone in our efforts to interpret data from modern non invasive optical techniques such as fMRI, which are based on the close coupling between metabolic demand of active neurons and local changes in blood flow. The challenge is to unravel the link. Here we show, using spectrophotometry to record oxyhaemoglobin and methemoglobin (surrogate markers of cerebral flow and nitric oxide levels respectively) together with extracellular neuronal recordings in vivo and applying a multiple polynomial regression model, that the markers are able to predict up about 80% of variability in NR. Furthermore, we show that the coupling between blood flow and neuronal activity is heavily influenced by nitric oxide (NO). While NRs show the typical saturating response, blood flow shows a linear behaviour during contrast-response curves, with nitric oxide from different sources acting differently for low and high intensity.
The relationship between cerebral blood flow, and neural activity is complex, and by no means completely understood. Non-invasive optical techniques such as fMRI can relate neuronal activity to changes in haemodynamic signals (Kwong et al., 1992
; Ogawa et al., 1993
; Drake and Iadecola, 2007
). Traditionally, fMRI measures a blood-oxygen-level dependent signal and assumes a linear relationship between neuronal and metabolic responses (Logothetis, 2002
). However, this assumed linear relationship has now begun to be challenged (Lauritzen, 2001
; Nielsen and Lauritzen, 2001
; Sheth, 2004
; Li and Freeman, 2007
; Rasmussen et al., 2008
). For example, haemodynamic coupling has been shown to fit well to a power law function (Li and Freeman, 2007
, utilising a similar preparation to the one described here). However, this was shown to be linearly coupled to stimulus intensity, as previously demonstrated in rat cerebral cortex (Lauritzen, 2001
; Nielsen and Lauritzen, 2001
). In the search for a all encompassing description of the relationship between blood flow, stimulus intensity and neural response, Rasmussen et al. (2008)
have developed a general parametric mathematical model which characterises deviations from linearity using data derived from the cerebellum, showing that the neurovascular system exhibits linear behaviour in response to stimuli of low frequency and short duration. Here we investigate the relationship using a combination of new technologies, in a well characterised CNS system, the lateral geniculate nucleus (LGN) in the visual thalamus of the cat.
As noted above, the mechanisms underlying neurovascular coupling are still under debate but include several possibilities (which are not necessarily mutually exclusive), including direct control by neurons (Krimer et al., 1998
; Paspalas and Papadopoulos, 1998
; Yang et al., 2000
; Cauli et al., 2004
), changes in K+ concentration as result of enhanced activity (Faraci and Heistad, 1998
), NO mediated vasodilatation after NMDA postsynaptic activity (Iadecola et al., 1993
), NO mediated vasodilation linked to the tissue plasminogen activator (Park et al., 2008
), adenosine and epoxyeicosatrienoic acids mediated (Peng et al., 2002
; Shi et al., 2008
) and related to astrocyte activity (Zonta et al., 2003
; Iadecola and Nedergaard, 2007
). In order to shed further light on the mechanisms involved in coupling and on the capacity of metabolic signals to predict neuronal activity (and vice versa) we have used extracellular recordings of spike activity in vivo combined with spectrophotometry to measure oxyhaemoglobin (OxyHb), as an indicator of blood flow (Devor et al., 2003
). In addition, we were simultaneously able to measure methemoglobin (MetHb), which reflects the local level of nitric oxide (Kelm et al., 1997
; González-Mora et al., 2002
) and experimentally alter the NO environment by pharmacological manipulation.
Given the current relevance of imaging techniques, both in clinical and experimental studies, any further insight into this field could have significant implications in, for example, interpretation of fMRI data, and could open new lines of research in fields ranging from neurochemistry to imaging, as well as contributing to our basic understanding of CNS function, with particular reference to the visual system.
Extracellular single unit recordings were simultaneously recorded with spectroscopic optical measures of OxyHb and MetHb in the LGN (Horsley–Clarke coordinates A5.5/L8.5-9) of nine adult cats of either sex. Animals were anaesthetised with isoflurane in nitrous oxide (70%) and oxygen (30%) (isoflurane – 5% for induction, 2–3% for surgery and 0.5–1% for maintenance) and paralysed with gallamine triethiodide (loading dose of 40 mg, maintenance 10 mg kg/h IV, see de Labra et al., 2007
). All procedures conformed to the guidelines of the Spanish Physiology Society and the International Council for Laboratory Animal Science and the European Union, and were approved by the university Animal Care and Use Committee.
End-tidal CO2, ECG, EEG, temperature and blood pressure (BP, mmHg) were monitored continuously throughout the experiment. Once a stable state was reached, any variation in the monitored parameters commensurate with a change in the depth of anaesthesia was compensated for by alterations in the level of isoflurane. Wound margins were treated with lidocaine hydrochloride with adrenaline administered subcutaneously. Ear bars were coated with lidocaine gel. The eyes were treated with atropine methonitrate and phenylephrine hydrochloride, protected with zero power contact lenses and brought to focus on a semi-opaque tangent screen 57 cm distant, using ancillary lenses. Visual stimuli were viewed monocularly through 3 mm artificial pupils. To further reduce possible eye movement artefacts, posts attached to the stereotaxic frame were fixed to the sclera. At the end of the experiment, all animals were painlessly killed by anaesthetic overdose.
Recordings
Extracellular single units were recorded (Plexon Inc, Dallas, TX, USA) using tungsten microelectrodes. Spectroscopic measurements of OxyHb and MetHb (markers of cerebral flow and nitric oxide levels, respectively) were obtained through a pair of optical fibres attached to the electrode thereby allowing us to record all signals from the location. Light (460–800 nm) was passed through one optical fibre and scattered light was collected by the second and sent to a linear CCD detector device (Oceans optics, Eerbeek, Netherlands) via a compact built-in monochromator. OxyHb, expressed in absorbance arbitrary units, was calculated using the formula:
[(576 nm) − 0.55 × (567 nm) − 0.45 × (587 nm)/15448] × 150
MetHb was calculated from the absorbance at 634 nm (González-Mora et al., 2002
).
Visual Stimulation
Computer-controlled visual stimuli (Lohmann Research Equipment, Germany) were presented on a computer monitor (refresh rate 128 Hz, see de Labra et al., 2007
). Stimuli consisted of full field (8° × 8°) sinusoidal gratings with spatial and temporal frequencies qualitatively selected to produce the best response. Stimulus contrast was defined as [(Lmax − Lmin)/(Lmax + Lmin)] × 100. Our basic experimental paradigm firstly established control responses for spontaneous cell firing and baseline spectroscopy signals (no visual stimulus present). Then the appropriate drifting sinusoidal grating stimulus was presented at a fixed contrast between 0 and 100%, and the responses were compared with those obtained in basal conditions. The typical experimental paradigm included continuous visual stimulation for 2 min with spectral sample durations of 150 ms, which allowed a sufficient number of trials to assess the robustness of the response. The inter stimulus period lasted 2 min.
Pharmacology
To test the hypothesis that NO from different sources acts at different levels of activity, we first blocked NO synthesis and analysed the responses produced at high (100% contrast) and low (10% contrast) intensity stimulation. Two different antagonists of NOS were used: 7-nitroindazole (7-NI; specific for neuronal NOS, nNOS) and the non-specific blocker L-nitroarginine (L-NOArg). Blockers of NOS were injected IV (L-NOArg 5 mg/kg in saline and 7-NI 4 mg/kg dissolved in 0.1 ml DMSO, see Theobald Jr, 2003
), and data were collected between 2 and 30 min after injection. Effects on neuronal responses (NRs) were used as a measure of the degree of efficacy of the drug. In previous control experiments (data not shown) we compared the effect of L-NOArg applied by microiontophoresis with 7-NI IV administration as we have done in this study. The results obtained on cell firing were essentially the same, and from this we decided that 7-NI systemic administration was able to affect LGN cells firing much as shown previously using local application of different NOS inhibitors (see for instance Cudeiro et al., 1994
, 1996
).
Analysis
Results are shown either as raw values or as percentage of the baseline unless otherwise indicated. Statistical analyses were performed using an appropriate t-test; p-values <0.05 were considered statistically significant.
Mathematical validity – modelling from the data
The relationship among MetHb, OxyHb, NR and stimulation intensity (ST) has been analysed using multiple polynomial regression models (see, for instance, Seber and Lee, 2003
). 56 observations with the four variables were recorded. Two polynomial regression models were considered in order to explain each of the variables (MetHb, OxyHb and NR) in terms of the remaining covariables. Polynomial models of a sufficiently high order have been fitted to every dataset. The statistical significance of the estimated principal coefficients of the model has been examined via their p-values. As a consequence, the degree of the polynomial is reduced if such estimated coefficients are not significant. After selecting a final model via this procedure, its corresponding determination coefficient (R2) is reported.
For our data, the final fit was either linear or a second degree polynomial in one or two covariates. Least squares estimates of the model coefficients were obtained. The F-test was used as a significance test to check if every explanatory variable could be removed from the model or if the polynomial degree could be reduced. Diagnostic tools, as residual plots, have been used to confirm the validity of the model as well as to suggest increasing the polynomial degree.
We used the data obtained to check the robustness of the relationship between parameter measures: to predict each of the values of OxyHb, MetHb and NR from the others we have used two different levels of aggregation: the measurement level and the subject level. In the first approach, for every fixed value of ST, the experiment was repeated several times obtaining different values of OxyHb, MetHb and NR. The second approach tries to avoid the intra-subject variability by averaging the values of OxyHb, MetHb and NR along the different measurements performed for every fixed value of ST in each animal. These analyses have been carried out for the whole data set.
Analysis of the coupling of blood flow to neural responses
To bring together all the findings, and provide a simple demonstration of the effect of NO on the relationship between neural activation and blood flow, we quantified the relationship between blood flow, neural response and NO activity, by calculating the percentage of change of blood flow (OxyHb levels) and neural response before and during the effect of 7-NI, while stimulating at either high (100%) or low (10%) contrast.
General Findings
A total of 72 recordings were completed. A typical example of the spectrophotometric signal for OxyHb and MetHb during spontaneous and visual driven activity is shown in Figure 1
A. The presentation of the visual stimulus (a full field sinusoidal drifting grating - in this case, maximum contrast) evoked an increase in absorbance, as shown in the area within the box. The strength of the signal was relatively constant during the presentation of the visual stimulus. The inset box shows the visually elicited response from a single cell recorded simultaneously. Graphs in Figure 1
B illustrate the average increase in OxyHb and MetHb during the stimulus presentation for all the recording sessions (both significantly elevated, p < 0.05), suggesting blood flow and NO production were both significantly increased during visual stimulation.
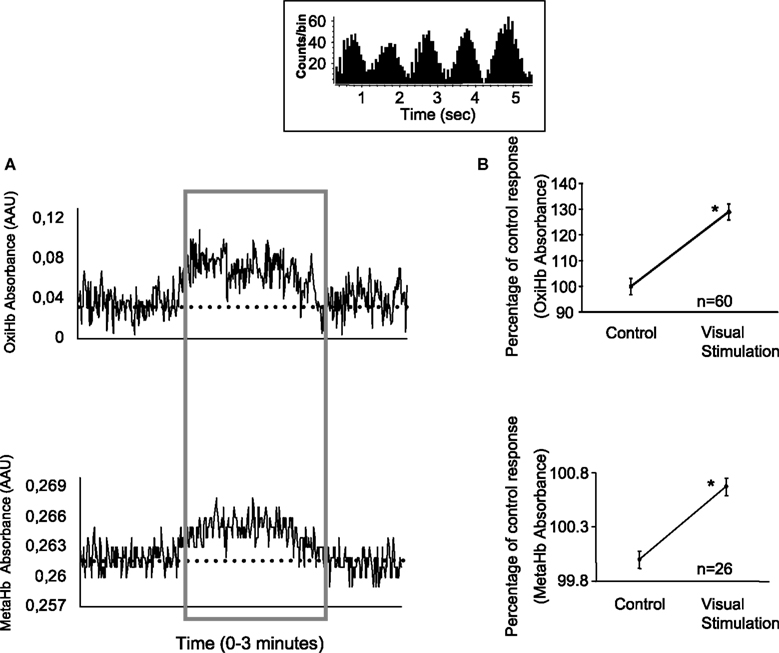
Figure 1. Modulation of OxyHb and MetHb levels by visual stimulation. (A) Typical example of the effects obtained upon metabolic markers with the presentation of a visual stimulus. Each record shows a period of spontaneous activity, prior to a period of visual stimulation (area within the box) which produces an increase of OxyHb and MetHb levels (recorded simultaneously). The dashed line in both graphs represents the average unstimulated activity plus 2 SD. Thus the visually elicited activity would be considered as significantly increased. The inset box shows the neuronal activity evoked by the visual stimulus (drifting sinusoidal grating). (B) Average variation of OxyHb and MetHb levels.
Relationship to Stimulus Intensity
NR, as well as OxyHb and MetHb measurements, changed with stimulus intensity. Figure 2
shows the changes measured during the presentation of a visual stimulus which was varied in contrast, for all recordings (i.e. population data). 0% represents the control, unstimulated condition. For NR (top), there is measurable spontaneous activity, as shown on the Y-axis. For the OxyHb and MetHb, each value is given as the percentage change over the basal value. All parameters show a clear increment with contrast, but only the neuronal signal shows signs of saturation at higher contrast. In order to obtain a deeper understanding of the interactions between the measured variables, we applied multiple polynomial regression models. The number of observations where all four variables (NR, OxyHb, MetHb and contrast) were successfully collected was 56. One outlier was detected. The following regression analyses were performed with this value excluded from the sample.
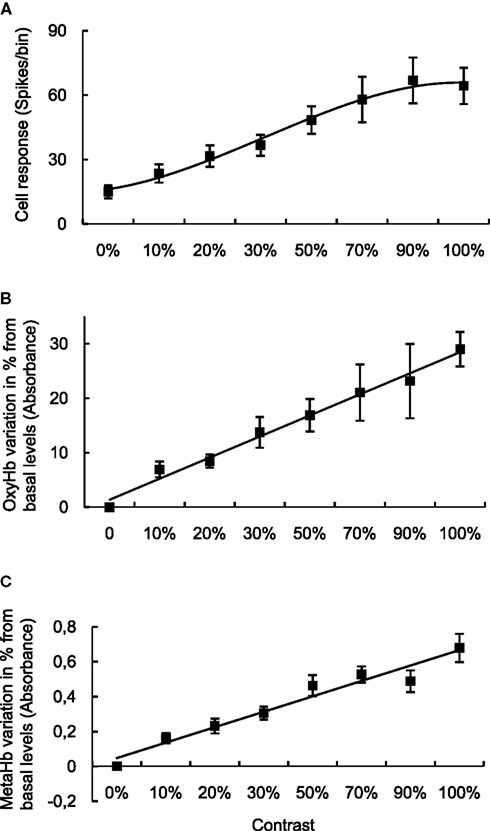
Figure 2. Relationship between metabolic and neuronal responses with stimulus intensity. (A) Contrast response curve obtained varying the contrast from 0% (background cell activity) to 100% versus neuronal response. OxyHb (B) and MetHb (C) levels obtained versus different values of contrast. All data points are average population data.
(i) NR can be partially explained via a linear model with two covariates: MetHb and OxyHb. The p-value of ST in the full model is p = 0.3622. The linear two-covariate regression model to explain neuronal response is NR = 7.9073 + 1.52353· OxyHb + 28.6009· MetHb, which explains about 36% of the NR variability (R2 = 0.36001). The root relative mean squared error of the prediction for this fit is 0.3704. This means that NR can be predicted with a relative error of about 37% using this model (Figure 3
A). This does not mean that NR is not influenced by the intensity of the stimulus, but stimulus intensity does not provide any additional value to the model.
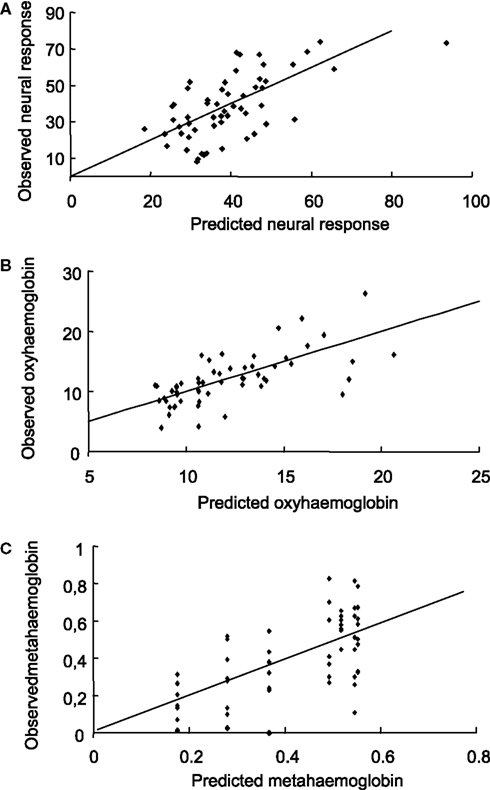
Figure 3. Predictions obtained from the model (I). For every fixed value of the ST, the experiment was repeated several times obtaining different values of OxyHb (% of baseline), MetHb (% of baseline) and neuronal response. Predicted-observed plot for neuronal responses (A), OxyHb (B) and MetHb (C) using the multiple polynomial regression model presented above. The horizontal axis denotes the predicted values, while the vertical axis represents the observed values. The straight line is the diagonal accounting for perfect prediction.
(ii) OxyHb can be fitted by means of a second degree polynomial in NR and first degree in ST. The MetHb coefficient in the full model is not significant (p = 0.2000) and this variable can be removed. The resulting polynomial regression model is OxyHb = 12.4368 − 0.280007·NR + 0.00428137·NR2 + 0.0547904·ST, which captures about 46% of the OxyHb variability (R2 = 0.459758). The root relative mean squared error of the prediction for this fit is 0.2397. This means that OxyHb can be predicted with a relative error of about 24% using this model (Figure 3
B).
(iii) MetHb: finally, a second degree polynomial regression model in ST can be used to explain MetHb: MetHb = 0.0547871 + 0.0128768·ST − 0.0000824903·ST2, which accounts for about 37% of MetHb variability (R2 = 0.372125). OxyHb (p = 0.2292) and NR (p = 0.0941) are not significant when added to the model. The root relative mean squared error of the prediction for this fit is 0.6154. This means that MetHb can be predicted with a relative error of about 62% using this model (Figure 3
C).
In our second approach, multiple polynomial regression models were applied again to the MEAN values of OxyHb, MetHb and NR obtained for the different stimulation intensities in each animal. This was done to get rid of the sampling variability of MetHb, OxyHb and NR within every subject. As a consequence, intra-subject variability is not explained by the following models. The number of observations where all four variables were fully collected was 19, and no outliers were detected.
(iv) NR can be partially explained via a linear model with two covariates: MetHb and OxyHb. The p-value of ST in the full model is p = 0.5628. The linear two-covariate regression model to explain neuronal response is NR = 10.6949 + 0.559294· OxyHb + 52.3099· MetHb, which explains about 84% of the NR variability (R2 = 0.8430). The root relative mean squared error of the prediction for this fit is 0.1806. This means that NR can be predicted with a relative error of about 18% using this model (Figure 4
A).
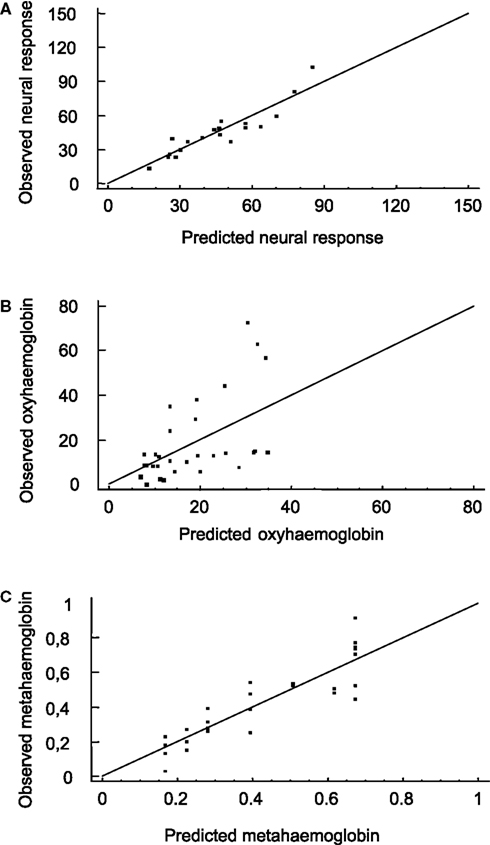
Figure 4. Predictions obtained from the model (II). Multiple polynomial regression models were applied again for the mean values over the sampled neurons of each animal. Predicted-observed plot for neuronal responses (A), OxyHb (B) and MetHb (C). The horizontal axis denotes the predicted values, while the vertical axis represents the observed values. The straight line is the diagonal accounting for perfect prediction.
(v) OxyHb can be fitted by means of a linear model in ST. The MetHb coefficient in the full model is not significant (p = 0.7668) and this variable can be removed from the model. This is also the case for NR (p = 0.7399). The resulting polynomial regression model is OxyHb = 4.06831 + 0.279548·ST, which captures about 28% of the OxyHb variability (R2 = 0.2837). The root relative mean squared error of the prediction for this fit is 0.6968. This means that OxyHb can be predicted with a relative error of about 70% using this model (Figure 4
B).
(vi) MetHb: a linear regression model in ST can be used to explain MetHb: MetHb = 0.110922 + 0.00563275·ST, which accounts for about 78% of MetHb variability (R2 = 0.7819). OxyHb (p = 0.7668) and NR (p = 0.3322) are not significant when added to the model. The root relative mean squared error of the prediction for this fit is 0.2713. This means that MetHb can be predicted with a relative error of about 27% using this model (Figure 4
C).
Relationship to NO Source
The results above show a relationship between OxyHb and MetHb which opens a question about how NO production is controlled. In the visual thalamus NO has two major sources (i) endothelial NO, with neuronal and/or astrocyte mediated regulation and (ii) neuronal NO released from the afferent cholinergic–nitrergic fibres arising in the parabrachial region of the brainstem which in cats are the only source of neuronal NO in the LGN (Bickford et al., 1993
, but see Section “Discussion” and Bickford et al., 1999
). A plausible explanation is that both sources of NO are brought into play at different levels of neural activity. We tested this hypothesis by comparing the effects of a specific nNOS blocker to that of a non-specific blocker.
Injection of L-NOArg produced an increase in BP (mean ± SEM: 123 ± 9/86 ± 4 to 136 ± 8/103 ± 3 p ≤ 0.05, t-test). This was detected ∼14 min after injection. In agreement with published data (Schulz et al., 1995
; Cholet et al., 1997
; Koss and Yu, 2000
; Jiang et al., 2002
), 7-NI did not significantly modify BP.
The results are shown in Figure 5
. Figure 5
A shows that both inhibitors significantly reduce NRs at high (contrast = 100%) and low intensity stimulation (contrast = 10%), with the effect of L-NOArg being more pronounced in both cases, as expected from the non-specific inhibitor. Interestingly, while L-NOArg shown a similar effect on NO and OxyHb levels (Figures 5
B,C, respectively) causing a reduction in both parameters at all stimulus intensities, 7-NI shows a stimulus specific effect, acting only at high intensity stimulation, not affecting at evoked NO and OxyHb during low contrast stimulation. The data support the view that nNOS reduces firing at high and low contrast, but differentially affects blood flow. We examined this phenomenon in another way in Figure 6
. This figure compares the percentage of change of blood flow (OxyHb levels) and neural response before and during the effect of 7-NI, for low and high contrast stimulation. While both parameters are significantly reduced at high contrast stimulation (cell firing 27%: 55 ± 16 to 40 ± 10; OxyHb 45%: 31 ± 10 to 14 ± 4.7), no significant effect is seen on blood flow during the presentation of low contrast stimuli (8.7%, from 6.9 ± 1.8 to 7.5 ± 0.5), even when neuronal activity levels are significantly reduced (64%, 19.5 ± 5 to 7 ± 1).This indicates a significant decoupling of blood flow and neural responses at these two stimulus intensities.
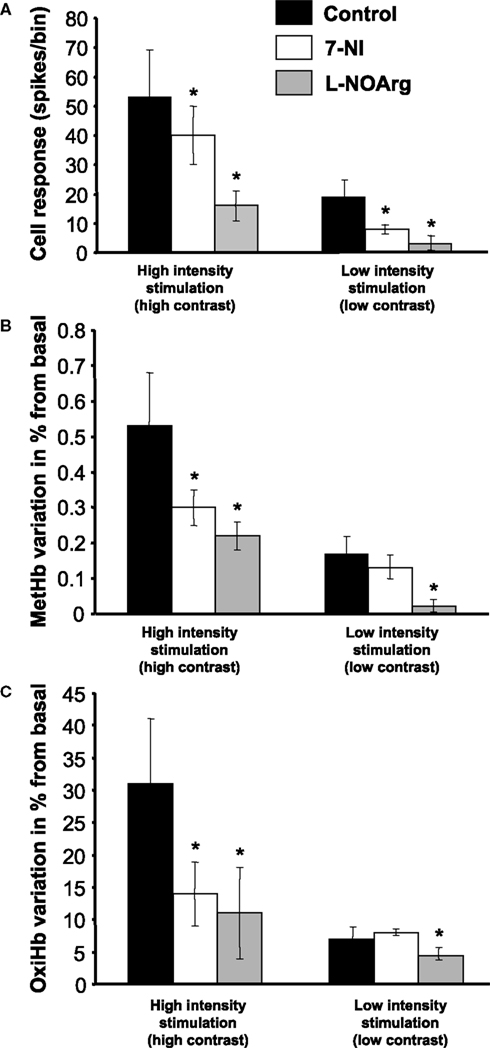
Figure 5. Effects of NOS blockade on neuronal and metabolic signals. Effects obtained after 7-NI (specific nNOS blocker) or L-NOArg (non specific NOS blocker) I.V. injections on neuronal responses (A), MetHb (B) and OxyHb (C) for high (100%, bars on the left part of the figure) and low (10%) contrast stimulation (bars on the right part of the figure). *Represents significant differences (t-test; p < 0.05) when compared with the control condition.
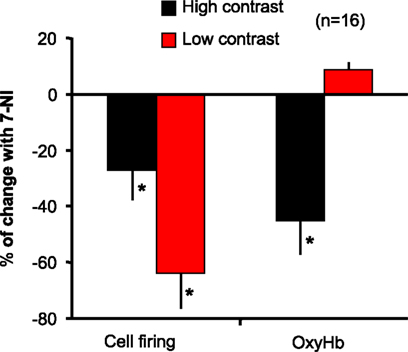
Figure 6. Effect of stimulus intensity on the coupling between blood flow and neural response. The values of blood flow, as measured by OxyHb levels, are directly compared to neural responses for control and 7-NI conditions, under each of two stimulus conditions – high (100%) contrast and low (10%) contrast. When nNOS is blocked there is no significant effect on blood flow during the presentation of low contrast stimuli, even when neuronal activity levels were significantly reduced. *Represents significant differences (t-test; p < 0.05).
Our results demonstrate a relationship between NO production, blood flow, and NRs, showing that NO is able to regulate blood flow in active brain areas, with different sources of nitric oxide acting specifically at different levels of response. The production of NO necessary to maintain higher neuronal activity and guarantee the availability of higher amounts of OxyHb appears to be derived from nNOS. In this scenario, at low intensity stimulation an initial increase in blood flow is obtained by a mechanism that requires small increments in basal NO concentrations. Our data can not explain the mechanism by which low levels of driven visual activity are able to produce small increments of NO, but strongly suggests a link to eNOS activation. Under basal conditions, tonic release of NO is a significant regulator of resting cerebral blood flow. It has been demonstrated that eNOS is an important source of the NO that contributes to the basal tone of cerebral arteries (Tanaka et al., 1991
; Wang et al., 1995
; Atochin et al., 2003
) yet it is know that dilation of cerebral vessels occurs following neural stimulation (Cox et al., 1993
; Iadecola et al., 1997
). In our case a simple explanation of our data would be to suggest that the initial changes in NO derives from the endothelial isoform of NOS present in astrocytes (Wiencken and Casagrande, 1999
) acting in response the retinal glutamatergic input to LGN cells. It is known that glutamate can mobilise Ca2+ stores in astrocytic endfeet and this leads to a dilatation of local cerebral arterioles (Zonta et al., 2003
). Several mediators have been implicated in these vascular changes but significantly includes NO produced by astrocytic eNOS activation (see Iadecola and Nedergaard, 2007
for a recent review). On the other hand, stimulation at high intensity (in our case by using high contrast) would activate the brainstem system. Available evidence shows that, in the thalamus of the cat, nNOS is specifically colocalised within the cholinergic brainstem–thalamic axons (the major source of NO of neuronal origin in the cat’s LGN, see Bickford et al., 1993
, but see also Bickford et al., 1999
, suggesting a local NOS presence in a small proportion of intrinsic inhibitory interneurons) and it is also known that NO production in the LGN as a result of activity in the brainstem activating system is directly relevant to visual processing (for a review, see Cudeiro and Rivadulla, 1999
). With the data we present here, we can suggest that brainstem inputs seem to be capable of regulating neuronal activity by means of NO release that acts not only on neurons but also on blood vessels, modulating the oxygen stores necessary for neural responses. Although the variations observed in MetHb levels (the NO marker) were relatively small, it is important to underline that they were statistically significant and clearly associated with the magnitude of visual responses. To date, there are few studies using spectrophotometry as a technique to evaluate variations of NO levels; however, our data fit observations made by others quite well (Kelm et al., 1997
; González-Mora et al., 2002
).
We must question to what extent our data could be related to “peripheral” changes, for example changes in blood pressure? It has been demonstrated that systemic application of 7-NI does not affect BP (Schulz et al., 1995
; Cholet et al., 1997
; Koss and Yu, 2000
; Jiang et al., 2002
). Therefore the simplest explanation for our data is that 7-NI is inhibiting NO synthesis and consequently reducing NO levels. On the other hand, L-NOArg has been shown to increase BP. Our results are in agreement with available data which shows that, in cats, mean BP increases significantly after ∼20 min of L-NOArg application (IV), returning to control values ∼10 min later (Yabe et al., 1998
). However there are several reasons to believe that this change is not responsible for our findings: (i) The effects obtained in our experiments following L-NOArg administration were similar in nature to those obtained with 7-NI (although stronger since presumably both nNOS and eNOS were affected). (ii) In our experiments we started data collection 2 min after L-NOArg administration and we kept going for 20–30 min. Since we observed significant changes in cell firing, OxyHb, and MetHb levels as early as 4 min after drugs application, it is unlikely that the observed effects were due to peripheral changes, (iii) in an attempt to reduce such side effect we selected doses of NOS blockers which were submaximal, thereby reducing but not abolishing NO production, and (iv) the effects observed on cell responses were similar to those observed with local application of NOS inhibitors (Cudeiro et al., 1994
, 1996
). Consequently we feel confident that the effects we report are a direct result of NOS inhibition, rather than secondary effects.
Our data reinforces the view that there are at least two sources of NO extant in our preparation: nNOS from the parabrachial innervation (or locally in a sub-population of interneurons, see above) and locally derived eNOS, associated with the vasculature and related tissues. Their relative contribution to the neural firing and vascular responses seem to be related to the intensity of (visual) stimulation. Interestingly, recent evidence suggests that in the rat somatosensory cortex a certain amount of increased neuronal activity is required for cerebral blood flow to increase, and that there is a linear coupling between blood flow and neuronal activity within a limited range of stimulation intensities and frequencies (Nielsen and Lauritzen, 2001
). This finding has been expanded further by means of a general mathematical model applied to rat cerebellum (Rasmussen et al., 2008
). In our hands, and in the range of intensities (contrasts) used, the spectroscopy signal also changed linearly. However, it is important to bear in mind that in our experiments we did not systematically change parameters of the stimulus other than contrast, rather we always selected the “optimal set” of other parameters (spatial and temporal frequency, etc.,) for each sampled cell. Such a restriction in parameter space may well provide the reason why we did not detect deviations from linearity, suggesting that for optimal (or near optimal) stimulation LGN cells show a linear behaviour – we will return to this below. However, basically, our data shows that at low intensity of stimulation an initial increase in OxyHb levels is obtained by a mechanism that involves small increments in NO probably related to eNOS activation. As the intensity of stimulation increases, there is a parallel increment of NO production, but now derived from a shift from eNOS to nNOS, utilising a neuronal source. Thus in a sense one might regard the eNOS activation as part of the range of basal activation, or low-pass activity, with nNOS activation acting as a high-pass switch or augmentation, activated as “stimulation” increases (whether by increased contrast, as in our case, or other stimulus derived shifts, which might include attention etc). On the other hand, nonlinear behaviours in the fMRI signal have been previously reported (Yang et al., 2000
; Logothetis et al., 2001
; Sheth, 2004
). Despite the physiological differences between models, awake humans in fMRI studies or anaesthetised animals, we propose that the dual NO mediated mechanism described here could underlie some nonlinearities in neurovascular coupling. We will return to these nonlinearities below.
We have attempted to analyse our methods and results to derive possible mathematical relationships between the measured parameters, in order to begin to derive a predictive space in which physiological measures of one parameter could be used to predict another, thereby rendering direct measurement unnecessary. Given the extent of the parameter space involved, detailed analysis of the results obtained with the models used in our study show that OxyHb (and MetHb) levels can only partially explain NRs with relative error between 37 and 18%, depending on the level of aggregation employed. We must accept that we chose to record only single neuronal activity and that OxyHb levels are likely to be influenced by the (large!) number of activated neurons. Indeed, as an example, it is likely that the population of active neurons will increase with stimulus intensity, as higher intensities “bring in” neurons operating outside their preferred stimulus range. This aside, our data can support the view taken by several workers (Logothetis et al., 2001
; Viswanathan and Freeman, 2007
, 2008
; Nir et al., 2008
; Rasmussen et al., 2008
) that a substantial part of the signal is dependent on other components of NR, different from spiking activity. For example, data related to increases in the cerebellar cortex blood flow found a strong correlation between the maximal amplitudes of field potentials and blood flow (Mathiesen et al., 1998
, 2000
). Moreover, using a mathematical model, it has been shown the existence of temporal coupling between activity in cerebellar nerve cells and local increases in blood flow, but increased spike activity was not a condition for evoking a blood flow increment (Mathiesen et al., 1998
, 2000
). How accurate is the prediction of neuronal activity from our surrogate markers of blood flow and nitric oxide? Two different levels of combination have been considered in our study, in order to predict the behaviour of OxyHb, MetHb and NR: the measurement level, which attempts to find a single model for the measurement variables at the level of the whole population of subjects; and the subject level, that tries to avoid the intra-subject variability by averaging the values. Generally speaking the first approach seems less successful in accurately predicting the individual values of any of the three variables (OxyHb, MetHb or NR). However, the situation is different when using the second approach. The average value of NR (over several measurements) can accurately be predicted just by using the MetHb and OxyHb data, with a relative error of 18%. Similarly, average values of MetHb can be predicted reasonably well by ST. In this case, the relative prediction error is about 27%. These results, mainly those concerned with estimations of neuronal activity from changes in haemoglobin, might have important implications in the interpretation of techniques such as fMRI. The fit for OxyHb is far from optimal. Only 28% of the average OxyHb variability (relative error 70%) can be explained via the regression model given above. This is, somehow, a paradoxical outcome, and probably reflects a weakness in the model at this level of aggregation since neither NR or MetHb add relevant information and hence are not used for OxyHb prediction. This could explain why the results obtained for OxyHb prediction were so poor. More involved statistical techniques are available to analyse the relationship among OxyHb, MetHb, NR and ST, including mixed models and nonparametric or semiparametric regression estimation. However, due to the “curse of dimensionality” the sample size required to apply nonparametric methods is very large. For this reason the use of these statistical techniques is beyond the scope of this paper.
The final issue to address is straight forward. Although confounding the source of NO, our data, as exemplified in Figure 6
, clearly suggests that there is no clear linear coupling between blood flow and neural response elicited by stimuli of low and high intensity, when control by NO production is used to dissect the relationship. We believe that the simplest explanation for this suggestion is the differential activation of the two iso-forms of NOS available to the nervous system, for the control of physiological situations at lower levels of intensity, versus the requirement for heightened neural activation, (and concomitant blood flow) induced by high intensity stimulation. We suggest that this is a model for thalamic function which should be investigated further, possibly through other sensory modalities, and higher levels of cognitive engagement.
The authors declare that the research was conducted in the absence of any commercial or financial relationships that could be construed as a potential conflict of interest.
Supported by MEC (BFU2005-00502) and Xunta de Galicia (Consellería de Educación-2007/000140-0), Spain. We are indebted to Dr K.L. Grieve for his valuable comments and corrections in the manuscript.
Kwong, K. K., Belliveau, J. W., Chesler, D. A., Goldberg, I. E., Weisskoff, R. M., Poncelet, B. P., Kennedy, D. N., Hoppel, B. E., Cohen, M. S., Turner, R., Chen, H-M., Bradyt, T. J., and Rosent, B. R. (1992). Dynamic magnetic resonance imaging of human brain activity during primary sensory stimulation. Proc. Natl. Acad. Sci. USA 89, 5675–5679.
Shi, Y., Liu, X., Gebremedhin, D., Falck, J. R., Harder, D. R., and Koehler, R. C. (2008). Interaction of mechanisms involving epoxyeicosatrienoic acids, adenosine receptors, and metabotropic glutamate receptors in neurovascular coupling in rat whisker barrel cortex. J. Cereb. Blood Flow Metab. 28, 111–125.