1
Institut für Neurobiologie, Freie Universität Berlin, Berlin, Germany
2
Graduate School of Life Sciences, Tohoku University, Sendai, Japan
3
Neurobiologie, Universität Konstanz, Konstanz, Germany
An important component in understanding central olfactory processing and coding in the insect brain relates to the characterization of the functional divisions between morphologically distinct types of projection neurons (PN). Using calcium imaging, we investigated how the identity, concentration and mixtures of odors are represented in axon terminals (boutons) of two types of PNs – lPN and mPN. In lPN boutons we found less concentration dependence, narrow tuning profiles at a high concentration, which may be optimized for fine, concentration-invariant odor discrimination. In mPN boutons, however, we found clear rising concentration dependence, broader tuning profiles at a high concentration, which may be optimized for concentration coding. In addition, we found more mixture suppression in lPNs than in mPNs, indicating lPNs better adaptation for synthetic mixture processing. These results suggest a functional division of odor processing in both PN types.
Animals perceive their external chemical environment by a repertory of odorant receptor neurons (ORN), each of which expresses only one or two members of the odorant receptor gene family (Chess et al., 1994
; Vosshall et al., 2000
). The axons of ORNs expressing the same gene converge at a specific set of glomeruli in the primary olfactory center, the main olfactory bulb (MOB) in mammals and the antennal lobe (AL) in insects, thus providing a map of spatially arranged functional modules (Mombaerts et al., 1996
; Gao et al., 2000
; Vosshall et al., 2000
).
The primary olfactory center is generally segmented into several subregions. In mice, the MOB is subdivided into two non-overlapping regions by a separation of olfactory epithelium (OE), a dorsal zone and a ventral zone, as indicated by an axonal surface glycoprotein, OCAM (Yoshihara et al., 1997
). The mouse ORNs can be classified into two groups by the gene family; the class I and class II receptors, the former being exclusively expressed in the dorsal zone of the OE (Zhang et al., 2004
). Moreover, the dorsal MOB is clearly subdivided by these two receptor types (Bozza et al., 2009
). Similarly, the AL of the insects can be subdivided with respect to the origin of second order olfactory projection neurons (PN) that receive input from non-overlapping glomeruli (uniglomerular PN, Homberg et al., 1988
; Stocker et al., 1990
; Malun et al., 1993
; Rø et al., 2007
; Zube et al., 2008
).
The topographical organization is particularly well described in the honeybee, in which four sensory tracts of ORNs subdivide the AL into four regions (T1-4; Mobbs, 1982
; Abel et al., 2001
; Kirschner et al., 2006
; see Figure 1
B). PNs that run through the lateral antenno-cerebral tract (lPN) innervate frontally located T1 glomeruli, while PNs in the medial antenno-cerebral tract (mPN) innervate proximally located T2-4 glomeruli in the AL. The central projection areas of the two PN tracts are segregated in the mushroom body (MB) calyx and the lateral horn (LH) with partial overlap (Abel et al., 2001
; Kirschner et al., 2006
).
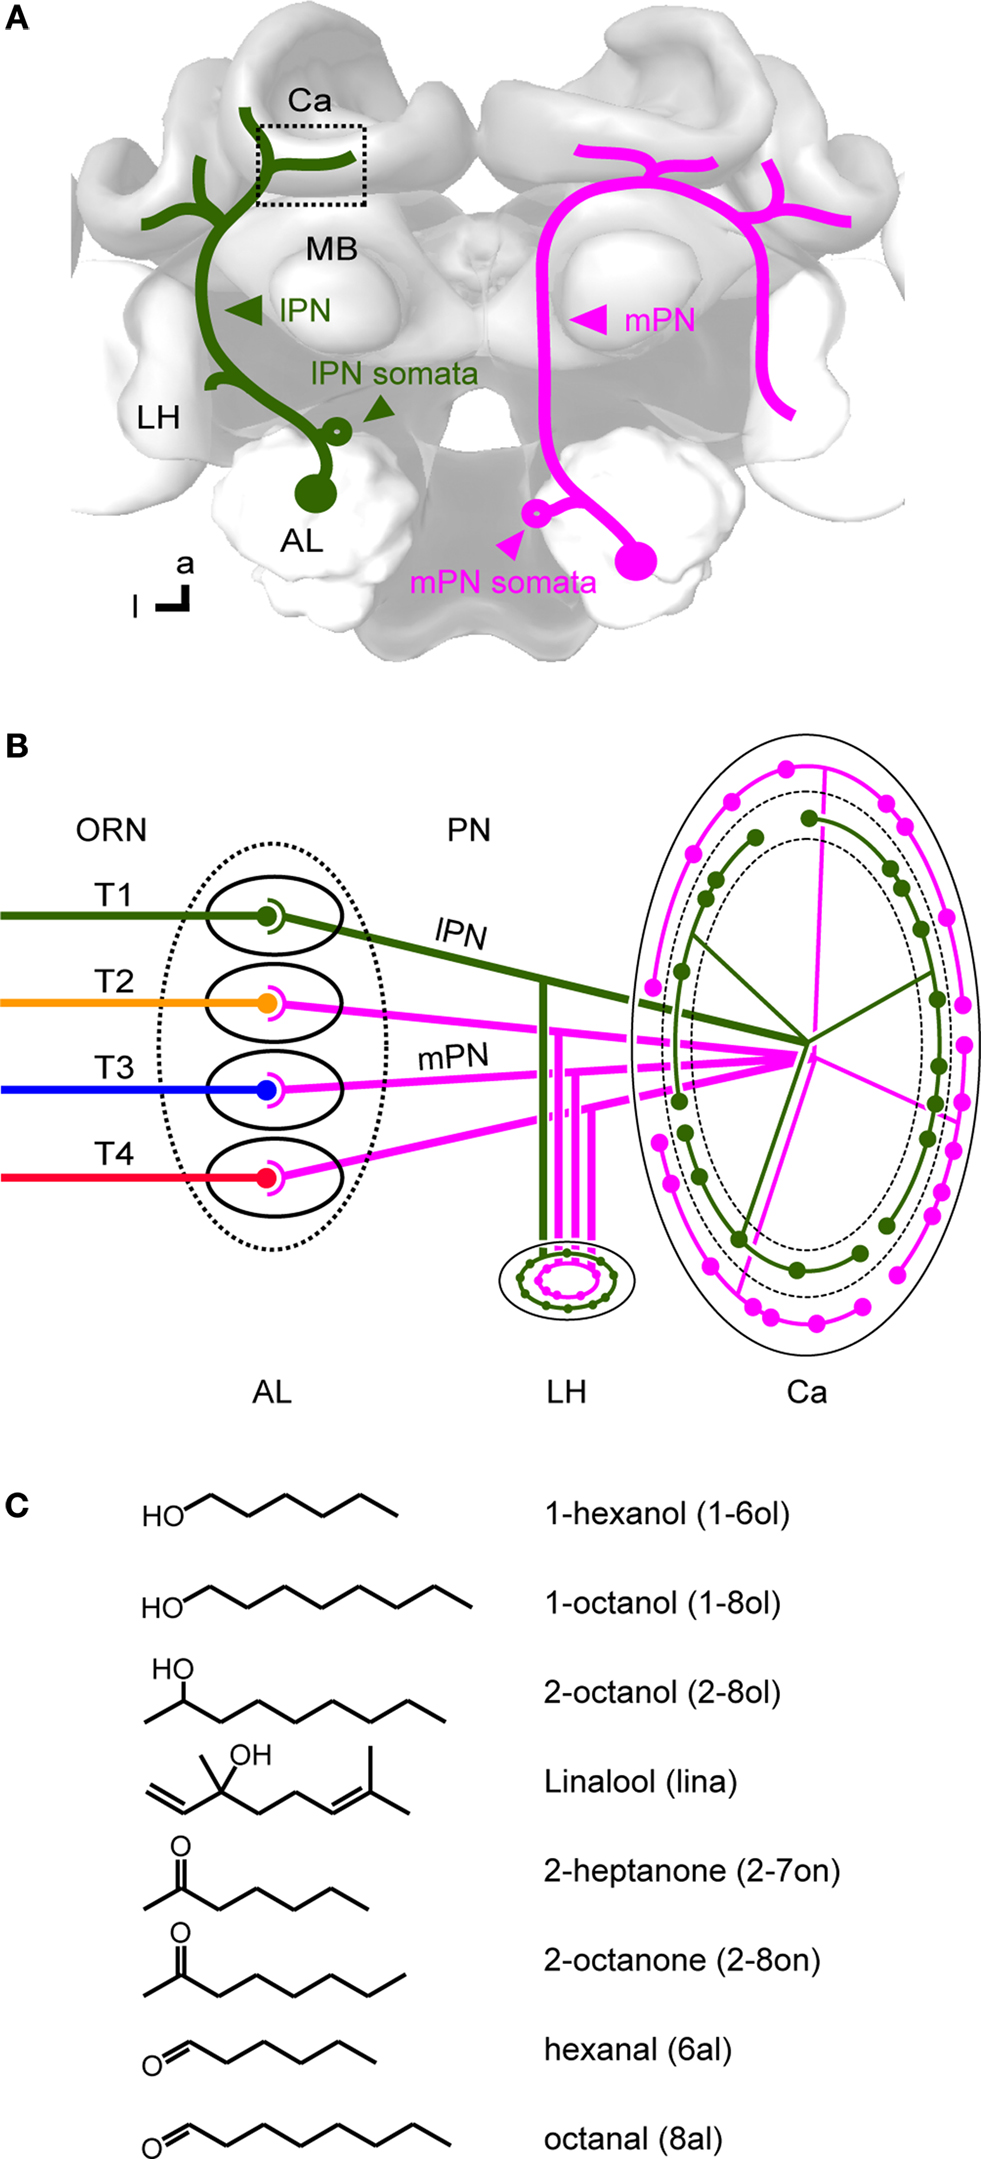
Figure 1. Olfactory pathways in the honeybee brain. (A) Two main olfactory pathways comprised of uniglomerular projection neurons (PN) connect the primary olfactory neuropil, the antennal lobe (AL), and second order neuropils, the mushroom body (MB) and the lateral horn (LH). Both types exist in each side of the brain, and are drawn here separately in the right and left side of the brain for clarity. The lateral-antennocerebral tract neurons (lPN), which travel in the protocerebrum lateral to the mushroom body, is shown in green only on the left side, and the medial-antennocerebral tract neurons (mPN), which travel in the protocerebrum medial to the MB, is shown in magenta only on the right side. These neurons were selectively stained via their somata in the AL. The square indicates the imaged region in the lip of the MB calyx. (B) Wiring diagram of olfactory neurons in the AL and the MB. Odors are detected by olfactory receptor neurons (ORN) on the antennae. ORN axons project into the AL via four parallel tracts (T1-4, Mobbs, 1982
; Abel et al., 2001
). ORNs running in the different tracts form synapses with non-overlapping groups of glomeruli, the processing units in the AL. lPNs project from T1 glomeruli to the protocerebrum and terminate mainly in the core of the MB calyx lip (Ca). mPNs project from T2-4 glomeruli to the protocerebrum and terminate mainly in the rim of the Ca lip (Kirschner et al., 2006
). Orientation of the brain is shown in neuroaxis. a: anterior and l: lateral in brain orientation. (C) Chemical structure of odors used in this study and their abbreviations.
Unlike other sensory systems, a topographic functional organization, i.e. ‘Chemotopy’, is not found in the primary olfactory centers (Fishilevich and Vosshall, 2005
; Hallem and Carlson, 2006
; Soucy et al., 2009
), implying their zonal organizations do not relate to chemical properties of odorants. In addition, non-sexual social pheromones in honeybees are processed together with general odors in the primary olfactory center (Sandoz, 2006
; Sandoz et al., 2007
), in sharp contrast to sex pheromone that are processed in specialized regions (Christensen and Hildebrand, 2002
; Lei et al., 2004
). No functional separation or distinction between such social pheromone and general odor processing has been observed in the bees’ two parallel PN pathways (Sun et al., 1993
; Abel et al., 2001
; Müller et al., 2002
). In mice, however, it was reported that glomerular subsets of the MOB that correspond to the dorsal zone of the olfactory epithelium mediate innate responses to aversive odors (Kobayakawa et al., 2007
). Further studies are required to understand how the brain interprets categories of odors, and uses the topographical information in the olfactory system.
Electrophysiological studies of honeybee PN suggest a functional separation of lPNs and mPNs in odor coding (Müller et al., 2002
; Krofczik et al., 2009
). The conclusions of these two studies are not fully consistent, and are based on a relatively small number of sampled neurons due to technical difficulties encountered in intracellular electrophysiology.
Here we used selective infiltration of Ca2+ sensors via the somata to measure odor-induced activity in boutons of the lPNs and mPNs in the MB calyces. We found (1) less concentration dependence in lPNs, but clearly rising concentration dependence in mPNs, (2) more narrow tuning profiles in lPNs and broad tuning profiles in mPNs at a high odor concentration, and (3) more mixture suppression in lPNs than in mPNs. These results suggest a functional division of odor processing in the two types of PN.
Preparation and Dye Loading
Foraging worker honeybees were collected at the entrance of laboratory hives, chilled, fixed in recording chambers with low temperature melting wax (Joerges et al., 1997
; Szyszka et al., 2005
), and fed with a drop of 30% sucrose solution. The head capsule between the compound eyes was opened. Glands and trachea sacks covering the AL were carefully removed. The tip of a pulled glass capillary was broken forming a tip diameter of ∼10 μm, and was coated with a mixture of the calcium-sensitive dye Fura-dextran (10 000 MW, Molecular Probes, Eugene, OR, USA) and the lysine fixable dye tetramethylrhodamine-dextran (10 000 MW, Molecular Probes, Eugene, OR, USA) dissolved in distilled water. The dye-coated tips were used to penetrate either the soma cluster of the lPNs or mPNs. Somata of lPNs are located antero-ventral to the AL, and those of mPNs are located medio-postero-dorsal to the AL (Figure 1
A, Abel et al., 2001
; Kirschner et al., 2006
). The head capsule was then closed with the cut cuticle piece and sealed with n-eicosan (Sigma). The bees were fed until satiation and kept in a moist container at 17–20°C for 8–24 h. To stabilize the brain, the legs and wings were cut and the abdomen, thorax and mandibles were immobilized with wax. The antennae were fixed with n-eicosane and the calyces of the MB were exposed for measurements. All gaps around the head were sealed with vaseline (local drugstore), and the recording chambers were filled with Ringer solution (in mM: 130 NaCl, 7 CaCl2, 6 KCl, 2 MgCl2, 160 sucrose, 25 glucose and 10 HEPES, pH 6.7, 500 mosmol).
Odor Stimulation and Imaging
The odorants were diluted in decade steps to 10−5. Seven odors 1-hexanol, hexanal (Merck), 1-octanol, 2-octanol, linalool, 2-heptanone, octanal (Sigma, Deisenhofen, Germany) diluted to 10−2 were used for chemo-profile experiments and three odorants hexanal, 2-heptanone, 1-octanol (at all six concentrations) were used for odor concentration experiments. Their chemical structures are shown in Figure 1
C. As binary mixtures we used 1-octanol plus 2-heptanone and hexanal plus 2-octanone (1% of each odor). The bees were exposed to a constant air stream, into which the head space of a syringe (12 ml) containing a filter paper (1 cm2 × 2) soaked with paraffin oil (control) or one of the odorants (40 μl) was injected. Injection of the control air or the odorant into the constant air stream was switched on and off by a computer-controlled solenoid valve (Galizia et al., 1997
) without changing the total airflow. Odors were presented for 3 s three times at an interval of 90 s.
Calcium measurements were performed at room temperature with a sampling rate of 5 Hz, using a TILL-Photonics imaging set up mounted on a fluorescence microscope (Zeiss Axioskop, Germany). Fura was alternately excited at 340 and 380 nm. Exposure times were 15∼ and 60∼ ms, respectively. Each measurement started 3 s prior to stimulus onset and lasted for 10 s. Images were acquired through a 60×/0.9 NA, waterdip objective (Olympus, Tokyo, Japan), a 410-nm dichroic mirror and a 440-nm long pass filter with an Imago CCD camera (640 × 480 pixels, 4 × binned on chip to 160 × 120). Pixel size was 1.47 × 1.47 μm, which allowed resolution of a single bouton of a PN.
Confocal Microscopy
After Ca2+ measurements, the brain was dissected and fixed in 4% formaldehyde in Millonig’s buffer overnight at 4°C and then rinsed in saline, dehydrated in ethanol, and cleared in methyl salicylate. The brain was set into a chamber filled with methyl salicylate and observed from the frontal surface with a confocal laser-scanning microscope (Leica TCS SP2; Leica, Wetzlar, Germany). The excitation wavelength was 543 nm with a Green HeNe laser. The entire brain was scanned with a 10×/0.4 NA air objective (Olympus, Tokyo, Japan). The AL was scanned with a 20×/0.70 NA air objective (Olympus, Tokyo, Japan). The MB calyx was scanned with a 63×/1.32–0.6 NA oil objective (Olympus, Tokyo, Japan).
Data Analysis
Data were first analyzed with custom-made programs in IDL (RSI, Boulder, CO, USA). The ratio of Ca2+ signals from 340 and 380 nm measurements was calculated for each individual frame. Background fluorescence was determined by averaging over frames 4–13, and the average was subtracted from every frame of the ratio metric measurements (ΔF340/380). For visualization, these relative fluorescence changes were corrected for dye bleaching by subtracting a logarithmic curve fitted to the mean brightness decay over all image frames except for two frames at the beginning and during the stimulus (frames 15–29). A mean of 15 frames during odor stimulation was calculated and displayed as a false-color image (Figures 2
, 3
, 5 and 6
). A spatial low-pass filter (5 × 5 pixels) was applied to the images for better visualization. Each morphological image was acquired as an averaged raw fluorescence image of 380 nm during the measurements and was later unsharp mask-filtered in Photoshop (Adobe).
Individual boutons were determined as isolated activity spots in the false-color images. For each bouton a response trace was calculated by averaging the signal of 21 pixels of an activity patch without any filtering and correction. Response traces were analyzed with Matlab (The Mathworks, Natick, MA, USA). Since individual response traces defined by such small activity patches were often noisy and could not be fitted well by logarithmic curve, they were corrected for dye bleaching by subtracting a linear regression line fitted for frames 5–14 and 40–49. An odor response (excitation/inhibition) in a given bouton for a given odor was determined by comparing the response trace of an average of three trials (trial-averaged trace of the same odor) with a threshold criterion. The threshold was determined in each experiment as double the standard deviation of all fluorescence values over a period of 2 s before stimulation derived from trial-averaged response traces of all possible bouton/odor combinations. Specifically, an excitatory response was defined as a given time trace of the bouton exceeding the baseline amplitude (calculated as an average of pre-stimulus fluorescence values of response traces of all boutons/odors in each bee) plus the threshold at least twice during odor application (frames 15–29). An inhibitory response was defined as the time trace being lower than the averaged amplitude minus the threshold at least twice during odor application. Since some boutons crossed both excitatory and inhibitory thresholds during odor exposures, the sum of excitatory and inhibitory responses could exceed the number of boutons (Figures 5
D,E, Figure S3B in Supplementary Material).
Statistical analyses were done with Excel (Microsoft) and Matlab. Most of the statistics were performed by pooling boutons from different bees (Figures 3
–6
). All of the boutons for which measurements were performed were included, and either response traces of individual trials (Figure 5
C, Figure S4 in Supplementary Material) or trial-averaged traces (Figures 3
C, 4
, 5
D,E and 6
, Figures S1 and S3 in Supplementary Material) were used. In order to quantify similarities in the activity of populations of boutons for each animal with respect to different concentrations of odors (Figure 3
C), response traces from all boutons in the particular animal were serially concatenated into an array for each odor concentration during and after odor stimulus (frames 15–50). Similarities were then calculated by Pearson’s correlation coefficient for all concentration combinations, plotted against concentration differences in log scale. Linear regression was applied for statistical tests of the relationship between them. Similarities of activity of populations of boutons with respect to different odors were calculated by Pearson’s correlation coefficient applied for a series of serially concatenated response traces from all boutons for each odor (Figure 5
C). Single-trial traces were used to calculate response similarity among different trials in each odor (inter-trial correlation) and compare them with those between different odors (inter-odor correlation). Due to all possible combinations of three trials, this treatment provided three inter-trial correlation coefficient values for each odor. For each odor combination, all possible combinations of three traces of two odors produced a total of nine inter-odor correlation coefficient values. These values were averaged first respectively for subsequent comparison between inter-trial and inter-odor correlations of lPN and mPN.
To quantify odor concentration dependence of response magnitude of a given bouton (Figure 4
), first the response strength of each bouton was determined for each concentration as the averaged fluorescence amplitude during the odor stimulus (trial-averaged response trace used). The relations between odor concentrations and corresponding response magnitudes in each bouton was quantified by applying linear regression (Pearson’s correlation coefficient) between logarithm of rising concentrations (six steps) and of the corresponding normalized response strength (set maximum to 1 in each bouton). Boutons were then sorted into positive (rising) dependence group or negative (falling) dependence group when their response dependence was statistically significant, and sorted into the no dependence group when their dependence was not statistically significant.
In order to assess the effect of odor mixture suppression, the response strength of boutons to binary mixtures and their components were compared. If the responses to the mixture were smaller than the response to the weaker component minus noise, the bouton was assigned to the group showing mixture suppression (Figure 6
). The response strength of boutons was determined in the same way described above. Noise was defined as the standard deviation of fluorescence values of the trial-averaged response traces from all boutons/odors in a bee over a period of 2 s before stimulation. For comparisons of the probability of the mixture suppression group between lPNs and mPNs, log-likelihood tests were applied for the absolute number of the group in pooling boutons.
We investigated the response properties of lPN and mPN boutons in the lip region of the MB calyx (Figure 1
). lPNs and mPNs were stained with a mixture of the Ca2+ indicator Fura-dextran and the neuroanatomical tracer rhodamine-dextran via their somata. The somata of lPNs and mPNs are located separately in the rim region of the AL. lPNs were filled via an antero-ventral soma cluster, and mPNs via the medio-postero-dorsal somata cluster (Figure 1
A). Combining Ca2+ imaging with subsequent anatomical evaluation allowed us to investigate the lPN and mPN boutons separately. Confocal imaging confirmed the selectiveness of the stained PN types in all bees (57 bees, Figure 2
A) and the branching patterns of axon trees as well as their boutons in the lip region of the MB calyces (lPN: 5 bees; mPN: 6 bees, Figure 2
B).
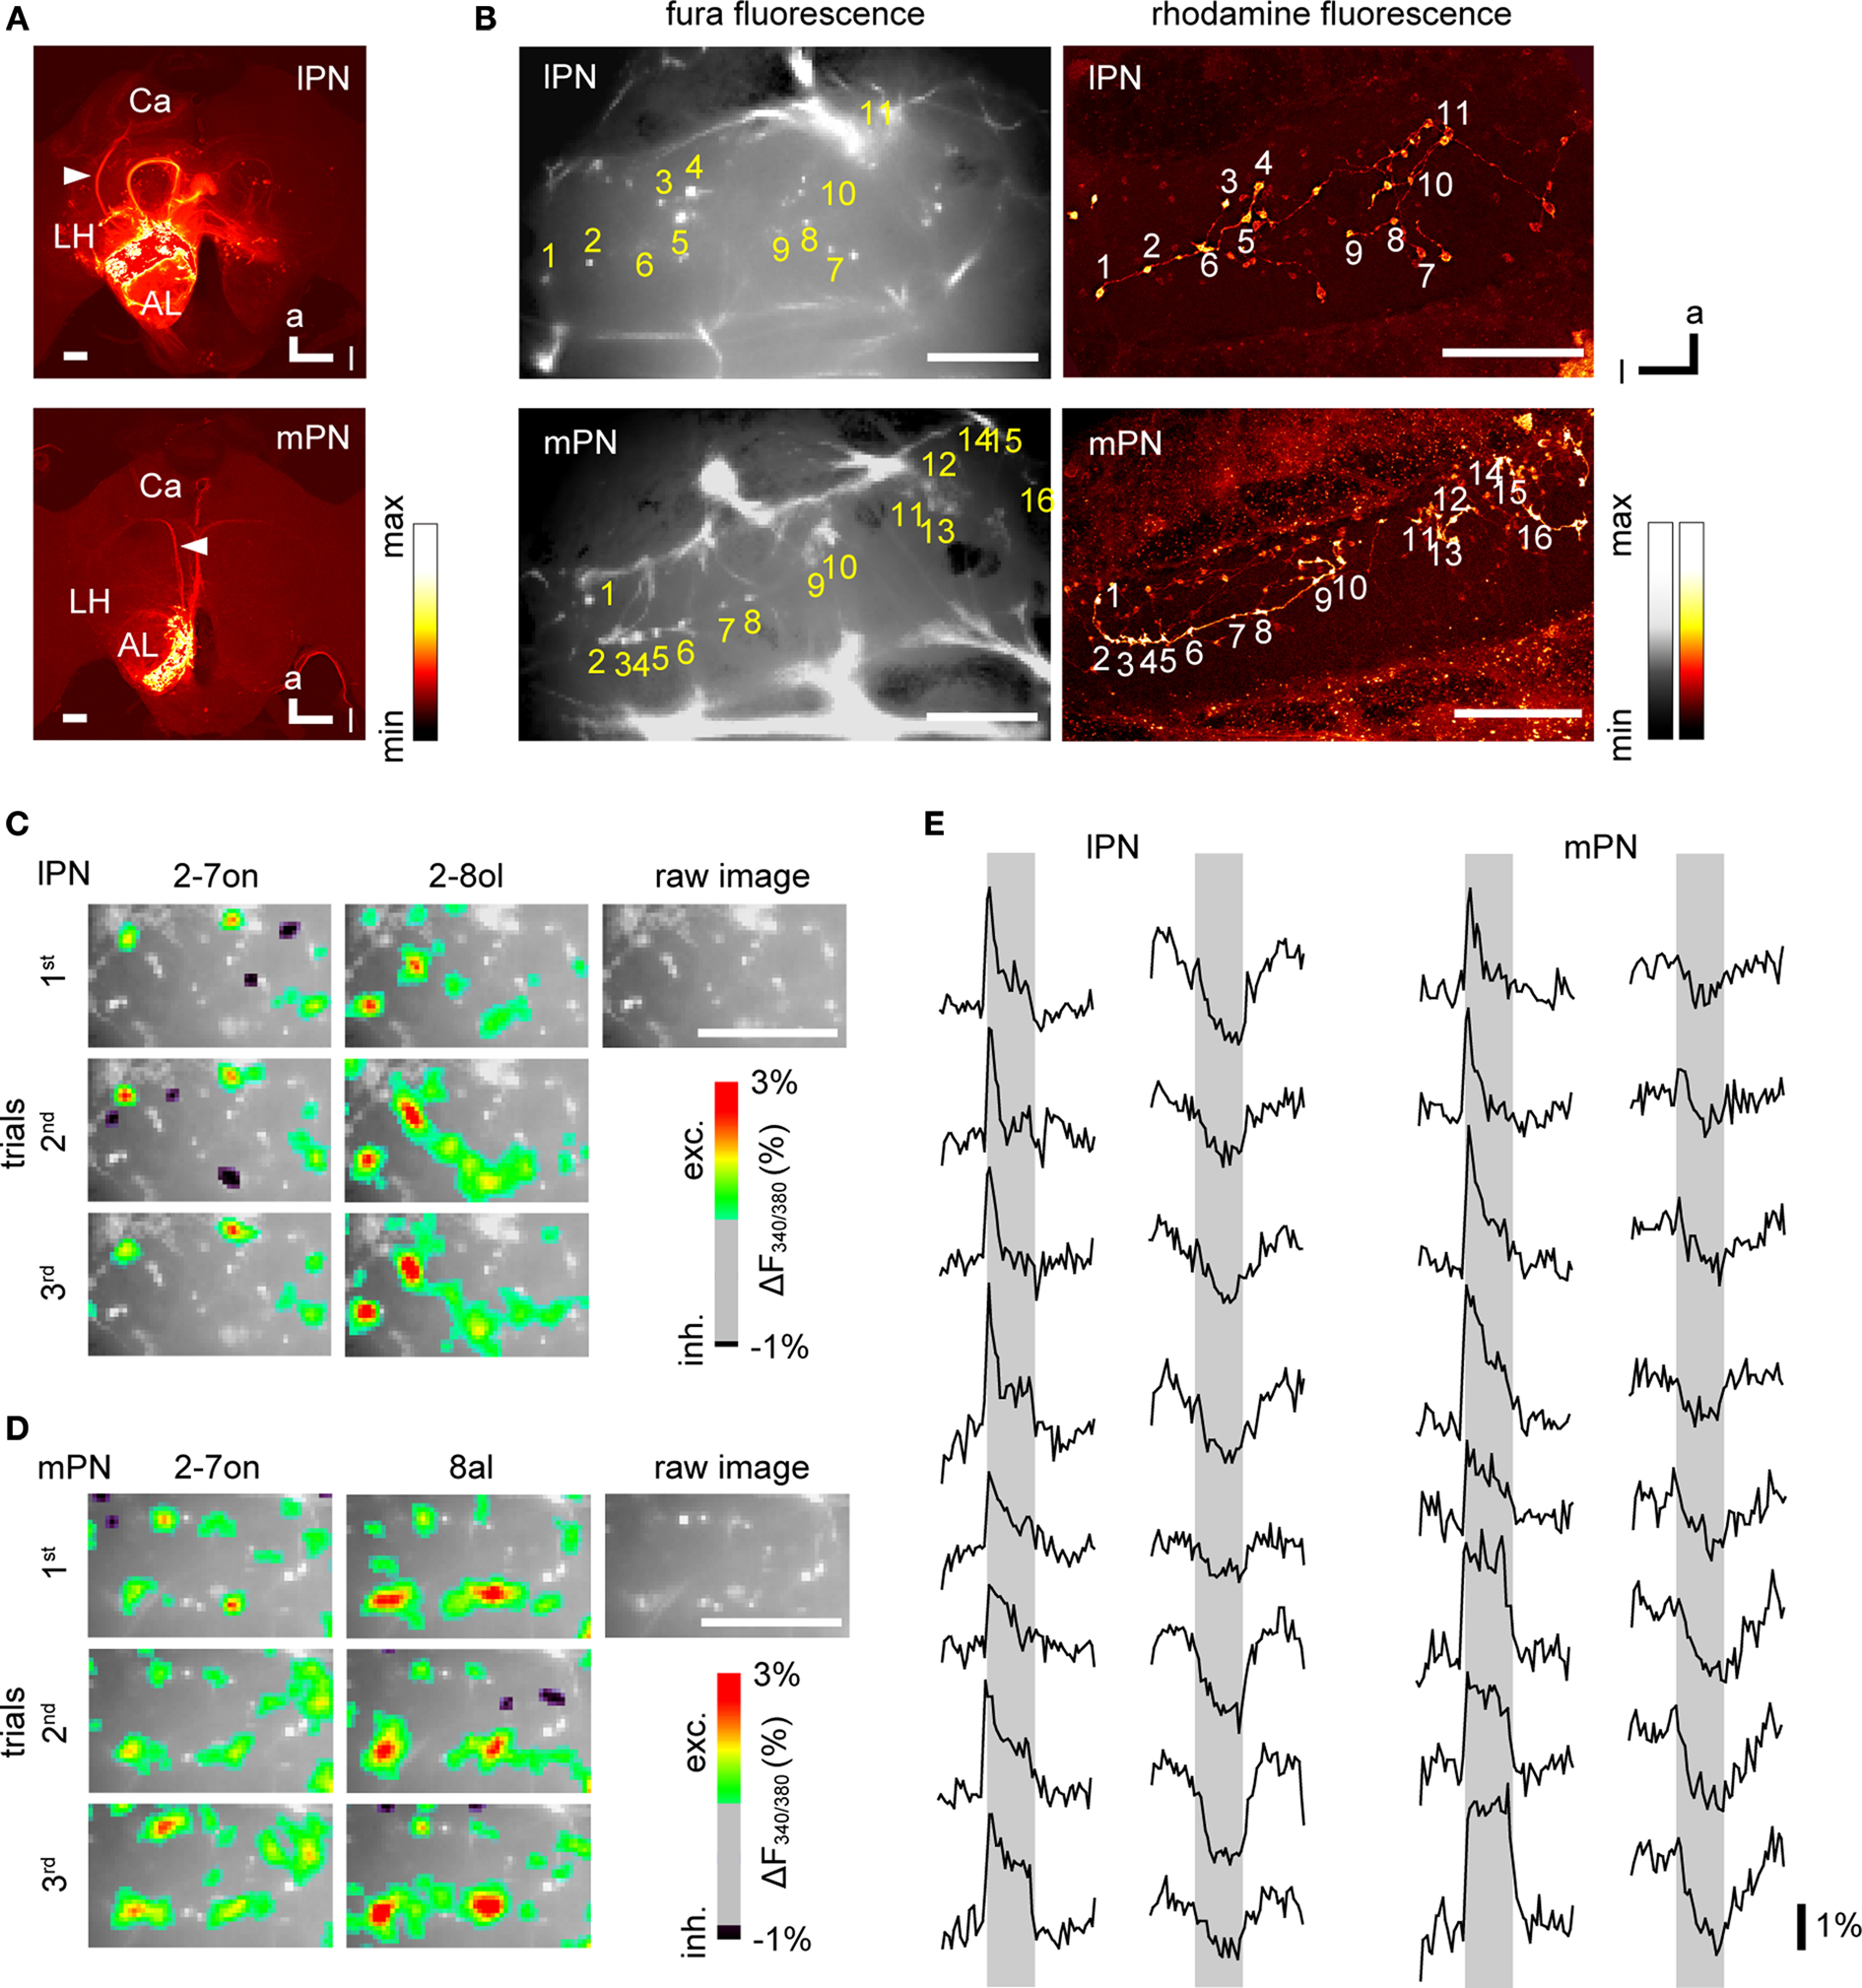
Figure 2. Dye loadings and Ca2+ signals in lPN and mPN boutons. (A) Confocal images confirm selective staining of lPNs or mPNs. A mixture of the calcium indicator Fura dextran and the neuro-tracer rhodamine dextran were injected into the somata clusters of the lPNs or mPNs for their selective staining. Arrowheads point to the stained tracts of PN axons. Scale bars = 100 μm. (B) Wide field images of Fura fluorescence (left) and confocal images of rhodamine fluorescence (right) in stained lPN and mPN boutons in the MB calyx. Tagged boutons are identical between images. Scale bars = 50 μm. Trial-invariant odor specific Ca2+ signals in lPN (C) and mPN (D) boutons. Raw fluorescence images are superimposed on color-coded Ca2+ responses of boutons. Locations of isolated activity spots and individual boutons (bright spots) match. 2-7on: 2-heptanone; 2-8ol: 2-octanol; 8al: octanal. Scale bars = 50 μm. (E) lPN and mPN boutons exhibited both excitatory and inhibitory responses. Response traces give ΔF340/380; gray bars indicate the 3s-odor stimulus. Vertical scale bar: 1% in ΔF340/380.
It was not possible to identify or count the number of stained glomeruli in the AL due to the extracellular dye infusions involved in dye injections. The average number of stained boutons showing excitation and/or inhibition to odor stimulation did not differ between bees stained for lPNs or mPNs (lPN: ave. ± s.e.m., 71.7 ± 2.9; total, 2294, 32 bees; mPN: 77.2 ± 4.3; total, 1931, 25 bees).
Odor Responses in PN Boutons
Examples of raw fluorescence images of stained lPNs and mPNs, together with their odor responses and exemplified response traces, are shown in Figures 2
C,E (left) (lPN), and 2D and 2E (right) (mPN). In most cases, boutons of PNs were visible as distinct activity spots in the images (Figures 2
C,D). These spots were clearly identified as boutons of either type of PN by comparing the patterns of raw fluorescent images with the axon tracts and the corresponding patterns of boutons in confocal images of the same bees (Figure 2
B).
Each of the morphologically identified boutons represented an isolated activity spot. As shown in Figures 2
C,D, spots of odor-evoked Ca2+ activity were co-localized with boutons. In some cases, activities that may have come from out-of-focus planes did not fully co-localize with the position of boutons. Since such boutons reliably responded to repeated stimuli with similar response traces, it was concluded that they also represented boutons. Figure 2
E demonstrates the time course of responses to different odors/concentrations of several boutons in both lPN and mPN. These data come from different animals, and show either excitatory or inhibitory responses with a whole range of time courses (10 s). The rise of fluorescent values before odor stimulation in some traces are due to either (i) spontaneous activity, and/or (ii) fluctuations of fluorescent values in the entire image at the onset of illumination due mainly to a measurement artifact.
Response traces of both lPN and mPN boutons show fast (phasic), intermediate, and slow (tonic) components. No differences, either in absolute or in relative terms, were observed between the boutons of the two tracts or between different odors (data not shown).
We have further analyzed individual bouton responses in some animals combined with morphological 3D reconstructions of the terminal axon branches acquired by confocal images (Figure S1 in Supplementary Material). In general, most of the boutons in an axon branch responded to odors in the same way, but some boutons from the same branch had different response profiles (see legend of Figure S1 in Supplementary Material). The observations were also supported by morphological observations in which specific co-localizations of individual PN boutons and immuno-stained GABA-profiles often occurred within an axon branch both in lPN and mPN terminal branches (Figure S2B in Supplementary Material, arrowhead). Statistical analyses revealed that responses of individual boutons in a particular axon branch are more similar than boutons in different axon branches (Figures S1B,C,D in Supplementary Material). This applies to both lPN and mPN axon branches, indicating that bouton-specific response shaping, e.g. via putative inhibitory input from GABA profiles, may act rather similarly on all boutons of the same axon branch (e.g. inhibitory input onto axon branches, Figure S1B in Supplementary Material, arrow). When comparing boutons from different axon branches we found that bouton responses are more distinct in lPNs when compared to mPNs, indicating more specific odor and/or concentration dependence in lPN boutons (Figure S1D in Supplementary Material).
Different Concentration Dependencies in LPN and mPN Boutons
In order to assess the representation of different concentrations of odors in lPN and mPN boutons, bees were stimulated with three different odors at six concentrations ranging over 6 log units (10−5 to no dilution). We analyzed 1577 boutons (71.7 ± 3.3, mean ± SD, 22 bees) in lPNs and on 1223 boutons (71.9 ± 4.8, 17 bees) in mPNs. The odors hexanal (6al, lPN: 7 bees, mPN: 4 bees), 2-heptanone (2-7on, lPN: 8 bees, mPN: 8 bees) and 1-octanol (1-8ol, lPN: 7 bees, mPN: 5 bees) were used.
Examples of bouton responses for a concentration series of 2-7on are shown for both lPNs and mPNs (Figures 3
A,B).
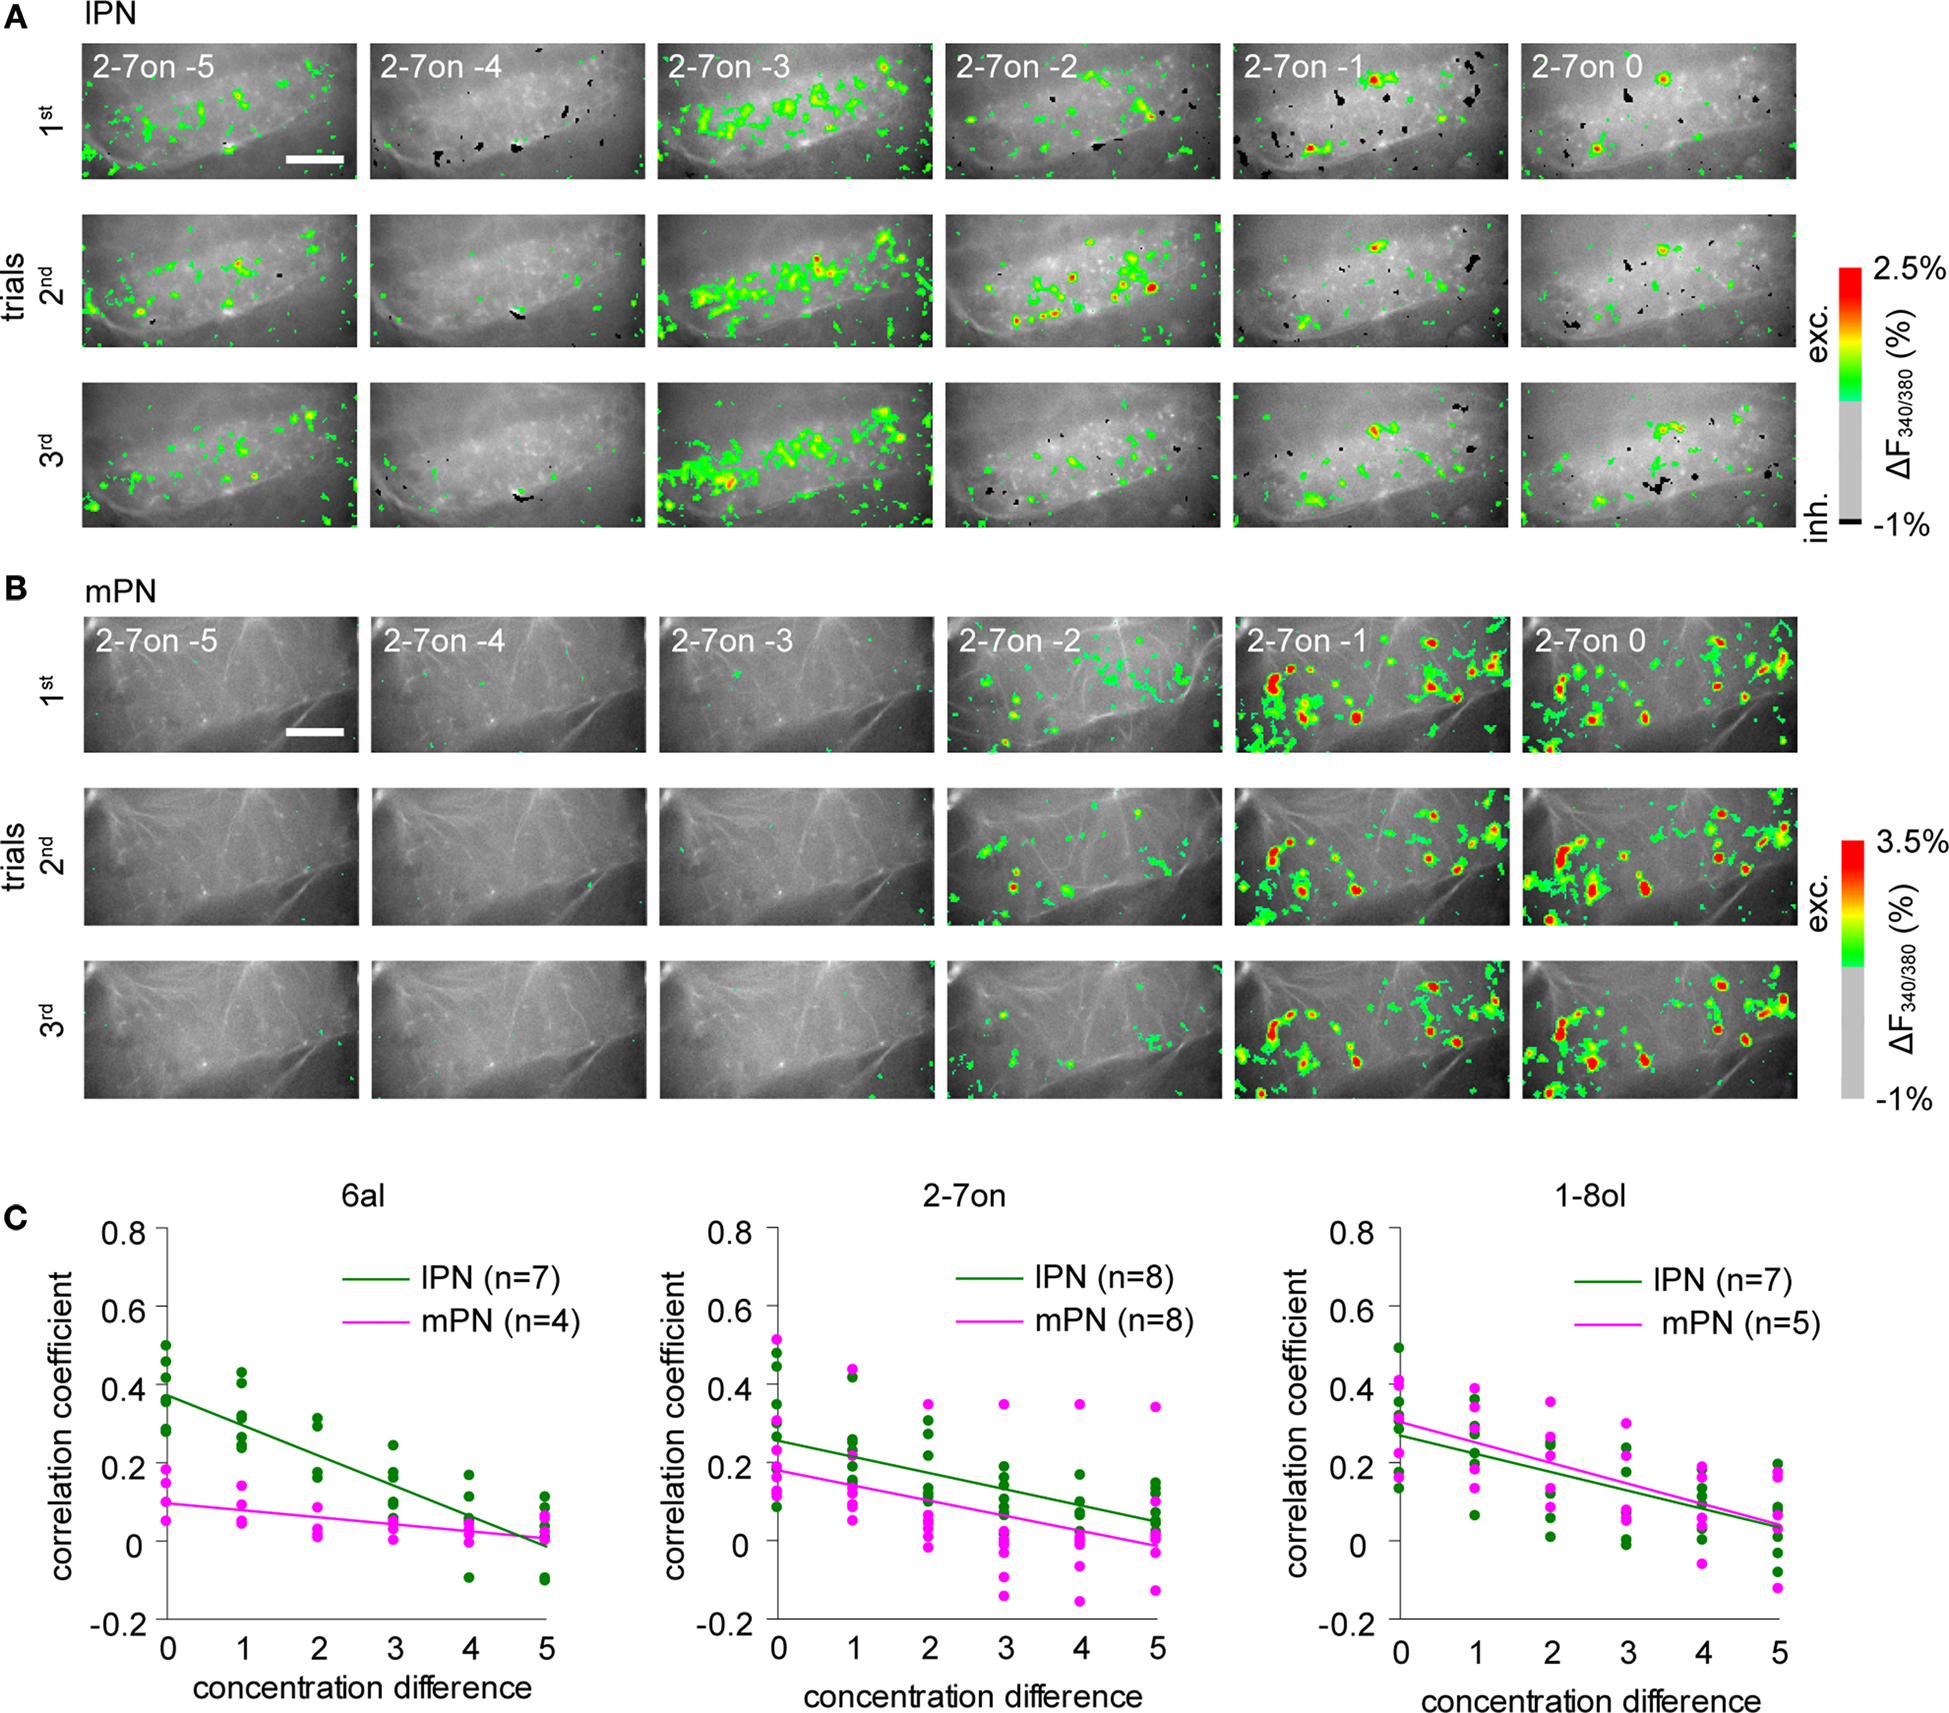
Figure 3. Both lPN and mPN boutons encode odor concentration. Changes of spatial activity patterns with increasing odor concentrations (10−5 to 100, in six steps) in lPN and mPN bouton populations. Representative example of lPN bouton responses (A) and mPN bouton responses (B). Scale bars = 50 μm. (C) Response correlations between two concentrations plotted against their concentration differences. A value of zero in concentration difference indicates representation similarity in repetitions. Linear regression analyses revealed that response correlations are negatively correlated with increasing differences of concentrations for all odors both in lPN (green) and mPN boutons (magenta). Relations of this factor between lPN and mPN boutons differ between odors. The least-squares method was used. The following numbers of boutons were included in the analyses: lPN: 6al, hexanal, 540 boutons, 2-7on, 2-heptanone, 499 boutons, 1-8ol, 1-octanol, 538 boutons; mPN: 6al, 274 boutons, 2-7on, 667 boutons, 1-8ol, 282 boutons. n is the number of bees.
Both lPN and mPN boutons responded to the whole concentration range if all boutons from different bees were taken into account (Figure S3A in Supplementary Material). In both tracts, boutons exhibited reliable responses to stimulus repetitions with concentration dependent spatio-temporal response patterns. Stimulus repetitions were reliably represented in individual boutons (see the legend of Figure S4A in Supplementary Material). We analyzed the concentration specificity of odor representations of lPN and mPN boutons in their respective bouton populations separately for each bee. The similarity of the spatio-temporal activity patterns induced by the three odors at different concentrations was evaluated by calculating the linear correlation of the population responses (concatenated arrays of response traces from all boutons were used) and plotted against the concentration differences (6al, Figure 3
C left; 2-7on, Figure 3
C middle; 1-8ol, Figure 3
C right). Linear regression analysis revealed that the response correlations and the concentration distances were negatively correlated in all three odors for both lPN and mPN boutons (lPN, 6al: r = 0.86, p < 0.001, 2-7on: r = 0.64, p < 0.001, 1-8ol: r = 0.65, p < 0.001; mPN, 6al: r = 0.62, p < 0.001, 2-7on: r = 0.46, p < 0.001, 1-8ol: r = 0.67, p < 0.001). The similarity of responses depended on the difference in concentration. Larger concentration differences lead to lower similarity between responses in both lPN and mPN boutons. Response similarity also depended on the particular odor in both lPNs and mPNs, indicating that lPN and mPN boutons do not differ in the extent of similarity of their concentration representations.
However, as exemplified in Figures 3
A,B, we often observed that mPN boutons showed clear dependence on rising concentrations of odors while lPN boutons did not (see also Figure S3A in Supplementary Material). Thus, we evaluated the strength of the bouton response at different concentrations by applying a linear regression analysis on the logarithm of these two values since a log-log function describes the relationship between two factors as represented by a sigmoidal curve which is known as a fundamental relationship in receptor-ligand interactions at peripheral level (e.g. Hill equation). As shown in Figure 4
A, boutons were statistically assigned to the positive dependency (left), no dependency (middle) and negative dependency (right) group.
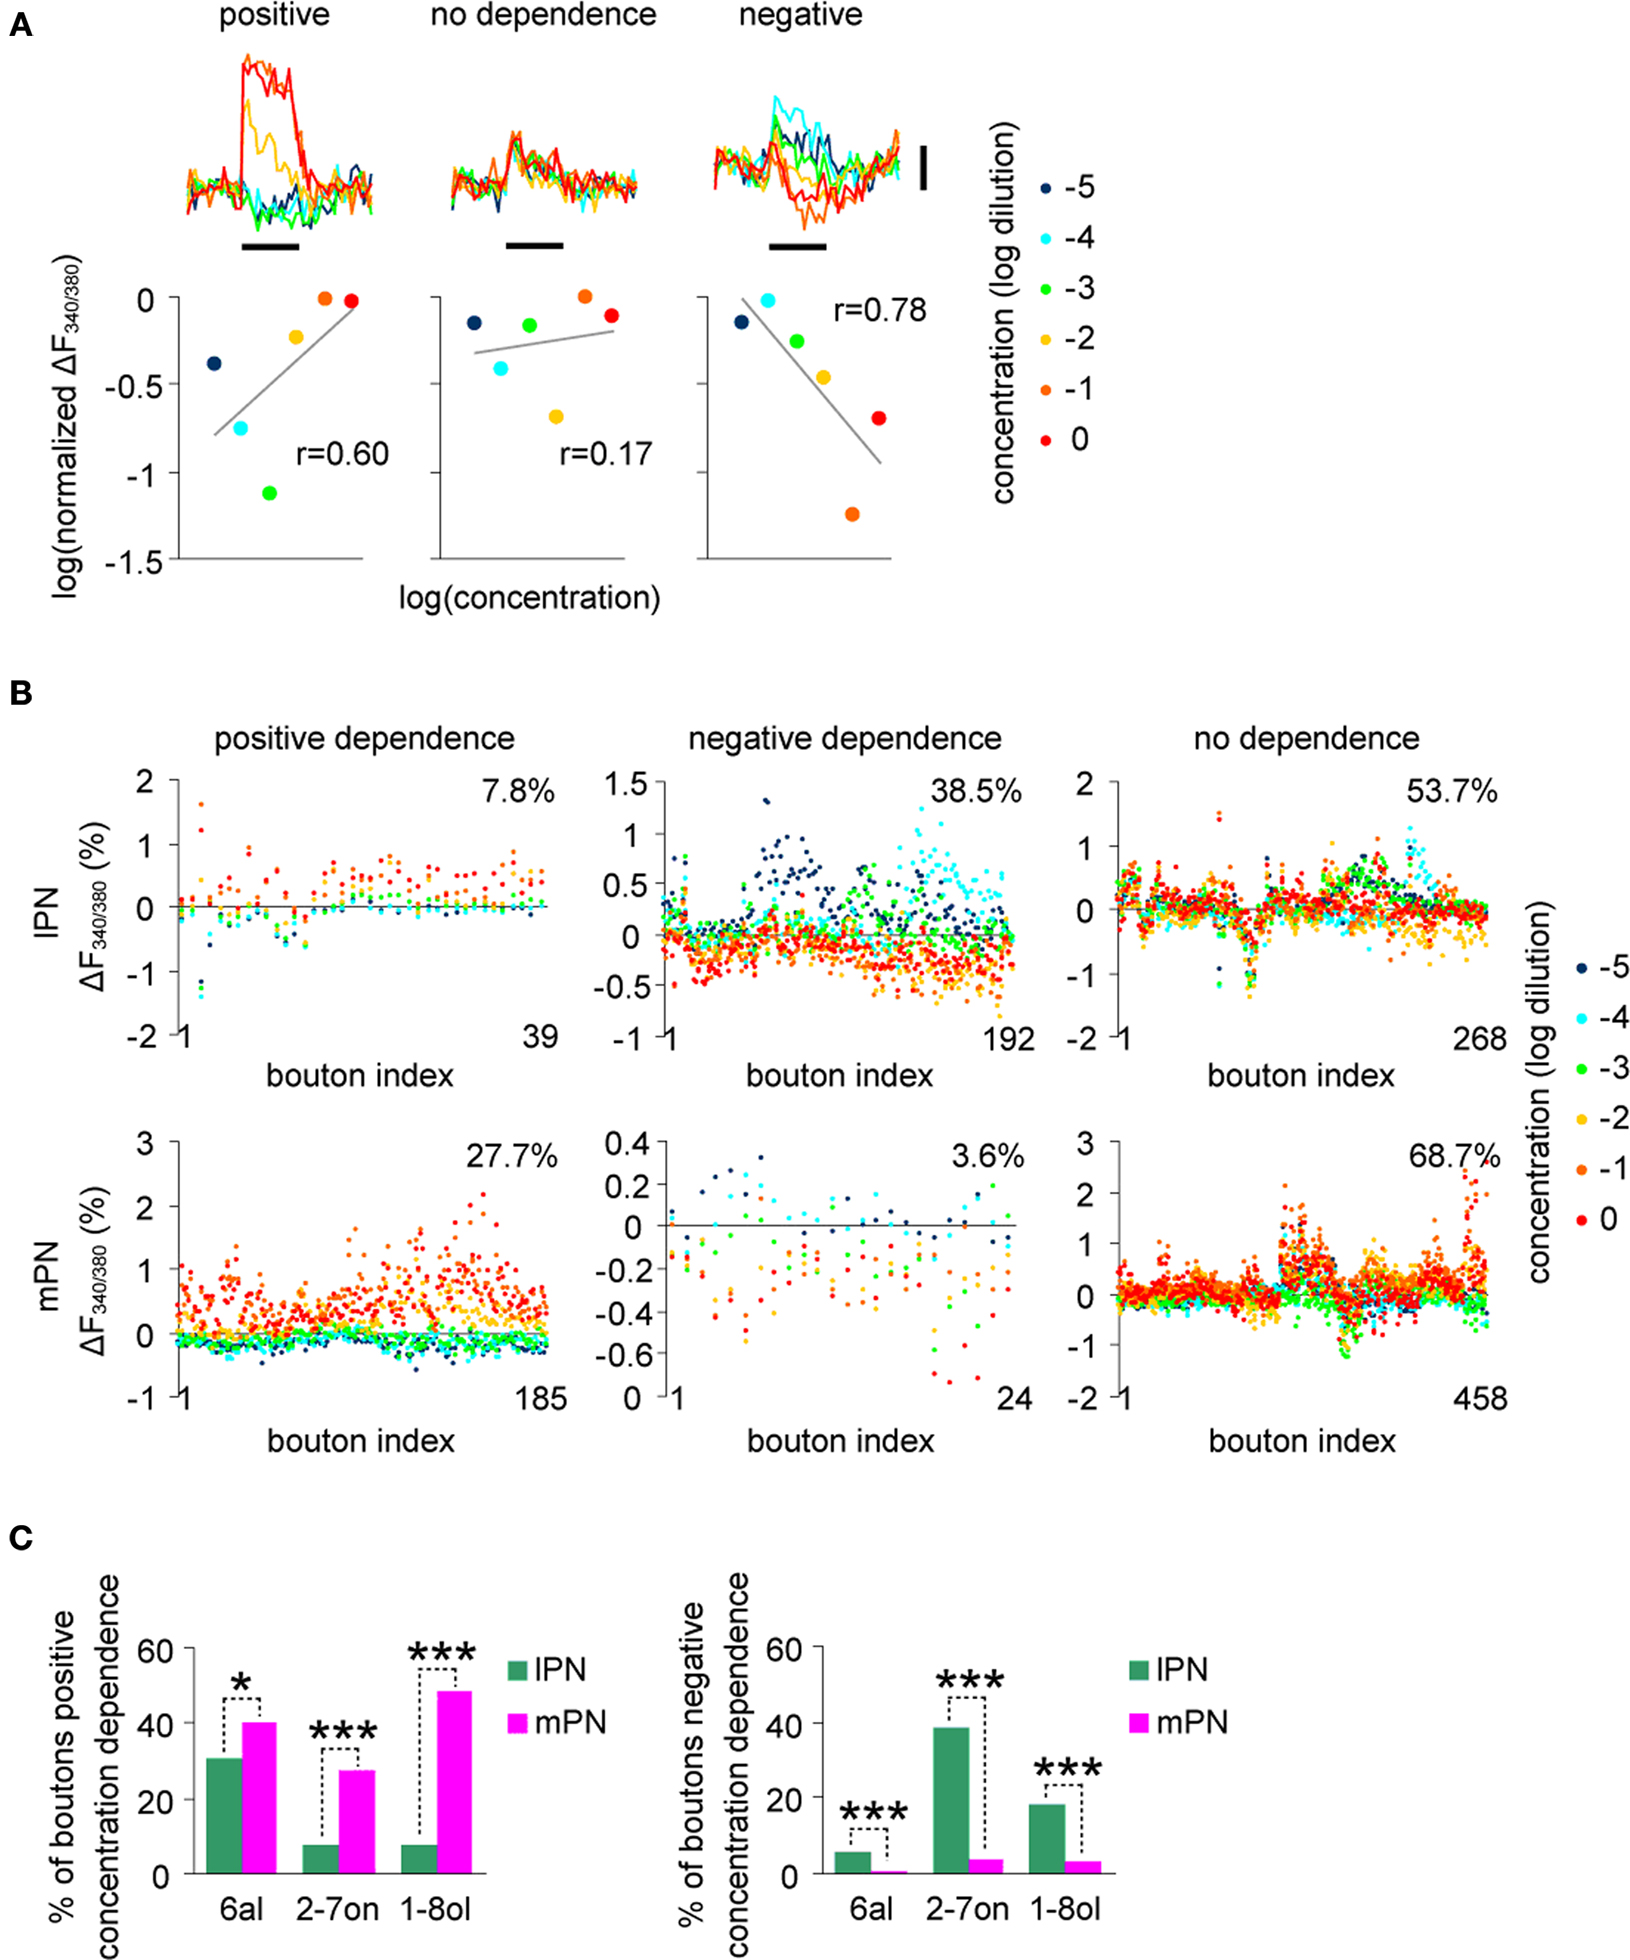
Figure 4. lPN and mPN boutons differ in their concentration dependence. (A) Boutons were categorized into three groups (positive, no dependence, negative) by their correlation between the logarithm of normalized response strengths and odor concentrations. Black bars under the traces indicate the odor stimulus for 3 s. Vertical scale bar: 1% in ΔF340/380. (B) Categorized boutons and their response strengths in the 2-heptanon (2-7on) concentration series. Boutons were categorized according to three criteria in (A). All boutons are horizontally aligned in each figure (bouton index), in which response strengths of each bouton for different concentrations are vertically aligned by different colors. More boutons in lPN fell into the group of negative concentration dependence. More boutons in mPN fell into the group of positive concentration dependence. (C) More mPN boutons (magenta) exhibited positive dependence (left) and more lPN boutons (green) exhibit negative concentration dependence (right) for all three odors, all of which are significantly different (*, p < 0.05, ***, p < 0.001, chi-square test). The following numbers of boutons were included for the analyses: lPN: 6al, 540 boutons, experiments from 7 bees, 2-7on, 499 boutons, 8 bees, 1-8ol, 538 boutons, 7 bees; mPN, 6al, 274 boutons, 4 bees, 2-7on, 667 boutons, 8 bees, 1-8ol, 282 boutons, 5 bees.
Figure 4
B shows the result for 2-7on. The majority of boutons in both lPNs and mPNs were categorized into the no dependence group (lPN 53.7% in 499 boutons; mPN 68.7% in 667 boutons), but more of lPN boutons fell into the negative dependence group (38.5%) and more of mPN boutons fell into the positive dependence group (27.7%). The same result was observed for the other two odors, and the differences between lPN and mPN boutons were statistically significant for all three odors (Figure 4
C, positive dependency, 6al: p < 0.05, 2-7on: p < 0.001, 1-8ol: p < 0.001; negative dependency, 6al: p < 0.001, 2-7on: p < 0.001, 1-8ol: p < 0.001; chi-square test), indicating a stronger concentration dependence in mPN boutons as compared to lPN boutons. The difference is partly reflected by the fact that more of lPN boutons were inhibited as odor concentration increased. This conclusion is also supported by the result of 3-way ANOVA applied for the number of responding boutons to variables of odor concentrations, tract types and odors (Figure S3A and Table S1 in Supplementary Material), which revealed a significant difference for a combinational effect of odor concentration and tract type (Concentration × Tract, p = 0.0019). This implies that the effect of odor concentration on bouton responsiveness differs between lPN and mPN boutons.
Higher Odor Specificity and Sparser Responses in IPN Boutons at High Odor Concentration
Less positive concentration dependence of lPN bouton responses (Figure 4
) might imply more odor-specific and sparser odor responses at higher concentrations. In order to assess this interpretation, we analyzed bouton responses to seven different odors at a dilution of 1%, including the three odors which we used in the concentration experiments. 717 boutons (71.7 ± 5.8, 10 bees) in lPNs and 708 boutons (88.5 ± 7.2, 8 bees) in mPNs were taken into account.
Representative examples are shown in Figure 5
A (lPN) and in Figure 5
B (mPN). Again, stable odor-specific spatio-temporal response patterns were found. Stimulus repetitions were reliably represented in individual boutons, suggesting reliable Ca2+ measurements in these experiments (Figure S4B in Supplementary Material). When all boutons from different bees were taken into account, both lPN and mPN boutons responded to all odors applied (Figure S3B in Supplementary Material). Inhibitory responses were observed more often in lPN boutons than in mPN boutons.
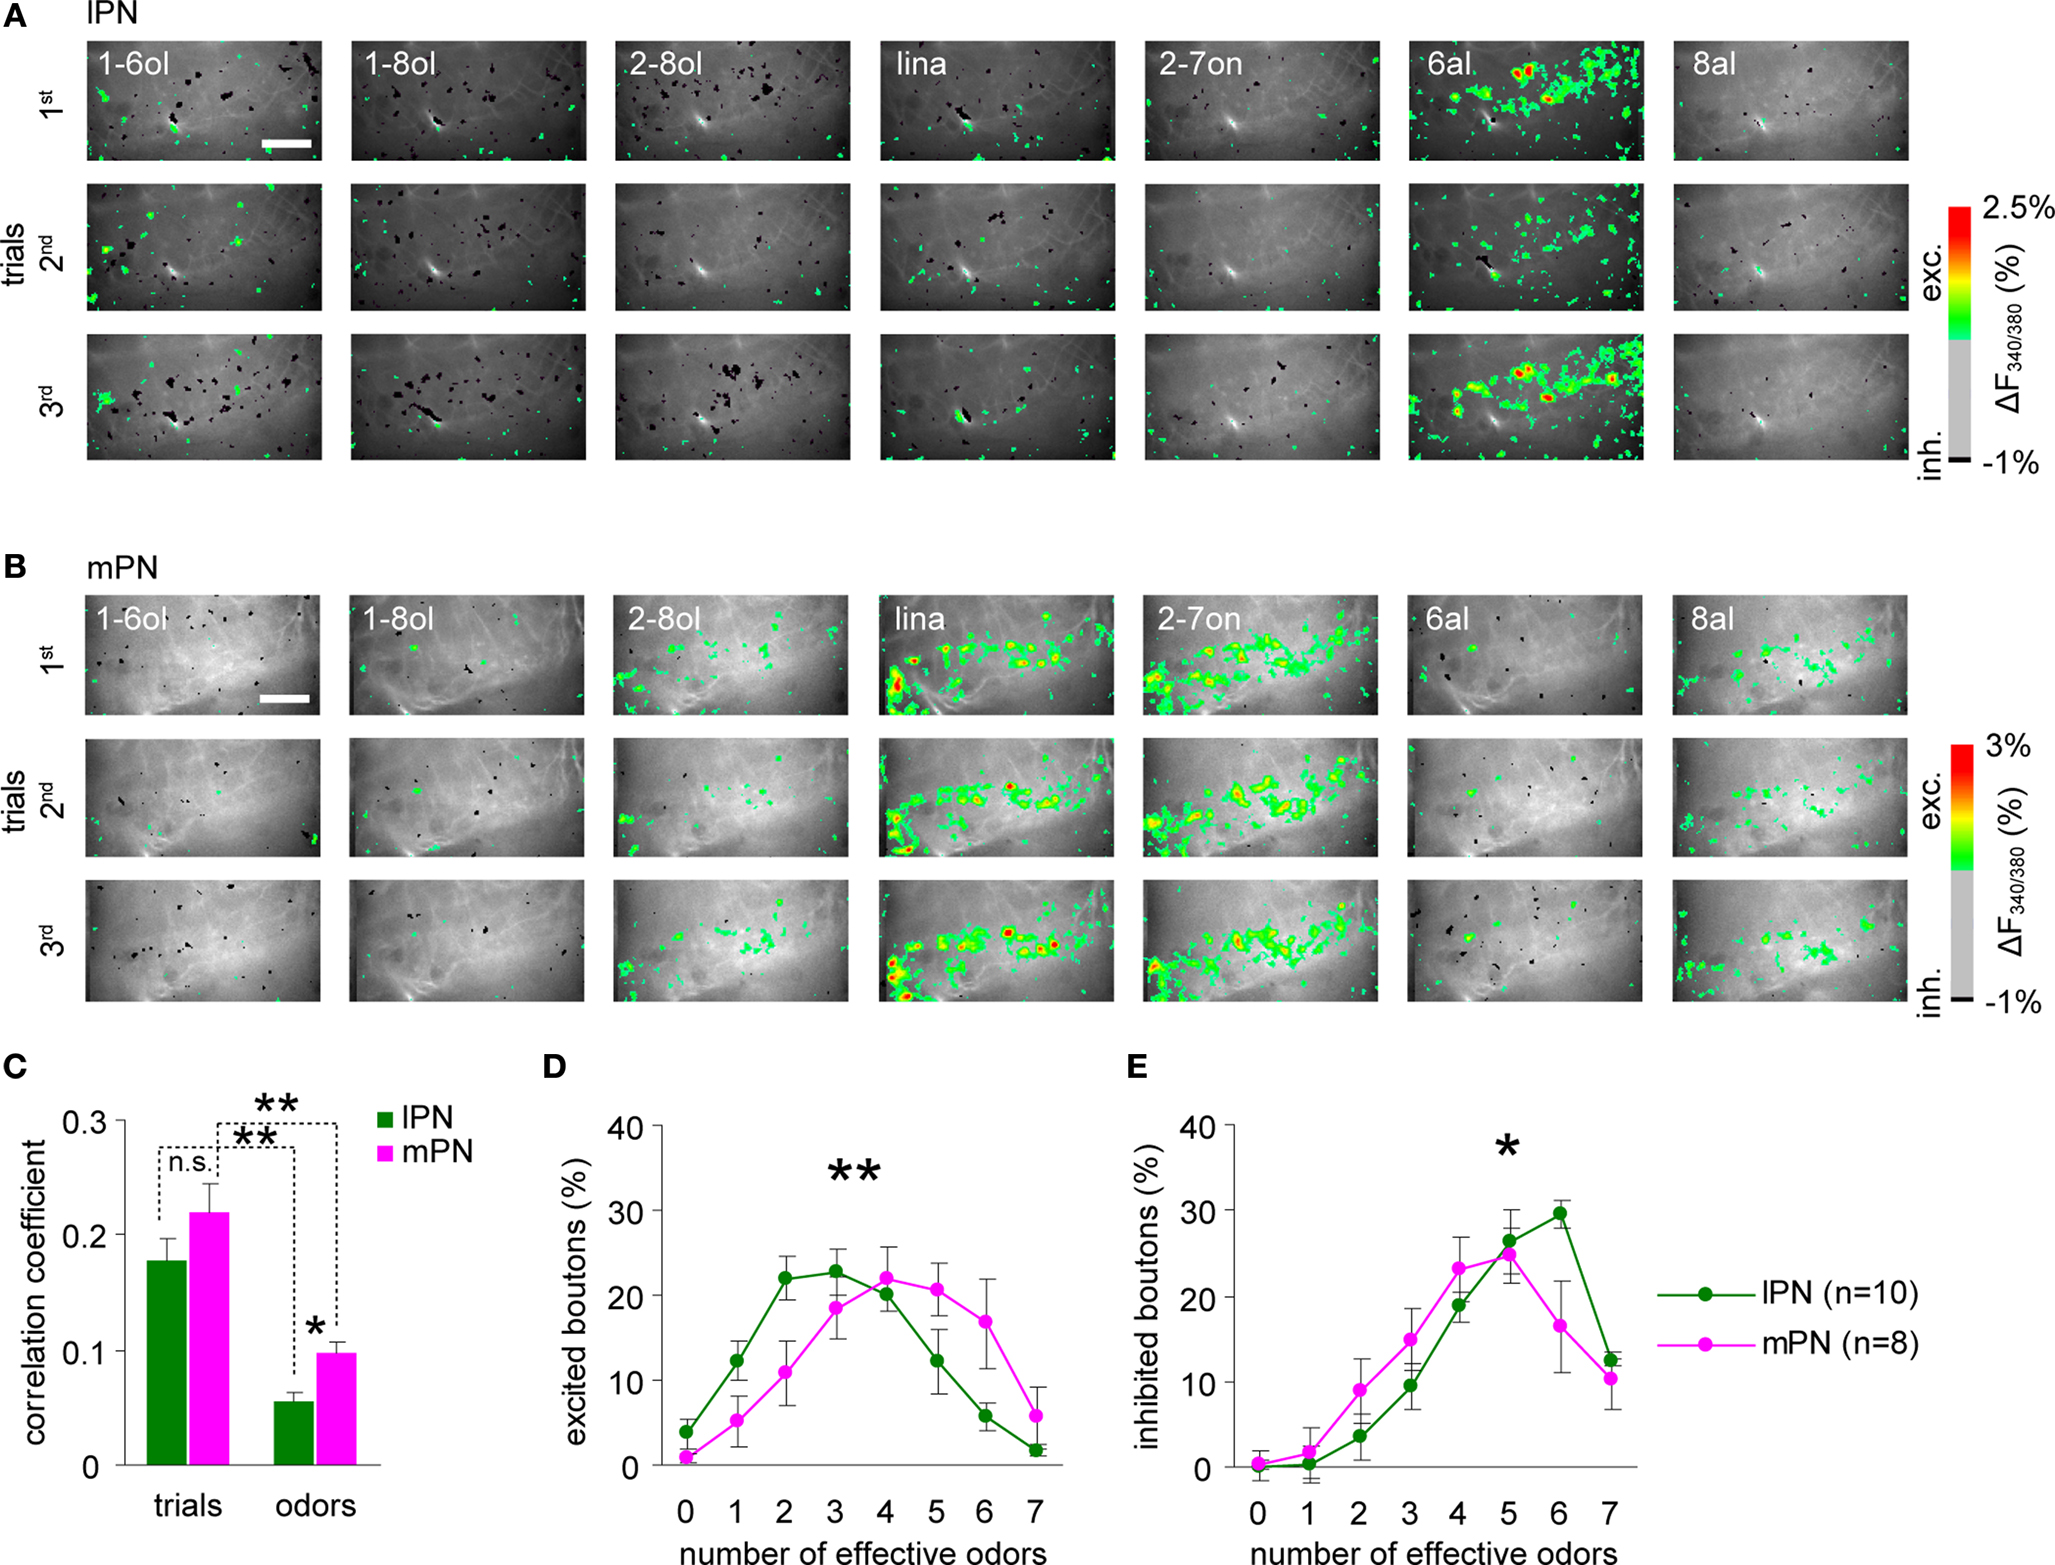
Figure 5. Higher odor specificity and sparser odor coding in lPN boutons. Representative examples of responses of l (A) and mPN boutons (B). Variability of spatial activity patterns for seven odors (1% dilution) both in lPN and mPN bouton populations. Hexanal (6al) is particularly effective in activating lPN boutons. In general, more inhibitory responses were observed in lPN boutons. 1-6ol: 1-hexanol; 1-8ol: 1-octanol; 2-8ol: 2-octanol; lina: linalool; 2-7on: 2-heptanone; 6al: hexanal; 8al: octanal. Scale bars = 50 μm. (C) Correlation between stimulus repetitions (inter-trial) and any responses to two odors (inter-odor) in l (green) and mPN (magenta) boutons calculated separately for each bee. Inter-trial correlation of odor responses is stronger than inter-odor correlation both in lPN and mPN neurons. Inter-odor correlation of mPN boutons was significantly stronger than that of lPN boutons (*, p < 0.05, **, p < 0.001, Steel-Dwass test, lPN: 717 boutons, 10 bees, mPN: 708 boutons, 8 bees). Error bars: s.e.m. Distribution of bouton responses to any odor. (D) Excitatory responses, (E) inhibitory responses. A zero effective odor number was assigned to boutons that were neither excited nor inhibited by any odor. More odors evoke excitation in mPN boutons (magenta), while more odors evoked inhibition in lPN boutons (green). The distributions were significantly different between lPN and mPN boutons (*, p < 0.05, **, p < 0.005, 2-way ANOVA applied for the number of excited or inhibited boutons on two variables, number of effective odors and tract types. Differences observed in an interaction of two variables; lPN: 717 boutons, 10 bees, mPN: 708 boutons, 8 bees). Error bars: s.e.m across bees. n is the number of bees.
Odor coding properties at the level of bouton populations were assessed (concatenated arrays of response traces from all boutons were used) by comparing the responses to repeated stimuli of two different odors (Figure 5
C) (see Materials and Methods). A Kruskal-Wallis ANOVA revealed significant differences among the correlation coefficients within or between lPN and mPN boutons (p < 0.001). A post-hoc test (Steel-Dwass test, Dwass, 1960
; Steel, 1960
) showed significant differences between inter-trial correlations and inter-odor correlations of both tracts (p < 0.01). Odor coding in repetitions of the same odor is more reliable than that of two different odors in boutons of both tracts. The statistical analysis also revealed that inter-odor correlations between lPN and mPN neurons were significantly different (p < 0.05), while inter-trial correlations were not, indicating that odors were more distinctively represented in lPN boutons than in mPN boutons.
We further analyzed the differences in response-profiles between lPN and mPN boutons by calculating the probability of boutons responding with excitation or inhibition, applying threshold criteria for excitation and inhibition (see Experimental Procedures). As shown in Figures 5
A,B, mPN responses were more likely to be excitatory and lPN responses were more likely to be inhibitory to odors. Except for 6al, the proportions of excitatory responses in mPN boutons and of inhibitory responses in lPN boutons were larger than the respective proportions in the other tract. Of the seven odors tested, 3.10 ± 0.24 odors elicited an excitatory response in lPN boutons (n = 10 bees), while 4.13 ± 0.37 odors caused excitation in mPN boutons (n = 8 bees) (Figure 5
D). The distribution of effective odors causing excitatory responses is significantly different between lPN and mPN boutons (Number of effective odors × Tract, p < 0.005, 2-way ANOVA, lPN: n = 10; mPN: n = 8). The average numbers of odors that elicited inhibitory responses were 5.04 ± 0.23 (n = 10 bees) in lPN boutons and 4.49 ± 0.31 n = 8 bees) in mPN boutons (Figure 5
E), and the difference was significant (Number of effective odors × Tract, p < 0.05, 2-way ANOVA, lPN: n = 10; mPN: n = 8). These results show that more lPN boutons responded with inhibition and more mPN boutons responded with excitation to odors at 1% concentration.
Mixture Suppressive Effects are Stronger in IPN Boutons
Next, we evaluated the effects of binary odor mixtures by comparing the mixture responses with those of the component responses. The following two categories of responses were defined (Figure 6
B): (1) the response to the mixture is equal or higher than the response to the weaker component (additive mixture effect), and (2) the response to the mixture is lower than the response to the weaker response minus noise (suppressive mixture effect) (see Experimental Procedures). The additive group also includes mixture responses that lie between the responses to the weaker component and that of the stronger component. We include this response group because it is well possible that the two components compete at the level of the olfactory receptor molecule reducing the afferent input to mixtures. Two binary mixtures were tested: 2-heptanone/1-octanol (2-7on/1-8ol) and hexanal/2-octanone (6al/2-8on). The analysis is based on the evaluation of 814 boutons (50.9 ± 3.8, 16 bees) in the lPNs and of 444 boutons (63.4 ± 6.3, 7 bees) in the mPNs.
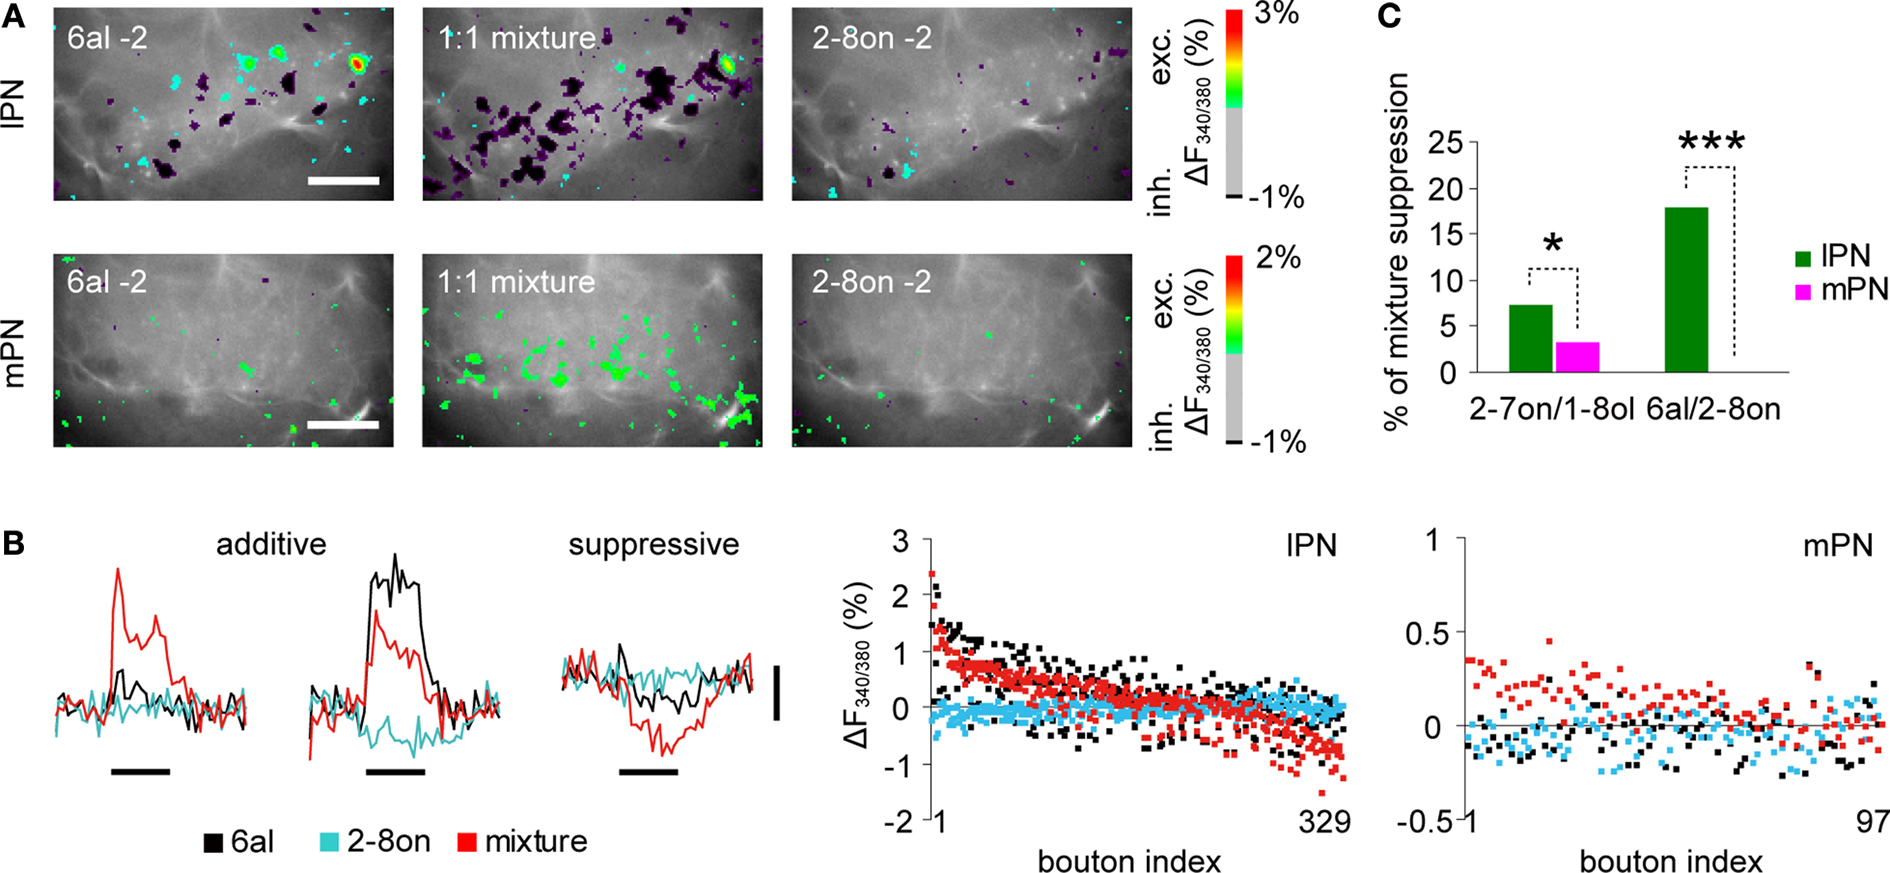
Figure 6. Mixture suppression in lPN boutons. (A) Representative examples of lPN and mPN bouton responses to odor mixtures and their components. Shown are superimposed images of raw fluorescence images and trial-averaged (three trials) color-coded Ca2+ responses of boutons. In the lPN boutons, more inhibitory responses occurred with the 1:1 binary odor mixture of 1% hexanal (6al) and 1% 2-octanon (2-8on). Meanwhile, more excitatory responses occurred with the 1:1 binary odor mixture in mPN boutons. Scale bars = 50 μm. (B) Boutons were categorized into two groups (additive or suppressive mixture effect) by the response strength to binary mixtures as compared to those of the components (see Experimental Procedure for details). All bouton responses were horizontally aligned in the right figures (bouton index), in which response strengths of each bouton for a binary mixture (red dots) and its components (6al: black, 2-8on: cyan) are vertically aligned by different colors. Substantial amount of lPN boutons (∼30%) exhibited minimum response strengths while mPN boutons mostly exhibited greater or equal response strength to a binary mixture compared to its components. Black bars under the traces indicate the odor stimulus for 3 s. Vertical scale bar: 1% in ΔF340/380. (C) Percentage of boutons exhibiting the suppressive mixture effect. In both odor combinations, lPN boutons show greater proportions of mixture suppression than mPN boutons (2-7on/1-8ol, lPN: 485 boutons, 10 bees, mPN: 347 boutons, 5 bees; 6al/2-8on, lPN: 329 boutons, 6 bees, mPN: 97 boutons, 2 bees, *, p < 0.05, ***, p < 0.001. log-likelihood test applied for absolute bouton numbers).
Figure 6
A exemplifies a suppressive mixture effect in lPN boutons and an additive mixture effect in mPN boutons in response to 6al, 2-octanone (2-8on) and their 1:1 mixture. In Figure 6
B, the response traces of three representative boutons are shown. The first one (left) exhibited stronger responses to the binary mixture (red) while almost no responses were seen to its components (6al: black, 2-8on: cyan), indicating the addition of sub-threshold excitatory inputs from the 2 odors. The second response traces (middle) exhibited an intermediate response to the binary mixture, indicating averaging of a stronger excitatory response to one component and a weak inhibitory response to another component. As described above, we assigned these two cases to an additive mixture effect. The third response traces (right) exhibited an inhibitory response to the binary mixture and almost no responses to the components indicating inhibitory responses. We assigned this case to the suppressive mixture effect.
We calculated response strengths to 6al, 2-8on and their 1:1 mixture (Figure 6
B), 2-7on, 1-8ol and their 1:1 mixture for all boutons. Suppressive mixture effects occurred in lPN boutons more often than in mPN boutons (Figure 6
C, 2-7on/1-8ol, p < 0.001, lPN: 10 bees, 485 boutons, mPN: 5 bees, 347 boutons; 6al/2-8on, p < 0.05, lPN: 6 bees, 329 boutons, mPN: 2 bees, 97 boutons, log-likelihood test).
Olfactory systems for general environmental odors are characterized by parallel pathways but their functional separations are not well understood. We characterized odor response properties of axon terminal boutons of two anatomically distinct olfactory PN types in the honeybee brain, and found overlapping similarities and qualitative differences between them. First, the mPNs boutons often showed rising concentration dependence to a series of concentrations (10−5 to 100) of three odors while lPN boutons were less concentration dependent. Second, at high concentrations lPNs were more narrowly tuned to odors and responded in a sparser way than mPNs. Third, lPNs were more likely than mPNs to exhibit mixture suppression (antagonistic mixture coding). Thus odor representation in lPNs appears to be optimized for fine, relatively concentration-invariant odor discrimination and synthetic mixture processing. whereas odor representation in mPNs are optimized for concentration coding and mixture processing combining the effects of the odor components (analytic mixture coding). These results suggest a functional division of odor processing in the two PN types.
It should be noted, however, that our results are based on a limited number of odors. It will be, therefore, necessary to test our hypothesis by using an extended number of odors.
Technical Considerations
In this study, bouton responses exhibited relatively low correlation values (high variability) even for stimulus repetitions, which is in contrast to the AL glomeruli achieving very reliable odor responses (Joerges et al., 1997
; Sachse and Galizia, 2002
, 2003
; Galizia and Kimmerle, 2004
; Szyszka et al., 2005
; Krofczik et al., 2009
). The apparent ‘lacking of reliability’ in bouton responses may reflect a property of information processing at this stage with variability possibly resulting from inhibitory input via recurrent neurons of the mushroom body lobes (see below). The higher variability seen in our recordings may have also technical reasons. (i) Terminal boutons of PNs are very small, so their responses are relatively weak and spatially confined. Such small responding points can be easily affected by many measurement artifacts (such as very small movements). The small size does not allow much spatial averaging of activated pixels for noise reduction of time traces. It is obvious that noise will reduce correlation values across bouton responses. (ii) The sparseness of bouton responses. Often bouton responses were very specific to one or two odors within a series of odors. This property implies the necessity of including many of non-responding or weakly responding boutons in the correlation analysis. Thus the particular response property of boutons unavoidably reduces the correlation between boutons considerably.
Reduction of Ca2+ activity, which often characterized lPN bouton responses, may be explained by the following: a reduction in the number of arriving spontaneous or odor-induced action potentials, since the frequency of action potentials is mirrored in the Ca2+ dynamics of PNs at their input sites (Galizia and Kimmerle, 2004
; Moreaux and Laurent, 2007
). Odor-induced reduction of spike activity can result from both the inhibitory inputs within their respective glomeruli via GABAergic local interneurons in the AL (Sachse and Galizia, 2002
) and from GABA-immunoreactive (-ir) profiles onto boutons (Ganeshina and Menzel, 2001
; Figure S2A in Supplementary Material), which relate to the recurrent axon branches of the protocerebral tract (PCT) feeding the output of the MB lobes back into the MB input (Gronenberg, 1987
; Grünewald, 1999
).
Global Gain Control in IPN Boutons
We evaluated the effects of different odor concentrations in the range of 10−5 to 100 in six steps for three odors (6al, 2-7on, 1-8ol) (Figures 3 and 4
). In all three odors we found that both lPN and mPN boutons reacted to all concentrations (Figure S3A in Supplementary Material), though the response magnitude and dynamic depended on the particular odor and its concentration. At the population level of boutons in a particular bee, a measurement of response similarity was a reliable indicator of concentration differences (Figure 3
C), indicating that both lPN and mPN boutons code concentration differences.
Concentration dependence of responses can be described by its relation to the logarithm of concentration applying a linear regression analysis (i.e. Hill equation, Figure 4
). We found for both tracts that boutons may exhibit positive, negative and no concentration dependence. mPN boutons showed positive concentration dependence more frequently whereas lPN boutons showed positive and negative concentration dependence equally often indicating a rise in inhibitory input at higher concentrations.
The negative concentration dependence, i.e. reduction of response strengths with rising concentration leads to a decreasing dose response function in which response saturation occurs at intermediate concentrations. Sachse and Galizia (2003)
showed that lPN glomeruli clearly exhibit rising concentration dependence. Since receptor-odor interactions must have a threshold above which the excitatory neural responses will rise, a decay in neural responses at even higher concentrations indicates rising inhibitory input at higher concentrations. Such an inhibitory input may reflect a global gain control. In crustaceans, a global inhibitory system has been proposed as a gain control to prevent saturation of odor-evoked responses and to allow encoding of odors over a wide dynamic range (Wachowiak et al., 2002
). A similar argument was put forward to explain the odor mixture effects in the AL glomeruli of the honeybee (Joerges et al., 1997
; Deisig et al., 2006
). Both the AL and the MB calyx network can be involved in this process by GABAergic input, in the AL via local interneurons (Flanagan and Mercer, 1989
), in the MB calyx via GABA-ir recurrent neurons (Gronenberg, 1987
; Grünewald, 1999
; Ganeshina and Menzel, 2001
; Figure S2 in Supplementary Material). It is likely that the inhibitory input leading to the saturating and falling concentration dependence of boutons is localized in the output region of the PNs because Sachse and Galizia (2003)
found rising concentration dependence of lPNs in the glomeruli. Different physiological characteristics between lPNs and mPNs could be responsible for the differing amounts of putative GABA inputs into the respective boutons. We are currently analyzing this possibility.
Overlapping Response-Profiles between IPN and mPN Boutons
PN boutons of both tracts responded to all seven odors applied at a constant concentration of 1%, which corresponds to a rather high concentration under natural conditions. In both PN types, responses were more similar for the same than for different odors (Figure 5
C), indicating odor identity coding in both tracts. The chemo-profiles of lPN and mPN boutons are highly overlapping (Figure S3B in Supplementary Material), which corroborates earlier findings (Sun et al., 1993
; Abel et al., 2001
; Müller et al., 2002
). It is, therefore, unlikely that different categories of odors are encoded in separate tract neurons.
lPN boutons are characterized by sparser coding of odor identity (Figure 5
) because a higher proportion of these boutons show a negative concentration dependence (Figure 4
). This finding corresponds with an earlier study which found sparsening of lPN boutons’ response profiles within the MB calyx possibly by presynaptic inhibitory inputs (Szyszka et al., 2005
). Such a mechanism would explain the higher probability of inhibitory responses in lPN boutons. Thus, it is not surprising that our results do not match those of Müller et al. (2002)
, who determined broader chemo-profiles in lPN than in mPN using intracellular recording from the axon trunk. Our finding provides additional support to the conclusion presented above that global gain control mainly occurs at the MB calycal network.
Mixture Suppression in LPN Boutons
Coding of mixtures is known to include non-linear processes at peripheral (Akers and Getz, 1993
; Getz and Akers, 1995
) and central sites (Tabor et al., 2004
; Deisig et al., 2006
; Silbering and Galizia, 2007
). Interactions of components in mixtures can be synthetic, leading to difficulty in segmenting the perception of odor mixtures into their distinct components (Chandra and Smith, 1998
; Wilson and Stevenson, 2003
). The interactions can be synergistic or inhibitory (Tabor et al., 2004
; Deisig et al., 2006
; Silbering and Galizia, 2007
), but the determination of synergistic interaction is problematic because additive concentration phenomena often counteract this effect (Duchamp-Viret et al., 2003
). We found suppressive mixture effects, in which boutons decreased their responses to mixtures in comparison to the components.
Mixture suppression exists in both lPN and mPN boutons (Figure 6
). However, more lPN boutons decreased their responses to binary mixtures than mPN boutons. Such inhibitory mixture interactions could result from inhibitory interactions between ORNs within the pore plates on the antennae (Akers and Getz, 1993
; Getz and Akers, 1995
), by the inhibitory network of the AL (Deisig et al., 2006
) and/or by that of the MB calyx. Interestingly, this finding is in agreement with recent data from intracellular single cell recording and staining by Krofczik et al. (2009)
.
Inhibitory mixture interactions are thought to be a particularly important feature for encoding natural scents of flowers, because these odorants are composed of complex blends of many substances (Knudsen et al., 1993
), and bees are not only able to discriminate between components and mixtures (Chandra and Smith, 1998
; Müller et al., 2000
; Deisig et al., 2001
, 2002
; Komischke et al., 2003
), but also to extract the variability of proportions of components in mixtures across a large range of concentrations (Wright and Smith, 2004
).
Physiological Characteristics of IPN and mPN Boutons in a Biological Context
Honeybees forage over long distances orienting to low concentrations of flower odors, which may suddenly change to high concentrations when the bee passes through an odor plume. In this phase, detecting concentration gradients could be more important than identifying an odor. It has been suggested that odor concentration is coded in the strength of excitation both in ORNs (Akers and Getz, 1993
; Getz and Akers, 1994
; de Bruyne et al., 2001
) and PNs (Sachse and Galizia, 2003
). Since we found that the strength of mPN boutons’ excitatory activity was more concentration dependent than that of lPN boutons (Figure 4
), the physiological characteristics of mPN boutons are thought to be particularly suitable in this behavioral context. By choosing between flowers and working within a flower, bees are exposed to high concentrations of odors. In this phase, odor identity is more informative for flower identification and learning. Indeed, bees achieve their best discrimination of odor identity at a high concentration (Getz and Smith, 1991
; Bhagavan and Smith, 1997
; Pelz et al., 1997
). We found that lPN boutons exhibited sparser coding characteristics than mPN boutons in response to a high concentration (1%) of odors, suggesting their physiology is suitable in this behavioral context. Categorizing foraging phases according to the distance of bees from the flower might be a component of context-specific behavioral tuning (Menzel, 1985
). The MB may play an important role in the control of such behavioral switches (Mizunami et al., 1998
; Menzel and Giurfa, 2001
; Lachnit et al., 2004
).
We thank Mr. F. Schaupp, Mr. A. Behl and Dr. A. Galkin for technical assistance in data analyses, Ms. A. Klawitter for providing Ringer solution for Ca2+ imaging and technical assistance in immunostaining and Dr. J. Rybak for technical advice on neural reconstructions. This study was supported by grants from the Deutscher Akademischer Austausch Dienst (DAAD) to N.Y. and from the Deutsche Forschungsgemeinschaft to R.M (Me 365-37).
The authors declare that the research was conducted in the absence of any commercial or financial relationships that could be construed as a potential conflict of interest.
The Supplementary Material for this article can be found online at http://www.frontiersin.org/systemsneuroscience/paper/10.3389/neuro.06/016.2009/
Lachnit, H., Giurfa, M., and Menzel, R. (2004). Odor processing in honeybees: Is the whole equal to, more than, or different from the sum of its parts? In Advances in the Study of Behavior, Vol. 34, P. J. B. Slater, J. S. Rosenblatt, C. Snowdon, T. Roper, H. J. Brockmann, and M. Naguib eds (Amsterdam, Elsevier), pp. 241–264.