Layer- and column-specific knockout of NMDA receptors in pyramidal neurons of the mouse barrel cortex
- 1 Laboratory of Sensory Processing, Brain Mind Institute, Ecole Polytechnique Federale de Lausanne (EPFL), Switzerland
- 2 Laboratory for the Study of Neurodegeneration, Ecole Polytechnique Federale de Lausanne (EPFL), Switzerland
Viral vectors injected into the mouse brain offer the possibility for localized genetic modifications in a highly controlled manner. Lentivector injection into mouse neocortex transduces cells within a diameter of approximately 200μm, which closely matches the lateral scale of a column in barrel cortex. The depth and volume of the injection determines which cortical layer is transduced. Furthermore, transduced gene expression from the lentivector can be limited to predominantly pyramidal neurons by using a 1.3kb fragment of the αCaMKII promoter. This technique therefore allows genetic manipulation of a specific cell type in defined columns and layers of the neocortex. By expressing Cre recombinase from such a lentivector in gene-targeted mice carrying a floxed gene, highly specific genetic lesions can be induced. Here, we demonstrate the utility of this approach by specifically knocking out NMDA receptors (NMDARs) in pyramidal neurons in the somatosensory barrel cortex of gene-targeted mice carrying floxed NMDAR 1 genes. Neurons transduced with lentivector encoding GFP and Cre recombinase exhibit not only reductions in NMDAR 1 mRNA levels, but reduced NMDAR-dependent currents and pairing-induced synaptic potentiation. This technique for knockout of NMDARs in a cell type, column- and layer-specific manner in the mouse somatosensory cortex may help further our understanding of the functional roles of NMDARs in vivo during sensory perception and learning.
Introduction
Advances in genetic manipulations in mice over the last decades have allowed the knockout (KO) of specific genes in a temporally controlled fashion. In particular, targeted insertion of LoxP sites flanking a gene of interest, creating a so-called “floxed” gene (Figure 1 A), combined with tightly regulated expression of the P1 bacteriophage-derived Cre recombinase (Hoess et al., 1982 ; Sauer and Henderson, 1988 ) can result in a highly specific KO.
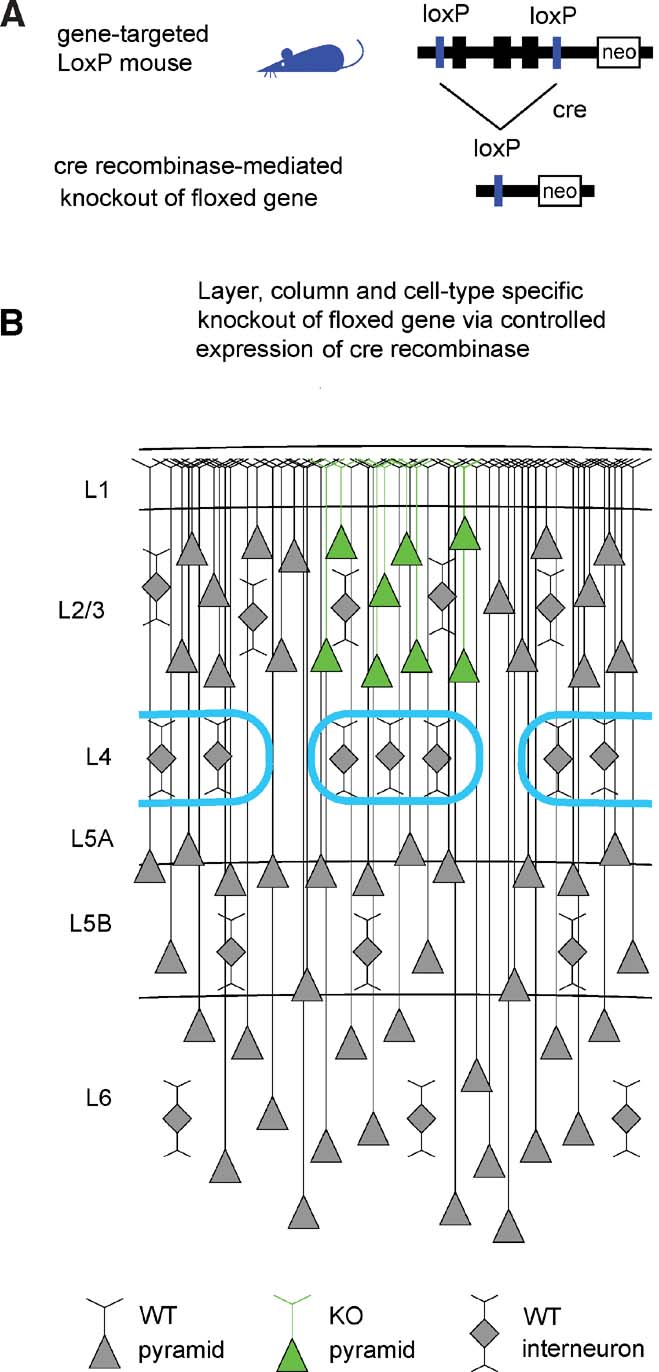
Figure 1. The Cre–LoxP system for controlled gene knockout. (A) The gene of interest is flanked by LoxP sites (“floxed”) in non-coding regions of the genome through gene targeting. The floxed gene should ideally be normally expressed and functional, so that the gene-targeted mice are phenotypically wild-type. Expression of Cre recombinase induces recombination between the LoxP sites, thus knocking out the floxed gene. (B) Schematic drawing of a part of the somatosensory mouse barrel cortex. The barrels in layer 4 are outlined in cyan, defining the lateral boundaries of a cortical column. Pyramidal neurons are indicated by triangular cell bodies with ascending apical dendrites. Interneurons are depicted as diamonds with local dendritic arbors. In this schematic drawing, pyramidal neurons of layer 2∕3 of the central barrel column express Cre (green in this depiction) and the floxed gene would be eliminated in these cells. Neighboring non-pyramidal neurons are wild-type. Neurons in other cortical columns and in other layers are also wild-type. Therefore, a highly controlled knockout of a floxed gene will be induced if Cre recombinase is expressed in a specific cell type of a single layer of one cortical column.
Using this strategy, (Tsien et al., 1996a ; Tsien et al., 1996b ) generated the first mice lacking NMDA receptors (NMDAR) specifically in the CA1 region of the hippocampus, while leaving NMDAR function intact in the rest of the brain. The NMDAR is a glutamate-gated ion channel, which is a particularly attractive candidate for mediating associative synaptic plasticity since it requires both presynaptic release of glutamate and postsynaptic depolarization. NMDAR activation causes calcium influx, which in turn can trigger synaptic plasticity via several pathways. NMDA channels are formed of four subunits encoded by seven genes, some with multiple splice variants, but the NMDAR 1 subunit (NR1) is common to all NMDA channels and is required for their delivery to synapses. (For recent reviews of NMDAR subtypes, function, and distribution, see, for instance, Cull-Candy and Leszkiewicz, 2004 ; Köhr, 2006 ). The local KO of NR1 (Tsien et al., 1996b ) was accomplished by generating two transgenic mouse lines and breeding them: one line of gene-targeted mice carrying LoxP sites flanking the second half of the NR1 gene (the floxed NR1 gene or fNR1), and a second mouse line, with Cre expressed as a transgene under the αCaMKII promoter. Although αCaMKII is normally expressed widely across pyramidal neurons of the forebrain, Tsien et al., (1996a) found Cre activity in highly localized regions of the brain in a number of transgenic mouse lines. In particular, they found two lines with recombinase activity limited to the CA1 region. Because the NR1 subunit is essential for the formation of all NMDAR subtypes, by crossing the fNR1 mice with the αCaMKII-Cre mice, they thus succeeded in knocking out NMDARs specifically in the CA1 region.
Although this approach is enormously powerful, it is currently limited by the need to express Cre in the brain region and cell type of interest. It is clear that many genes are expressed in specific cell types in defined brain areas (Gong et al., 2003 ; Lein et al., 2007 ), and it is likely that many further specific promoters will be found and utilized over the next years for generating such localized genetic manipulations based on the Cre–LoxP system. However, it is not clear that promoters alone will ever provide sufficient specificity for all types of experiments. As discussed previously (Aronoff and Petersen, 2006 ), specific promoters are frequently affected by transgenic integration context. Additionally, neuronal subtypes, which may well contain specifically expressed genes, may have broader anatomical distributions than those that one might wish to target. For example, in the mouse somatosensory cortex there is a very clear structural map of the tactile whiskers delimited by the presence of barrels that are laid out in a one-to-one mapping of the whiskers on the snout (Woolsey and Van der Loos, 1970 ). It would be useful to be able to regulate gene expression specifically within these cellular representations of one defined whiskerquotidns particular barrel column. If one could add, remove, or alter genetic activities in a cortical layer-specific manner, one could examine the roles of molecules within the synaptic circuits in great detail under highly controlled conditions. It seems unlikely, however, that a promoter would be found capable of such specificity. Given the interest in this sensory pathway as a model system of mammalian cortical sensory processing (for recent reviews see Feldman and Brecht, 2005 ; Kleinfeld et al., 2006 ; Petersen, 2003 ; Petersen, 2007 ), it would seem useful to develop techniques for specific genetic manipulations in defined cell types, layers, and columns of the mouse barrel cortex (Figure 1 B). Currently, the only cortical-specific promoter that has been used to control Cre expression is Emx1, which is active in all excitatory neurons across the entire neocortex (Iwasato et al., 2000 ).
Viral delivery of Cre may be a useful tool to combine the spatial selectivity of a viral injection with the genetic specificity of gene-targeted floxed mice. Indeed, “focal” KOs have been generated in the CA3 region of the hippocampus in the fNR1 mouse, using Cre expressed from adeno-associated virus (Rajji et al., 2006 ) resulting in disrupted learning of novel paired associations. A similar approach was used by Tashiro et al., (2006) to analyze the need for NMDARs in newborn neurons for their integration and stabilization into the dentate gyrus.
In this report, we demonstrate that a mammalian codon optimized Cre (Shimshek et al., 2002 ) expressed from a lentivector (Naldini et al., 1996 ) in fNR1 mice can transduce cortical cells in a layer- and column-specific manner (Aronoff and Petersen, 2006 ; Dittgen et al., 2004 ), generating highly localized NR1 KO and concomitant loss of NMDAR function in pyramidal neurons. Such specificity will enable the analysis of the contribution of NMDARs to whisker-dependent sensory perception and learning. In this context, it is interesting to note that rodents can locate a target platform with a single whisker (Hutson and Masterton, 1986 ) and that the learning of this behavior might occur at least in part through synaptic changes in localized areas of the somatosensory cortex (Harris et al., 1999 ).
Materials and Methods
Lentivector production
Lentivector was prepared by transient transfection of 293T cells with self-inactivating (Zufferey et al., 1998 ) lentivector constructs (Figure 2 A) essentially as described (Deglon et al., 2000 ). This system is dependent upon the HIV Rev and Tat proteins. The VSV-G glycoprotein for entry into infected cells also allows ∼1000× concentration of lentivector supernatants by ultracentrifugation (23 Krpm for 1.5 hours at 4°C). In some cases, stocks were pelleted over 20% sucrose cushions. Concentrated lentivector stocks were resuspended in PBS with 0.5% BSA and characterized both for infectious titer in vitro on HeLa cells and for the amount of the virion component, P24 by enzyme linked immunosorbent assays (Retrotek HIV-1 p24 Antigen ELISA kit, Zeptometrix Corp.) following the kit protocol. Generally, titers of lentivector stock used were between 106 and 108 infectious units∕ml with P24 values of >25 000 ng∕ml (but even stocks with P24 levels as low as 9000 ng∕ml could be used for efficient cortical transduction).
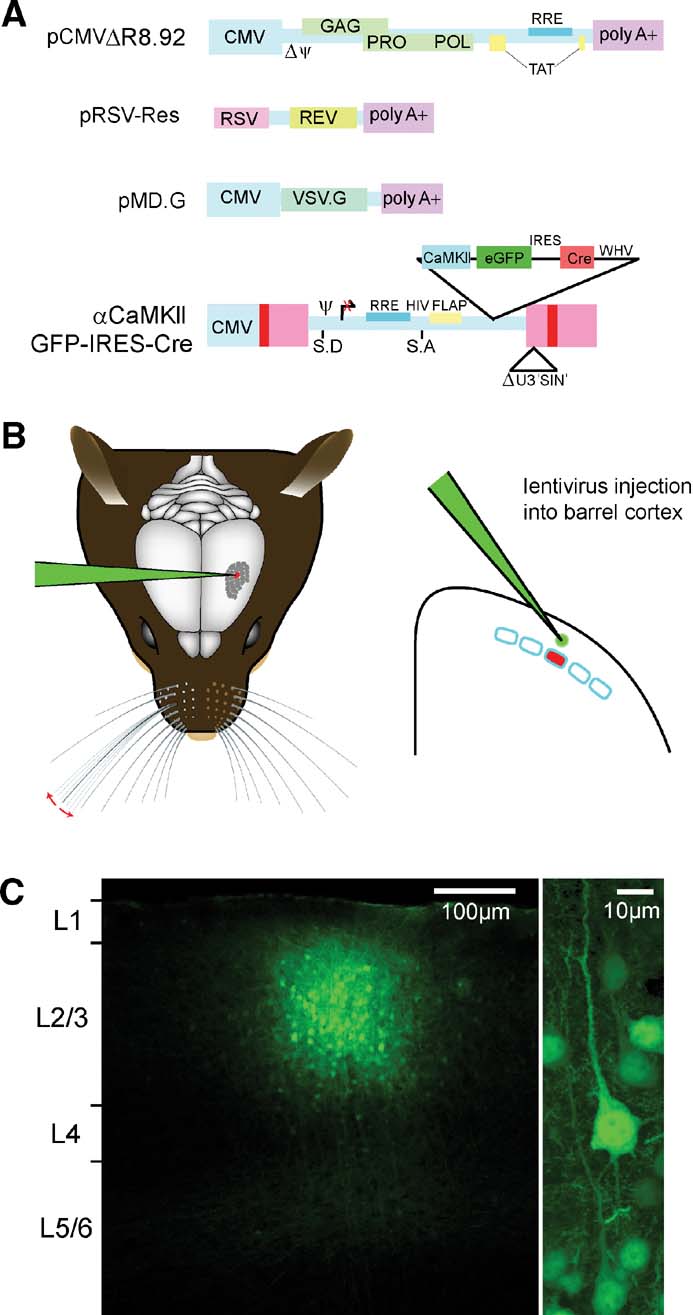
Figure 2. Cortical layer and cell type-specific expression of Cre through lentivector encoding GFP and Cre driven by the CamKII promoter. (A) pCMVΔR8.92 encoding virion components, pRSV-Rev encoding HIV-1 Rev protein, pMD.G, encoding the VSV-G glycoprotein, and the transfer vector plasmid, pFC1.3Cre (αCaMKII GFP IRES Cre or the control αCaMKII GFP) are used for lentivector production by transient transfection of 293T cells. (B) While the mouse is under anesthesia, a small craniotomy is made in the skull to allow a glass micropipette containing the lentivector solution to be introduced directly into the neocortex at a specific location using micromani pulators. A small volume ∼50 nl is then slowly injected into the neocortex. The micropipette is slowly retracted, the skin sutured, and the mouse quickly recovers from the surgical procedure. (C) Three weeks after lentivector injection, the brain was fixed and coronal sections were prepared for confocal imaging. GFP-positive cells are found in a small volume of neocortex (diameter ∼200 μm) at the location of the injection site (left). The vast majority of GFP expressing cells are pyramidal neurons (right). Thus, lentivector injection can allow GFP expression that is column, layer, and cell type specific.
Animals
All experimental protocols were approved by the Swiss Federal Veterinary Office. Mice were maintained under standard conditions, in ventilated boxes with cardboard tubes and tissues. Three heterozygous fNR1 transgenic mice were kindly provided by Z. Cui and J.Z. Tsien (Boston U). Genotyping of tail DNAs by Southern blot using random-primed 32P-labeled probes generated from the three prime end plasmid, pBSKS∕3′NR, from Z. Cui (as described, Tsien et al., 1996b ) identified homozygote progeny for further breeding. Genotyping was also performed by PCR with the neo primers (5′-3′): Neo4 GGCTATTCGGCTATGACTGGGC, and Neo5 GGGTAGCCAACGCTATGTCCTG, which amplify a 625 bp product from the transgenic allele; and NR1 primers: ER5 TGTGCTGGGTGTGAGGGTTG and ER10 GTGAGCTGCACTTCCAGAAG, which amplify a 220 bp product from the NR1 gene. A homozygous breeding pair of the Rosa26R Cre indicator transgenic line (B6.129S4-Gt(ROSA)26Sortm1Sor∕J) was obtained from the Jackson Laboratories (Bar Harbor, Maine).
Intrinsic optical imaging
Anesthesia was induced with 3% isoflurane and anesthesia was maintained by either 1% isoflurane, ketamine (75 mg∕kg i.p.)∕xylazine (10 mg∕kg i.p.), or intra-peritoneal injection with a “sleep” mix, consisting of midazolam (3.4 mg∕kg), fentanyl (0.03 mg∕kg), and medetomidine (0.25 mg∕kg). Animals are maintained on a heating blanket at 37°C with the body temperature controlled through feedback from a rectal thermometer. Ophthalmic gel (Viscotears®, Novartis) was put on the eyes to prevent drying. The paw withdrawal reflex was monitored before commencing surgery, and reflexes were checked routinely to avoid possible recovery from anesthesia. An additional 10% of the initial dose of the sleep mix was injected if necessary. Custom-built nose clamps hold the animals stably for surgery, and the cortical surface was visualized through the intact bone covered with Ringerquotidns solution and sealed with a glass cover slip. The surface blood vessels were visualized using light at 530 nm to enhance contrast. The illumination was switched to 630 nm for functional imaging. The reflected light was imaged using a Qicam CCD camera (Q-imaging) coupled to a Leica MZ9.5 microscope. Image acquisition via firewire and stimulus control via an ITC18 (Instrutech, Port Washington, NY) was governed by custom routines running in IgorPro (Wavemetrics). Alternating sweeps were imaged with or without piezo-stimuli delivered to the C2 whisker. Stimuli were applied at 10 Hz for 4 seconds and the intrinsic signal was quantified as the difference in the reflected light upon stimulus compared to immediately before. The intrinsic imaging gave a localized signal centered on the C2 barrel column. This functionally identified location of the C2 barrel column was mapped onto the blood vessel pattern to guide surgery for the craniotomy and subsequent targeted injections. In some experiments C1, C3, B2, or D2 whiskers were also stimulated to reveal the layout of the somatotopic barrel map.
Lentivector injection
Under anesthesia, a small craniotomy (<500 μm diameter) was carefully performed, avoiding damage to the cortex. Glass micropipettes (Drummond® PCR micropipettes 1–10 μl with fitted plungers) were pulled to a tip diameter of ∼6–7 μm, backfilled with oil, fitted with a plunger, and mounted on a micromanipulator; and a Narishige hydraulic system was used to first fill the needle with lentivector suspension from the tip, and then to slowly pressure inject about 50 nl of the lentivector stock into the cortex. Many injections were made normal to the pia surface, but for some injected animals, craniotomies were shifted medially by about 0.5 mm to allow angled (∼20°) entry to the target site, avoiding craniotomy over the cortical column of interest. After injection, sutures were used to close incisions. To antagonize the “sleep” mix, the “wake-up” mix consisting of flumazenil (0.4 mg∕kg), naloxon (0.5 mg∕kg), and atipamezol (0.375 mg∕kg) was injected sub-cutaneously. The mice recovered rapidly from anesthesia and were subsequently housed with increased biosafety.
ß-galactosidase (Gal) histochemistry and LacZ immunohistochemistry
Sixty micrometer brain slices from animals perfused with 4% PFA were washed in PBS and reacted with a mix of potassium ferrocyanide (4 mM)∕potassium ferricyanide (4 mM)∕MgCl (40 mM) and 0.4 mg∕ml X-Gal (5-bromo-4-chloro-3-indolyl-b-O-galactopyranoside, made up as a 40 mg∕ml stock in DMSO) in PBS at 37°C for 30 minutes to 2 hours. Further PBS washes stopped the reaction, and slices were mounted in Vectashield Hardset. An Olympus AX70 microscope fitted with a DP50-CU camera and run via “analySIS” (Soft imaging system, GmbH) software was used to acquire micrographs.
For antibody staining, similar slices were blocked in 0.1% TritonX-100∕0.05% BSA∕0.05% normal goat serum (NGS) in PBS 3 × 15 minutes with shaking at room temperature, and then primary antibodies, a rabbit antiGFP (Chemicon), and a mouse antiLacZ (Promega) were diluted to 1:1000 in fresh 0.1% TritonX-100∕0.05% BSA∕0.05% NGS solution, applied to slices and incubated overnight with rocking at 4°C. After washing the slices 3 × 10 minutes in PBS at room temperature, secondary antibodies, an Alexa Fluor 594 conjugated goat anti mouse IgG and Alexa Fluor 488 goat anti rabbit (Molecular Probes) were diluted 1:1000 in PBS with 1% NGS and incubated 2 hours at 4°C. After 3 × 10 minutes washes at room temperature with shaking, slices were mounted and images were acquired on a Leica Confocal (TCS-SP2 AOBS). Data were analyzed with Imaris (Bitplane) and Excel (Microsoft). To aid automatic “spot” detection, confocal z-series were processed with a median filter to blur the LacZ+ inclusion bodies, then series were examined by zooming and rotating in three dimensions to manually confirm that each particular spot corresponded to an imaged cell body.
NMDAR mRNA in situ hybridization
In situ hybridizations were performed using the Ventana “Discovery” platform (Ventana Medical Systems, Inc.), their BlueMap detection kit and digoxigenin-labeled RNA probes transcribed in vitro from a rat NR1 cDNA plasmid, pSP-ASP (Iwasato et al., 1997 ), which should recognize all splice variants of NR1. In situ protocols were optimized empirically for tissue pretreatments and probe dilutions and were highly reproducible. Controls included “no probe” and “sense” probe hybridizations for background and specificity, respectively. Antisense probe was generated from the BamHI-digested plasmid template by transcription with SP6 RNA polymerase (Promega), while sense control probe was generated from the XhoI-digested template with T7 RNA polymerase (Promega). Transcription reactions contained 0.5 mM each ATP, CTP, and GTP, 0.2 mM UTP, and 0.1 mM digoxigenin-UTP and the provided buffers, and were incubated overnight at 37°C. After transcription, digoxigenin-labeled control RNA (Roche Diagnostics) at 100 ng∕μl was serially diluted 1 in 4 in 50% DEPC H20, 30% 20× SSC, and 20% formaldehyde and spotted onto a nylon membrane along with serial dilutions of the freshly transcribed RNA probes for dot blot control of digoxigenin incorporation. After spotting, RNA was crosslinked under UV and probed with an alkaline phosphatase-conjugated anti digoxigenin Fab fragment (Roche Diagnostics) with subsequent NBT∕BCIP detection. The amount of digoxigenin incorporation into the probes relative to control signal was determined by direct comparison and used to choose appropriate dilutions of the probe for hybridization. Probe RNAs were kept undiluted at −80°C and diluted prior to use. Cryosections of 16 μm were cut from brains of injected fNR1 animals, frozen on crushed dry ice after perfusion with 4% PFA, a 90 minute “post-fix” at 4°C in fresh PFA, and overnight incubation at 4°C in RNase free 20% sucrose in PBS for cryoprotection. Sections were floated in RNase free PBS for examination by fluorescence to find the lentivector injection site, then mounted on slides and dried down at 42°C. Dry slides were stored at −80°C until used for in situ hybridization. Some of these slices were stained with cresyl violet to control for potential inflammatory responses.
Electrophysiological in vitro whole-cell recordings
Electrophysiological recordings were carried out after waiting at least 3 weeks from the date of injection of the lentivector encoding GFP and Cre. Since lentivector was injected at 3 weeks postnatally, these injected fNR1 mice were therefore at least 6 weeks old. After removing the brain from the skull, it was placed in ice-cold extracellular medium and 300 μm parasagittal vibratome slices of primary somatosensory barrel cortex were cut according to standard procedures (Berger et al., 2007 ; Kvajo et al., 2004 ). The extracellular medium contained the following (in mM): 125 NaCl, 25 NaHCO3, 25 glucose, 2.5 KCl, 1.25 NaH2PO4, 2 CaCl2, and 1 MgCl2, bubbled with 95% O2 and 5% CO2. All experimental procedures were performed at 35°C. The slice containing GFP-positive neurons (transduced by the lentivector) was identified by fluorescence at low magnification using a 4× 0.28 NA (Olympus) lens of an upright microscope (BX51WI; Olympus, Tokyo, Japan). In some experiments, individual fluorescing neurons were identified for whole-cell recordings by epifluorescence using a 20× 0.95 NA water immersion lens (Olympus) imaged onto a CoolSNAP CCD camera (Photometrics). In other experiments, the GFP-positive neurons were identified using a 40× 0.8 NA water immersion lens mounted on a two-photon microscope (Ultima, Prairie Technologies). A MaiTai (SpectraPhysics) laser operating at 860–900 nm was used to excite two-photon fluorescence. Emitted fluorescence was collected using photomultiplier tubes, both back through the objective and below the condenser. Both green fluorescence (bandpass filtered 525 ± 35 nm) and red fluorescence (bandpass filtered 607 ± 22.5 nm) were measured simultaneously. Another photomultiplier tube located behind a Dodt contrast tube (Luigs & Neumann) allowed precise overlay of the fluorescence images with a high contrast scanned image of neuronal structure.
A large-diameter (∼5–10 μm) glass patch pipette filled with extracellular solution served as the stimulation electrode and was placed in the center of a layer 4 barrel, below the lentivector-transduced cells in layer 2∕3. Stimulation was evoked by 200 μs current pulses of 10–30 μA. Whole-cell recordings were obtained from layer 2∕3 pyramidal neurons, which were either GFP-positive (NR1 KO) or GFP-negative (control). All neurons recorded (both GFP-positive and GFP-negative) were located within the lentivector injection site. The intracellular solution contained the following (in mM): 120 Cs-gluconate, 10 HEPES, 10 Na-phosphocreatine, 5 CsCl, 4 MgATP, 0.3 NaGTP, adjusted to pH 7.2, with CsOH. Alexa Fluor 594 (Molecular probes) was included at 10–50 μM in the intracellular solution to allow morphological identification of the recorded neurons and immediate overlay of GFP fluorescence to confirm correct targeting of the recording. Ionotropic GABAergic synaptic transmission was pharmacologically blocked by 100 μM picrotoxin, and postsynaptic GABAB responses were blocked in the recorded cell by the presence of Cs+ in the recording pipette. Synaptic currents evoked by electrical stimulation of layer 4 were recorded with the soma voltage-clamped at either −60 or +40 mV (to relieve the voltage-dependent Mg+2 block of the NMDAR). The currents were recorded using a Multiclamp 700 amplifier (Axon Instruments, Foster City, CA) filtered at 2–3 kHz and digitized at 10 kHz using an ITC-18 (InstruTech).
A pairing protocol was used to assess the ability of the excitatory synapses in the recorded neurons to undergo potentiation (Petersen et al., 1998 ). Extracellular stimuli were delivered at 1 Hz, while holding the somatic membrane potential clamped to −60 mV. After a baseline period of 200 seconds, pairing of depolarization and synaptic input was induced by clamping the membrane potential to 0 mV while stimulation continued unchanged. After this pairing, the effect on baseline synaptic transmission was assessed by returning the membrane potential to –60 mV for another 700 seconds. The EPSC amplitude before and after pairing was measured at the peak of the evoked response from averaged traces.
Results
Cell type-, layer-, and column-specific genetic manipulation with lentivectors
Lentivector encoding GFP and Cre (Figure 2 A) driven by a 1.3 kb fragment of the αCaMKII promoter (Dittgen et al., 2004 ) was injected directly into the mouse somatosensory barrel cortex.
In this lentivector, Cre expression depends on an internal ribosomal entry sequence (IRES) and its translation is predicted to be less robust than that of GFP, but fortunately this does not seem to limit efficacy of the recombinase (see below). Lentivector was injected under anesthesia through glass micropipettes with tip diameters of ∼6–7 μm (Figure 2 B). Larger tip diameters were more prone to cause cortical damage, particularly if injecting through the intact dura, while smaller tip diameters can tend to clog. The depth of the injection determined which layer was transduced. For this study, all injections were targeted to layer 2∕3 by injecting ∼50 nl of the lentivector solution at a depth ∼300 μm below the cortical surface. After injection, the mice recovered from anesthesia and were maintained in normal housing conditions with heightened biosafety. The effects of these injections were analyzed three or more weeks later. We first investigated the spatial extent of the brain region containing transduced neurons. We analyzed fixed 100 μm thick brain slices from injected fNR1 mice using confocal microscopy. Similar to previous reports (Aronoff and Petersen, 2006 ; Dittgen et al., 2004 ; Komai et al., 2006 ), we found GFP expressing neuronal somata in a tightly localized region of the cortex. The number of cells expressing GFP and the exact spatial distribution varied from injection to injection. Some of this variability likely results from different injected volumes. For example, in a set of experiments using the same virus preparation, injection of ∼100 nl of virus resulted in ∼400 μm diameter area of GFP-expressing cells, while injection of ∼50 nl resulting in ∼150 μm diameter area of GFP-expressing cells. Another part of the variability results from the injection of viruses with different titers (injecting virus with titer of 108 infectious units per ml resulted in a much higher density of GFP expressing cells over a slightly larger brain region compared to injection of virus with a titer of 106 infectious units per ml). The number of GFP expressing neurons around the injection site can range from tens to thousands. By changing conditions, it is therefore possible to vary the spatial extent and number of transduced neurons. However, not all of the variability is under experimental control; and it is essential to carefully analyze each injection site individually. In general, GFP expressing cells were located within ∼100 μm of the injection site, giving a roughly spherical region of transduced cells with diameter ∼200 μm (Figure 2 C). A barrel column of the mouse somatosensory cortex also has diameter of ∼200 μm. The thickness of layer 2∕3 is around ∼300 μm. This lentivector injection protocol is therefore well suited to transducing cells specifically within layer 2∕3 and within a single cortical column.
Upon imaging the cells within the injection site at higher resolution (Figure 2 C, right), we found that the vast majority of cells expressing GFP were pyramidal neurons. In addition, a few GABAergic neurons and astrocytes expressed GFP. In part, this relates to the fact that pyramidal neurons are the dominant cell population in layer 2∕3 of the mouse barrel cortex. Further specificity likely results from the use of the αCaMKII promoter. In the neocortex, the native αCaMKII protein is exclusively expressed in excitatory glutamatergic neurons (Liu and Jones, 1996 ). Because these lentivectors are not subject to superinfection interference, the core of the injection site most likely contains multiple copies of the transduced genes, masking potential position effects due to integration site. This means that the promoter elements driving expression will, on average, predominate in the transduced cells. The lentivector approach described here, therefore, offers first-order cell type specificity as well as cortical column and layer specificity.
Targeting specific cortical columns through intrinsic optical imaging
In order to make use of the limited horizontal spread of the lentivector across the cortical map, the injections must be targeted to specific cortical columns. Unfortunately, although the barrel map is readily identifiable in vitro in brain slices (Petersen and Sakmann, 2000 ), it is currently not possible to visualize the anatomical somatosensory map in vivo. The cortical area must therefore be functionally mapped, either through imaging or electrophysiology. Receptive field mapping is time consuming and requires the exposure of large cortical areas in order to repeatedly insert electrodes into the brain. We therefore used intrinsic optical imaging (Grinvald et al., 1986 ; Polley et al., 1999 ), which can be performed through the intact skull in mice, allowing a non-invasive mapping of brain function. This imaging approach is of course limited to brain areas like S1, V1, A1, and olfactory bulb, which can be relatively easily exposed allowing subsequent recovery after viral injection.
The C2 whisker was deflected 40 times at 10 Hz every 2 minutes and the reflected light at 630 nm imaged on a CCD camera (Berger et al., 2007 ; Borgdorff et al., 2007 ; Crochet and Petersen, 2006 ; Ferezou et al., 2006 ; Ferezou et al., 2007 ). A prominent localized signal was recorded defining the functional position of the C2 barrel column (Figure 3 A). In addition, a smaller amplitude signal was often found more laterally in secondary somatosensory cortex. The intrinsic signal had a spatial profile similar to a Gaussian, with a full width at half maximum of ∼400 μm (Figure 3 B). We estimate that the peak of the intrinsic signal could be localized to within ∼100 μm in relationship to the blood vessels running across the cortical surface, which are used for the later determination of where to make the craniotomy for the lentivector injection. In most experiments, only a small region over the somatosensory barrel cortex was imaged at a higher magnification (being exposed by small incisions in the skin, which were later sutured following lentivector injection). The drawbacks of the intrinsic optical imaging technique for studying brain function are the low sensitivity (prolonged 10 Hz stimulation yields signals but single whisker deflections do not) and the slow time-course of the signals, which develop over the first second of the 10 Hz whisker stimuli and outlast the stimulus by many seconds (Figure 3 C). Fortunately, these temporal limitations do not appear to affect the ability to perform accurate spatial mapping. As a further test of the accuracy of the intrinsic optical imaging signal, we deflected other neighboring whiskers and found that the location of the peak response moved in accordance with the somatotopic map of barrel cortex (Figure 3 D). These example images were obtained at the normal magnification used in most experiments. Quantifying the spatial extent of the intrinsic optical signal, the location of the peak response from C1, C2, and C3 whiskers can be easily distinguished, separated by 243 μm (C1–C2) and 219 μm (C2–C3) (Figure 3 E). The mean distance between C2 and neighboring whisker representations averaged across both arcs and rows of the barrel map was 359 ± 53 μm (n = 5). Having accurately defined the location of the C2 barrel column, injections of lentivector encoding GFP and Cre can be targeted to alter gene expression in the region of the C2 barrel column in mice carrying floxed genes. We performed intrinsic imaging on 12 floxed mice, finding adequate maps for targeted injections in 10 of these mice. Subsequently, tangential brain slices were prepared, and the location of lentivector-transduced cells was analyzed in relationship to the layer 4 barrel map. In seven mice, the injection site was correctly targeted to the C2 barrel column, and in the other three mice nearby barrels (C1, D2, and D1∕γ) were infected. In many cases, at least part of the injection site overlapped with other barrel columns (see also Figure 4 ), so the manipulations were not completely column specific. This further highlights the need to analyze each injection site individually.
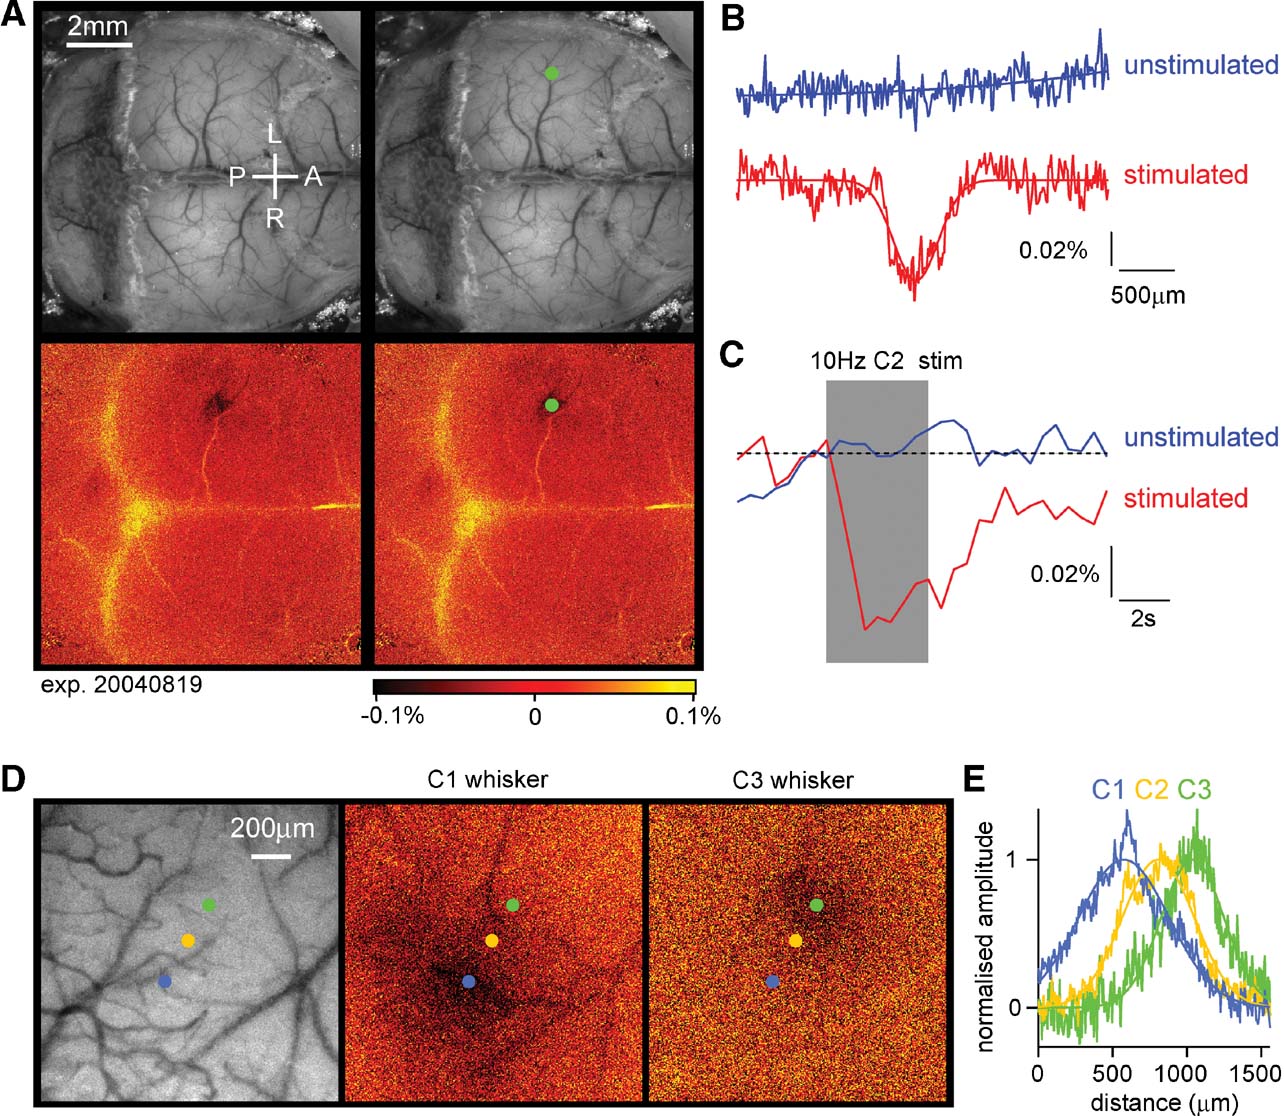
Figure 3. Intrinsic imaging to identify the location of functional cortical columns. (A) A large fraction of the dorsal mouse brain is visualized with green light penetrating through the intact skull covered with Ringer solution and a glass cover slip (upper images). Under red light illumination, the right C2 whisker is deflected at 10 Hz for 4 seconds and the change in reflected light imaged (lower images). The evoked brain activity causes hemodynamic changes, which under our experimental conditions are imaged as reduced reflected red light in the active region on the left side of the brain. The functionally identified location of the C2 barrel column is shown as a dark area (lower images), which is labeled by a green dot (right images). The C2 column in this mouse was located 1.6 mm posterior and 3.3 mm lateral to Bregma. The yellow color indicates increased reflectance of red light, which in this case may be caused by artefacts of unknown origin related to the bone sutures. (B) Quantifying the spatial distribution of reflected red light indicates that the intrinsic optical signal evoked by the 10 Hz C2 whisker stimulation (red curve) has a near Gaussian profile (fitted Gaussian curve has a Gaussian width of 286 μm; full width at half-maximum 396 μm). On alternating intercalated trials, the same imaging procedure was carried out but in the absence of whisker stimulation. On these unstimulated trials, no change in reflected light was observed (blue curve). (C) The time course of the reflected light changes from a region of interest centered on the location of the C2 barrel column during trials with stimulation (red) and intercalated trials without stimulation (blue). The peak amplitude of the intrinsic signal in this experiment was ∼0.06%. (D) In a different mouse, the cortex was imaged at higher magnification through the intact skull. The C1, C2, or C3 whisker was stimulated evoking intrinsic signals located in different positions in agreement with the somatotopic layout of barrel cortex. (E) The spatial extent of the intrinsic signal was quantified along a ∼200 μm thick line aligned with the centers of the evoked responses. The signals were fitted with Gaussian functions and normalized in amplitude. Clear displacement of the location of the peak signal is observed in response to stimulation of different whiskers.
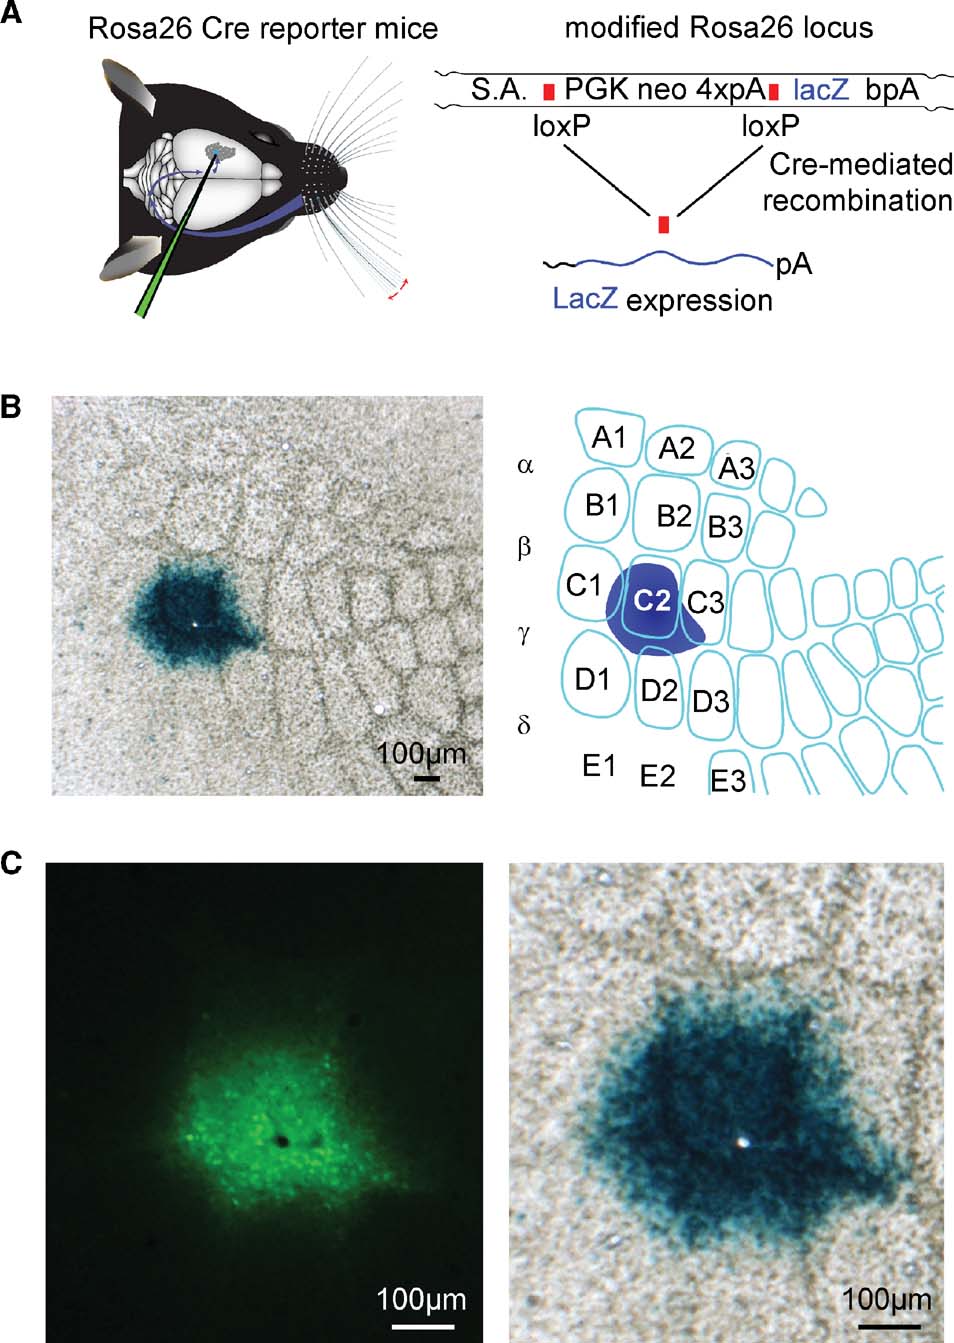
Figure 4. ß-galactosidase assay of Cre activity of the lentivector after targeted injection into a Cre reporter mouse, Rosa26R. (A) Graphic depictions of targeted lentivector injection into the Rosa26R Cre reporter mouse (left), and of the modified Rosa26 locus carrying the floxed PGK neo cassette that carries four polyadenylation sequences (4×pA) to prevent lacZ expression in the absence of the recombinase activity (right). Only after recombination between loxP elements via Cre activity does lacZ expression occur. (B) ßGal activity in the C2 barrel of a tangential section at low magnification from the brain of an injected animal (left), and schematic drawing of this somatosensory barrel field and injection site (right) are shown. (C) At higher magnification, the GFP signal (left) is aligned with the ßGal signal (right). The black hole in the fluorescence image (left) and the aligned white hole (right) is not due to damage from the injection, but to the location of a normal blood vessel.
Assaying Cre activity using a LacZ reporter mouse
In order to assess the efficacy of the recombinase activity induced by this lentivector, we injected the lentivectors into a transgenic Cre reporter mouse line, Rosa26R, in which Cre activity allows expression of LacZ via removal of a floxed PGKneo cassette (Soriano, 1999 ; Figure 4 A).
Following intrinsic optical imaging, we targeted injections of the lentivector encoding GFP and Cre to the C2 barrel column of such Rosa26R mice (n = 2 mice). Three weeks after the injection, the brain was fixed and tangential slices were prepared in order to examine the barrel map of the somatosensory cortex. The slices were stained for ßGal activity encoded by lacZ using a standard ßGal assay giving rise to blue precipitate in cells with ßGal activity. In both mice tested, a high density of cells full of blue precipitate was found tightly localized to the injection site in the C2 barrel column (Figure 4 B). Before staining the slices for ßGal activity, fluorescence micrographs of the same slices were obtained. Aligning the pre-staining fluorescence images and the post-staining blue colorimetric images revealed a close match between GFP fluorescence and ßGal-positive regions (Figure 4 C). However, it was also apparent that the blue precipitate extends further than the observed green fluorescence. Since even very few molecules of Cre might be sufficient to induce lacZ expression, it is possible that this ßGal assay is more sensitive than the fluorescence imaging. We therefore directly compared LacZ and GFP expression using immunohistochemistry.
Fixed slices from Rosa26R mice injected with the lentivector encoding GFP and Cre were stained with a monoclonal antibody against LacZ and a polyclonal antibody serum against GFP and detected with fluorescent secondary antibodies (n = 5 mice). As seen above in comparison to the ßGal assay, the GFP signal of the injection site after antibody staining was also more highly localized than that of the LacZ signal. An example of this is shown in Figure 5 A.
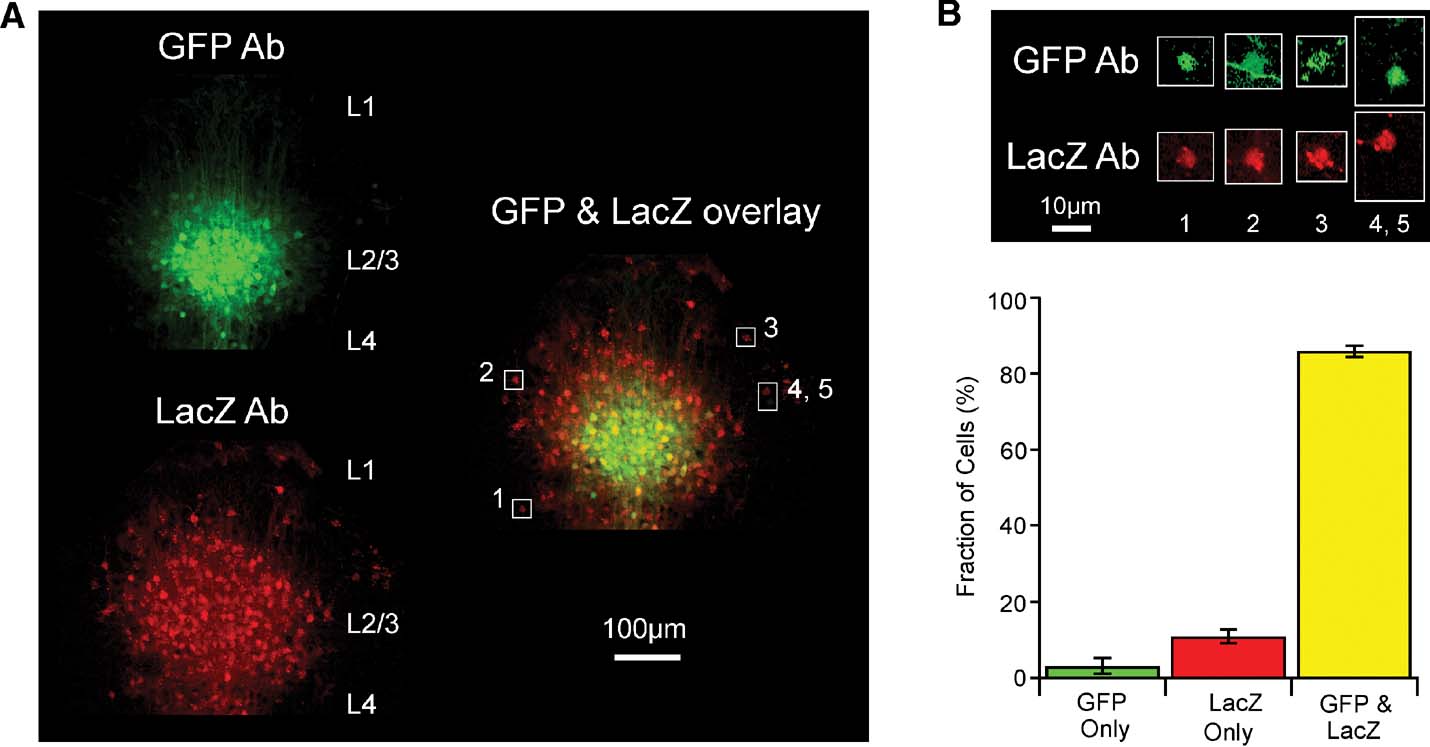
Figure 5. Cellular analysis of lentivector-mediated Cre activity using immunohistochemistry against GFP and LacZ in the Rosa26R cre-reporter mouse. (A) Fluorescent images of a coronal section from a GFP∕Cre lentivector injected Rosa26R mouse stained with antibodies to GFP and LacZ. The immunoreactivity of the injection site cluster of GFP-positive L2∕3 cells is aligned and overlaid with that of LacZ-positive cells from the same slice. GFP signal accumulates in nuclei and spreads along fibers, while LacZ signal in red clusters strongly in subcellular inclusion bodies that can even spread down dendrites, with only some diffuse signal in the somata. Cells (1–5) are outlined with white boxes in the overlay, for closer examination in panel B. (B) Levels of fluorescence intensity for the highlighted cells are increased, showing that most cells are in fact immunoreactive for both LacZ and GFP. A GFP-positive axon fiber crosses the outlined area containing cell 2. Cells 4 and 5 are unusual in that one of the cells only appears to express GFP and the other cell only expresses LacZ. (C) Quantitation of such images from stained slices from five different injected Rosa26R animals.
However, even though the GFP signal (here a combination of the intrinsic fluorescence of GFP and the antibody staining with secondary antibody conjugated to Alexa Fluor 488) is much brighter in a tightly localized domain, while the LacZ signal is more uniformly spread over a larger area, there are actually also quite significant amounts of fainter GFP signal at the periphery of the injection site. This is more evident once signal levels are increased as shown in Figure 5 B for a few selected cells. The difference in signal intensity is most likely because the cells at the periphery of the injection site carry fewer copies of transduced gene sequences than those at the injection site core. Occasionally, a relatively bright green cell is found at the periphery of the injection site and this is most likely due to a favorable genomic integration context of the lentivector. In contrast, the ubiquitous expression from the Rosa26 locus means recombination by Cre induces very similar levels of LacZ in all transduced cells. Swapping secondary antibodies (i.e., with red detection from Alexa594 for the GFP reactivity and green from Alexa488 for the LacZ, not shown) has no effect on the observation that the injection site appears smaller by GFP signal than by LacZ signal.
In order to define the efficiency of Cre function in transduced cells, we thus decided to examine cell by cell the proportion observed with signal from both antibodies. A set of high resolution images, using a 100× objective and thus with only about 30 GFP-positive cells per field were manually scored, rotating and changing levels of gain for the red versus green channels, while lower resolution z-series stacks, acquired with a 10× objective for a large field of view, like that shown as a maximum intensity projection in Figure 5 A, were scored using a combination of automatic analysis with the Imaris softwarequotidns spot finding module and subsequent manual editing. For 1398 cells examined in total, 86% were both GFP- and LacZ-positive, while 3% were found to be only GFP-positive and 11% to be only LacZ-positive (Figure 5 C). A clear example image of rare cells only positive for GFP or only positive for LacZ is shown as cells 4 and 5 in Figure 4 B. In summary, transduction by the lentivector is more efficient than what can be readily visualized based on GFP fluorescence, and Cre expressed in this context works very effectively.
Local decrease in NR1 mRNA abundance in fNR1 mice after cortical lentivector injection
Having determined that the lentivector encoding GFP and Cre works efficiently in the LacZ reporter mouse, with GFP-positive cells also exhibiting Cre activity, we selected the NMDAR as an obvious candidate gene for testing this method of generating local cortical KOs. As mentioned above, calcium influx from NMDARs mediate synaptic plasticity, which is thought to underlie learning and memory. Because functional NMDARs do not form in the absence of the NR1 subunit, KO of NR1 through injections into the cortex of fNR1 mice with the lentivector expressing GFP and Cre should eliminate all NMDARs from transduced cells. Because homozygous fNR1 mice do not produce stable mRNA encoding the NR1 subunit following Cre-mediated recombination (Tsien et al., 1996b ), we assayed directly for loss of NR1 messenger RNA by in situ hybridization (Figure 6 ).
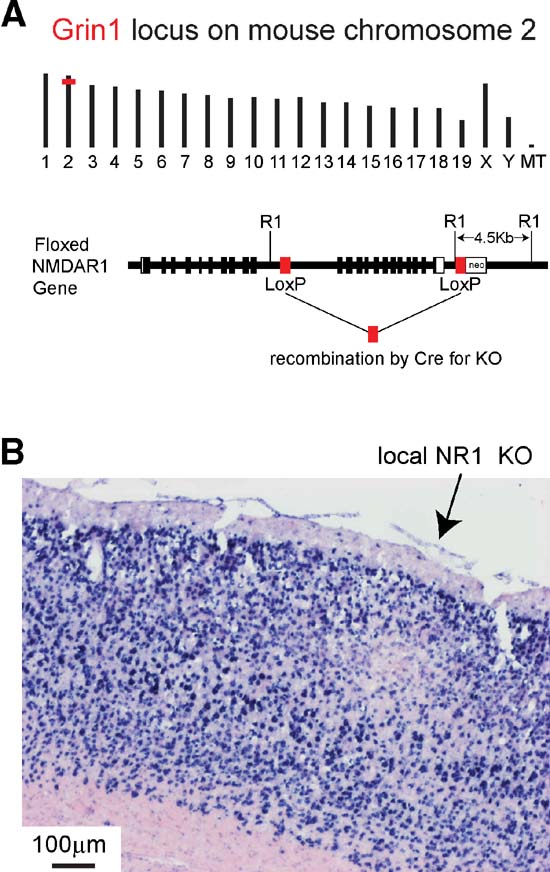
Figure 6. Local knockout of NR1 gene mediated by injection of lentivector encoding GFP and Cre into gene-targeted fNR1 mice. (A) Insertion of loxP elements in the Grin1 locus of mouse chromosome 2 (above) enable Cre-mediated KO of the gene. LoxP elements were inserted into intron sequences of the gene (below) allowing normal gene function in the fNR1 mouse in the absence of Cre (modified from Tsien et al., 1996b). (B) After transduction by lentivector encoding GFP and Cre, NR1 mRNA is found locally depleted at the injection site by in situ hybridization on a 16 m cryostat section. Blue signal is from NBT∕BCIP detection of the digoxigenin-labeled antisense probe, while the pink signal is from the ISH Red counterstain (Ventana Medical Systems, Inc.).
Figure 6 A depicts the genomic location on mouse chromosome 2 of the Grin1 locus encoding the NR1 subunit of NMDARs, and shows the location of the loxP sites inserted in the floxed allele, where recombination can be mediated by Cre. Gene expression and function is normal in fNR1 mice before recombination. Cryosections from fNR1 mice, which had been injected with lentivector encoding GFP and Cre, were hybridized to an antisense NR1 cDNA probe to assay NR1 mRNA abundance (Figure 6 B). In the region of the cortical injection site, NR1 mRNA levels were markedly reduced, suggesting that the lentivector injection had indeed induced a local NR1 KO (n = 7 mice; clear, localized reduction in RNA levels were observed in six of these mice). A control lentivector expressing only GFP did not affect in situ signals (n = 2 mice, data not shown). Thus, the localized deficit of NR1 mRNA in transduced cells is not due to some spurious effect of lentivector transduction, but to KO of the fNR1 gene. Furthermore, some of these cryostat sections were used for cresyl violet staining, with no obvious infiltrating cells observed (not shown), confirming previous reports (e.g., Deglon et al., 2000 ) of the lack of visible inflammatory responses due to such lentivectors. However, at very early time points (2–4 days, but not 6 days) following lentivector injection, we did observe transduced microglia in agreement with previous observations (Ackman et al., 2006 ).
GFP and Cre expressing cells in floxed NR1 mouse have reduced NMDAR-dependent currents
The NR1 subunit is an essential component of the functional NMDAR. In order to examine the functional consequences of the KO of the NR1 gene, we therefore made electrophysiological measurements of glutamate-mediated excitatory postsynaptic currents (EPSCs) from fNR1 mice injected with the lentivector encoding GFP and Cre. Brain slices were prepared and screened for GFP expression using low magnification fluorescence. In general, only one or two slices per animal contained GFP-positive neurons. Whole-cell recordings were then targeted to neurons within the injection site containing the GFP-positive neurons. The recording pipette contained a red fluorescent dye (Alexa Fluor 594) in order to confirm the targeting of the recording to GFP-positive pyramidal neurons (Figure 7 A).
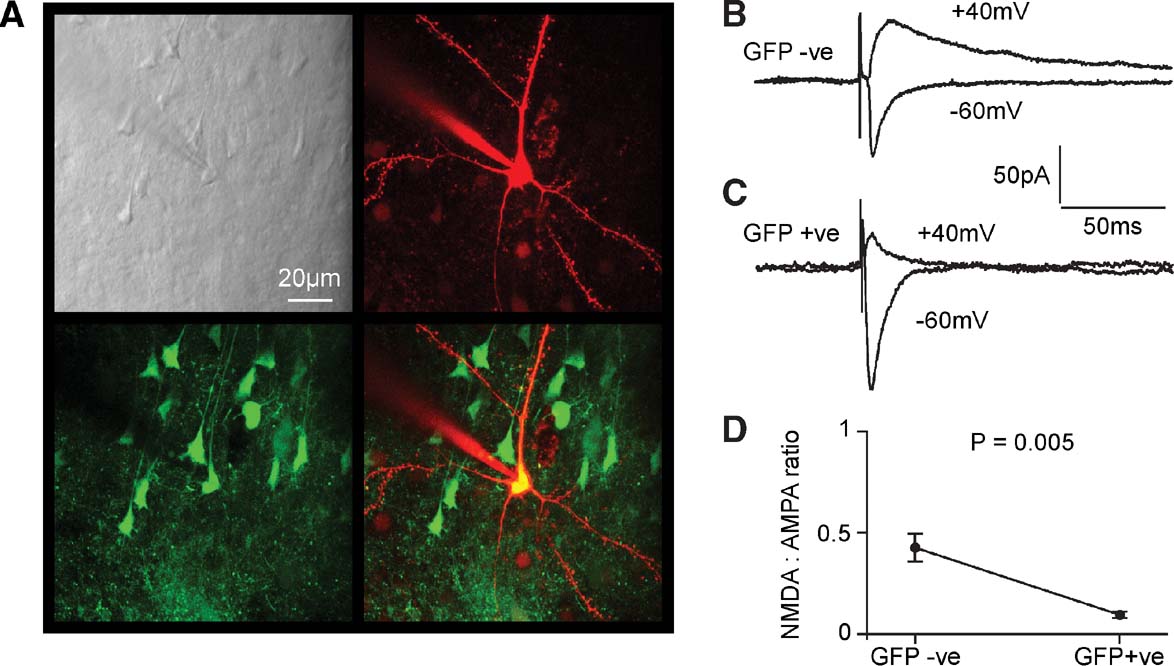
Figure 7. Functional knockout of NMDA-receptor-dependent currents in layer 2∕3 pyramidal neurons of fNR1 mice transduced with lentivector encoding GFP and Cre. (A) In vitro brain slices were prepared from fNR1 mice, which had been injected with lentivector encoding GFP and Cre. The brain slice with GFP fluorescence was identified, and a whole-cell recording was made from a GFP-positive layer 2∕3 pyramidal neuron imaged using a two-photon microscope. The laser scanned Dodt contrast image (upper left) is aligned with the red fluorescent image of the Alexa Fluor 594 filled recording electrode and patched neuron (upper right) and with the green fluorescence image of GFP expressing neurons (lower left). The overlay of red and green fluorescence (lower right) shows that the recorded layer 2∕3 pyramidal neuron is GFP-positive. (B) EPSCs were evoked by extracellular stimulation in layer 4 and recorded using voltage-clamp at −60 and +40 mV. Fast AMPA∕KA-mediated EPSCs were recorded at −60 mV and longer lasting mixed AMPA∕KA and NMDA EPSCs were recorded at +40 mV in control GFP-negative neurons. (C) In GFP-positive NR1 knockout neurons, EPSCs have similar kinetics at −60 mV compared to control neurons. However, at +40 mV the EPSCs were much faster than in control neurons, indicating a loss of NMDA receptor-dependent currents. (D) The ratio of the late (50 ms) currents recorded at +40 mV relative to the peak of the EPSC at −60 mV provided a measure of the NMDA:AMPA ratios. GFP-positive NR1 knockout neurons (n = 8) had a significantly lower NMDA:AMPA ratio than control neurons (n = 8).
Recordings from GFP-negative pyramidal neurons within the injection site served as control neurons. An extracellular stimulation electrode placed in layer 4 immediately below the lentivector injection site in layer 2∕3 was used to evoke glutamatergic synaptic input onto the recorded pyramidal neurons. GABAergic inhibition was pharmacologically blocked by the presence of 100 μM picrotoxin in the extracellular solution. Voltage-clamp at the soma allowed synaptic currents to be recorded at different membrane potentials. We compared the EPSCs recorded at −60 and +40 mV between GFP-positive (Figure 7 B) and GFP-negative cells (Figure 7 C). In layer 2∕3 pyramidal neurons of the mouse barrel cortex, EPSCs evoked at −60 mV are brief and they can be entirely blocked by CNQX, suggesting that they were mediated exclusively by AMPA∕kainate (KA) receptors (Kvajo et al., 2004 ). We therefore used the peak of the EPSC recorded at −60 mV to provide a measure of synaptically evoked AMPA∕KA currents. In layer 2∕3 pyramidal neurons of the mouse barrel cortex, EPSCs recorded at +40 mV consist of two components: a long-lasting NMDAR-dependent current, which can be blocked by 50 μM D-APV leaving a brief EPSC with similar kinetics to those observed at −60 mV and that can subsequently be blocked by addition of CNQX (Kvajo et al., 2004 ). The duration of the AMPA∕KA component is much less than 50 ms. The long-lasting NMDA component of the EPSC recorded at +40 mV was therefore quantified at 50 ms poststimulus. Finally, the ratio of NMDA to AMPA∕KA currents was computed for each cell to allow statistical comparison between GFP-positive and GFP-negative cells (Figure 7 D). We found that the NMDA to AMPA∕KA ratio was significantly reduced in GFP-positive cells (GFP-positive 0.068 ± 0.016, mean ± SEM, n = 8; GFP-negative 0.42 ± 0.09, n = 8; Studentquotidns two-tailed t-test assuming unequal variance p = 0.005). The relative deficit in NMDA-receptor-dependent currents in GFP-positive neurons is consistent with Cre expression in the GFP-positive neurons creating NR1 KO cells, which are then no longer able to make functional NMDARs.
GFP and Cre expressing cells in fNR1 mice show reduced NMDAR-dependent synaptic potentiation
NMDARs have been proposed to play a key role in regulating synaptic plasticity in diverse areas of the brain (reviewed in Bliss and Collingridge, 1993 ; Feldman and Brecht, 2005 ; Sur and Leamey, 2001 ) including layer 2∕3 pyramidal neurons of the somatosensory cortex (Bender et al., 2006 ; Feldman, 2000 ). We therefore tested if synaptic potentiation induced by pairing synaptic input and postsynaptic depolarization differed between GFP-negative control cells (Figure 8 A) and GFP-positive NMDA-receptor KO cells (Figure 8 B).
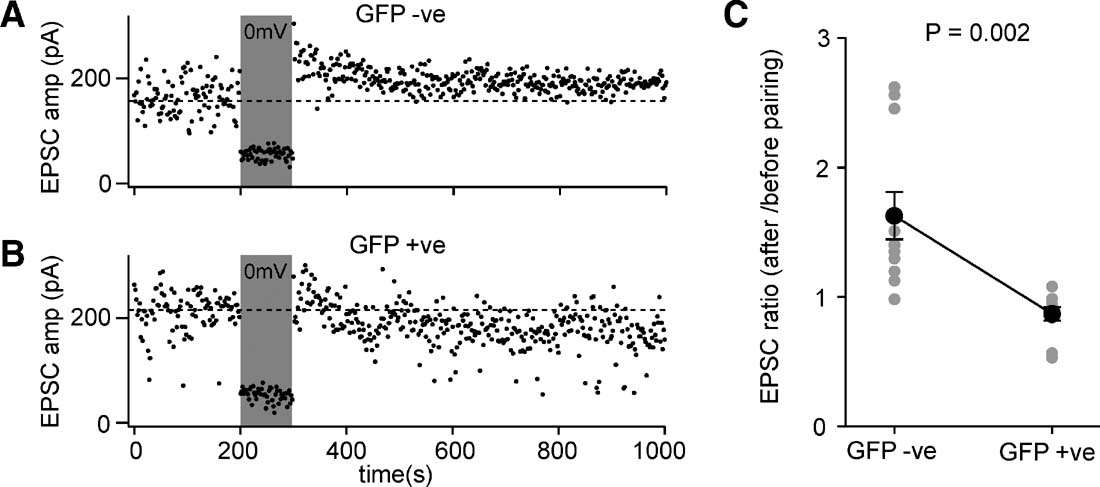
Figure 8. Layer 2∕3 pyramidal neurons of floxed NR1 mice transduced with lentivector encoding GFP and Cre have deficits in pairing-induced synaptic potentiation. (A) EPSCs were evoked at 1 Hz by extracellular stimulation in layer 4 and recorded in layer 2∕3 pyramidal neurons while voltage-clamping the somatic membrane potential at −60 mV. After 200 seconds of baseline EPSCs, the membrane potential was depolarized to 0 mV while stimulation continued. The membrane potential was returned to −60 mV and the effects of the pairing observed. In this GFP-negative control neuron, the amplitude of the evoked EPSCs was increased by the pairing, indicating potentiation of synaptic transmission. (B) The same pairing protocol was applied to a GFP-positive NR1 knockout neuron, but in this case pairing did not result in an increased EPSC amplitude. (C) The degree of pairing-induced synaptic potentiation was quantified as the ratio of EPSC amplitude after pairing compared to that observed before pairing. GFP-positive NR1 KO neurons were significantly deficient in pairing-induced synaptic potentiation compared to GFP-negative control neurons (n = 11 of each type, GFP-positive and GFP-negative).
EPSCs were evoked by 1 Hz extracellular stimulation in layer 4. The baseline EPSC was assessed by averaging 200 responses recorded at −60 mV. For the next 100 stimuli, the soma was voltage-clamped to 0 mV, while stimulation of EPSCs continued at 1 Hz. To assess the effect of this pairing protocol, the membrane potential was returned to −60 mV for a further 700 stimuli. The ratio of the post-pairing EPSC amplitude to the baseline EPSC amplitude was determined for each neuron (Figure 8 C). Although the effects of pairing were highly variable, the GFP-positive cells exhibited significantly less synaptic potentiation than the GFP-negative cells (ratio pairing∕baseline for GFP-positive neurons was 0.86 ± 0.05, mean ± SEM, n = 11; ratio pairing∕baseline for GFP-negative neurons was 1.62 ± 0.18, n = 11; Studentquotidns two-tailed t-test assuming unequal variance p = 0.002). These data are consistent with the GFP-positive neurons lacking NMDARs and therefore being unable to induce NMDAR-dependent forms of potentiation. Indeed, in some experiments it appeared that the protocol in GFP-positive cells induced a depression rather than a potentiation. Although this may in part be attributed to EPSC run-down, it may also relate to the observation that synaptic depression does not depend upon functional postsynaptic NMDARs (Bender et al., 2006 ; Feldman, 2000 ) and might therefore be induced by our pairing protocol.
Discussion
Local and specific NMDAR KO
Lentivector transduction as measured by GFP expressing cells was tightly localized to the injection site. This is likely to result in part from limited diffusion of the lentivector particles in the extracellular space. We did not find evidence for any significant transduction of neurons with cell bodies remote from the injection site. This would suggest that axons do not contribute to the effects of these lentivector injections. If the lentivector entered axons and was retrogradely transported to distant cell bodies, then GFP labeling of neurons projecting to the somatosensory cortex might be expected, but this was not observed. The local infection provides the key element of spatial specificity in our study and is in good agreement with previous reports (Aronoff and Petersen, 2006 ; Dittgen et al., 2004 ; Komai et al., 2006 ). Weak retrograde labeling can however be conferred to lentivectors by exchanging the VSV-G glycoprotein with one from rabies virus (Wickersham et al., 2007a ).
Targeted lentiviral injections in this study were achieved through intrinsic optical imaging to obtain functional maps of the location of the cortical representation of a specific whisker within the barrel cortex. This approach is also likely to be useful for targeting injections to other parts of primary somatosensory cortex, visual cortex, auditory cortex, and the olfactory bulb. For other brain regions, one may inject based on stereotaxic coordinates or following electrophysiological mapping. In all cases, it is crucial to examine each injection site to record the number and location of transduced cells.
The level of GFP expression varied markedly between different cells, but neurons in the core of injection sites were always relatively strongly labeled. This could result from multiple integration events in these neurons, increasing the transduced gene copy number and thus generating larger amounts of GFP. Another factor is the integration site of the lentivector sequences into the chromosomal DNA, since it is likely that the flanking regions of DNA can either enhance or reduce transduced gene expression. Despite the large differences in GFP expression within individual neurons of an injection site (generally higher in the center than at the periphery), we found robust Cre activity in almost every GFP-positive cell, as assayed in the Rosa26R reporter mouse. Even in cells with very weak GFP expression, there was sufficient Cre activity to allow LacZ expression. GFP-positive cells without visible LacZ antibody reactivity were only very rarely observed. That almost every GFP-positive cell expressed Cre recombinase is also in good agreement with the whole-cell recordings in the fNR1 mice of GFP-positive neurons, which all showed deficits in NMDAR-dependent currents and potentiation.
There were significant numbers of LacZ-positive cells with undetectable GFP signal. These could partially be due to insufficient sensitivity when acquiring GFP images. Alternatively, either the high error rates of reverse transcriptases, which lack proof-reading functions, or the generally low replicative fidelity of such lentivectors produced by transient transfection (Laakso and Sutton, 2006 ) could mutate the GFP sequence for loss of function while leaving Cre expression undisturbed, or vice versa. Since the Cre coding region is longer than that of GFP (1.1 vs. 0.7 Kb, respectively), this does not explain why more LacZ-positive cells are quantified by this method. Perhaps some LacZ-positive inclusion bodies led to spurious cellular assignments, after filtering confocal stacks for the spot detection with Imaris. A nuclear localized LacZ could allow easier quantification of colocalization with GFP, particularly because of the complex cell morphologies of neurons, as previously described (e.g., Weber et al., 2001 ). Alternatively, the rare single positive cells could be due to another mutagenic or contextual effect of lentivector sequence integration. For instance, certain chromosomal domains could, hypothetically, be transcriptionally repressive for specific αCaMKII-based promoter expression, but “leaky” transcription or cryptic splicing could allow non-specific generation of cre mRNAs, and then IRES-based translation would mediate expression of Cre.
Our results contrast with the apparent need for high cre mRNA levels in order to generate sufficient Cre activity in earlier transgenic studies (Tsien et al., 1996a ; Tsien et al., 1996b ). Indeed, (Tsien et al., 1996a ; Tsien et al., 1996b ) found cre mRNA across the entire forebrain, with higher levels of cre mRNA in the CA1 region in their mouse line. Despite this widespread distribution of cre mRNA, however, the Cre activity was specifically limited to the CA1 region. We found no evidence for such a threshold in Cre expression levels, and we suggest that the improved Cre (Shimshek et al., 2002 ), incorporating mammalian codon preferences in the gene sequence, is indeed more efficiently translated, so even low levels of cre mRNA are sufficient for recombinase activity.
Although the majority of cells expressing GFP from the lentivector were pyramidal neurons, we also noted that glia and GABAergic neurons were also occasionally fluorescent. This suggests that although much specificity is indeed conferred by the 1.3 kb fragment of the αCaMKII promoter (Dittgen et al., 2004 ), it is not sufficient to be absolutely confident about the transduced cell type. The lentivector-mediated expression of GFP in cells that do not normally express αCaMKII is most likely a result of the chance integration of the lentivector into active regions of the chromosomes, where contextual effects of long-range promoter∕enhancer activity drive the transduced gene expression independent of regulatory effects of the αCaMKII promoter.
Alternative approaches for generating local genetic changes in the brain
The Cre–LoxP system is an immensely powerful tool, especially in terms of its specificity conferred by the directed insertion of LoxP elements into endogenous genes. However, while more floxed alleles of genes expressed in the brain continue to be developed, including NR1, BDNF (Rios et al., 2001 ), the Adenosine A1 receptor (Scammell et al., 2003 ), Presenilin-1 (Yu et al., 2001 ), neuropilin-2 (Walz et al., 2002 ), and the fibroblast growth factor receptor 1 (Xu et al., 2002 ; Zhao et al., 2007 ), generating gene-targeted mice is time consuming. The approach that we present here, although in principle of general applicability, is therefore in practice limited to genes for which floxed mice have been or will be specifically generated.
A more general and more easily applicable approach would be to use RNA interference (RNAi, Mello and Conte, 2004 ) to knockdown expression of target genes. Originally described in C. elegans, RNAi is most likely a cellular response against viral or transposase activities, although it is apparently also involved in such diverse roles as chromatin structure and translational regulation. Short (21 nucleotide) double-stranded RNA molecules catalyze down-regulation of complementary mRNA targets, and small hairpin RNAs (shRNAs) encoding these are a useful tool for expressing such molecules in neuronal cells. Generally, shRNA expression is driven by a promoter that normally transcribes small RNAs in the cell, which can be inserted into the vector of choice, for instance a lentivector (Abbas-Terki et al., 2002 ; Szulc et al., 2006 ). To test such vectors in mouse cortex, four different shRNA lentivectors targeted to the NR1 gene were generated during the course of this study, driven by the PolIII H1 promoter, a component of RNaseP. Preliminary data in primary cultured neurons showed three of these resulted in partial knockdown of NR1 protein expression assayed by western blotting. Such RNAi-based methods to knockdown expression levels of selected genes may be of great importance in future efforts, including in gene therapies. It will be of great interest to directly compare RNAi knockdown with Cre–LoxP KO in terms of selectivity and the induced functional changes.
Future perspectives
The approach demonstrated here for localized cortical KO of NMDARs in a specific cell type of a specific cortical layer and a specific cortical column is the first essential step to analyzing the role of NMDARs in pyramidal neurons of layer 2∕3 mouse barrel cortex during sensory processing and learning. In future studies, whole-cell recordings should be targeted to lentivector-transduced GFP-Cre-positive neurons in vivo through two-photon microscopy (Dittgen et al., 2004 ; Komai et al., 2006 ) to study how KO cells compare to neighboring control cells. Furthermore, behavioral studies based on single whisker sensory perception (such as gap crossing, Harris et al., 1999 ; Hutson and Masterton, 1986 ) could be used to delineate the role of NMDARs in layer 2∕3 pyramidal neurons during learning of this behavioral task.
In addition to extending the analysis of the phenotype associated with local NMDAR KO, it will be of great interest to gain further control of the genetic manipulation itself. In the current technique, the onset of KO is related to the day of lentivector injection, with the first recombination by the ßGal assay observed as early as 2 days post-injection (not shown). In order to avoid confounding issues relating to surgery and injection, it would be of great interest to introduce a regulatory element controlling the recombinase activity. One promising tool seems to be the fusion of Cre recombinase to a modified ligand-binding domain of the estrogen receptor, CreERT2 (Feil et al., 1997 ; Mori et al., 2006 ). This fusion protein is restricted to the cytoplasm, but upon binding to a synthetic estrogen, tamoxifen, it translocates to the nucleus to mediate recombination at loxP sites. The system shows great promise (for instance, Hawasli et al., 2007 , using a previous version, CreERT), but remains to be tested in neurons in a focal manner. Of equal importance, it will be interesting to target different subtypes of pyramidal neurons, GABAergic interneurons, and glia. Further exploration of promoters and other regulatory systems will aid development of further cell type-specific expression strategies. Other possibilities would be to alter the viral coat proteins in order to target specific cell types (Wong et al., 2004 ), to induce retrograde labeling of neurons projecting to specific brain areas (Wickersham et al., 2007a ), and to infect entire networks of neurons through transynaptic viral methods (Wickersham et al., 2007b ). Viral vector delivery of regulated Cre in combination with mice engineered with floxed genes therefore appears to offer useful opportunities for highly directed cell type-specific genetic manipulation of the mouse genome in a spatially and temporally controlled manner.
Conflict of Interest Statement
The authors declare that the research was conducted in the absence of any commercial or financial relationships that could be construed as a potential conflict of interest.
Acknowledgements
We thank Z. Cui and J. Tsien for fNR1 mice, T. Iwasato for the in situ cDNA probe and primer advice, M. Lang for neo PCR primer sequences, P. Osten for the αCaMKII lentivector expressing GFP and Cre, and the members past and present of the Laboratory of Sensory Processing (LSENS), and the Laboratory for the study of Neurodegeneration (LEN), in particular, K. Stanco for the help with vectors and in situ assays. We are grateful to P. Aebischer and R. Zufferey for advice and support. This work was supported by a grant from the Swiss National Science Foundation and the Leenaards Foundation.
References
Abbas-Terki, T., Blanco-Bose, W., Deglon, N., Pralong, W., and Aebischer, P. (2002). Lentiviral-mediated RNA interference. Hum. Gene. Ther. 13, 2197–2201.
Ackman, J. B., Siddiqi, F., Walikonis, R. S., and LoTurco, J. J. (2006). Fusion of microglia with pyramidal neurons after retroviral infection. J. Neurosci. 26, 11413–11422.
Aronoff, R., and Petersen, C. C. H. (2006). Controlled and localized genetic manipulation in the brain. J. Cell. Mol. Med. 10, 333–352.
Bender, V. A., Bender, K. J., Brasier, D. J., and Feldman, D. E. (2006). Two coincidence detectors for spike timing-dependent plasticity in somatosensory cortex. J. Neurosci. 26, 4166–4177.
Berger, T., Borgdorff, A. J., Crochet, S., Neubauer, F. B., Lefort, S., Fauvet, B., Ferezou, I., Carleton, A., Luscher, H. R., and Petersen, C. C. H. (2007). Combined voltage and calcium epifluorescence imaging in vitro and in vivo reveals subthreshold and suprathreshold dynamics of mouse barrel cortex. J. Neurophysiol. 97, 3751–3762.
Bliss, T. V., and Collingridge, G. L. (1993). A synaptic model of memory: long-term potentiation in the hippocampus. Nature 361, 31–39.
Borgdorff, A. J., Poulet, J. F. A., and Petersen, C. C. H. (2007). Facilitating sensory responses in developing mouse somatosensory barrel cortex. J. Neurophysiol. 97, 2992–3003.
Crochet, S., and Petersen, C. C. H. (2006). Correlating whisker behavior with membrane potential in barrel cortex of awake mice. Nat. Neurosci. 9, 608–610.
Cull-Candy, S. G., and Leszkiewicz, D. N. (2004). Role of distinct NMDA receptor subtypes at central synapses. Sci. STKE 255, re16.
Deglon, N., Tseng, J. L., Bensadoun, J. C., Zurn, A. D., Arsenijevic, Y., Pereira de Almeida, L., Zufferey, R., Trono, D., and Aebischer, P. (2000). Self-inactivating lentiviral vectors with enhanced transgene expression as potential gene transfer system in Parkinsonquotidns disease. Hum. Gene. Ther. 11, 179–190.
Dittgen, T., Nimmerjahn, A., Komai, S., Licznerski, P., Waters, J., Margrie, T. W., Helmchen, F., Denk, W., Brecht, M., and Osten, P. (2004). Lentivirus-based genetic manipulations of cortical neurons and their optical and electrophysiological monitoring in vivo. Proc. Natl. Acad. Sci. USA 101, 18206–18211.
Feil, R., Wagner, J., Metzger, D., and Chambon, P. (1997). Regulation of Cre recombinase activity by mutated estrogen receptor ligand-binding domains. Biochem. Biophys. Res. Commun. 237, 752–757.
Feldman, D. E. (2000). Timing-based LTP and LTD at vertical inputs to layer II∕III pyramidal cells in rat barrel cortex. Neuron 27, 45–56.
Feldman, D. E., and Brecht, M. (2005). Map plasticity in the somatosensory cortex. Science 310, 810–815.
Ferezou, I., Bolea, S., and Petersen, C. C. H. (2006). Visualizing the cortical representation of whisker touch: voltage-sensitive dye imaging in freely moving mice. Neuron 50, 617–629.
Ferezou, I., Haiss, F., Gentet, L. J., Aronoff, R., Weber, B., and Petersen, C. C. H. (2007). Spatiotemporal dynamics of cortical sensorimotor integration in behaving mice. Neuron 56, 907–923.
Gong, S., Zheng, C., Doughty, M. L., Losos, K., Didkovsky, N., Schambra, U. B., Nowak, N. J., Joyner, A., Leblanc, G., Hatten, M. E., and Heintz, N. (2003). A gene expression atlas of the central nervous system based on bacterial artificial chromosomes. Nature 425, 917–925.
Grinvald, A., Lieke, E., Frostig, R. D., Gilbert, C. D., and Wiesel, T. N. (1986). Functional architecture of cortex revealed by optical imaging of intrinsic signals. Nature 324, 361–364.
Harris, J. A., Petersen, R. S., and Diamond, M. E. (1999). Distribution of tactile learning and its neural basis. Proc. Natl. Acad. Sci. USA 96, 7587–7591.
Hawasli, A. H., Benavides, D. R., Nguyen, C., Kansy, J. W., Hayashi, K., Chambon, P., Greengard, P., Powell, C. M., Cooper, D. C., and Bibb, J. A. (2007). Cyclin-dependent kinase 5 governs learning and synaptic plasticity via control of NMDAR degradation. Nat. Neurosci. 10, 880–886.
Hoess, R. H., Ziese, M., and Sternberg, N. (1982). P1 site-specific recombination: nucleotide sequence of the recombining sites. Proc. Natl. Acad. Sci. USA 79, 3398–3402.
Hutson, K. A., and Masterton, R. B. (1986). The sensory contribution of a single vibrissaquotidns cortical barrel. J. Neurophysiol. 56, 1196–1223.
Iwasato, T., Datwani, A., Wolf, A. M., Nishiyama, H., Taguchi, Y., Tonegawa, S., Knopfel, T., Erzurumlu, R. S., and Itohara, S. (2000). Cortex-restricted disruption of NMDAR1 impairs neuronal patterns in the barrel cortex. Nature 406, 726–731.
Iwasato, T., Erzurumlu, R. S., Huerta, P. T., Chen, D. F., Sasaoka, T., Ulupinar, E., and Tonegawa, S. (1997). NMDA receptor-dependent refinement of somatotopic maps. Neuron 19, 1201–1210.
Kleinfeld, D., Ahissar, E., and Diamond, M. E. (2006). Active sensation: insights from the rodent vibrissa sensorimotor system. Curr. Opin. Neurobiol. 16, 435–444.
Köhr, G. (2006). NMDA receptor function: subunit composition versus spatial distribution. Cell Tissue Res. 326, 439–446.
Komai, S., Licznerski, P., Cetin, A., Waters, J., Denk, W., Brecht, M., and Osten, P. (2006). Postsynaptic excitability is necessary for strengthening of cortical sensory responses during experience-dependent development. Nat. Neurosci. 9, 1125–1133.
Kvajo, M., Albrecht, H., Meins, M., Hengst, U., Troncoso, E., Lefort, S., Kiss, J. Z., Petersen, C. C. H., and Monard, D. (2004). Regulation of brain proteolytic activity is necessary for the in vivo function of NMDA receptors. J. Neurosci. 24, 9734–9743.
Laakso, M. M., and Sutton, R. E. (2006). Replicative fidelity of lentiviral vectors produced by transient transfection. Virology 348, 406–417.
Lein, E. S., Hawrylycz, M. J., Ao, N., Ayres, M., and Bensinger, A. (2007). Genome- wide atlas of gene expression in the adult mouse brain. Nature 445, 168–176.
Liu, X.-B., and Jones, E. G. (1996). Localization of alpha type II calcium calmodulin-dependent protein kinase at glutamatergic but not gama-aminobutyric acid (GABAergic) synapses in thalamus and cerebral cortex. Proc. Natl. Acad. Sci. USA 93, 7332–7336.
Mori, T., Tanaka, K., Buffo, A., Wurst, W., Kühn, R., Götz, M. (2006). Inducible gene deletion in astroglia and radial glia-a valuable tool for functional and lineage analysis. Glia 54, 21–34.
Naldini, L., Blomer, U., Gallay, P., Ory, D., Mulligan, R., Gage, F. H., Verma, I. M., and Trono, D. (1996). In vivo gene delivery and stable transduction of nondividing cells by a lentiviral vector. Science 272, 263–267.
Petersen, C. C. H. (2003). The barrel cortex—integrating molecular, cellular and systems physiology. Pflugers Arch. 447, 126–134.
Petersen, C. C. H., and Sakmann, B. (2000). The excitatory neuronal network of rat layer 4 barrel cortex. J. Neurosci. 20, 7579–7586.
Petersen, C. C. H., Malenka, R. C., Nicoll, R. A., and Hopfield, J. J. (1998). All-or-none potentiation at CA3-CA1 synapses. Proc. Natl. Acad. Sci. USA 95, 4732–4737.
Polley, D. B., Chen-Bee, C. H., and Frostig, R. D. (1999). Two directions of plasticity in the sensory-deprived adult cortex. Neuron 24, 623–637.
Rajji, T., Chapman, D., Eichenbaum, H., and Greene, R. (2006). The role of CA3 hippocampal NMDA receptors in paired associate learning. J. Neurosci. 26, 908–915.
Rios, M., Fan, G., Fekete, C., Kelly, J., Bates, B., Kuehn, R., Lechan, R. M., and Jaenisch, R. (2001). Conditional deletion of brain-derived neurotrophic factor in the postnatal brain leads to obesity and hyperactivity. Mol. Endocrinol. 15, 1748–1757.
Sauer, B., and Henderson, N. (1988). Site-specific DNA recombination in mammalian cells by the Cre recombinase of bacteriophage P1. Proc. Natl. Acad. Sci. USA 85, 5166–5170.
Scammell, T. E., Arrigoni, E., Thompson, M. A., Ronan, P. J., Saper, C. B., and Green, R. W. (2003). Focal deletion of the adenosine A1 receptor in adult mice using an adeno-associated viral vector. J. Neurosci. 23, 5762–5770.
Shimshek, D. R., Kim, J., Hubner, M. R., Spergel, D. J., Buchholz, F., Casanova, E., Stewart, A. F., Seeburg, P. H., and Sprengel, R. (2002). Codon-improved Cre recombinase (iCre) expression in the mouse. Genesis 32, 19–26.
Soriano, P. (1999). Generalized lacZ expression with the ROSA26 Cre reporter strain. Nat. Genet. 21, 70–71.
Sur, M., and Leamey, C. A. (2001). Development and plasticity of cortical areas and networks. Nat. Rev. Neurosci. 2, 251–262.
Szulc, J., Wiznerowicz, M., Sauvain, M. O., Trono, D., and Aebischer, P. (2006). A versatile tool for conditional gene expression and knockdown. Nat. Methods 3, 109–116.
Tashiro, A., Sandler, V. M., Toni, N., Zhao, C., and Gage, F. H. (2006). NMDA-receptor-mediated, cell-specific integration of new neurons in adult dentate gyrus. Nature 442, 929–933.
Tsien, J. Z., Chen, D. F., Gerber, D., Tom, C., Mercer, E. H., Anderson, D. J., Mayford, M., Kandel, E. R., and Tonegawa, S. (1996a). Subregion- and cell type-restricted gene knockout in mouse brain. Cell 87, 1317–1326.
Tsien, J. Z., Huerta, P. T., and Tonegawa, S. (1996b). The essential role of hippocampal CA1 NMDA receptor-dependent synaptic plasticity in spatial memory. Cell 87, 1327–1338.
Walz, A., Rodriguez, I., and Mombaerts, P. (2002). Aberrant sensory innervation of the olfactory bulb in neuropilin-2 mutant mice. J. Neurosci. 22, 4025–4035.
Weber, P., Metzger, D., and Chambon, P. (2001). Temporally controlled targeted somatic mutagenesis in the mouse brain. Eur. J. Neurosci. 14, 1777–1783.
Wickersham, I. R., Finke, S., Conzelmann, K. K., and Callaway, E. M. (2007a). Retrograde neuronal tracing with a deletion-mutant rabies virus. Nat. Methods 4, 47–49.
Wickersham, I. R., Lyon, D. C., Barnard, R. J., Mori, T., Finke, S., Conzelmann, K. K., Young, J. A., and Callaway, E. M. (2007b). Monosynaptic restriction of transsynaptic tracing from single, genetically targeted neurons. Neuron 53, 639–647.
Wong, L. F., Azzouz, M., Walmsley, L. E., Askham, Z., Wilkes, F. J., Mitrophanous, K. A., Kingsman, S. M., and Mazarakis, N. D. (2004). Transduction patterns of pseudotyped lentiviral vectors in the nervous system. Mol. Ther. 9, 101–111.
Woolsey, T. A., and Van der Loos, H. (1970). The structural organisation of layer IV in the somatosensory region (SI) of the mouse cerebral cortex: the description of a cortical field composed of discrete cytoarchitectonic units. Brain Res. 17, 205–242.
Xu, X., Qiao, W., Li, C., and Deng, C. X. (2002). Generation of Fgfr1 conditional knockout mice. Genesis 32, 85–86.
Yu, H., Saura, C. A., Choi, S. Y., Sun, L. D., Yang, X., Handler, M., Kawarabayashi, T., Younkin, L., Fedeles, B., Wilson, M. A., Younkin, S., Kandel, E. R., Kirkwood, A., and Shen, J. (2001). APP processing and synaptic plasticity in presenilin-1 conditional knockout mice. Neuron 31, 713–726.
Zhao, M., Li, D., Shimazu, K., Zhou, Y. X., Lu, B., and Deng, C. X. (2007). Fibroblast growth factor receptor-1 is required for long-term-potentiation, memory consolidation and neurogenesis. Biol. Psychiat. 62, 381–390.
Keywords: lentivector, Cre–LoxP, NMDA receptors, barrel cortex
Citation: Rachel Aronoff and Carl Petersen (2007). Layer- and column-specific knockout of NMDA receptors in pyramidal neurons of the mouse barrel cortex. Front. Integr. Neurosci. 1: 1. doi: 10.3389/neuro.07/001.2007
Received: 24 July 2007;
Paper pending published: 28 September 2007;
Accepted: 29 October 2007;
Published online: 30 November 2007.
Edited by:
Sidney A. Simon, Duke University Medical Center, USAReviewed by:
Donald B. Katz, Brandeis University, USADirk Jancke, Ruhr-University Bochum, Germany
Copyright: © 2007 Aronoff and Petersen. This is an open-access article subject to an exclusive license agreement between the authors and the Frontiers Research Foundation, which permits unrestricted use, distribution, and reproduction in any medium, provided the original authors and source are credited.
*Correspondence: Carl Petersen, Laboratory of Sensory Processing, Brain Mind Institute, SV-BMI-LSENS, Station 15, Ecole Polytechnique Federale de Lausanne (EPFL), CH1015 Lausanne, Switzerland. e-mail: carl.petersen@epfl.ch