Department of Neuroscience, University of Minnesota, Minneapolis, MN, USA
Flexible decision-making strategies (such as planning) are a key component of adaptive behavior, yet their neural mechanisms have remained resistant to experimental analysis. Theories of planning require prediction and evaluation of potential future rewards, suggesting that reward signals may covertly appear at decision points. To test this idea, we recorded ensembles of ventral striatal neurons on a spatial decision task, in which hippocampal ensembles are known to represent future possibilities at decision points. We found representations of reward which were not only activated at actual reward delivery sites, but also at a high-cost choice point and before error correction. This expectation-of-reward signal at decision points was apparent at both the single cell and the ensemble level, and vanished with behavioral automation. We conclude that ventral striatal representations of reward are more dynamic than suggested by previous reports of reward- and cue-responsive cells, and may provide the necessary signal for evaluation of internally generated possibilities considered during flexible decision-making.
Flexible decision-making strategies are thought to rely on the processing of information beyond current sensory input (Buckner and Carroll, 2007
; Hebb, 1949
; Tolman, 1932
). In particular, a process of generating and evaluating possible outcomes before they are actually experienced has been proposed to support complex behaviors such as sensitivity to reward devaluation and action-outcome contingencies in conditioning experiments (Adams and Dickinson, 1981
; Balleine and Dickinson, 1998
; Holman, 1975
), spatial (place) navigation in rats (Johnson and Redish, 2007
; O’Keefe and Nadel, 1978
; Tolman, 1948
), and problem solving in humans (Miller et al., 1960
; Newell and Simon, 1972
; Shallice, 1982
). Put simply, such theories propose that this flexible “planning” system selects a particular action because it (a) predicts the action’s outcome, and (b) judges the outcome to be desirable (Balleine, 2001
; Cardinal et al., 2002
; Niv et al., 2006
; Redish and Johnson, 2007
; Toates, 1986
). Such a system derives adaptive power from the ability to evaluate the desirability of potential outcomes and choose accordingly, in contrast to rigid stimulus-response or cache-based processing to which it is thought to give way with repeated, stable experience (Daw et al., 2005
; Poldrack and Packard, 2003
; Redish et al., 2008
).
Prediction and evaluation of potential outcomes implies the existence of neural representations spatiotemporally dissociated from current stimuli (Hebb, 1949
; Johnson et al., 2007
, 2009
). That is, representations in planning systems are intrinsically dynamic, as opposed to a determinate response to any particular external stimulus. This has made such signals hard to detect. While circumstances such as novelty or uncertainty are thought to engage the planning system (Daw et al., 2005
), the representations within it can change from trial to trial and from moment to moment. Ensemble recording and decoding techniques allow examination of such dynamics: a recent recording study in the rodent hippocampus found that as rats pause at a choice point on a spatial task, hippocampal place representations transiently sweep forward of the animal (Johnson and Redish, 2007
). Such non-local representations could provide a prediction component of flexible decision-making; however, no suitable evaluative signal has yet been identified.
A candidate location for such a signal is the ventral striatum, which receives inputs from the hippocampal formation through the subiculum (Finch, 1996
; Groenewegen et al., 1987
; Voorn et al., 2004
), enabling fast-timescale firing patterns in hippocampus to affect ventral striatal activity (Martin, 2001
; Pennartz et al., 2004
). A ÃÂ current integrative view on ventral striatal function holds it mediates the influence of motivationally relevant stimuli on behavior (Cardinal et al., 2002
; Day and Carelli, 2007
; Kelley, 2004
). In support of this idea, ventral striatal lesions impair responding to cues predictive of reward (Corbit et al., 2001
; Parkinson et al., 2002
; Schoenbaum and Setlow, 2003
). Recording studies have found a prominent population responsive to reward receipt (Apicella et al., 1991
; Carelli, 2002
); in addition, some ventral striatal cells show anticipatory ramping responses (Lavoie and Mizumori, 1994
; Miyazaki et al., 1998
) or bind to cues predictive of reward (Roitman et al., 2005
; Setlow et al., 2003
; Wheeler et al., 2008
). Such cue-elicited responses are thought to underlie the motivational impact of reward-predictive cues on behavior.
In contrast to this established role of ventral striatal representations of reward in cue-driven (stimulus-response) settings, relatively little is known about the involvement of reward representations underlying instrumental (action-outcome) behavior. While lesion evidence for ventral striatal involvement in tasks demonstrably requiring outcome-dependent processing is conflicting (Corbit et al., 2001
; de Borchgrave et al., 2002
), several studies testing a range of spatial and instrumental behaviors have implicated ventral striatum (Atallah et al., 2007
; Cardinal et al., 2001
; Floresco et al., 1997
; Setlow, 1997
; Sutherland and Rodriguez, 1989
). However, it is not clear if these deficits can be fully accounted for by reward-predictive cue responses. More generally, it is not known if and how representations of reward might contribute to flexible decision-making, when different outcomes are under active consideration. Given non-local hippocampal representations of future possibilities during decision-making (Johnson and Redish, 2007
), functional projections from hippocampus to ventral striatum, and ventral striatal involvement in reward processing, we hypothesized that ventral striatum encoded non-local representations of reward at decision points. We sought to test this idea by recording ventral striatal neural ensembles on the same Multiple-T task where hippocampal representations of future possibilities were found.
Subjects
Five male Brown Norway-Fisher 344 hybrid rats (Harlan, IA, USA), aged 10–12ÃÂ months at the start of behavioral training, were trained to run the Multiple-T task, described below. Rats were food deprived to no less than 85% of their free-feeding body weight during behavioral training; water was available ad libitum in the home cage at all times. All procedures were conducted in accordance with National Institutes of Health guidelines for animal care and approved by the IACUC at the University of Minnesota. Care was taken to minimize the number of animals used in these experiments and to minimize suffering.
Surgery
After pre-training on the task, rats were chronically implanted with an electrode array consisting of 12 tetrodes and 2 reference electrodes (“hyperdrive”, Kopf, Tujunga, CA, USA) targeting theàventral striatum (coordinates: APà+à1.2, MLà±Ã 2.3–2.5àmm relative to bregma). Surgical and histological procedures were as described previously (Johnson and Redish, 2007
; Schmitzer-Torbert and Redish, 2004
).
Multiple-T Task
As described before (Johnson and Redish, 2007
; Schmitzer-Torbert and Redish, 2004
), the Multiple-T task apparatus is a carpet-lined track elevated 15ÃÂ cm above the floor, consisting of a navigation sequence of 3–5 T-choices, and two return rails leading back to the start of the sequence (Figure 1
A). Both return rails are equipped with two feeder sites, set up to deliver two 45-mg food pellets each (Research Diets, New Brunswick, NJ, USA) through computer-controlled pellet dispensers (Med-Associates, St. Albans, VT, USA). Pellets are released when a ceiling-mounted camera and a position tracking system (Cheetah, Neuralynx, Bozeman, MT, USA, and custom software written in MATLAB, Natick, MA, USA) detected the rat crossing an active feeder trigger line (green lines in Figure 1
A); these events (“feeder fires”, time 0 in the peri-stimulus time histograms in Figures 3
, 4
, 7
, 8 and 9
) were time-stamped and recorded for later analysis. This system will deliver food pellets onto the track within a zone of about 15ÃÂ cm in length around the feeder; however, rats quickly learn to push their snout into the food delivery tube, often catching the pellets as they arrive before they fall onto the track. It was possible for a pellet to fall off the track with the rat unable to retrieve it, but such occurrences were rare. Because the pellet dispensers were mounted on the walls, away from the track, pellets take between 1 and 2ÃÂ s from release (feeder fire) to arrival on the track.
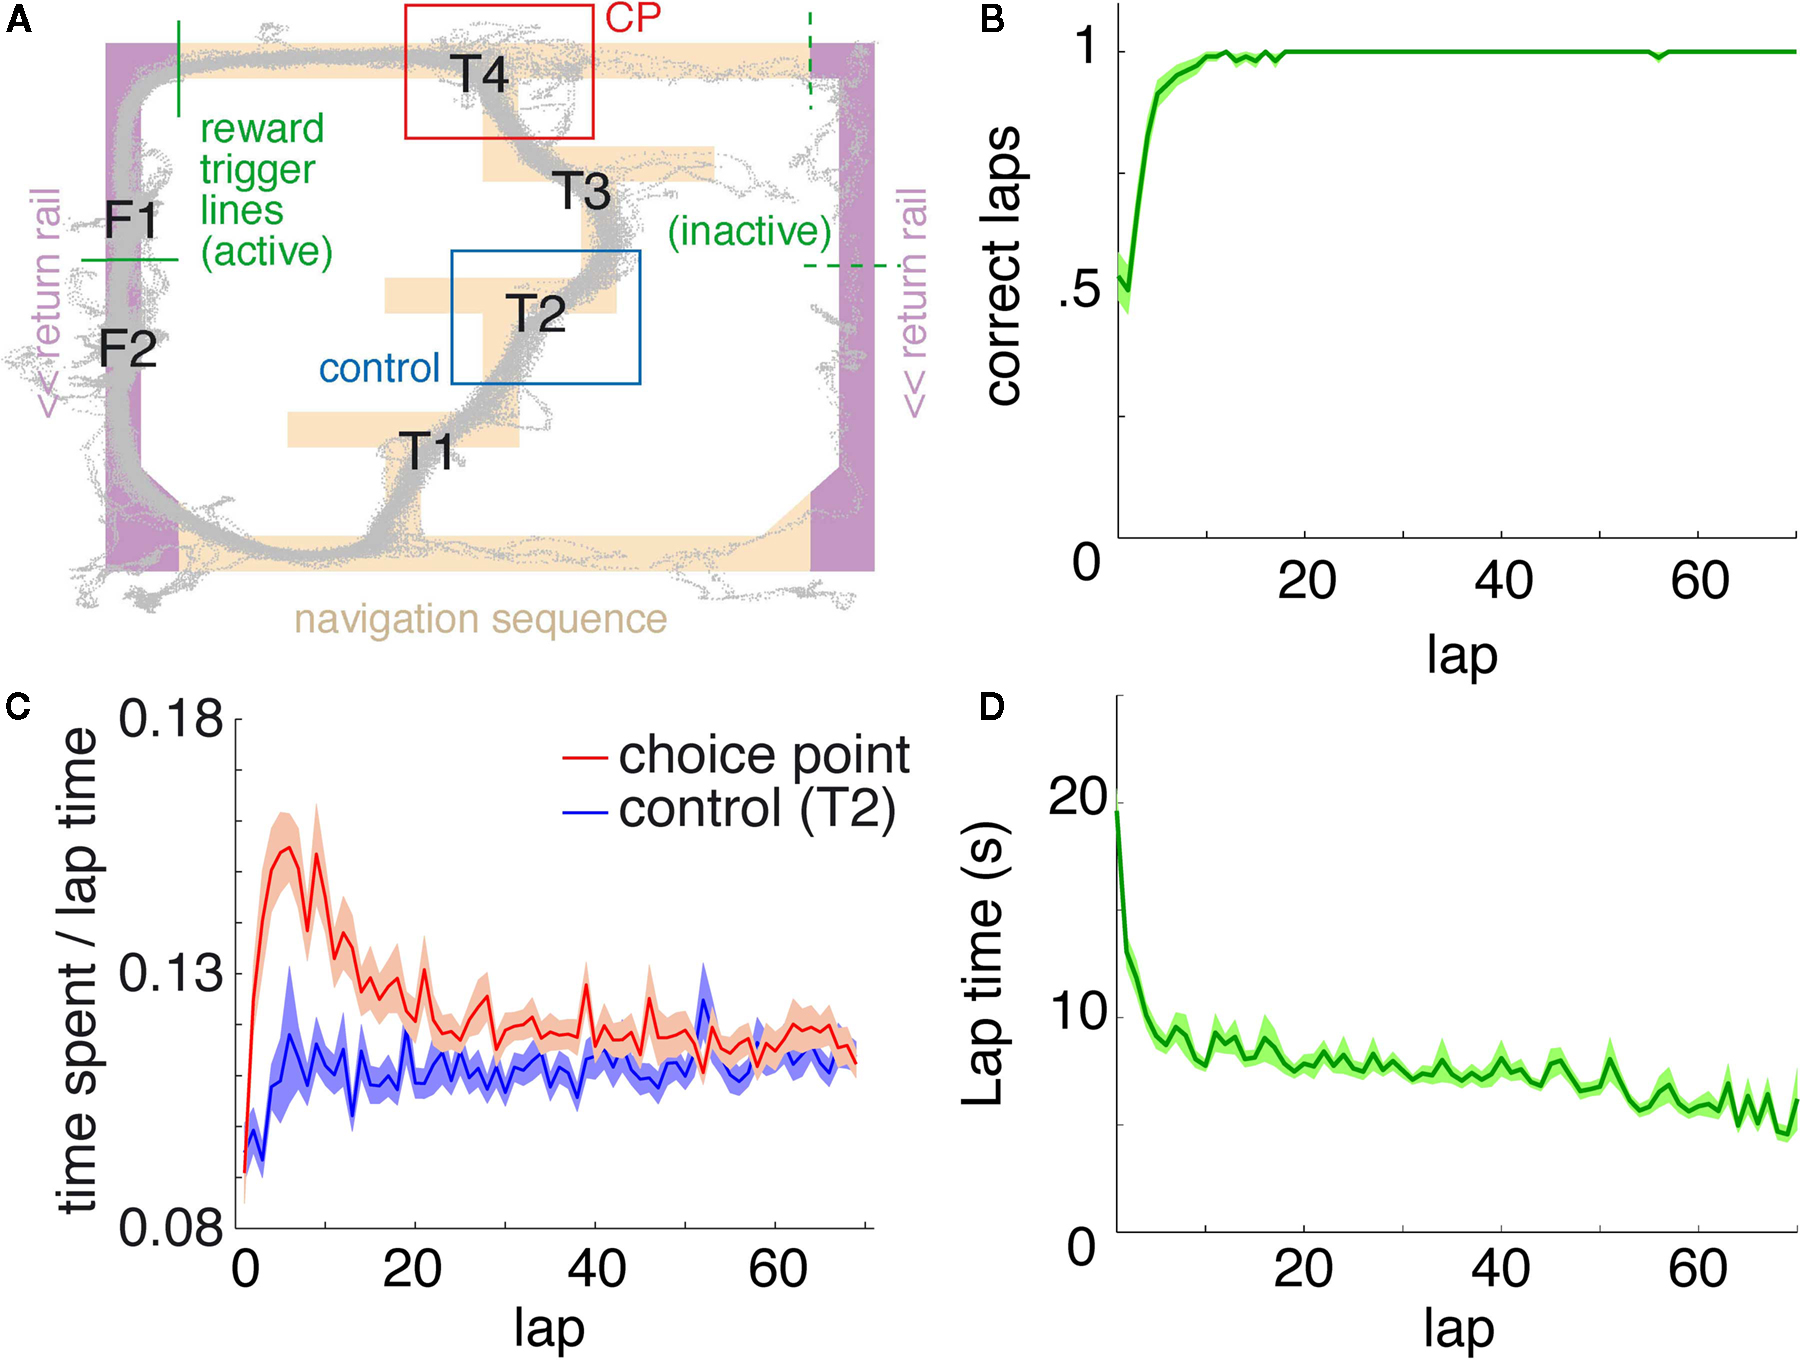
FigureÃÂ 1. Behavior on the Multiple-T maze. (A) Diagram of a single Multiple-T configuration (“RRLL”). T1–4 indicate turns, with T4 the final choiceÃÂ point (CP). Food reward is delivered at the feeder sites (F1, F2) when theÃÂ rat crosses the active feeder trigger lines (in green). Tracking data for theÃÂ entire session (grey dots) shows one error lap to the unrewarded (right)ÃÂ side,ÃÂ asÃÂ wellÃÂ asÃÂ smaller deviations at turn 3 (T3), the final CP, and the return rails.ÃÂ (B)ÃÂ Fraction of correct laps within a session, averaged over all sessions andÃÂ rats.ÃÂ A correct lap was defined as crossing the first trigger line on the rewarded side [greenÃÂ line in panel (A)]; an error lap was defined as entering theÃÂ equivalent region on the unrewarded side. (C) Time spent at the CP [redÃÂ line,ÃÂ red box inÃÂ panel (A)] normalized by lap time is increased during early,ÃÂ but not late laps,ÃÂ asÃÂ compared to a control area [blue line, blue box in (A)].ÃÂ Lap times (D)ÃÂ areÃÂ computed as the time taken from entering the navigationÃÂ sequence [lightÃÂ orange section in panel (A)] at the bottom of theÃÂ maze to exiting it at theÃÂ top. Shaded areas are S.E.M. over recording sessions.
In any given session, only one set of feeders (either on the left or the right return rail) is active, such that a rat navigating the maze is required to learn which is the active (rewarded) side for that session in order to obtain reward. The number and arrangement of T-choices in the navigation sequence could be varied between sessions. For training prior to surgery, rats were first allowed to run on 3-T mazes, with the incorrect final choice blocked, and the turn sequence changed every day, until they ran at least 50 laps for 2 consecutive days. Daily sessions lasted 40ÃÂ min. Next, the blocks were removed and 3-T training continued until the 2-day 50 laps criterion was reached again, and again using 5-T mazes. Once rats met the 2-day 50 laps criterion on 5-T, they were ready for surgery. Training took between 2 and 3ÃÂ weeks for all rats.
After surgery, rats were allowed to recover for 2–3ÃÂ days on a free feeding schedule to return to a stable weight, before being returned to 3-T training. Once rats were back to running proficiently and accustomed to running with the recording headstage and cable, the main experimental protocol commenced (typically starting 10–20ÃÂ days after surgery). Rats were run on 4-T mazes in a sequence of seven novel/seven unchanged/seven novel configurations, for a total of 21 sessions per rat. Novel sequences consisted of session-unique sequences of which choices were correct for that session, e.g. “RRLL” in Figure 1
A, “LLLR,” “RLRL,” et cetera, such that 14 out of 16 possible configurations were used. For the seven familiar days, the (initially) novel configururation from the seventh novel day was repeated. Analyses did not distinguish between novel and familiar sessions.
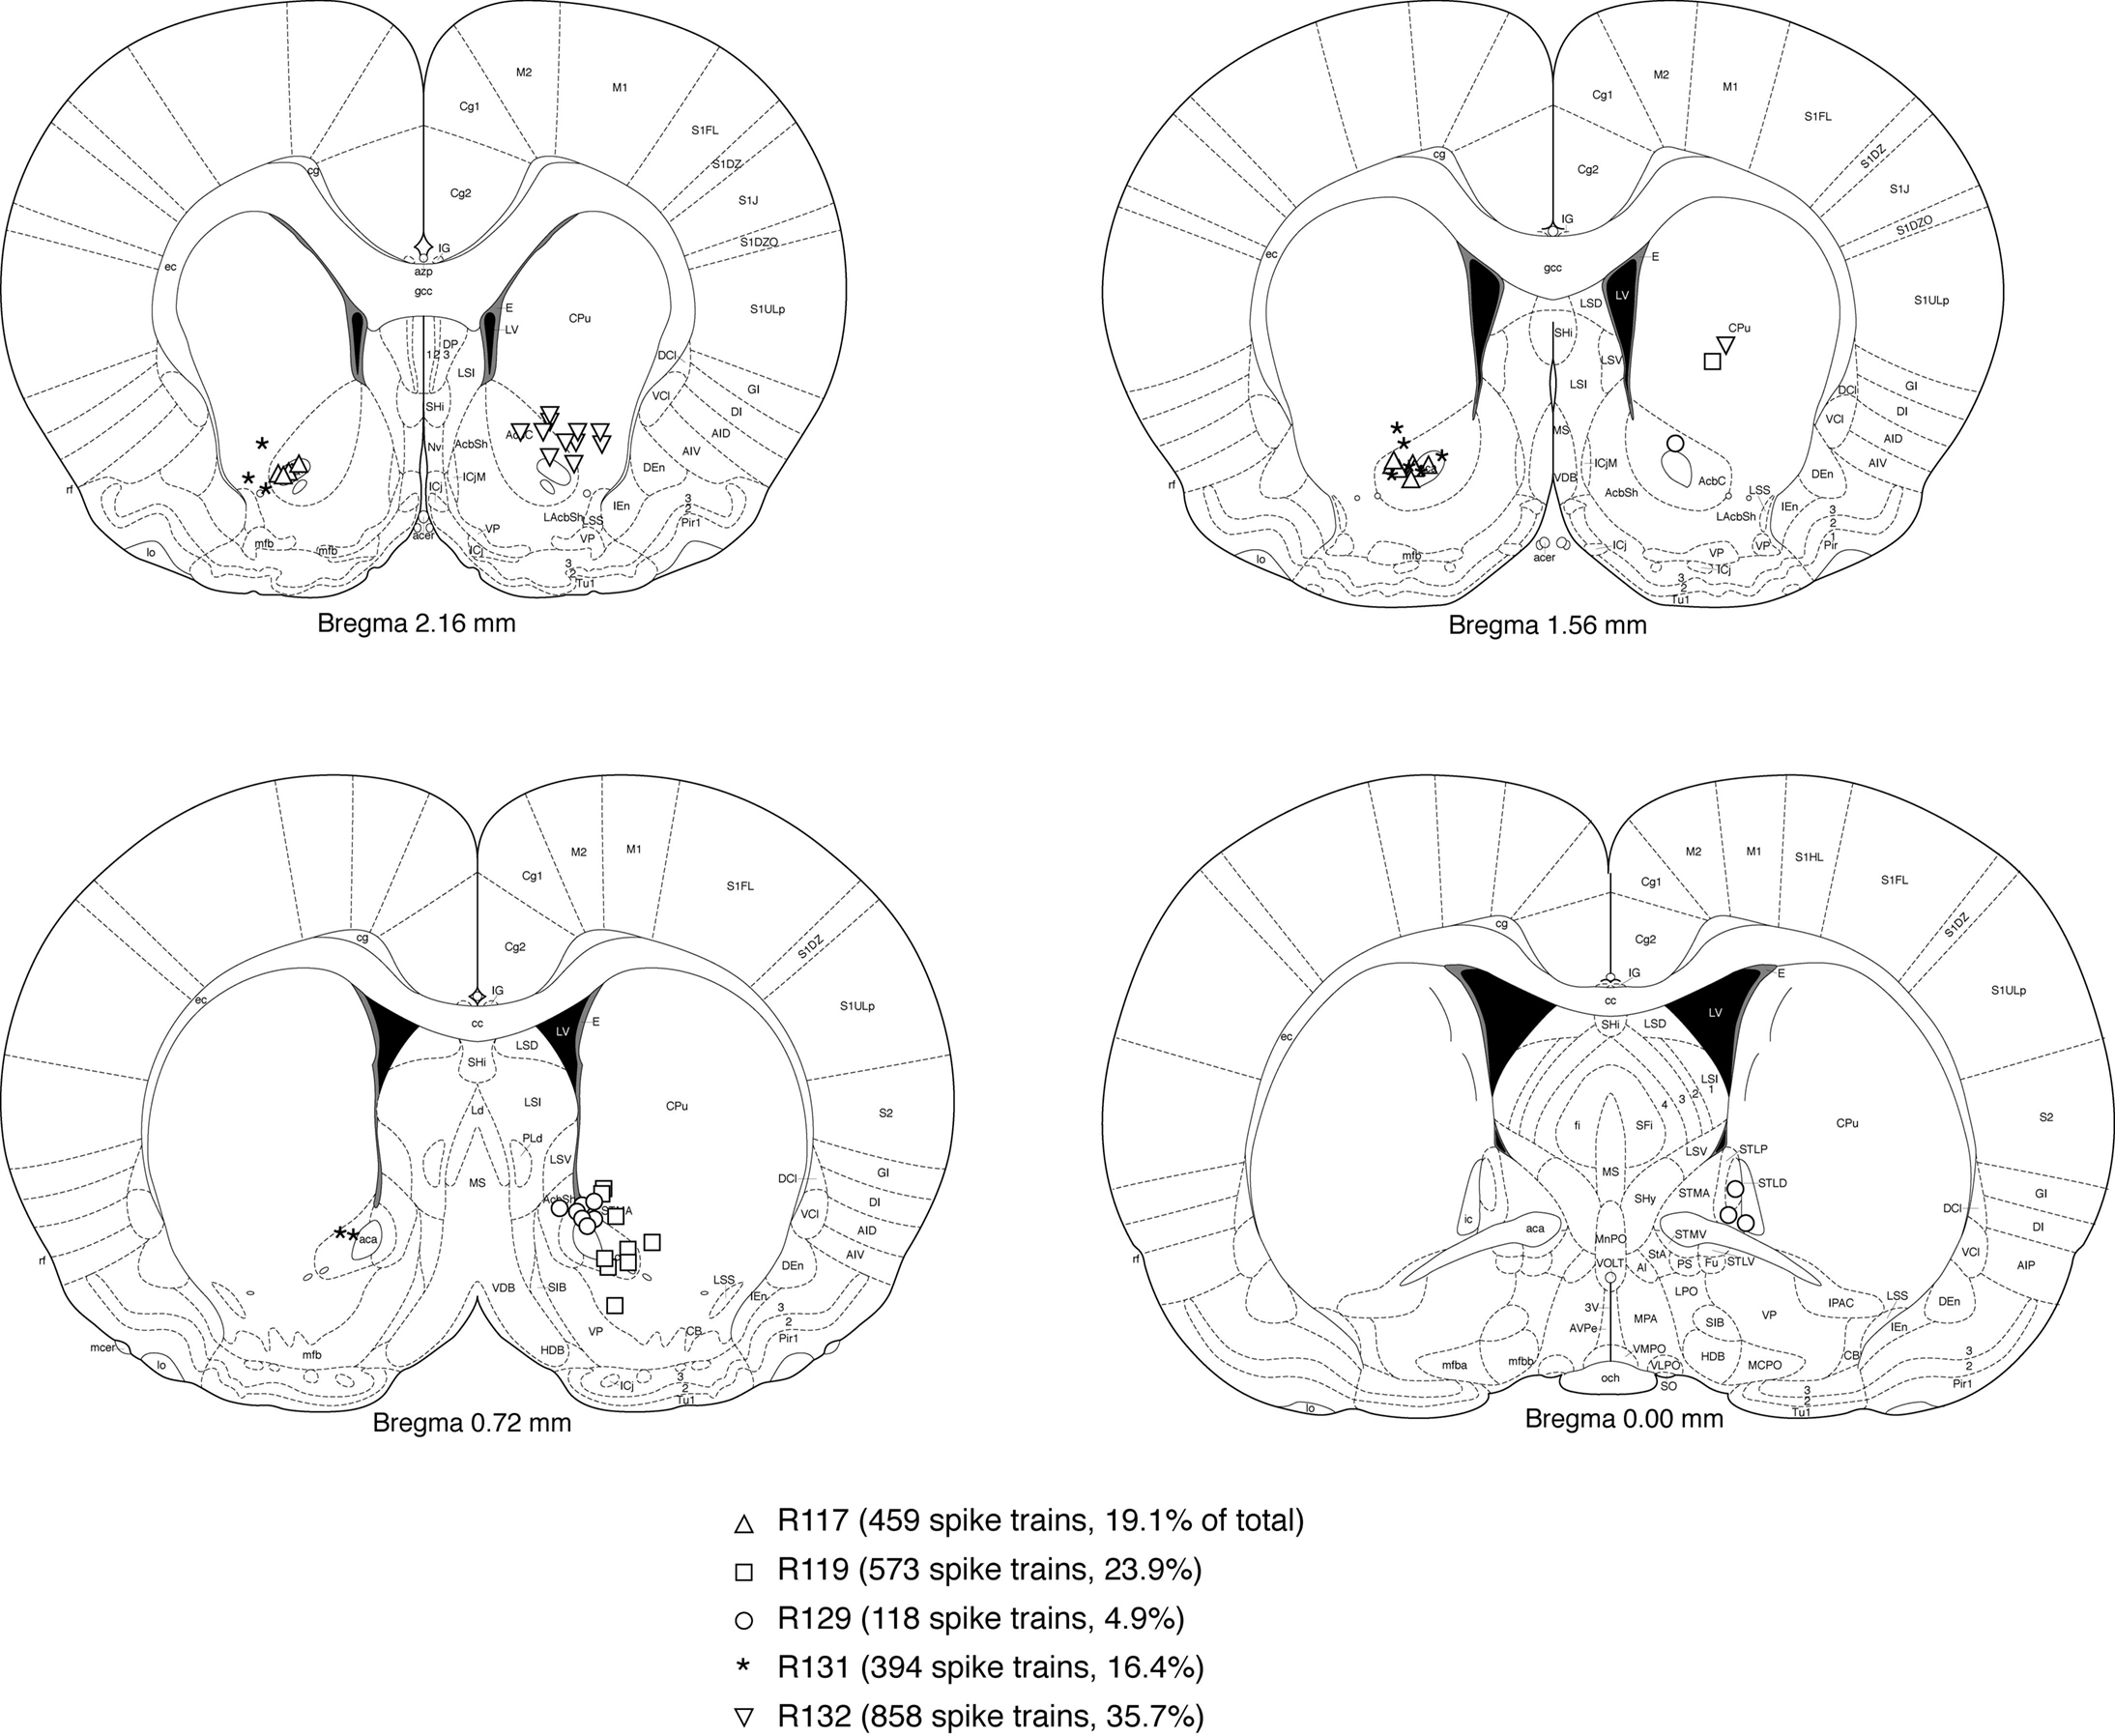
FigureÃÂ 2. Electrode locations were mostly confirmed to be in ventral striatum (nucleus accumbens core, shell, and ventral caudate-putamen). Shown are final tetrode locations as identified by current-induced gliosis marks. As animals had a very uniform distribution of number of cells recorded from each tetrode, cells recorded from any one single tetrode would be expected to be a negligible influence on the results. While some tetrode locations from animal 129 were caudal and medial to the target, this animal only contributed a relatively small proportion of cells to the data set. Based on these considerations, we estimate that at least 90% of spike trains were recorded from ventral striatum.
Data Collection
Following surgery, tetrodes were first rapidly advanced 2àmm in 2àdays, followed by a slower regime of <320àõm per day. Unit and local field activity was monitored for changes from cortex to corpus callosum to dorsal striatum (Schmitzer-Torbert and Redish, 2008
) as an early depth calibration, and subsequently for the appearance of strong, transient 50ÃÂ Hz oscillations (Masimore et al., 2005
). For our implant coordinates these appeared reliably at a depth of around 4–5àmm from the cortical surface; after reaching an estimated depth of 5.5–6àmm, tetrodes were only advanced in small amounts (<40àõm per day) with the aim of assembling the largest possible ensemble.
Neural activity was recorded using a 64 channel Cheetah recording system (Neuralynx, Bozeman, MT, USA) as described previously (Johnson et al., 2007
; Schmitzer-Torbert and Redish, 2004
, 2008
). For the majority of the recording sessions, a positive voltage threshold was used and 1ÃÂ ms (32 samples) spike waveforms were recorded. For some sessions, the filtered electrical potentials were written continuously to disk, and spikes were identified in these recordings offline using both positive and negative voltage thresholds to trigger spikes and generate waveforms for cluster cutting.
Spikes were clustered off-line into putative cells on the basis of their waveform properties using MClust 3.4 (A.D. Redish, current software available at http://umn.edu/∼redish/mclust
), with automatic pre-clustering using KlustaKwik 1.5 (K. Harris, available at http://klustakwik.sourceforge.net
) to create a set of spike trains, each of which was a list of the times at which action potentials occurred for one putative neuron. Because tetrodes with good recording quality were not moved between sessions, the number of distinct cells recorded is less than the number of spike trains.
During recording sessions, the position of the rat was tracked using LEDs on the recording headstage. During training, a LED “backpack” constructed in the laboratory was used. The position of the LEDs was observed by an overhead camera, and recorded and time-stamped by the Cheetah system.
Data Analysis
Cell categorization
Cells were assigned to one of three putative cell type categories: PFN, TFN, and HFN, based on their firing properties, as described in Schmitzer-Torbert and Redish (2008)
. Each cell was tested for reward- and maze-responsiveness. To test for a reward response, the cell’s actual average spike count in the window from 1 to 5ÃÂ s after both feeder trigger times was z-scored relative to the distribution of spike counts obtained from 100 sets of randomly shuffled feeder times. A cell was classified as reward-responsive if its reward z-score was larger than 2. To test for a maze response, the position data for that session was first linearized and warped to allow comparison across sessions (described below), and subsequently divided into seven segments that did not include the area around the feeders. If the one-factor ANOVA significance level of the cell’s average firing rate with maze segment as a factor was below 0.05, the cell was classified as maze-responsive.
Path linearization and warping
In order to allow averaging of neural data across different paths taken on different maze configurations, the two-dimensional position of the rat on the maze was mapped to the closest point on an idealized path (the typical path taken through the maze by the rat, see Schmitzer-Torbert and Redish, 2004
for an example) to create a one-dimensional representation of the path rats took through the Multiple-T maze. This idealized path was drawn off-line by the experimenter, and the locations of seven landmarks (start of the navigation sequence, turns 1–4, and the two feeder sites) identified. The position data between every pair of successive landmarks wasÃÂ then assigned to a fixed number of spatial bins. All data further than 10ÃÂ cm away from the idealized path was excluded from further analyses, except for the errors/turnaround analysis, discussed below.
Ensemble decoding
We applied a one-step Bayesian decoding method (Zhang et al., 1998
), using all cells that fired at least 25 spikes in a session, to the spatial (linearized, warped) tuning curves of all data sets with at least 10 simultaneously recorded cells (84/104 sessions) using 50ÃÂ ms time bins and a uniform spatial prior. For each time bin, this method takes the spike counts from each cell i and computes the posterior probability of the rat being at location x given spike counts si, p(x|s). The plot of actual vs. decoded location (Figure 3
A) shows the average decoded probability distribution for each actual location, obtained by averaging the posterior distributions over all time bins corresponding to that actual location. Average decoded probability distributions for before, during, and after passes through the CP (Figure 3
B) where obtained by first finding the entry and exit points of individual passes through the CP zone (red box in Figure 1
A) and then averaging over all time bins within each pass. The decoding probability at the feeder locations p(Feeders) was defined, for each time bin, as the average decoding probability to the space bin of the feeder locations and their adjacent bins (6 bins out of 110 total). For the time decoding analysis, tuning curves in time, i.e. PETHs, were constructed fromÃÂ −10 to 5ÃÂ s, in 150ÃÂ ms bins, relative to the time of pellet release (feeder fire) at the first reward location. If the rat left the reward location earlier than 5ÃÂ s after food delivery, the remaining time was not used in computing the tuning curve. As for spatial decoding, for each 50ÃÂ ms time bin as the rat runs, the spike counts from each cell i in that window were used to compute the posterior probability of the rat being at time t given spike counts si, p(t|s). We used a uniform prior in time. For both the space and time decoding analyses, we separated training and test data by decoding spiking data on even laps using only tuning curves obtained from odd laps and vice versa.
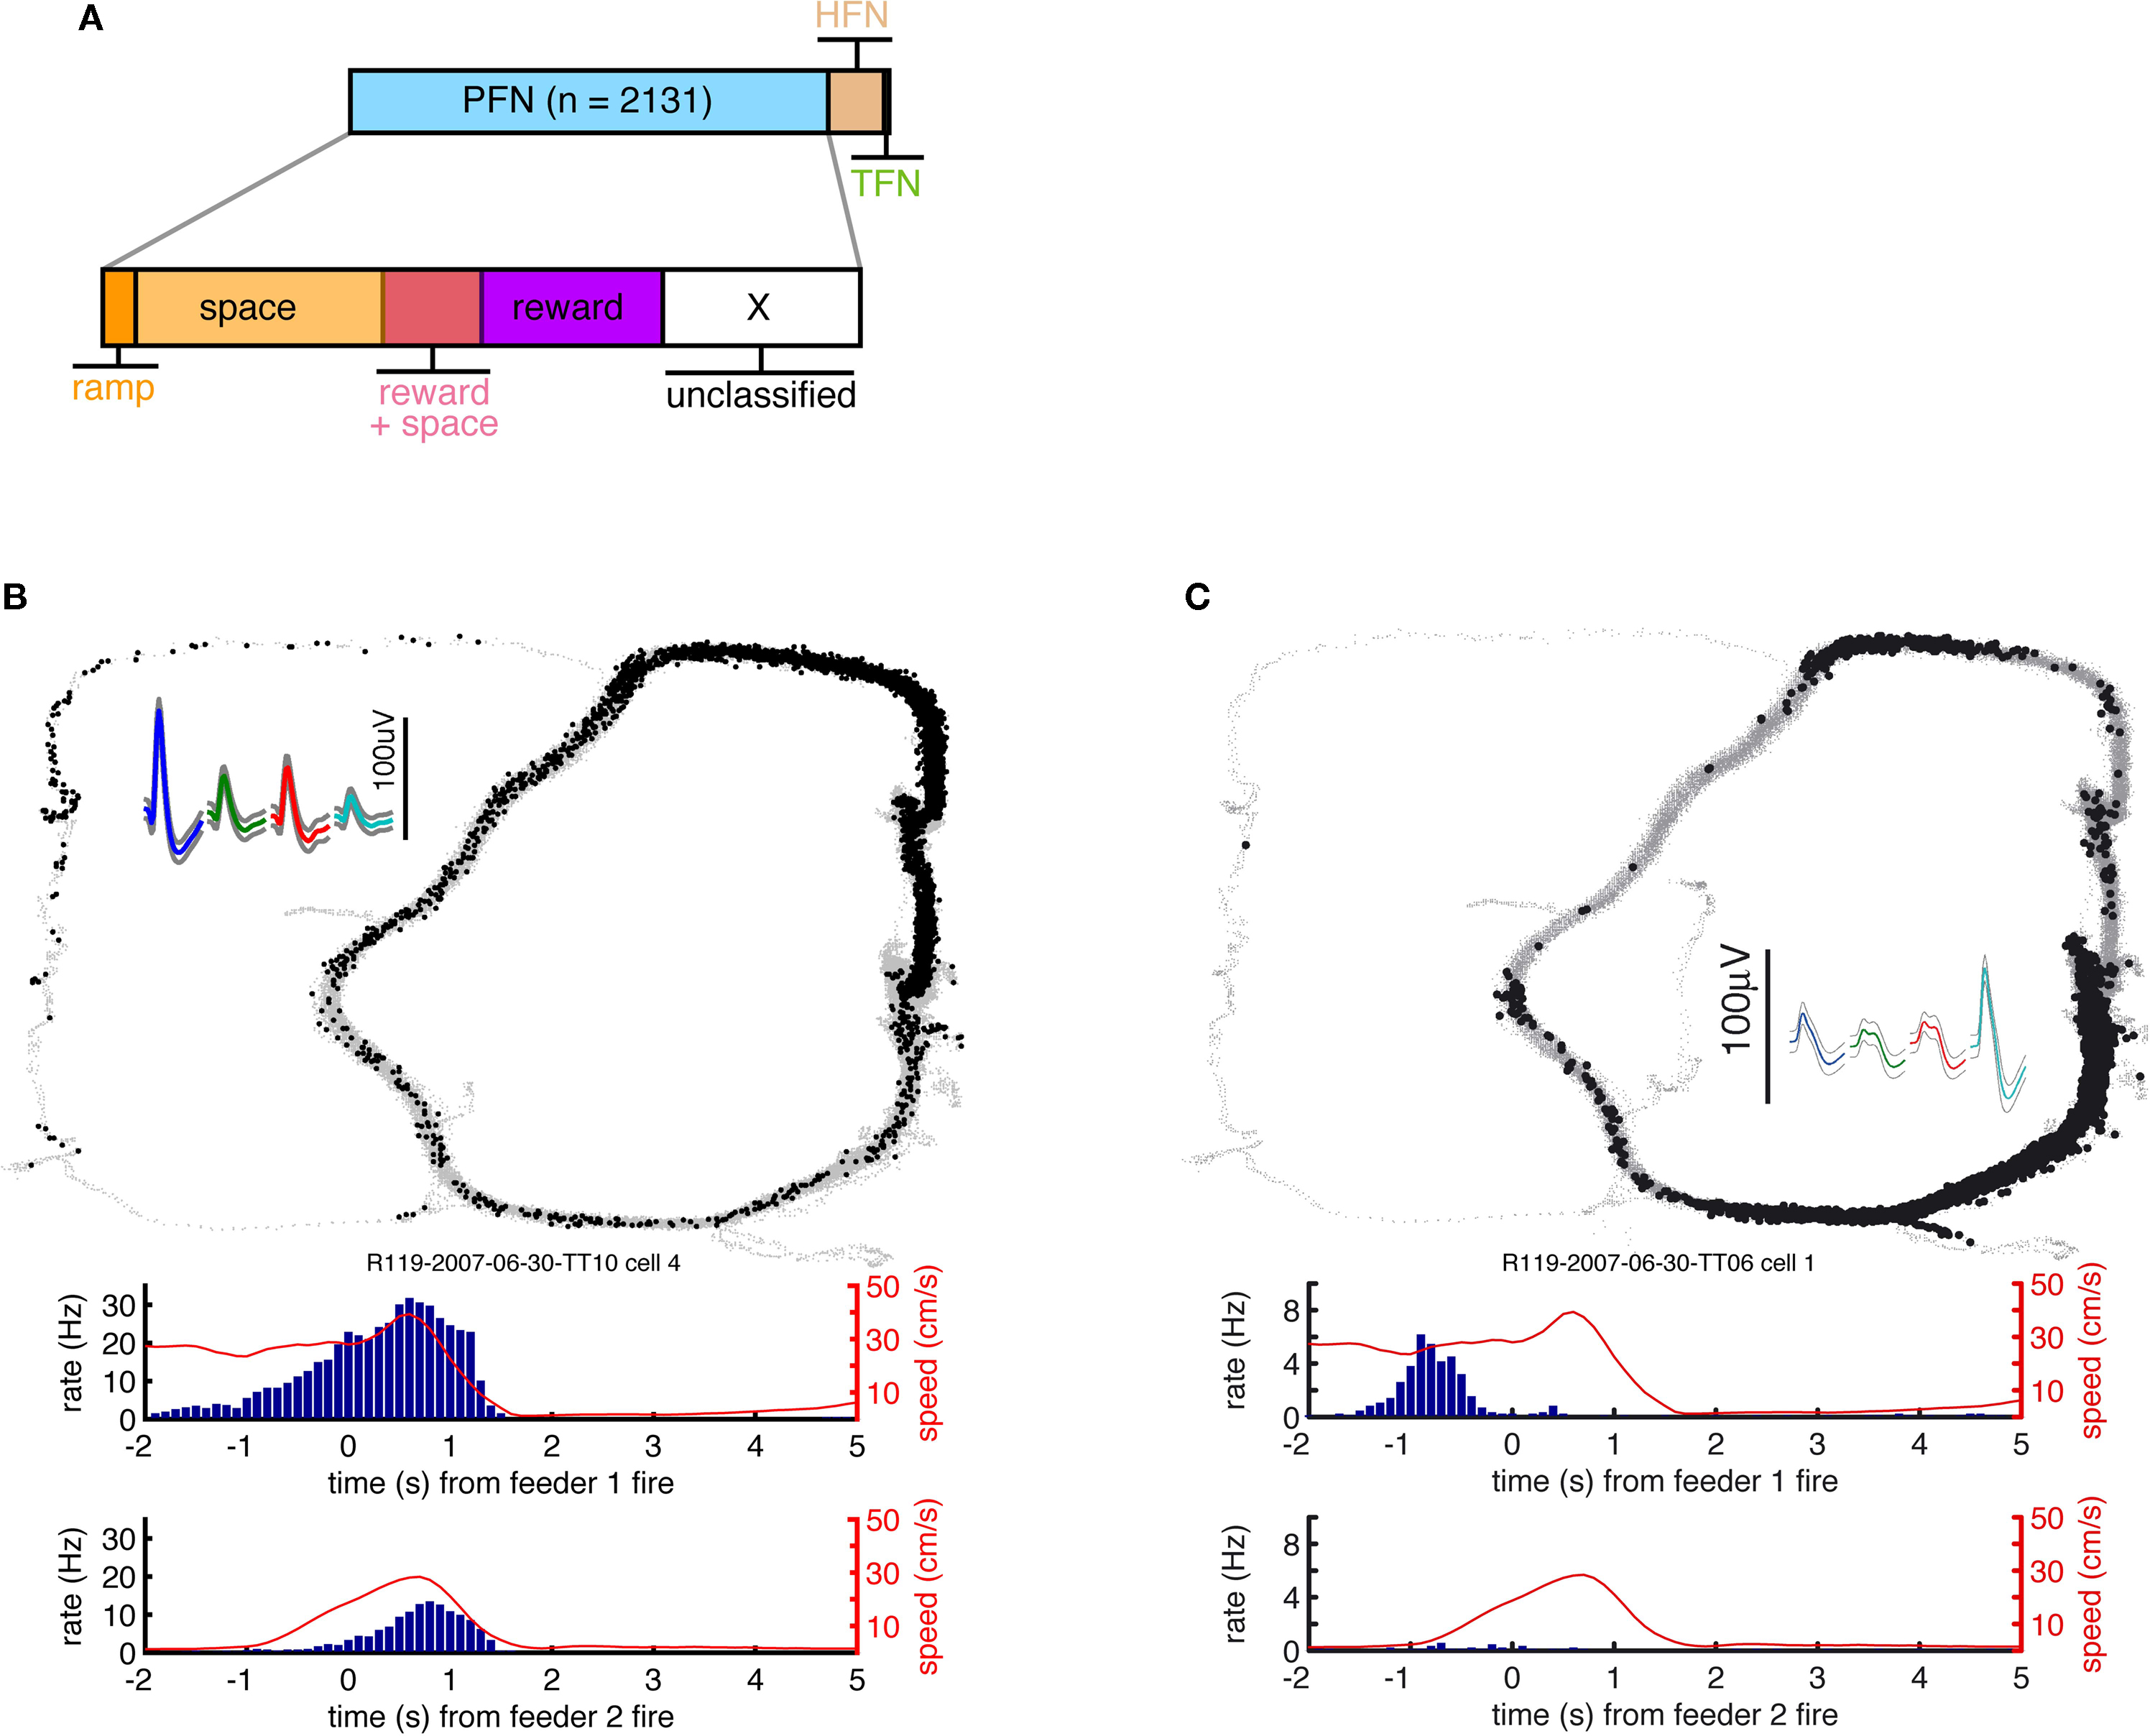
FigureÃÂ 3. (A) Spike trains (nÃÂ =ÃÂ 2402) were assigned to putative phasic-firing neurons (PFNs, nÃÂ =ÃÂ 2131), high-firing neurons (HFNs, nÃÂ =ÃÂ 249) and tonically-firing neurons (TFNs, nÃÂ =ÃÂ 22). PFNs exhibited spatial and reward firing correlatesÃÂ consistent with previous reports. (B) Representative example ofÃÂ anÃÂ anticipatory ramp cell, which gradually increases in firing rate as the rewardÃÂ sites are approached and drops off rapidly once reached. The top panelÃÂ shows tracking data (small grey dots, one dot for each 16.6ÃÂ ms positionÃÂ sample)ÃÂ and locations where a spike occurred (black dots, one dot for each spike) during one 40-min recording session. Inset shows this cell’s averageÃÂ waveforms on the 4 tetrode channels. The lower panels show peri-eventÃÂ timeÃÂ histograms (blue bars), where time 0 is pellet release time (“feederÃÂ fire”) for feeder 1 (F1, top) and feeder 2 (F2, bottom), as well as theÃÂ animal’s speed (redÃÂ line). Note how although time 0 is the time of pellet release (triggered whenÃÂ the animals crossed the green lines in Figure 1
A), pellets only reachedÃÂ the track about 1.5–2ÃÂ s after this time. (C) Typical exampleÃÂ ofÃÂ a cell withÃÂ spatial firing fields. Unlike primary neurons in hippocampus (“placeÃÂ cells”)ÃÂ ventral striatal cells rarely exhibited single, well defined firingÃÂ fields.
Reversals
This analysis was designed to detect times when the rat abruptly changed movement direction while correcting an error. First, time intervals from when the rat strayed further than 7ÃÂ cm from the idealized path, but subsequently returned within that same range, were identified. Large deviations from the idealized path (>30ÃÂ cm), such as those generated by returns down the non-rewarded rail, were excluded. For each episode lasting longer than 100ÃÂ ms, the time course of three variables (movement speed, distance from the linearized path, and position) was examined for local extrema. If at least two of these had a clear extremum, their times were averaged to yield the estimated point of turnaround, and the episode was included in the analysis. The output of this algorithm was manually checked for correctness.
Arrivals and departures at the feeder sites
For each session, a 8-cm diameter circle was drawn around the feeder sites (as identified from the occupancy matrix) and the times of crossings into and out of this area counted as arrivals and departures respectively.
Errors
An error was scored when the rat crossed an imaginary vertical line through the first feeder trigger line on the non-rewarded side of the maze.
Lap times
Lap times were defined as the time elapsed between when the rat entered the navigation sequence at the bottom of the mazeÃÂ to when it crossed either reward trigger line at the top end of the maze (i.e.ÃÂ when the rat enters a return rail after having made a choice). For the first lap (when the rat was placed on the track by the experimenter) times and data from before the start of the first T (T1) were excluded.
We recorded ventral striatal neural activity from rats (nÃÂ =ÃÂ 5) running laps on an elevated track (the Multiple-T task; Figure 1
A) for food reward. The track contained three low-cost T-shaped choice points (or turns, T1, T2 and T3) as well as a final high-cost choice, T4. At the final choice point, choosing one return rail, but not the other, triggered reward delivery at two feeder sites F1 and F2. The sequence of turns, as well as which return rail was rewarded, could be varied on a daily basis, such that in each session rats started out uncertain about which choices lead to reward. Consistent with previous reports (Johnson and Redish, 2007
; Schmitzer-Torbert and Redish, 2004
), rats quickly learned to choose the correct return rail within each 40-min session (nÃÂ =ÃÂ 104 sessions; Figure 1
B), coinciding with a period of increased pausing at the final choice point (Figure 1
C). Lap times continued to decrease over the course of a session (Figure 1
D). Rats ran an average of 75.2à±Ã 8.8 (S.E.M.) laps per session. All analyses were restricted to the first 70 laps of each session to avoid sampling biases in later laps.
Cells were recorded and isolated using standard techniques, with a total of 2402 spike trains containing at least 100 spikes recorded from 104 sessions. Recording electrodes were confirmed to be in ventral striatum (nucleus accumbens core and ventral caudate-putamen; Figure 2
). Following earlier reports (Barnes et al., 2005
; Berke et al., 2004
; Schmitzer-Torbert and Redish, 2004
, 2008
), spike trains were categorized as phasically-firing neurons (PFNs, putative medium spiny projection neurons), tonically firing interneurons (TFNs) or high-firing interneurons (HFNs) based on spike train firing statistics (post-spike suppression and proportion of interspike intervals larger than 2ÃÂ s; see Schmitzer-Torbert and Redish, 2004
for details). Single cell analyses were restricted to PFNs only, for a total of 2131 spike trains. Consistent with previous reports (Carelli and Deadwyler, 1994
; Lavoie and Mizumori, 1994
; Martin and Ono, 2000
; Miyazaki et al., 1998
; Mulder et al., 2005
) PFNs showed both reward-related responses and maze (location)-related responses: 49.6% had a maze response, 34.6% a reward response, and 15.1% had both (Figure 3
A). As reported in these previous studies, a subset of maze-responsive cells showed a smooth, clear ramping-up of activity when approaching the feeder locations, followed by an abrupt decrease in firing upon arrival. On visual inspection, 105/2131 (5%) of cells fit this description (Figure 3
B). In general, maze-responsive cells tended to show a variety of large, diffuse, and/or multiple fields (e.g. Figure 3
C). Reward responses were also varied, both in their timing relative to reward delivery and in the temporal profile of the response (Figure 4
). Cells also differed in whether they responded to one of the reward locations or both, despite the rewards being identical (Figures 4
C–D).
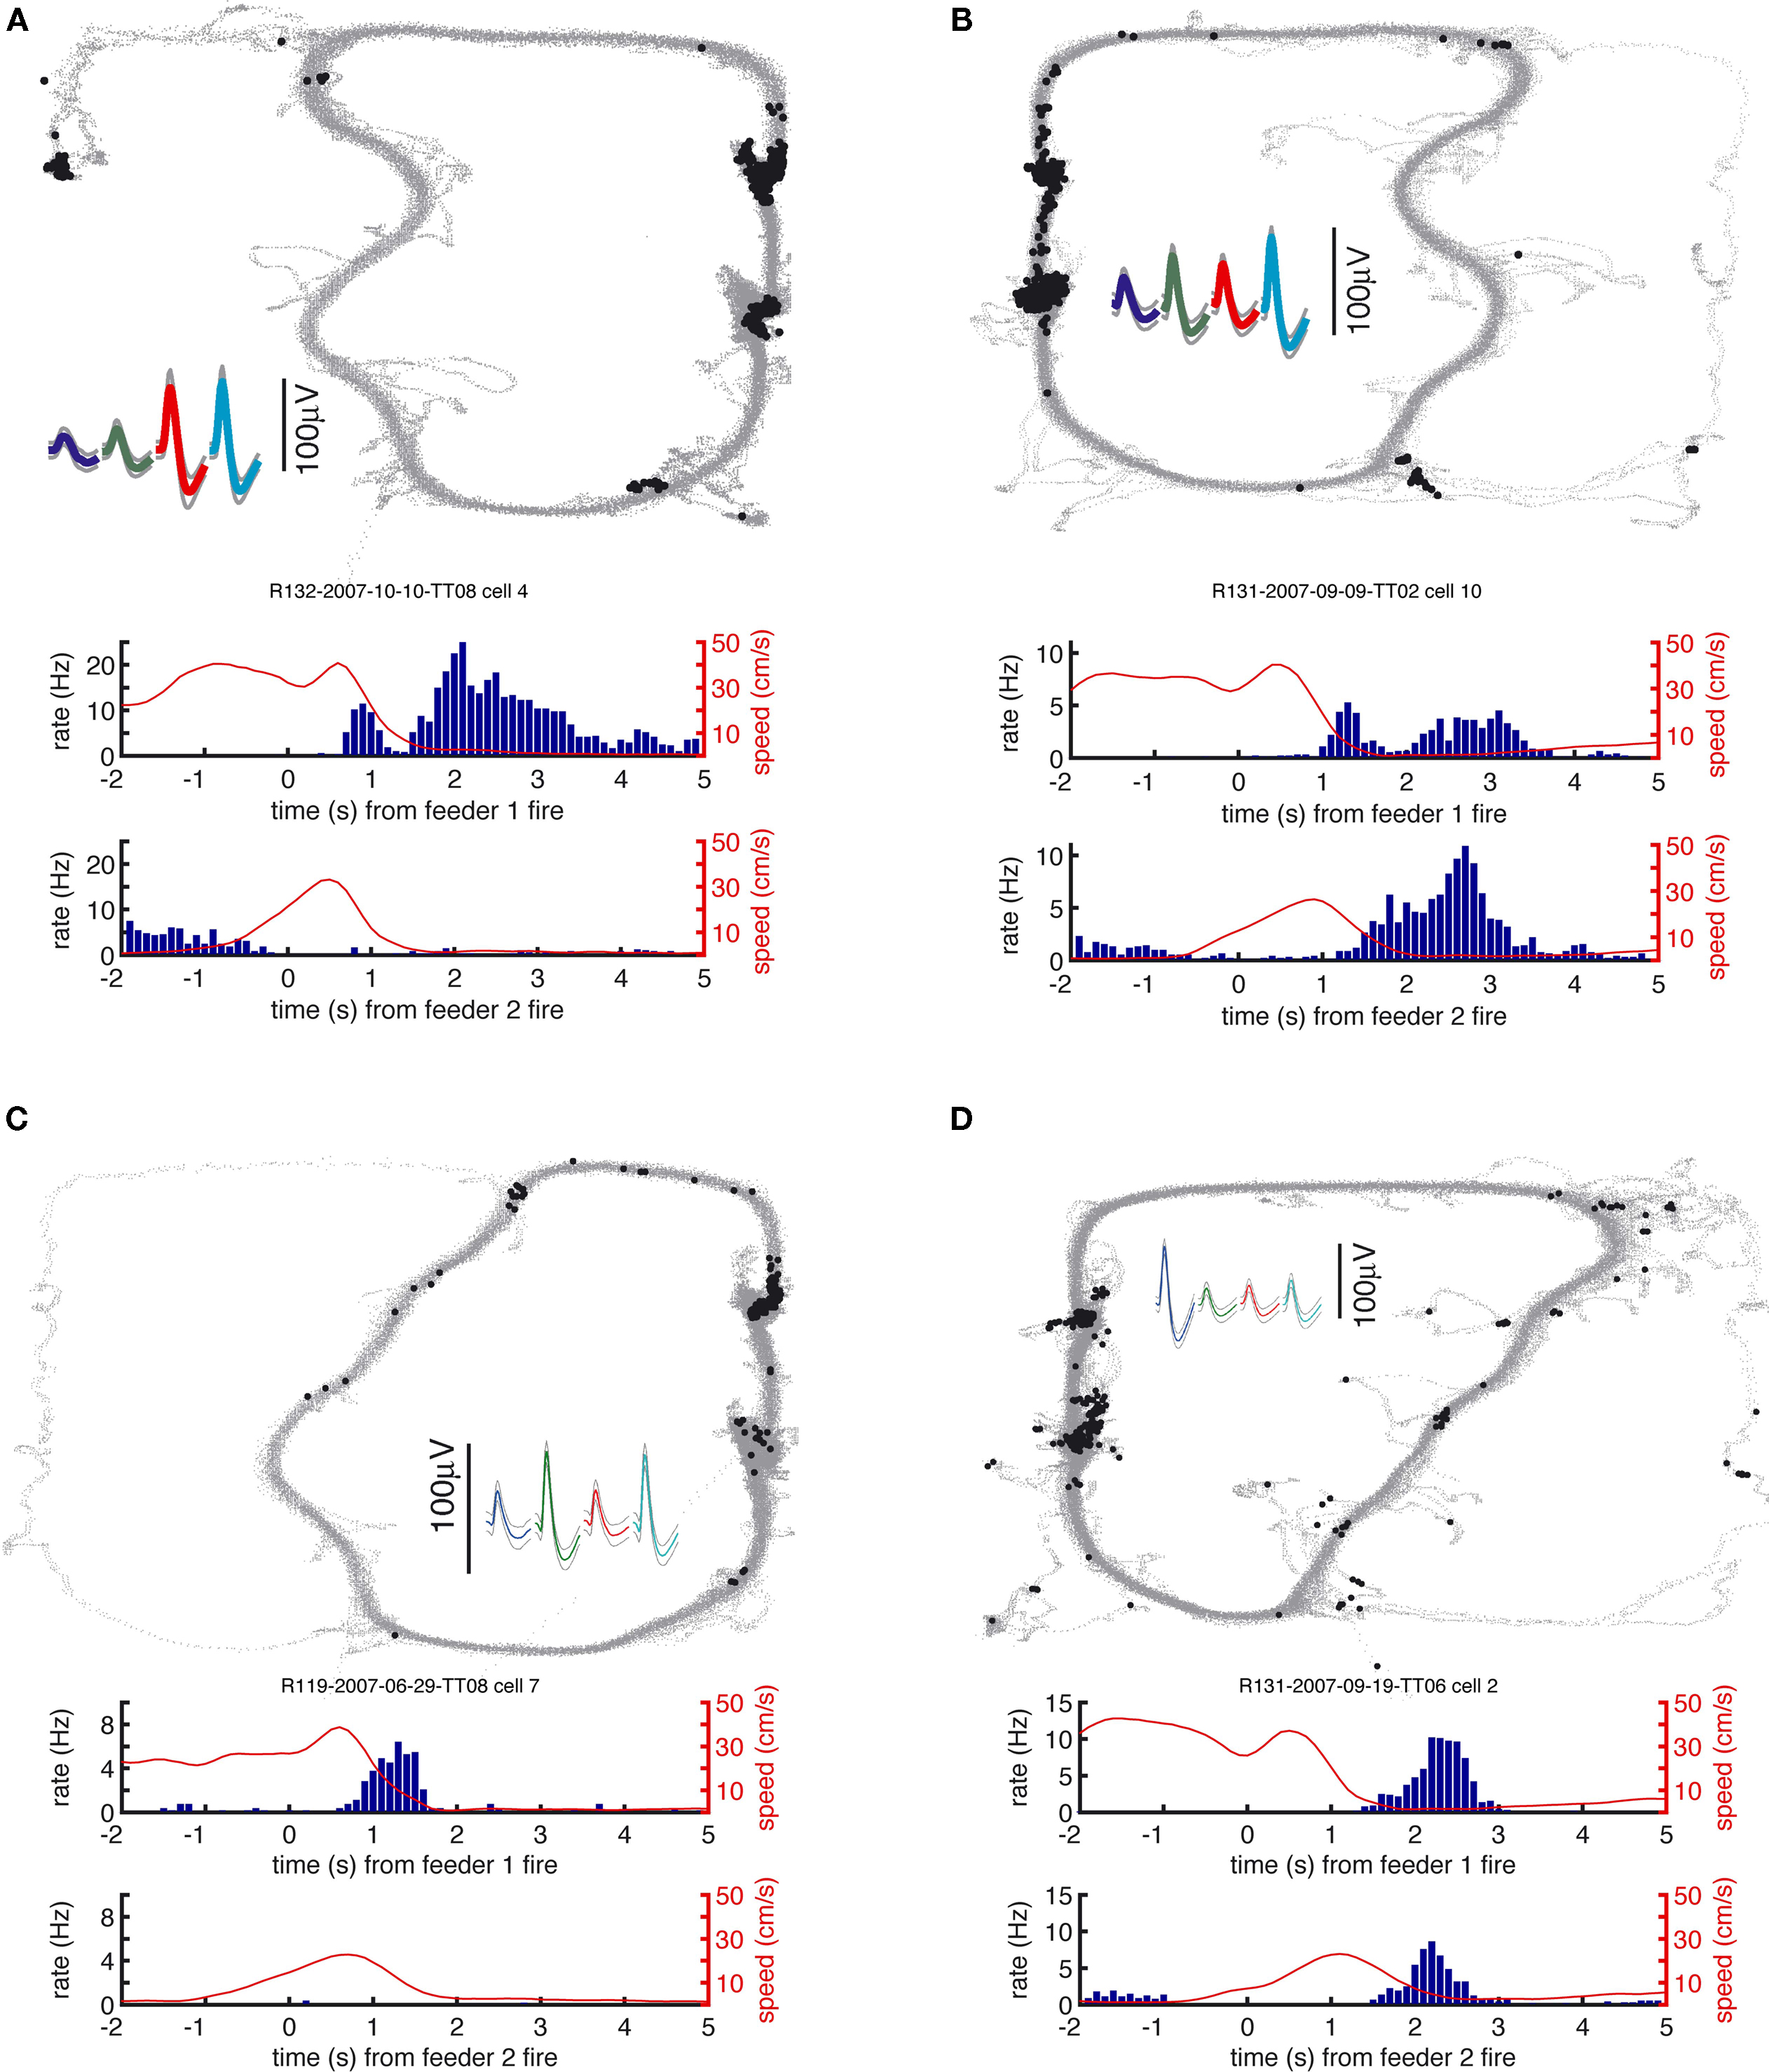
FigureÃÂ 4. Examples of reward-responsive cells; panel layout as in Figure 3
. Reward cells varied in the timing and broadness of the reward response, as well as in whether they responded at one or both of the reward sites. The majority of reward cells, including those shown here, also emitted a small number of spikes outside of the reward locations. Note in particular the activity at the final choice point and the spikes at reversal points (when the animal strays from its usual path).
In this same task, prospective hippocampal activity has been found at the final choice point (CP) (Johnson and Redish, 2007
). To confirm that our rats treated the final choice point (T4) differently from other turns, we compared the time spent at the final choice point to that spent at a control, low-cost choice point (T2). To account for gross variations in running speed, the time spent atÃÂ in these two zones was normalized by lap time. The resulting plot (Figure 1
C) shows that during early laps, rats spent more time at the final choice point (T4) than at the control choice point (T2), but this difference disappeared over the course of the session. Over the laps in which animals showed such pausing at the final choice point, behavioral performance (correct choices) increased sharply (Figure 1
B). We interpret this as consistent with the idea that pausing behavior reflects processing beyond simple stimulus-response processes, indicating the engagement of flexible decision-making or “planning” systems (Dale, 1986
; Tolman, 1948
).
Ventral Striatal Reward Cells Show Increased Firing at the Final Choice Point
Given that upstream hippocampal activity can represent non-local information at the final choice point (Johnson and Redish, 2007
), we hypothesized that ventral striatal representations of reward might be transiently active during pauses at this point. To test this, we asked whether cells that responded to reward receipt showed additional activity at the final choice point. In general, reward cells tended to fire a small number of spikes at various locations distant from the reward site (Figure 4
). An example of a cell with a clear reward response, but with a few such “extra-field” spikes specifically at the final choice point, is shown in Figure 4
A. This neuron and others in the same figure are not well described as simply being active at low speeds: those in panels of Figure 4
A,C respond only to one reward site, despite animals pausing at both. The cells in panels of Figure 4
B,D show strong activation after reward delivery, but not when the animal pauses at the first reward site prior to arriving atÃÂ the next (e.g. between 2 and 1ÃÂ s before the second “feeder fire”, the time at which food pellets are released). Additionally, the position traces indicate the animals’ tendency to pause at reversal points before returning to their usual path. While some neurons exhibited some activity at these points (e.g. the neuron in Figure 4
D), there were also many cases where no such firing was seen (Figures 4
A,B, but also in Figure 4
D). Thus, inspection of individual ventral striatal reward neurons suggests that such cells also display activity in the absence of reward delivery.
To address the question of whether reward-responsive cells are also activated at the choice point more generally, we compared the spatial distribution of the firing rates of reward-responsive PFNs to those of non-reward responsive PFNs. A cell was classified as reward-responsive if its spike count in the window of 1–5ÃÂ s after reward delivery at one or both of the reward sites had a z-score of at least 2 against the distribution of spike counts obtained by randomly shuffling the reward delivery times. (In other words, we compared the observed post-reward delivery spike counts against the distribution of randomly selected windows of the same length.) In order to be able to average data over different maze configurations, the rats’ two-dimensional position tracking data was mapped onto a standardized, linear path (Schmitzer-Torbert and Redish, 2004
). We then compared reward-responsive cells and non-reward-responsive cells, as distinguished by their reward z-score. For reward cells (reward z-score >2; 682 cells), but not for cells with negative reward z-scores (931 cells), an increase in firing rate at the final choice point (T4) was apparent during early, but not late laps (Figures 5
A,B). Because different cells have different firing rates, each cell’s space-binned firing rate was normalized by computing the z-score of each spatial bin against that cell’s distribution of firing rates over the navigation sequence (the start of the first T to one-third of the way between T4 and F1) in its overall spatial tuning curve. A two-way ANOVA with location on the maze (nine bins, from the start of the first T to one-third of the way between T4 and F1) and cell type (reward or non-reward) as factors showed a significant interaction for early laps (1–10, FÃÂ =ÃÂ 2.56, pÃÂ =ÃÂ 0.0087), but not late laps (61–70, FÃÂ =ÃÂ 0.88, pÃÂ =ÃÂ 0.53). For reward cells in early laps, the T4 location had the highest mean and was different from non-reward firing at T4 (FÃÂ =ÃÂ 13.07, p < 0.001).
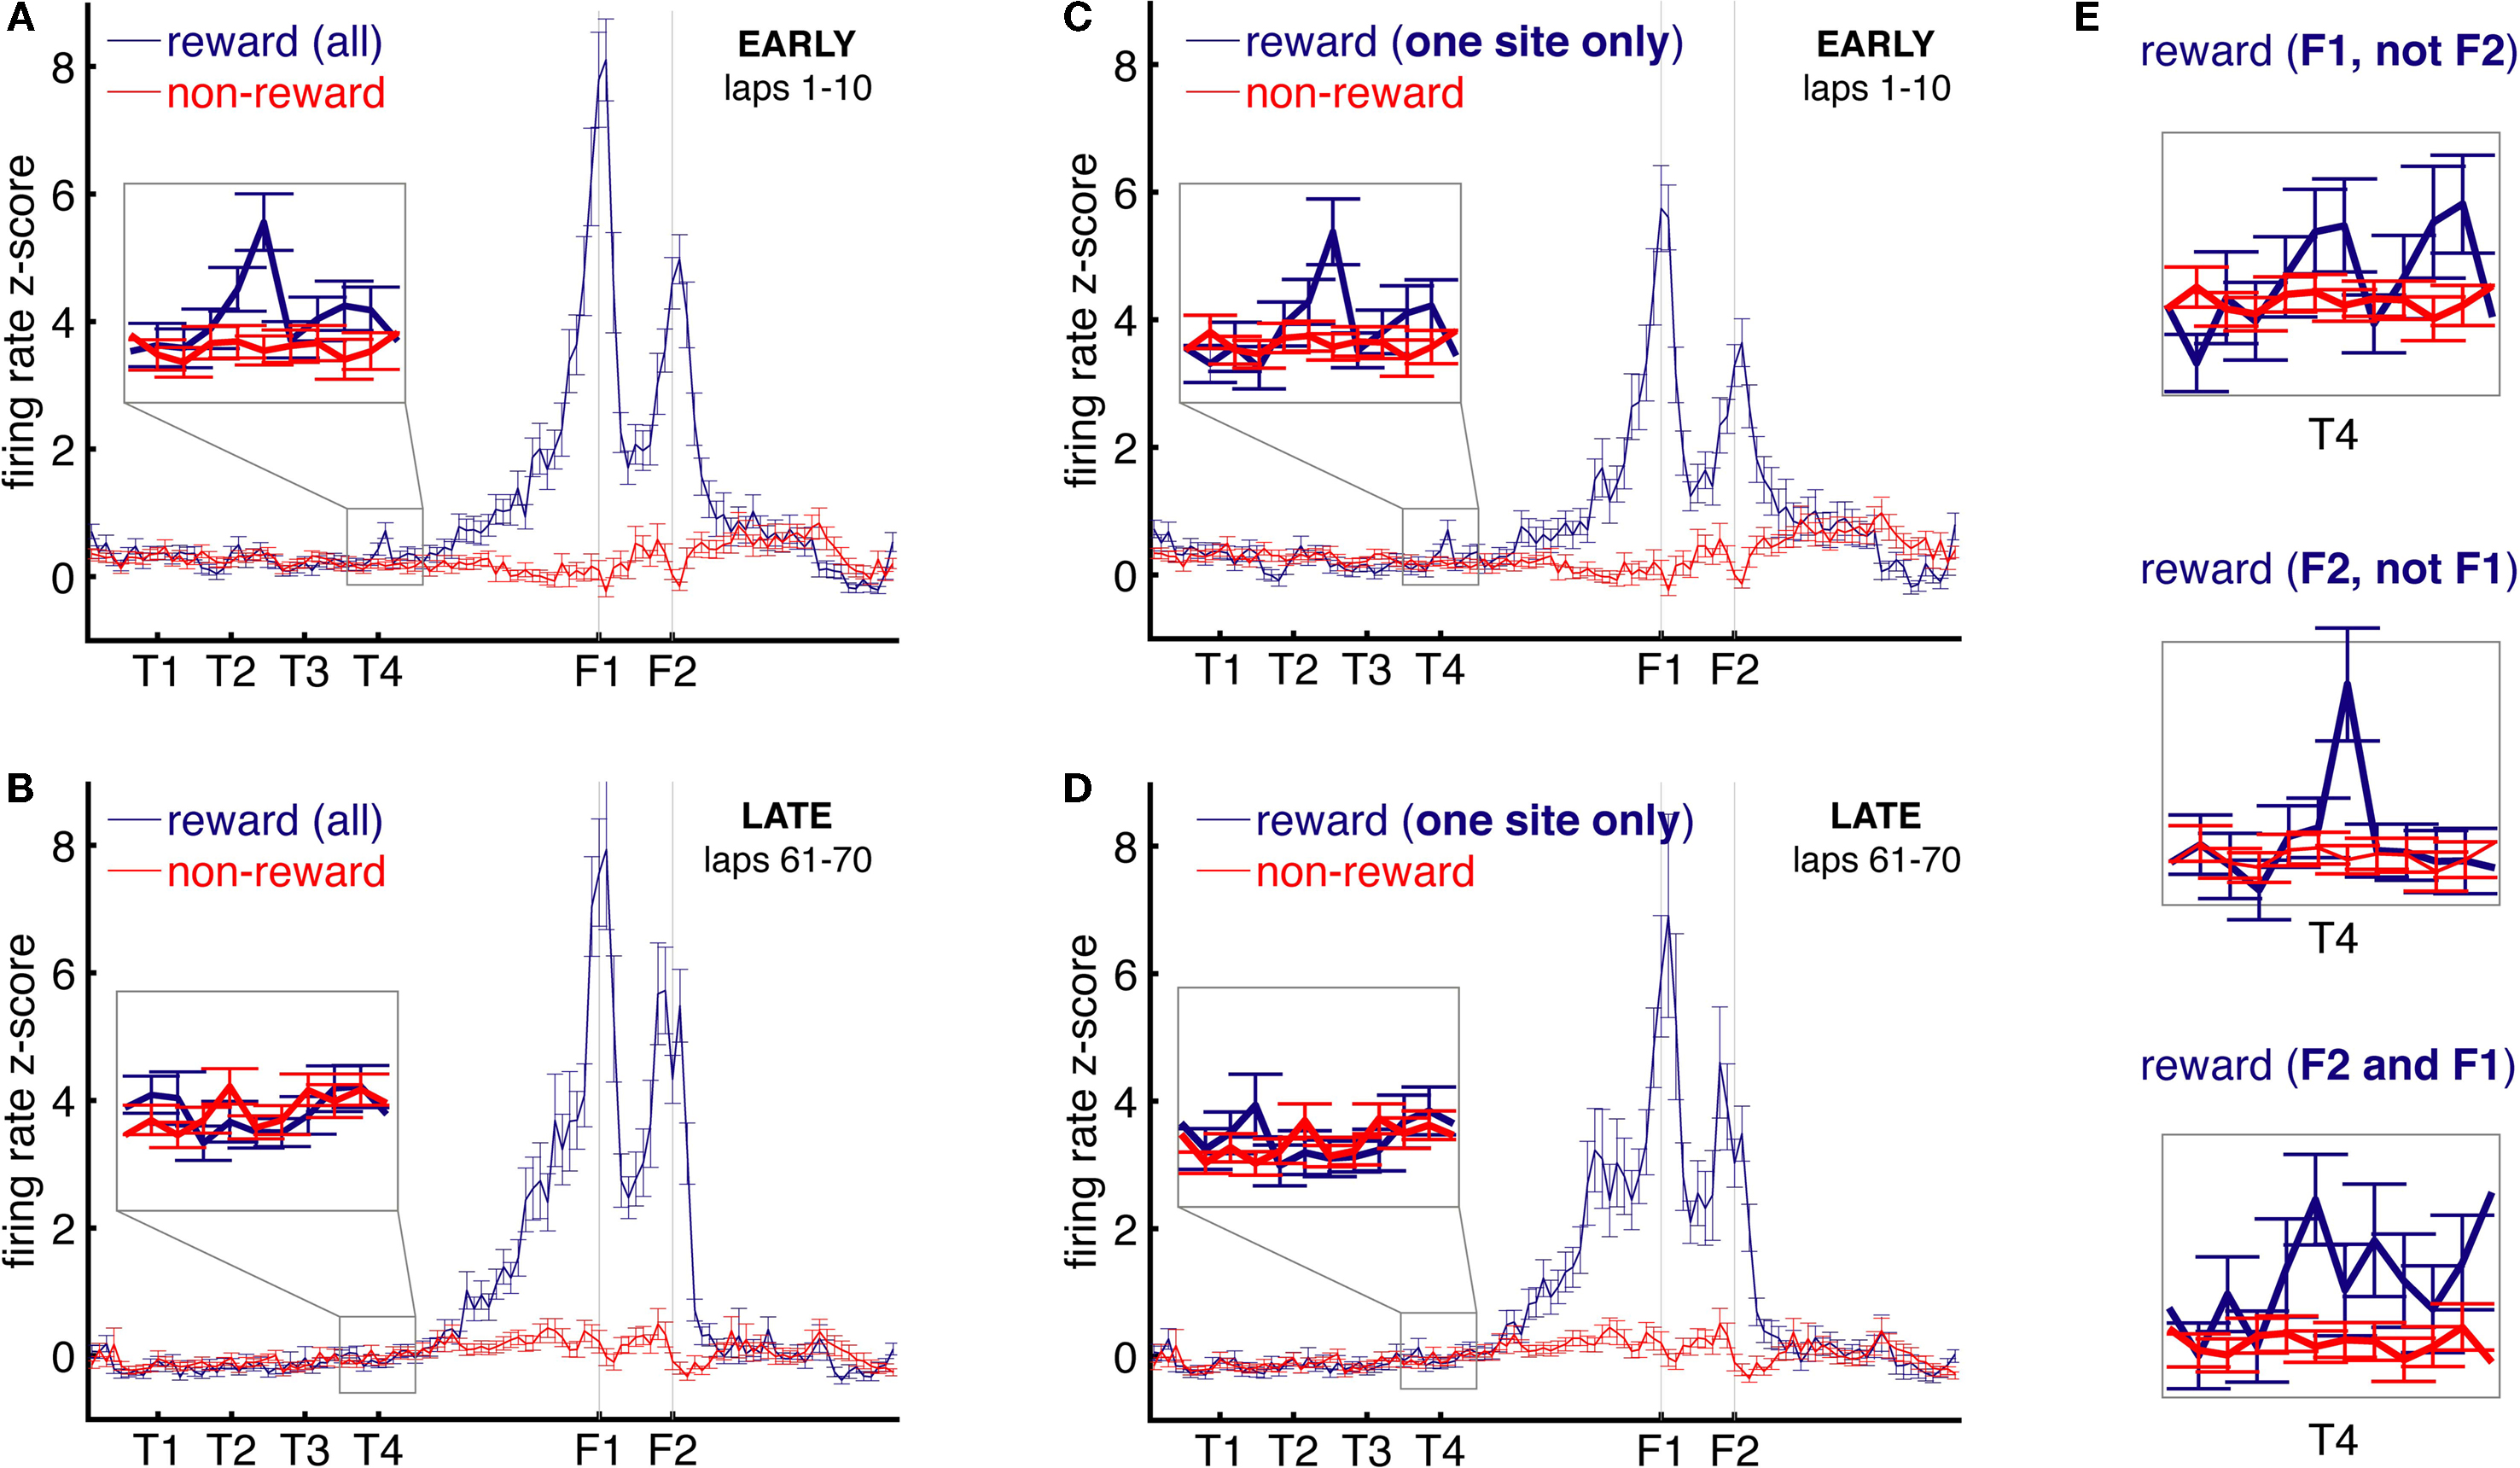
FigureÃÂ 5. Reward-responsive cells, but not non-reward cells, show increased firing at the final choice point (T4) during early laps. (A) Averaged over all cells, average z-scored firing rate is increased at the final choice point (T4) during early laps (1–10) for reward-related (blue), but not non-reward-related cells (red). During late laps (61–70), there was no such difference (B). Note how during late laps, while there is no increase in reward cell firing at T4, the response to actual reward receipt (F1, F2) is undiminished. This pattern of results was preserved when only cells that had a significant reward response to one, but not the other, reward location, were used (C,D), excluding cells with general movement correlates. When reward cells were further subdivided into cells responding to only the first, only the second, or both locations, each group showed higher activity at the final choice point compared to non-reward cells (E).
Due to our criterion for reward-responsive cells, it is possible that cells firing selectively at low speeds or at movement initiations could be erroneously included in this analysis as reward cells, leading to alternative explanations for the extra “reward-cell” activity at T4. To control for this type of possibility, the same analysis was performed only on those cells that had a reward response to one, but not the other, reward site (495 cells; Figures 5
C,D). Cells with a general movement-related response common to both sites would thus be excluded from analysis. Using only these cells, a similar pattern of results was observed. Firing at T4 was higher for reward than for non-reward cells during early, but not late, laps (early: cell typeà×àspace bin interaction, Fà=à2.62, p < 0.0072; difference at T4, Fà=à8.74, pà=à0.0031; late: no interaction, Fà=à0.6, pà=à0.77). Thus, reward-responsive cells show increased firing at the choice point during early, but not late, laps. When these cells were separated according to whether they responded to only the first, only the second, or both locations, each group showed higher activity at the final choice point compared to non-reward cells (Figure 5
E).
Ensemble Decoding Shows Increased Reward Site Representation at the Final Choice Point
The preceding analysis relies on assumptions about what is being coded for by individual cells. A more general approach to the question of what is represented in ventral striatum at the final choice point can be found through ensemble decoding methods. A one-step Bayesian decoding method (Zhang et al., 1998
) was applied, where, for each time bin, the posterior probability p(x|s) of the rat being at location x given spike counts si is computed. This method is agnostic about what variable is in fact represented; it merely shows to what extent different locations are related based on ensemble firing patterns. To visualize such relationships, the average posterior (decoded) probability distribution for each actual location was plotted (Figure 6
A). The diagonal of increased decoding probability indicates that ventral striatal ensembles contain information about spatial location. Although both feeder locations have a high probability of being decoded correctly, there was significant confusion between the two feeder locations F1 and F2 (as indicated by the symmetric blobs offset from the diagonal), an effect that can result from a population of cells firing similarly at both locations, such as reward-responsive cells.
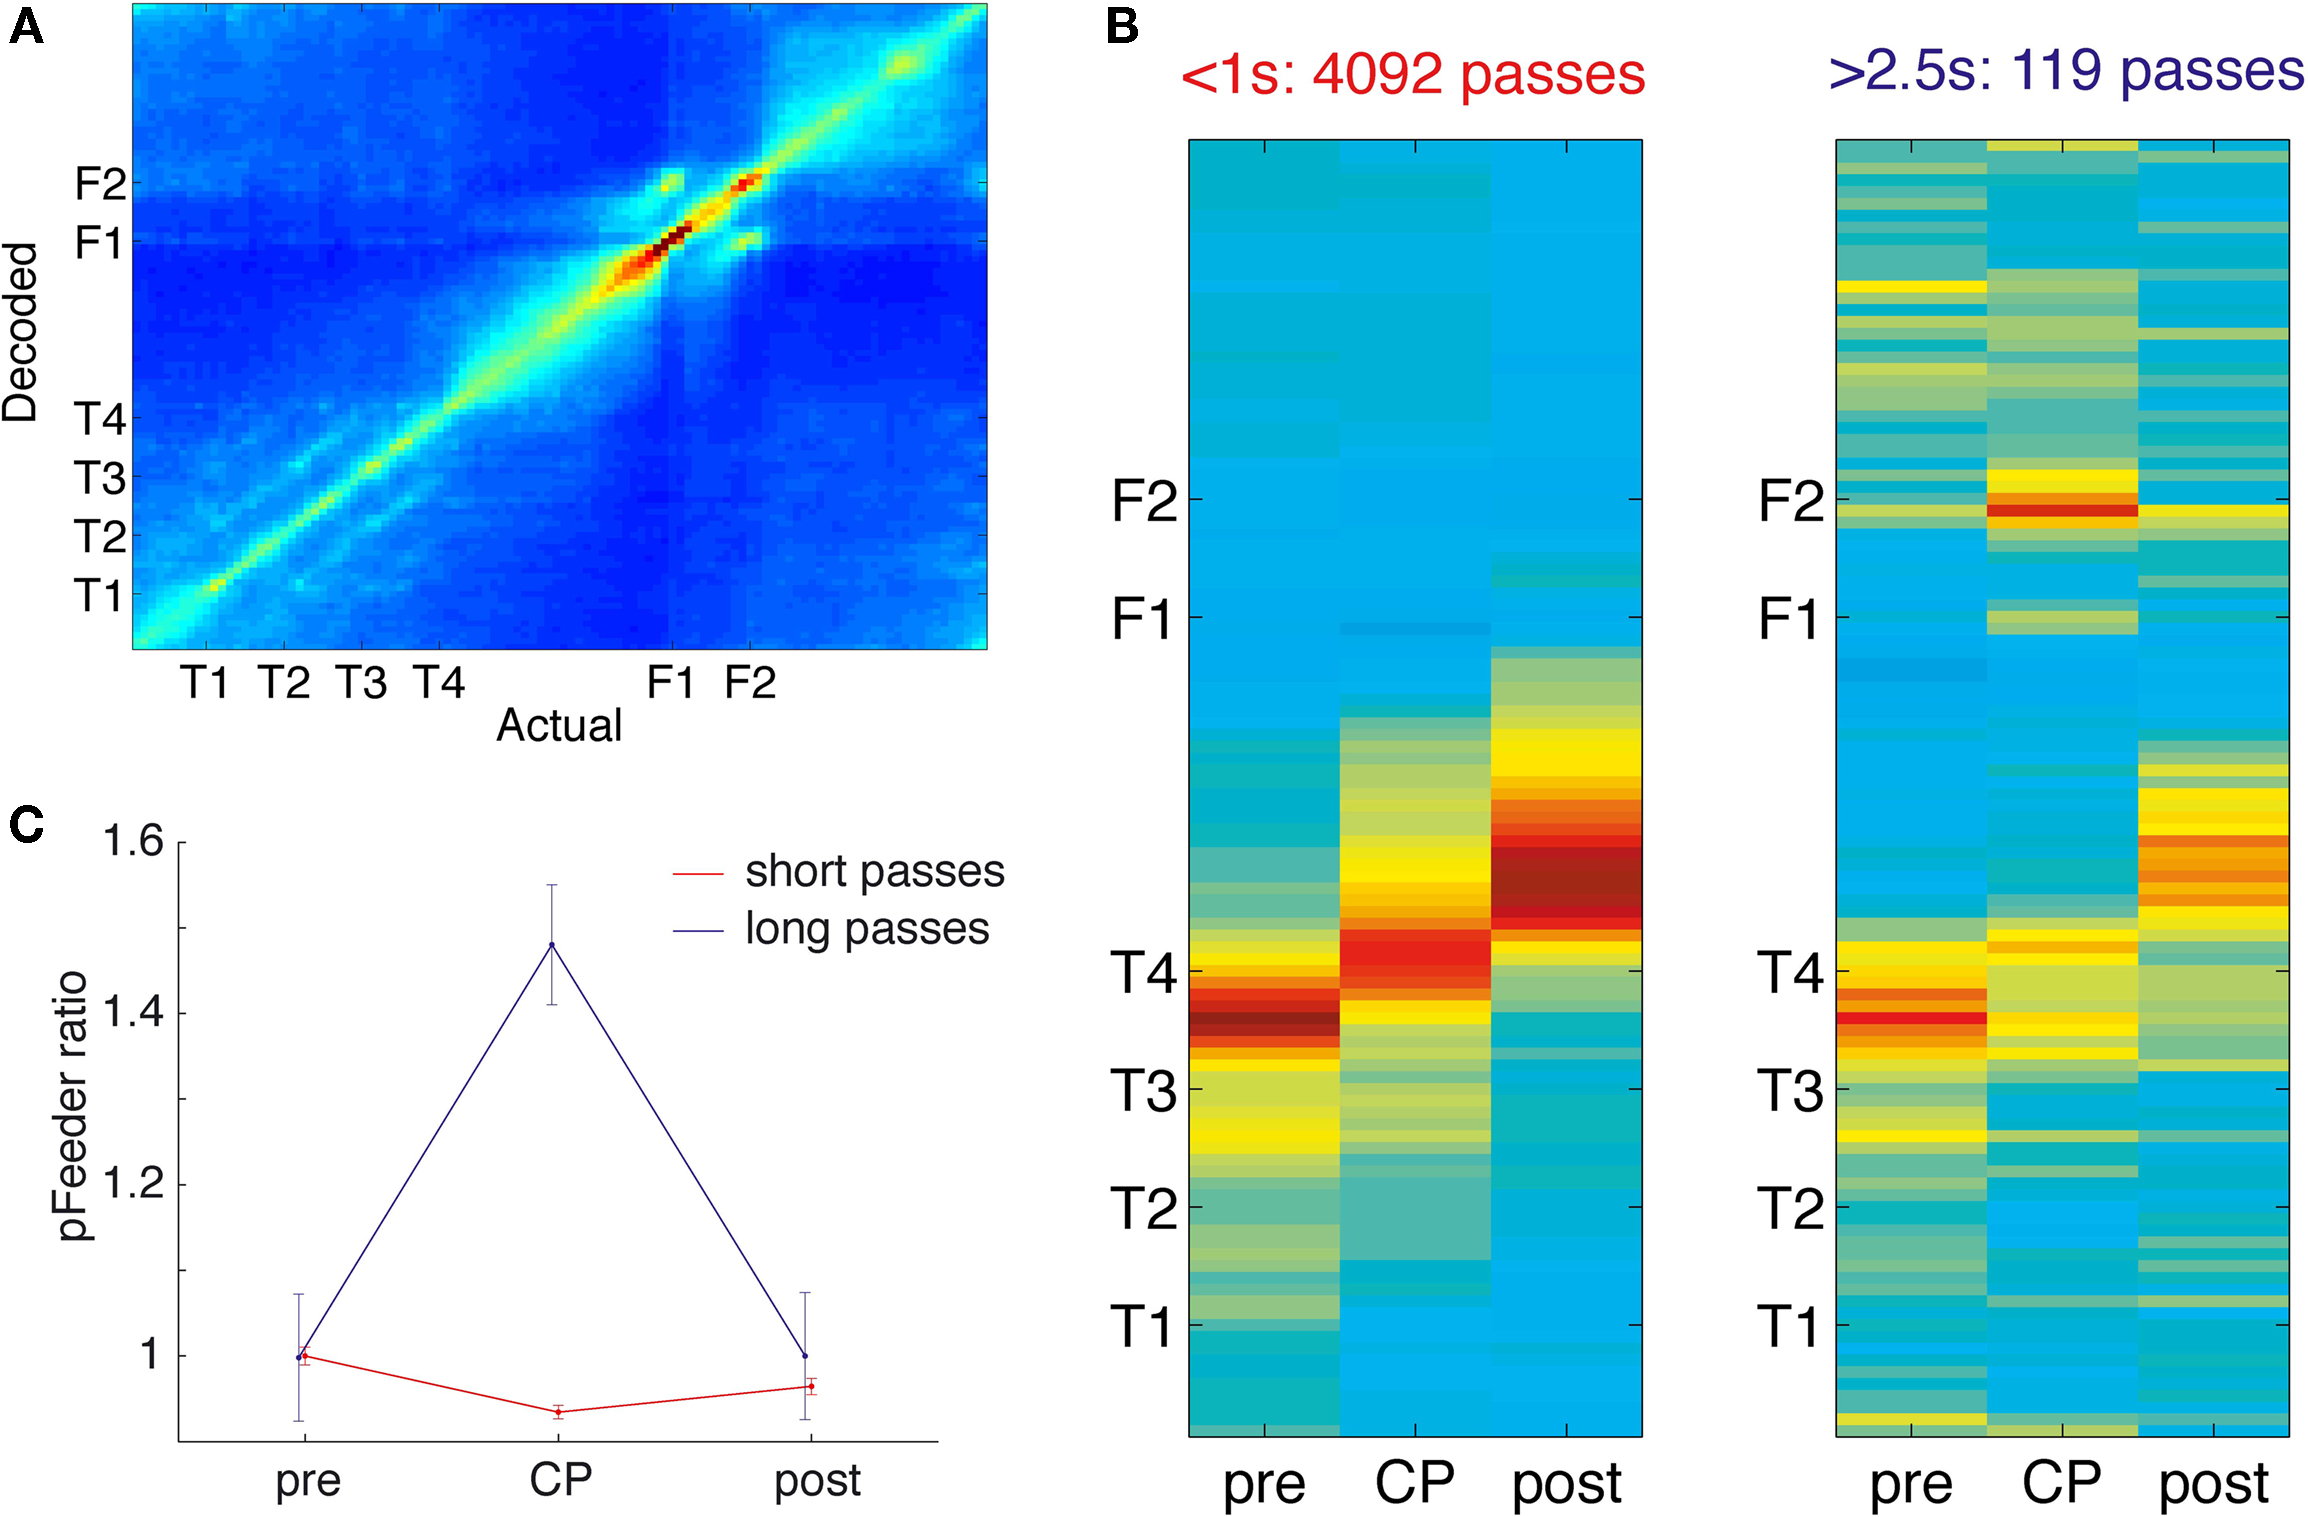
FigureÃÂ 6. Decoding of ventral striatal ensembles reveals increased representation of rewarded locations as rats pause at the choice point. (A) Average posterior (decoded) spatial probability distribution as a function of actual location. Cold colors indicate low, hot colors high decoding probability. (B) Posterior probability distributions for short (left panel) and long (right panel) passes through the choice point (CP). The three columns in each panel correspond to the 0.5ÃÂ s immediately preceding each CP pass, the CP pass itself, and the 0.5ÃÂ s immediately following it, respectively. The progression of the red, high reconstruction probability zone tracks the rat moving through the CP, but note the increased probability at the feeders for the long pauses. The average probability of decoding to the feeder locations, normalized to pre-CP levels, is plotted in (C), with the increase for the long pauses highly significant (see main text).
Having established that spatial information can be extracted in this manner, we next asked what locations were represented when the rat paused at the choice point. For each session, a rectangular region around the choice point was defined (red box in Figure 1
A). Passes through this zone were categorized as short (<1ÃÂ s) or long (>2.5ÃÂ s). Average decoded probability distributions for each pass were identified and compared to the 0.5ÃÂ s preceding and following it (Figure 6
B). In each case, high decoding probability tracked the rat as it moved through the choice point. During long pauses, however, the probability of decoding to the feeders p(Feeders) was strongly increased at the choice point compared to regions immediately before or after the choice point (Figure 6
C; ANOVA FÃÂ =ÃÂ 14.52, p < 10−6).
Because increased pausing and reward cell firing occurs at the choice point during early, but not late laps, we asked how p(Feeders) changed with experience. For early laps, an ANOVA of p(Feeders) with spatial location as a factor (five blocks, one for each turn and one for after T4) showed significant variation (FÃÂ =ÃÂ 9.6, p < 10−7) with T4 having the highest mean. A two-way ANOVA showed a significant interaction between early/late laps and spatial location (FÃÂ =ÃÂ 3.15, pÃÂ =ÃÂ 0.013), with p(Feeders) higher at T4 in early laps compared to late (FÃÂ =ÃÂ 69.52, p < 10−10). Thus, increased feeder location representation is present at the choice point during early laps, but disappears with experience.
Could this increase in feeder location representation result from disorganized firing as the rat pauses? To test this, we compared the average posterior probability distribution for long pauses to a shuffled control where the interspike intervals of all cells were randomly rearranged. The interaction term in a two-way ANOVA with space and shuffled/non-shuffled as factors was highly significant (FÃÂ =ÃÂ 15.51, p < 10−10), implying that random spiking cannot fully account for increased feeder representation at the choice point. Alternatively, a linear combination of the decoded probability distribution obtained from random spiking and that obtained from before, after, or during (for short passes) the choice point might explain increased feeder representation. To address this, we compared the decoded probability distribution difference between either (a) before the choice point (long passes), (b) after the choice point (long passes), and (c) at the choice point (short passes) and that at the choice point for long pauses to the randomly shuffled distribution (two-way ANOVA). For each comparison, the interaction between space and random/non-random was significant (least significant FÃÂ =ÃÂ 4.88, p < 0.001). Therefore, the increase in p(Feeders) during pauses at the choice point cannot be accounted for by a linear combination of the pre- or post- decoded probability distribution and that obtained from random spiking.
As in the single cell-based analysis (Figure 5
), increased probability of decoding to the feeder locations could be the result of a number of similarities between the feeder locations and the choice point other than representation of reward, such as lower speed or movement initiation. While p(Feeders) was negatively correlated with movement speed overall (rÃÂ =ÃÂ −0.35 over all sessions with >40 cell ensembles), Figure 7
C shows that at the first feeder, p(Feeders) was in fact modulated independently from speed and was not related to movement initiation. Thus, like reward-responsive neurons, ensemble decoding of the reward locations is correlated with pausing, but can be dissociated from it.
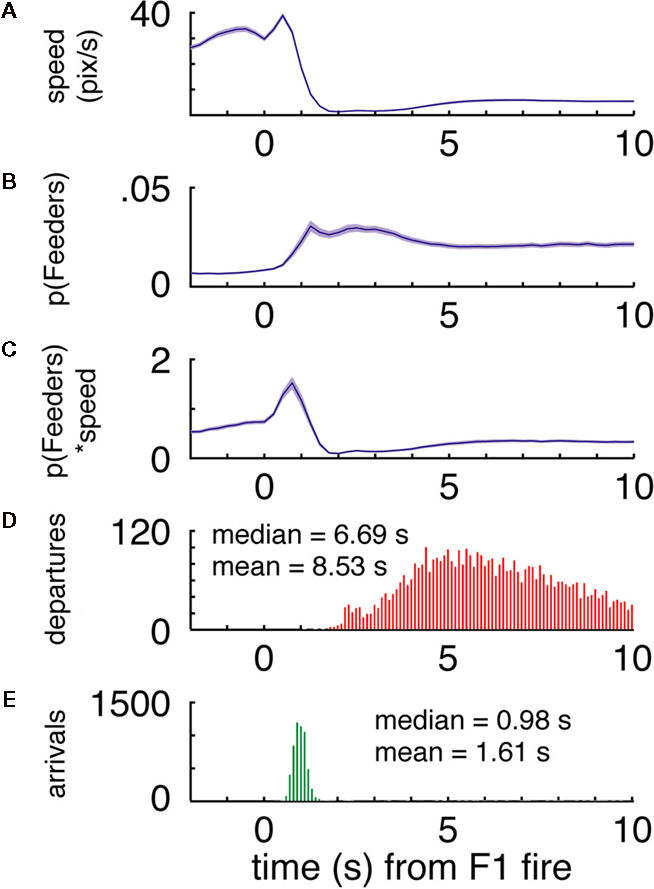
FigureÃÂ 7. (A–C) p(Feeders) is modulated independently of speed when the rats arrive at the first feeder. While speed is negatively correlated with p(Feeders) overall, as is apparent from comparing panels (A) [p(Feeders) relative to the time of feeder 1 fire] and (B) (speed), panel (C) shows that when speed is factored out, p(Feeders) still shows a clear increase. Panels (D,E) show the distribution of arrival and departure times at the feeder site, again relative to the time of pellet release.
To address in more detail the issue of what neural ensembles represent as rats paused at the final choice point, we applied the same ensemble decoding algorithm not to space but to time. In this analysis, instead of using spatial tuning curves to generate a decoded probability distribution over space (as in Figure 6
), we compute tuning curves in time relative to reward delivery [i.e. peri-event time histograms (PETHs)] and obtain the decoded probability distribution over time given spiking activity. Thus, given ensemble spiking in each 50ÃÂ ms time window, we construct the probability distribution over t where t is the time relative to reward delivery. This analysis essentially asks: compared to ensemble activity at various times relative to reward, how much like that activity is the current set of spikes that we observe (e.g. at pauses at the choice point)? The results of this time decoding analysis are shown in Figure 8
.
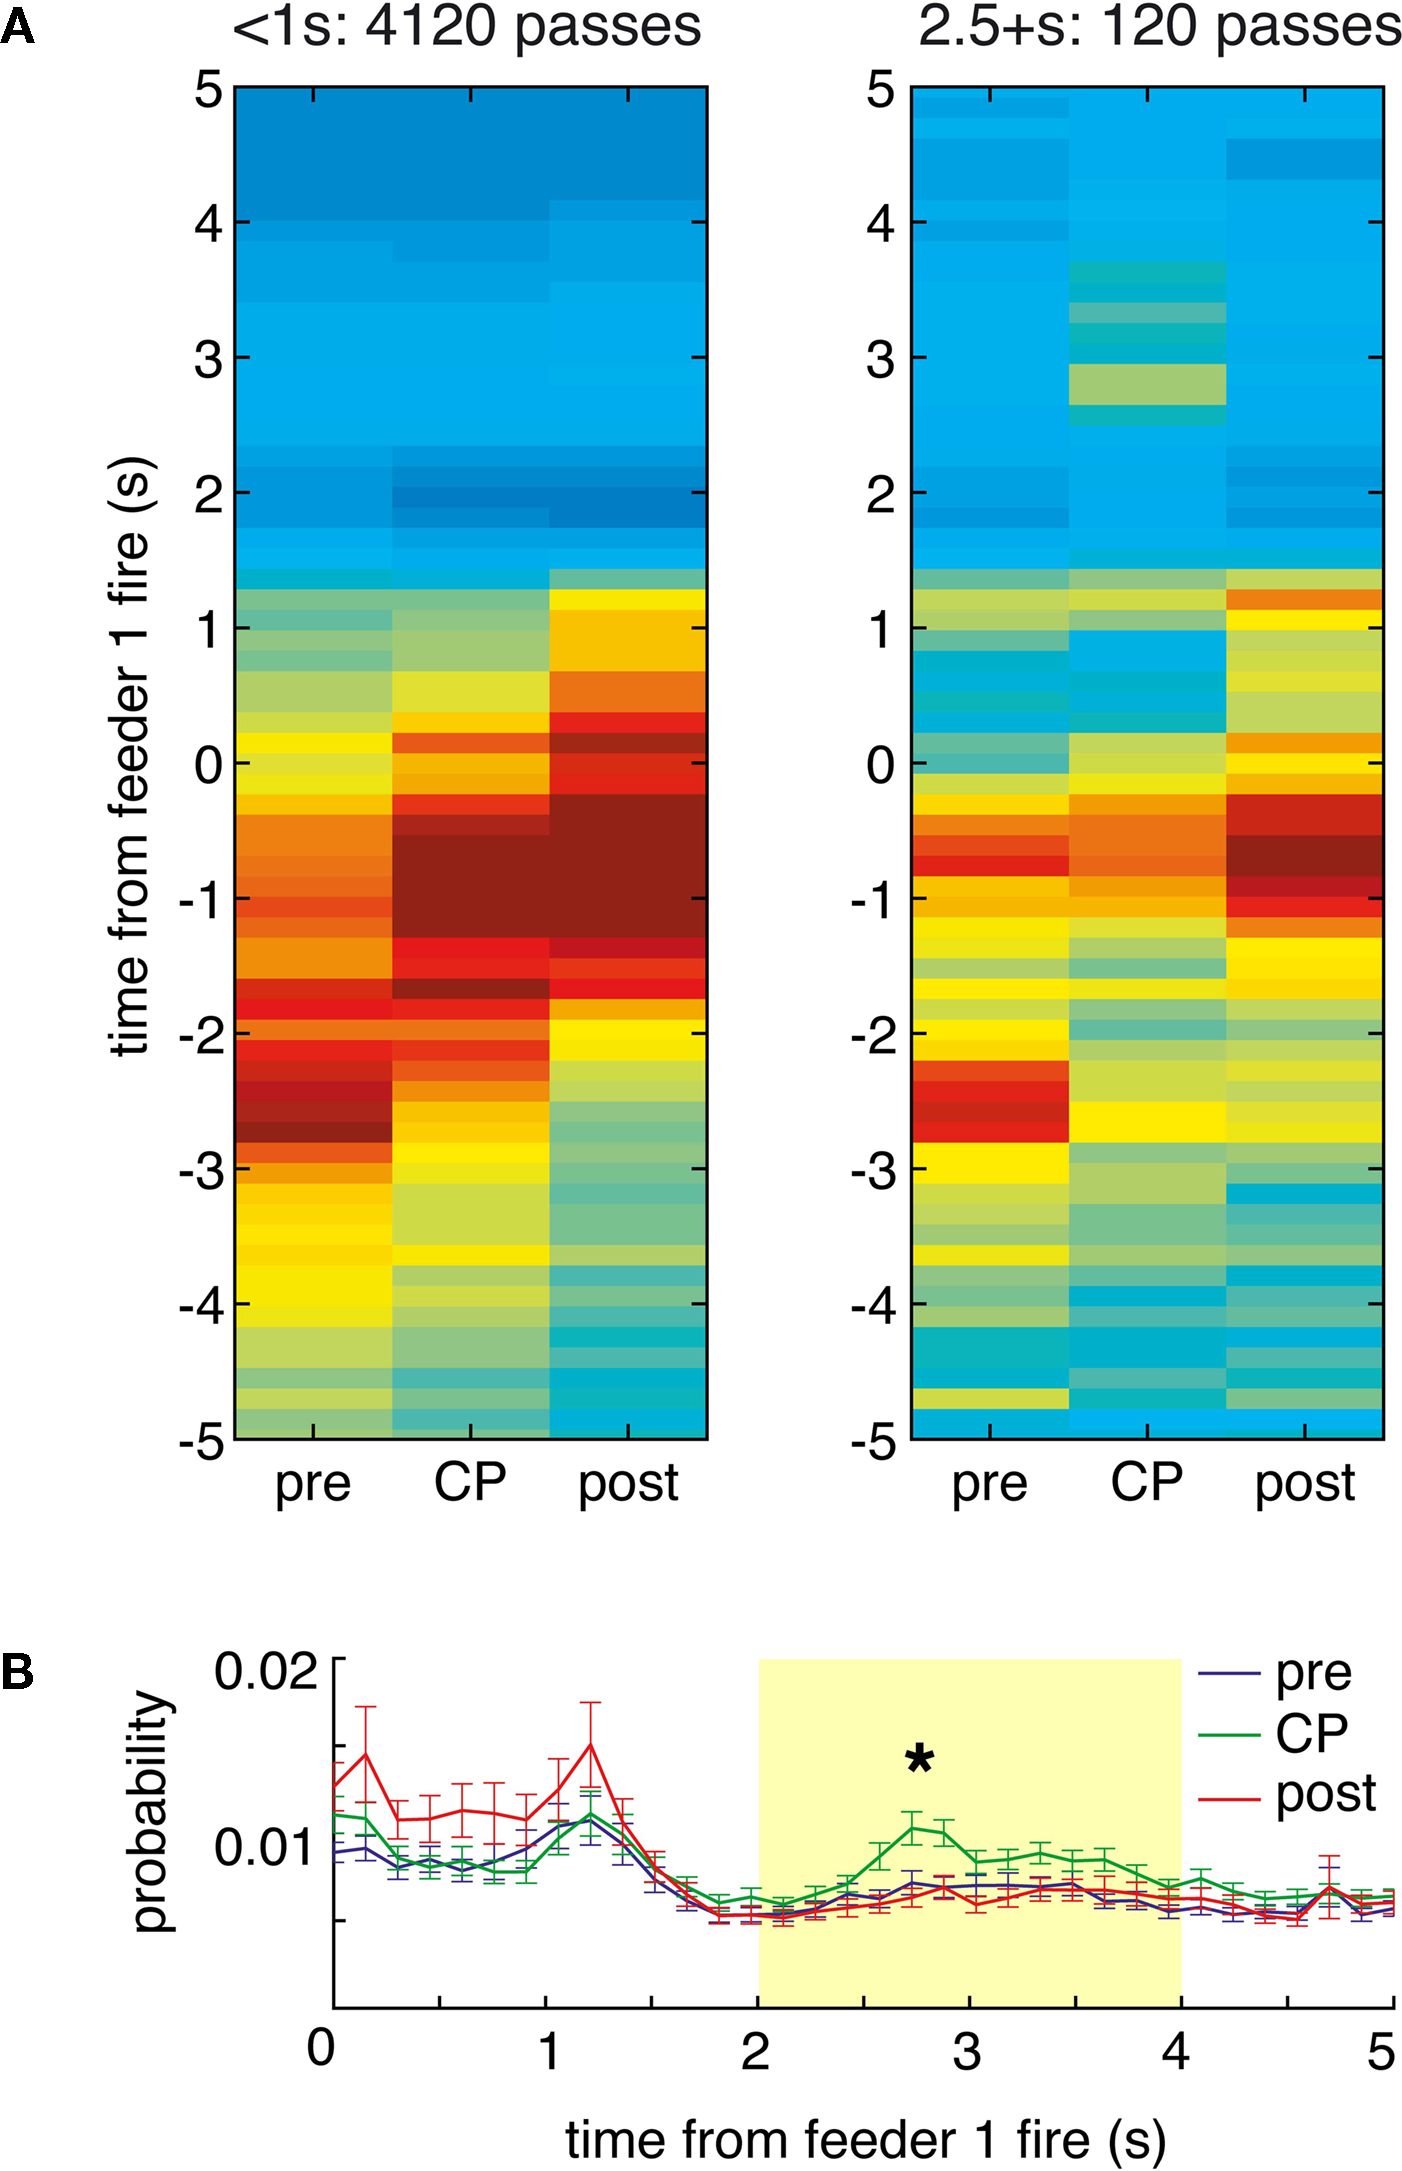
FigureÃÂ 8. Time at the choice point shows the specific time course of the increased feeder representation. (A) As in Figure 6
, passes through the final choice point (CP) were divided into short (left), and long (right). As expected, as rats passed through the choice point, the red high reconstruction probability in time advanced towards time 0, when food delivery at the first feeder was triggered. (Note that on average, rats arrived at the first feeder 1.6ÃÂ s after this time; see Figure 7
). For long passes, there was increased probability in the 2 to 4-s range (B).
Consistent with the results from the space decoding analysis, there was an increase in reward representation for pauses at the final choice point (Figure 8
A, right panel). Taking the average reconstruction probability over the 0 to 5-s post-feeder trigger time window of interest, there was an overall effect of time at the CP and pre/CP/post, as well as a significant interaction (two-way ANOVA, time at CP: FÃÂ =ÃÂ 12.87, p < 10−5; pre/CP/post: FÃÂ =ÃÂ 26.68, p < 10−10; interaction: FÃÂ =ÃÂ 3.95, pÃÂ =ÃÂ 0.0033). For long pauses at the CP, the actual time course of the posterior probability was differentially modulated depending on pre/CP/post (significant interaction, ANOVA FÃÂ =ÃÂ 1.82, p < 0.0001). When averaged over the 2ÃÂ to 4-s interval, there was increased reconstruction probability at the CP compared to before and after (ANOVA FÃÂ =ÃÂ 5.6, p < 0.004; Figure 8
B). As with the space decoding method, the long pause probability distribution was different from that obtained from shuffled interspike intervals and from linear combinations of this random distribution and pre, post, or short passes (least significant ANOVA: FÃÂ =ÃÂ 2.09, p < 0.0026).
Importantly, the time course of this increase, peaking at about 3ÃÂ s after the time of food pellet release (corresponding to about 1.5ÃÂ s after arrival at the reward location), is inconsistent with the distribution of departures from the feeder and movement speed (Figures 7
D,E). Over the time window of increased decoding probability at the choice point (2–4ÃÂ s after feeder fire) there is no correlation between the reconstructed temporal profile and the animals’ speed over the same time (rÃÂ =ÃÂ 0.06, pÃÂ =ÃÂ 0.53 for large ensembles). Furthermore, over the full 0 to 5-s profile there was a significant positive correlation with speed (rÃÂ =ÃÂ 0.21, p < 0.001). This is the opposite effect of what would be expected if increased reconstruction probability when pausing at the CP would be due to low speed. Interestingly, the peak in increased decoding at around 3ÃÂ s after reward delivery closely matched the time course of the overall reward response, particularly the late components (Figure 9
).
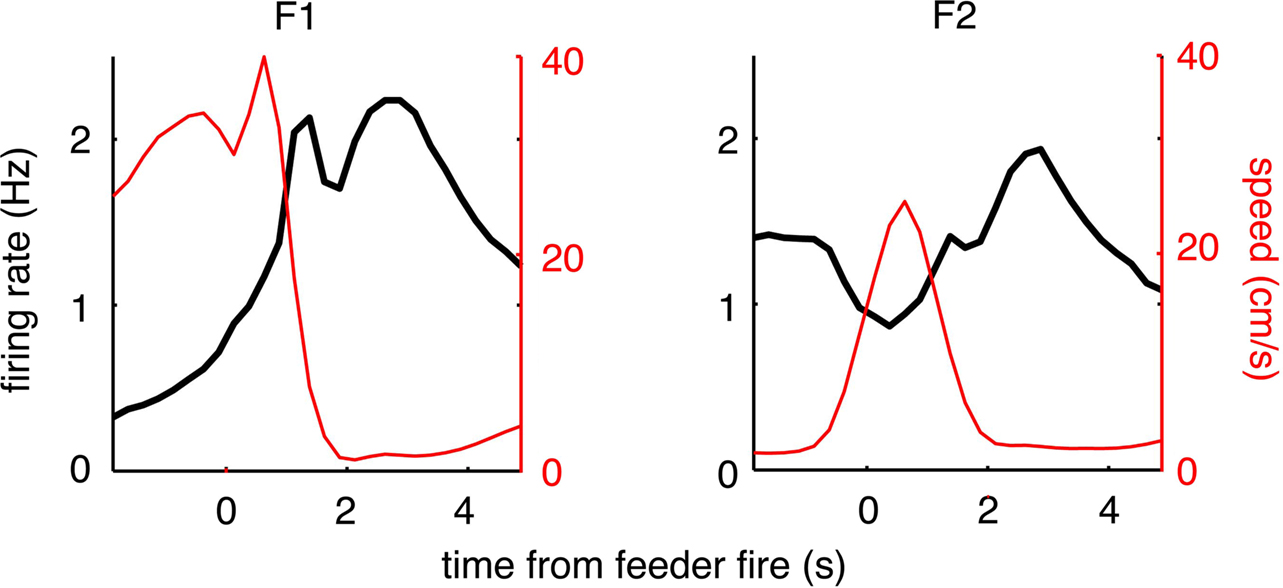
FigureÃÂ 9. Population reward response for all reward-responsive cells. At both reward locations a modulation in overall firing rate (black lines) was seen (left, feeder 1; right, feeder 2). The feeder 1 response appears to have two components to it: an early, sharp peak followed by a late, broader response. For feeder 2, the relative magnitude of these two responses was altered, such that the late, broad response dominates. Note how this late component does not appear to be related to instantaneous running speed (red line).
Decoding to Reward Locations is Increased During Error Correction
Hippocampal prospective activity is known to occur not just at the final choice point, but also at other locations, notably during error correction (Johnson and Redish, 2007
), suggesting that ventral striatal representations may also be non-local at such points. A plot of the probability of decoding to the feeders p(Feeders) as a function of location on the horizontal section of the final choice point (Figure 10
A) illustrates that while p(Feeders) is increased around the choice point during early laps, it also appears especially high on the non-rewarded side. Because rats were much more likely to reverse direction when moving to the non-rewarded side (i.e. after taking a wrong turn at the CP) than when moving to the correct side, we identified points in the rats’ path where during errors, they reversed direction back towards the idealized path. For 413 such reversal points the average value of p(Feeders) was plotted centered around the reversal point in time. As Figures 10
B,C show, p(Feeders) was increased around the turnaround point, and was significantly higher before turning around than after (ANOVA with before/after as factors, FÃÂ =ÃÂ 44.87, p < 10−10). Thus, ventral striatal representations of the feeder locations are increased during error correction, particularly before reversing.
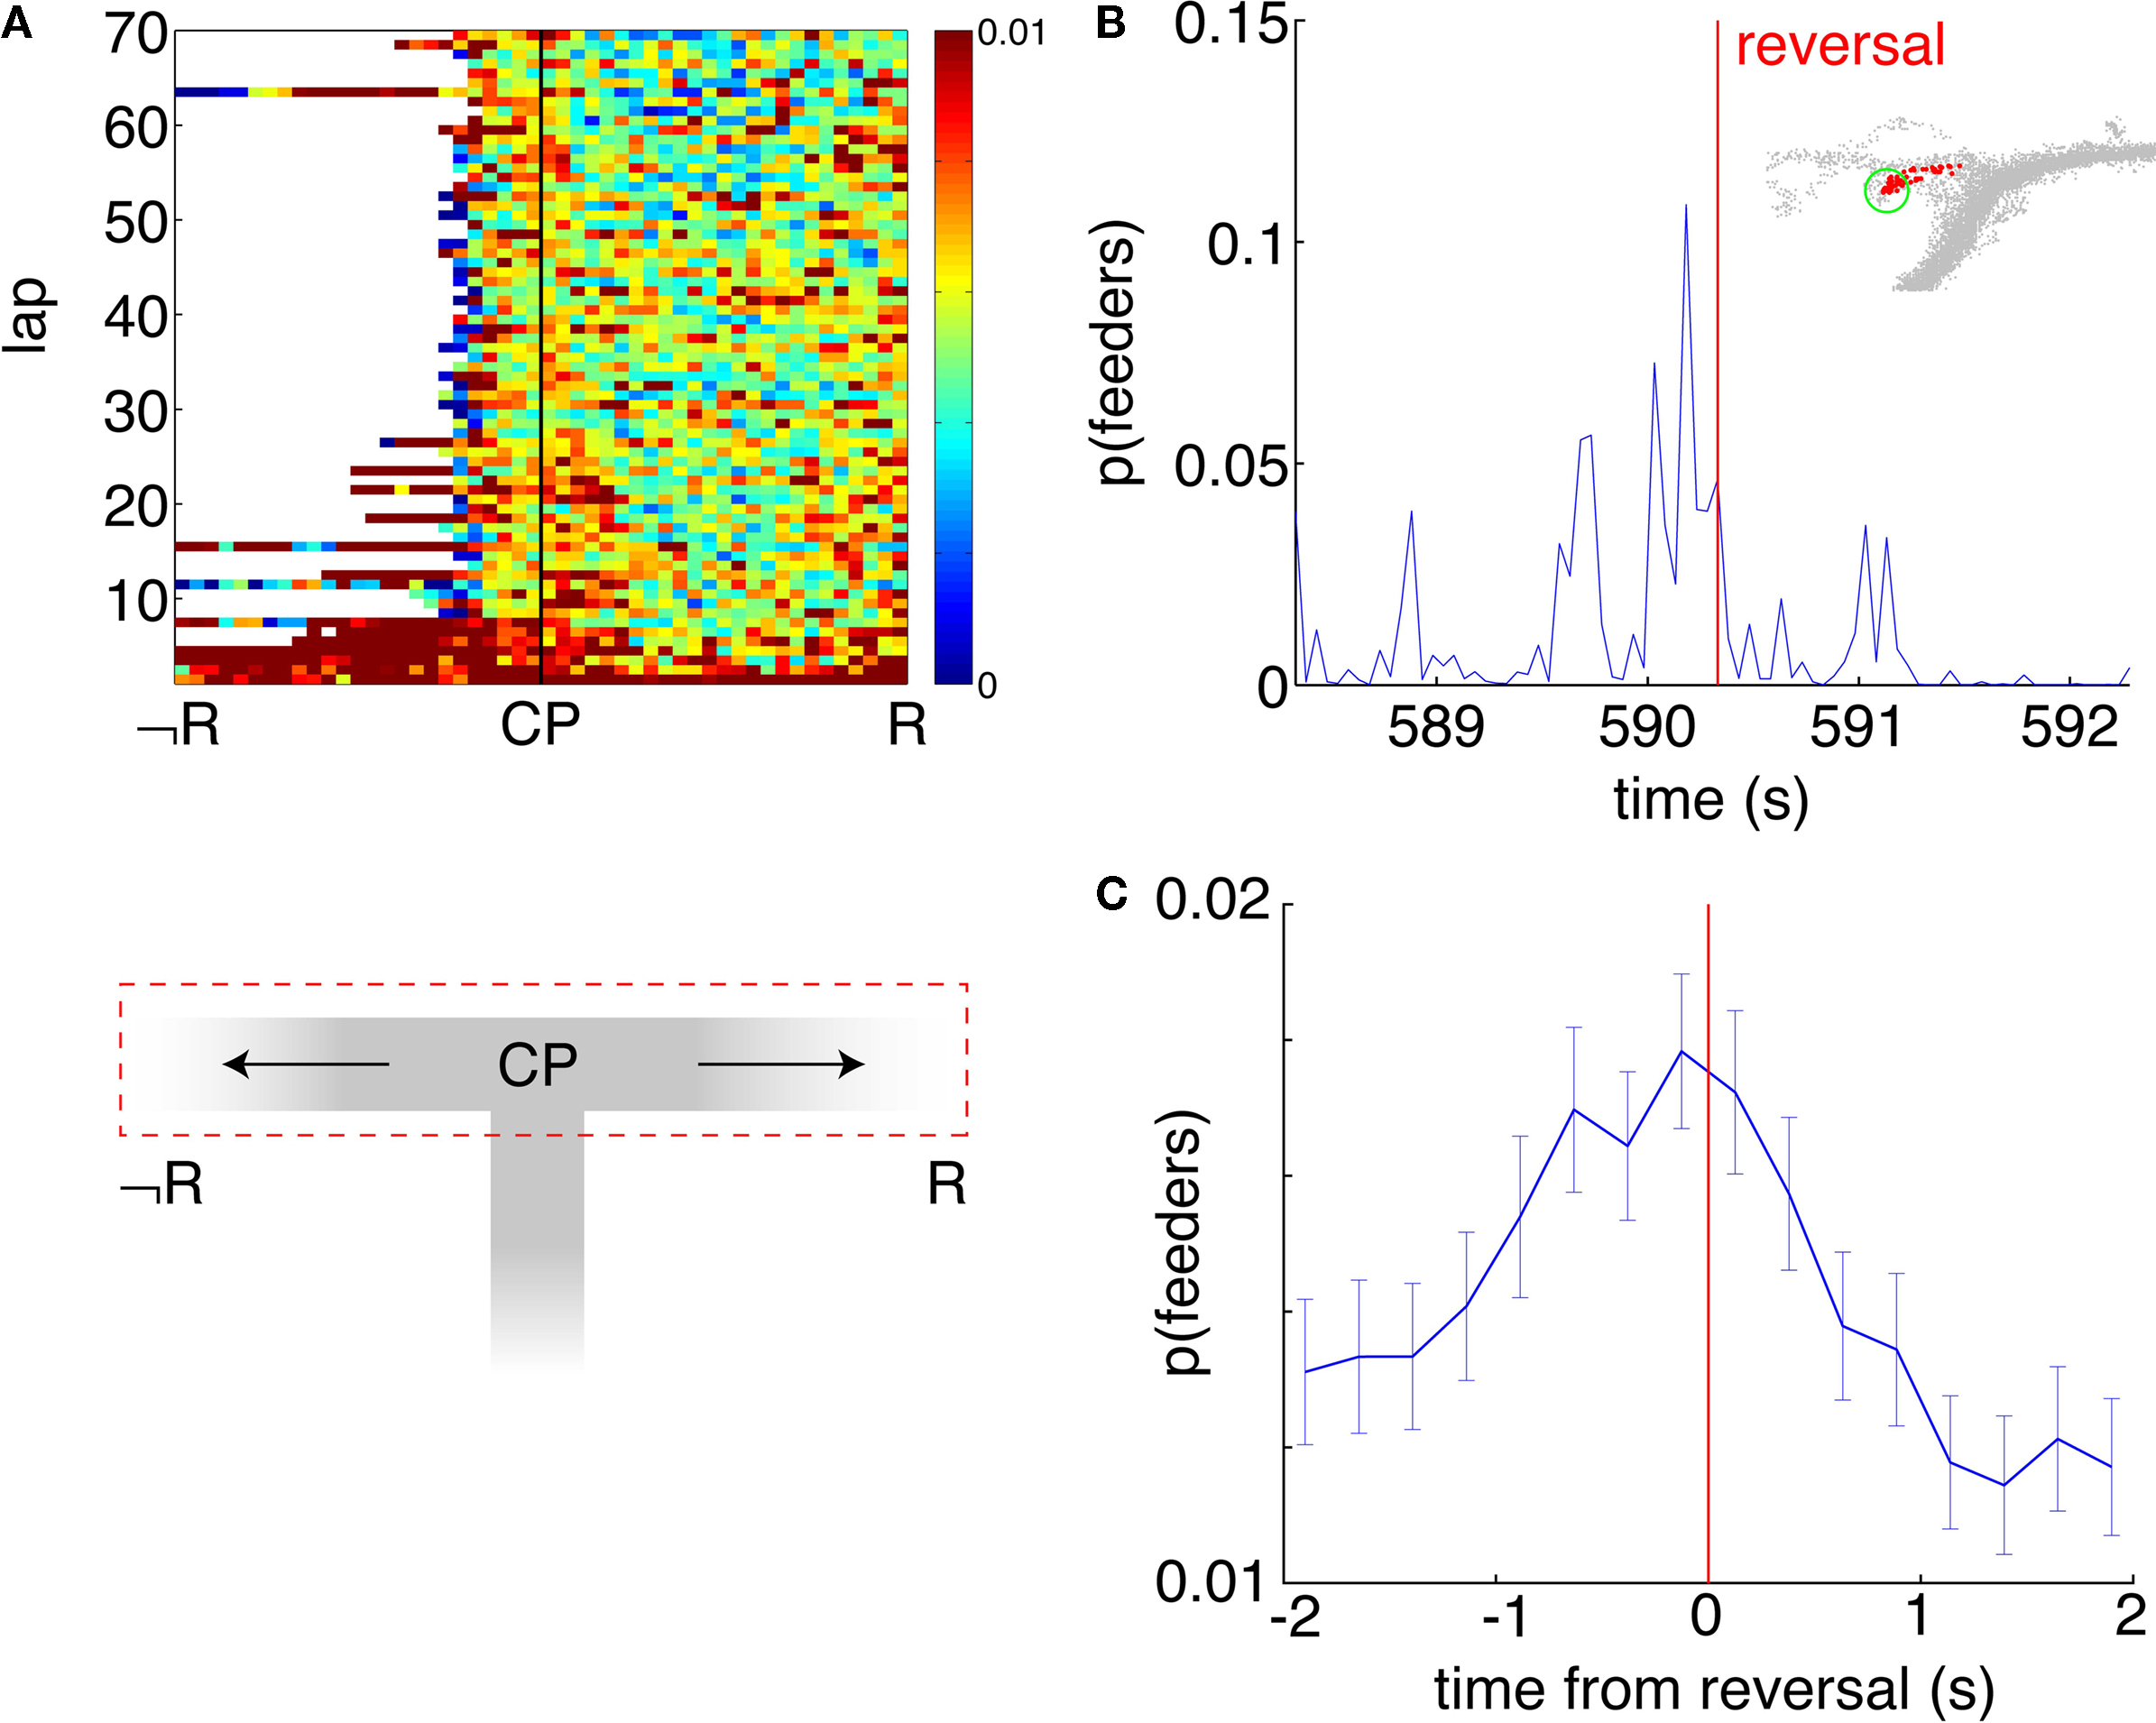
FigureÃÂ 10. Representations of reward sites are increased preferentially before error correction. (A) Average probability of decoding to the reward sitesÃÂ p(Feeders) as a function of lap and position on the final T (the area of theÃÂ mazeÃÂ indicated by the red dashed box, below). Sessions are aligned so thatÃÂ the rewarded side (R) is always on the right. p(Feeders) is increased at theÃÂ choice point (CP) during early laps, as well as on the non-rewarded side (R).ÃÂ Strong feeder representation on the non-rewarded side arises from a more general increase associated with reversals (B,C). (B) Example of p(Feeders) overÃÂ time around a reversal point (inset, green circle) indicated by the vertical redÃÂ line. Averaged over all reversal points, p(Feeders) is increased around theÃÂ reversal point, higher before than after [FÃÂ =ÃÂ 44.87, p < 10−6, (C)]. Errorbars areÃÂ S.E.M
.
We recorded neuronal activity from ventral striatum on a spatial decision task, and observed that the activity of many neurons with a clear reward response was not restricted to the reward sites alone: such neurons also tended to be activated, albeit to a lesser degree, at other locations. Examination of the structure in such “extra-field” spikes revealed that on average, reward-responsive cells, but not non-reward-responsive cells, increased their firing at the final choice point during early laps. More generally, ensemble decoding analyses revealed increased decoding probability to the reward sites as rats paused at the choice point, as well as during error correction. The time course of the increased reward firing and feeder reconstruction matched that of the rats’ pausing behavior and increase in performance, yet the two could be dissociated. As rats became more proficient at the task, increased reward activity at the choice point disappeared. These data suggest the presence of a reward-like signal in ventral striatum at points where decision-making processes occur, in the absence of reward in the environment.
Multiple-systems theories of decision-making posit the existence of a flexible “search” or “planning” system (Buckner and Carroll, 2007
; Daw et al., 2005
; Johnson et al., 2007
; Niv et al., 2006
; O’Keefe and Nadel, 1978
; Redish et al., 2008
; Schacter et al., 2008
) which relies on processing of situations or outcomes spatiotemporally distant from the present. While the scope and details of proposed implementations of this system depend on the specific behavior under consideration, common characteristics of such a planning system have emerged across different tasks and organisms. These include the use of information about outcomes, ranging from simple one-step associative links to complex model-based reasoning, integration of such outcome information with goals or motivational state (e.g. hunger or thirst), and engagement during early learning (Adams, 1982
; Daw et al., 2005
; Holland, 2004
; Niv et al., 2006
; Poldrack and Packard, 2003
). These properties contrast with those of “habit” or “cache” systems, thought to be gradually learned, inflexible, and based stimulus-response (S-R) associations. These two systems are supported by different mechanisms in the brain, a view supported by lesion and inactivation studies across different tasks (Packard and McGaugh, 1996
; Yin et al., 2004
). Non-local representations of reward in our data were most active during early learning and at the final choice point, This temporal and spatial specificity, as well as the observed pausing behavior, cannot be easily accomodated in a S-R framework. Instead, we suggest that our results reflect a component of the planning system. In order to be behaviorally useful, such flexible systems require both prediction of future states or outcomes, and evaluation of such states. Our finding of a covert reward signal activated during early learning is well situated in space and time to contribute to these predictions or their evaluation. While the magnitude of the observed non-local reward signal was small compared to responses to actual reward receipt, representations involved in the planning system are necessarily transient, self-initiated, and dynamic. Since our analyses averaged this putative signal over time and space, this difference in magnitude is not unexpected.
The fact that representations of reward at the final choice point disappear with stable performance may reflect a transfer of behavioral control to a different system. Such an interpretation is supported by the expression of pausing behavior at the choice point during early, but not late laps, previously described as vicarious trial-and-error (Hu and Amsel, 1995
; Johnson and Redish, 2007
; Muenzinger, 1938
), co-occurring with a rapid increase in performance. However, our task design did not permit us to directly assess, e.g. by a reward devaluation test, whether such a switch in control in fact occurred. The fact that reward representation at the final choice point was present during early laps might be interpreted as potentially inconsistent with learning mechanisms; however, it is important to note that when recording data was taken, rats were extensively trained on general structure of the task (even though specific maze configurations could be novel). Thus, even though the reward location could change on a session-to-session basis, the early presence of the choice point reward representation might reflect structural learning (Tenenbaum et al., 2006
; Tse et al., 2007
).
Previous recording studies have shown that ventral striatal neurons learn to respond to cues predictive of reward (Roitman et al., 2005
; Setlow et al., 2003
); however, the transient reward signal occurring at decision points reported here cannot be explained in this way. While the choice point itself might be considered a cue, there are other points presumably equally or more predictive of reward, such as the space between the choice point and the rewarded sites, where no increased reward signal was seen. Furthermore, instead of gradually developing a reward response to a predictive cue which then remains stable (Roitman et al., 2005
; Setlow et al., 2003
), the signal we observed showed the opposite pattern: it was prominent during early learning and faded with experience.
An alternative is that this signal could reflect something akin to a reward prediction error (Niv and Schoenbaum, 2008
; Schultz et al., 1997
), a suggestion in line with human imaging data (Knutson and Cooper, 2005
; O’Doherty et al., 2004
; but see Hare et al., 2008
). Such a signal would be expected to respond first to reward, and later to the first reward-predictive cue, without responding to cues closer to reward. We find this explanation unlikely, because the responses to actual reward delivery persisted with time, even after those at the choice point vanished. Additionally, while ventral striatum has access to such a signal through inputs from the ventral tegmental area, to our knowledge, prediction error signals in ventral striatum have not been documented electrophysiologically.
A different alternative explanation for the observed reward representation at decision points could rely on an interaction of reward activity evoked by reward-predictive cues and attentional processes modulated by some form of behavioral state, such as deliberation or uncertainty. In such a model, the animal would only attend to reward-predictive cues when engaged in deliberative decision-making, causing neurons that fire to those cues to become active. While it is difficult to discount this possibility as an explanation for the extra reward activity at the final choice point specifically, it is clear that typical reward neurons exhibit “extra-field” activity at many different points on the maze, when the animal is facing widely varying directions (such as in the examples in Figure 4
). This observation is reinforced by the ensemble decoding data which shows an increase in feeder representation at turnaround points at various locations on the maze (Figure 10
). In any case, even if this interpretation did turn out to be correct, our results document an interaction between reward-responsive cells and processes engaged during decision-making, showing that responses to reward-predictive cues are more dynamic than previously thought.
Recording studies on spatial tasks have found anticipatory firing inÃÂ ventral striatum, such as activity before reaching a goal site (Martin and Ono, 2000
) or preceding specific goal-directed movements (German and Fields, 2007
). These studies are consistent with our data, but our data goes beyond these previous findings by establishing that (a) ventral striatal representations of reward can be non-local and distinct from specific predictive cues, and (b) this signal matches the spatial (specific to decision points) and temporal (disappearing with automation) profile expected of participation in planning processes. Interestingly, Lansink et al. (2008)
found that reward-responsive cells in ventral striatum are preferentially re-activated during “off-line” processing; our results extend this apparently privileged position to processing during active decision-making.
While our analysis emphasizes reward-related activity at the final choice point, we do not claim that flexible decision-making processes are engaged at this point exclusively. The structure of our task may lend special relevance to the final choice point, but planning may occur at other points on the maze as well. In agreement with the hippocampal recording data from (Johnson and Redish, 2007
), we found increased reward representation during error correction, and it seems likely that a variety of circumstances can give rise to the deployment of flexible strategies. This might explain the observation that during long pauses at the choice point, representation of the reward locations appears to be higher than that on short passes even before the choice point is entered. On laps that contain those long pauses, the animal is likely to engage in planning at other points as well. AÃÂ similar point relates to the question of whether the reward signal we report is selectively or differentially apparent on correct and incorrect trials. Because errors almost exclusively occurred during early learning, when animals exhibited pausing behavior and extra reward activity was observed, an overall correlation between reward representation and a behavioral error is likely. It would be a mistake, however, to conclude that increased representation of reward causes errors. Successful planning involves the integration of specific outcomes and their evaluations; in this light, valuable future experiments would involve dual-structure recordings addressing the relative timing and contents of reward signals and outcome representations.
A potential confound in our data is the correlation between reward cells being active and the animal being paused. As animals show an increased tendency to pause at the final choice point during early laps and during errors, simple “pausing cells” might explain our observations. The critical distinction to be made is whether the putative non-local signal represents pausing or low speed, or alternatively, is merely preferentially activated at low speeds, as would be expected from decision-making processes. Two main results argue in favor of the second possibility. First, many reward-related cells responded to only one, but not the other, reward location, thus excluding any motoric behavioral cause; yet these cells still showed extra activity at the choice point. Second, the temporal profile of the ensemble representation during pauses at the choice point was not compatible with the time course of speed and movement initiation at the feeders. Instead, ensembles during pauses at the choice point showed increased representation consistent with the late component of the reward response, which was particularly strong at the second reward location. This could also explain why the spatial decoding method showed the strongest increase in decoding to the second reward location. Similarly, while the observed representation of reward at the choice point during early laps is necessarily correlated with rats being uncertain about the location of reward, this signal is unlikely to code for uncertainty in any straightforward manner, as evidenced by their responses to actual reward receipt.
Anatomically, ventral striatum is well-positioned to influence action selection based on flexible representations from hippocampus and frontal cortical areas (Mogenson et al., 1980
). Ventral striatum receives inputs from the hippocampal formation through the subiculum (Finch, 1996
; Groenewegen et al., 1987
; Voorn et al., 2004
) and fast-timescale firing patterns in hippocampus affect ventral striatal activity (Martin, 2001
; Pennartz et al., 2004
). Thus, a possible source for the observed non-local signal in ventral striatum might be prospective coding in the hippocampus (Johnson and Redish, 2007
). While a lesion study could test this possibility, things may not be that simple, given that hippocampal lesions do not appear to impair sensitivity to devaluation (Chudasama et al., 2008
; Corbit et al., 2002
). This suggests that if ventral striatal non-local reward signals contribute to simple goal-directed instrumental responding (Cardinal et al., 2002
; Corbit et al., 2001
), they do not require hippocampal input. However, as a site of anatomical convergence, ventral striatum also has access to relevant representations in orbitofrontal cortex and the amygdala (Schoenbaum et al., 2006
); alternatively, flexible behavior on spatial and instrumental tasks may be supported by different mechanisms.
Functionally, extensive evidence links ventral striatum to a role in mediating the behavioral impact of motivationally relevant stimuli (Cardinal et al., 2002
; Day and Carelli, 2007
; Nicola, 2007
). Recording and lesion studies suggest that this role might be supported by general affective properties of cue-predicted outcomes (Nicola et al., 2004
; Roitman et al., 2005
; Setlow et al., 2003
; Wheeler et al., 2008
); future work could address whether the observed covert reward signal in our data relaties to general affective information, or contains outcome-specific information. As argued above, reward representation during pausing in early, but not late, learning suggests involvement in flexible “planning” processes. Lesion experiments on behaviors that can be shown to require such processes, such as sensitivity to reward devaluation in instrumental tasks, have yielded conflicting evidence for the role of ventral striatum (Corbit et al., 2001
; de Borchgrave et al., 2002
). Deficits after ventral striatum lesions have been found on a variety of other spatial and instrumental tasks (Atallah et al., 2007
; Block et al., 2007
; Floresco et al., 1997
; Salamone et al., 2005
; Sutherland and Rodriguez, 1989
). While these results are broadly consistent with a role for ventral striatum in rapid early learning and/or changing conditions, these studies did not focus on the representations that might support such a role. Further work could address how the observed representation of reward at decision points changes with task demands, how it relates to behavior, and how it is integrated with other aspects of decision-making.
In summary, we report ventral striatal representations of reward active at the final choice point and before error correction on a spatial decision task. This expectation-of-reward signal at decision points was apparent at both the single cell and the ensemble level, and vanished with behavioral automation. The signal we observed was prominent during early learning and faded with experience. Therefore, we conclude that the increased reward representations reported here are not simply reflecting learned cue-associations, unless internally generated possibilities constitute the cue, a position closer to cognition than stimulus-response (Hebb, 1949
; Johnson et al., 2009
). We suggest that the observed non-local reward signal may contribute to flexible decision-making or planning, a view consistent with the observed pausing behavior and non-local representations in hippocampus (Johnson and Redish, 2007
).
The authors declare that the research was conducted in the absence of any commercial or financial relationships that could be construed as a potential conflict of interest.
We are grateful to John Ferguson, Anoopum Gupta, Jadin Jackson, Adam Johnson, Neil Schmitzer-Torbert, and the members of the Center for Cognitive Sciences for discussion, and to Chris Boldt for technical assistance. We thank the referees for their constructive comments on an earlier version of the manuscript.
Parkinson, J. A., Dalley, J. W., Cardinal,ÃÂ R.ÃÂ N., Bamford, A., Fehnert,ÃÂ B., Lachenal,ÃÂ G., Rudarakanchana, N., Halkerston,ÃÂ K.ÃÂ M., Robbins, T. W., and Everitt, B. J. (2002). Nucleus accumbens dopamine depletion impairs both acquisition and performance of appetitive pavlovian approach behaviour: implications for mesoaccumbens dopamine function. Behav. Brain Res. 137, 149–163.