Center for Neuroscience, University of California, Davis, CA, USA
Periodic activity patterns or oscillations within the gamma frequency band (20–80 Hz) have been implicated in sensory processing and cognition in many areas of the cerebral cortex, including primary visual cortex (V1). Although periodic activity appears to be a hallmark of cortical neurons, little is known about the dynamics of these activity patterns as signals progress within local cortical circuits. This study compares the strength of periodic activity between neurons in the input and output stages of cortical processing – neurons in layers 4 and 6 – of V1 in the alert macaque monkey. Our results demonstrate that while both populations of neurons display significant gamma-band activity, this activity increases from the input to output layers of the cortex. These data suggest that local cortical circuits enhance periodic activity within a cortical area.
Correlated patterns of activity within and between cortical neurons are among the more robust phenomena in the cerebral cortex (see for review Bartos et al., 2007
; Engel et al., 2001
). While specific patterns of oscillatory activity have long been associated with different states of alertness (Steriade, 2001
), more recent studies have suggested a role for specific temporal patterns of correlated activity in sensory processing and cognition (Friedman-Hill et al., 2000
; Fries et al., 2001
; see for review Womelsdorf and Fries, 2007
). Neurons in primary sensory areas of the cortex, such as primary visual cortex (V1), display increased oscillatory activity in the gamma frequency band during the coding of visual stimuli (see for review Berens et al., 2008
). Visual cortical neurons also display increased gamma-band activity with spatial attention (Womelsdorf and Fries, 2007
). While these studies highlight the prevalence of periodic activity patterns across cortical areas, little is known about how these patterns of activity vary across the local circuit architecture within a cortical area. Here, we address this question by examining on-going activity patterns among neurons located at the input and output stages of V1.
In V1 of the macaque monkey, inputs from the lateral geniculate nucleus (LGN) of the thalamus terminate primarily on neurons in layer 4C (see for review Callaway, 2005
). Visual information is then processed by a rich network of intrinsic connections along a serial progression from layer 4C to layer 2/3, layer 5 and layer 6 (see for review Callaway, 2004
; Sincich and Horton, 2005
). Layer 6 neurons then provide a feedback projection to the LGN, which serves to complete a reciprocal loop of information exchange between thalamus and cortex (see for review Briggs and Usrey, 2008
). Although this scheme for cortical circuitry is greatly oversimplified, layer 4C neurons clearly represent neurons at the earliest stages of cortical processing while layer 6 neurons represent neurons at much later stages of processing (Briggs and Callaway, 2001
; Callaway, 2004
; Sincich and Horton, 2005
). We therefore targeted these two groups of neurons in the alert macaque monkey for comparison of their periodic activity patterns. Our results reveal significant gamma-band activity both in layer 4C and layer 6. More importantly, the strength of this activity is significantly greater among layer 6 output neurons than layer 4C input neurons, suggesting that on-going correlated activity is shaped by the local cortical architecture of V1.
Two adult male macaque monkeys (Macaca mulatta) were used in this study. All surgical and experimental procedures conformed to NIH guidelines and were approved by the UC Davis Institutional Animal Care and Use Committee.
Surgical Preparation and Behavioral Training
Surgical procedures were performed as previously described (Briggs and Usrey, 2007a
, 2009
). Animals were trained to perform central fixation for juice rewards. The fixation target was a small (0.2°) spot on a Sony monitor (Tokyo, Japan) with a refresh rate of 140 Hz and a mean luminance of 38 cd/m2. The monitor was located 700 mm in front of the animal. There were no visual stimuli present on the monitor besides the central fixation spot, which was well beyond the receptive fields of recorded neurons (average eccentricity ∼4°). The monitor was the only source of illumination in an otherwise dark room. For 30% of the recordings, the monitor was turned off and animals were allowed to move their eyes in the dark.
Neuronal Identification and Data Acquisition
Single-unit responses of V1 neurons were made with platinum-in-glass electrodes (Alpha Omega, Israel) and stored to a computer equipped with a Power 1401 data acquisition system and Spike2 software (Cambridge Electronic Design, Cambridge, UK). V1 neurons that received direct LGN input or provided feedback output to the LGN were identified by orthodromic or antidromic activation following electrical stimulation in the LGN. As previously described (Briggs and Usrey, 2007a
, 2009
) single platinum/iridium stimulating electrodes (FHC, Bowdoin, ME) were semi-chronically implanted within the parafoveal region of the LGN (∼4° eccentricity) spanning both parvocellular and magnocellular layers. Stimulating electrodes were positioned within 2° of retinotopic alignment to recording electrodes in V1 and care was taken to ensure that the exposed tip of the stimulating electrode (<1 mm) was contained within the LGN to avoid inadvertently stimulating axons of passage outside the LGN. The stimulating electrode was connected to an AM systems isolated pulse stimulator (Carlsborg, WA, USA) which delivered a brief, biphasic shock (0.2 ms, ∼100 mV) in two modes: non-collision mode where shocks were delivered at 0.2 Hz and collision mode where shocks were triggered to occur within 1 ms of a spontaneous spike from the recorded cortical neuron. Using these methods, we identified and distinguished cortical neurons that received direct input from the LGN and cortical neurons that provided feedback axons to the LGN.
While non-collision mode was used to identify cortical neurons that faithfully followed electrical stimulation either by orthodromic or antidromic propagation of spikes, collision mode was used to distinguish neurons that received feedforward input from the LGN from those that provided feedback output to the LGN. This distinction was based on the principle that a spontaneous spike occurring in a feedback neuron placed the axon of that neuron in a refractory state such that an electrically evoked antidromic spike triggered during collision-mode stimulation could not reach the cortex. In contrast, a synapse separated input-recipient neurons from their LGN inputs, thus rendering a spontaneous spike ineffective in blocking the orthodromic propagation of spikes triggered during collision-mode stimulation. Accordingly, a cortical neuron that responded to electrical stimulation during both the non-collision and collision modes of stimulation was classified as an input neuron, while a neuron that responded to electrical stimulation during the non-collision mode and failed to respond during collision mode was classified as an output neuron (see Briggs and Usrey, 2005
, 2007a
,b
, 2009
; Harvey, 1978
; Swadlow and Weyand, 1981
, 1987
; Tsumoto and Suda, 1980
).
Orthodromic and antidromic activation latencies were measured as the time between electrical stimulation of the LGN and the evoked cortical spike. In 10 of 58 corticogeniculate neurons, we also detected monosynaptic feedforward input from the LGN (see Briggs and Usrey, 2007a
, 2009
). Because these neurons were located within layer 6 along with the rest of the corticogeniculate population – and thus subjected to the same types of local cortical inputs – we included this subset of neurons with the rest of the corticogeniculate population for our analyses. Importantly, these neurons did not differ significantly from the rest of the corticogeniculate sample in terms of their gamma-band activity.
Data Analysis
Data from the two groups of neurons, layer 4C input neurons and layer 6 output neurons, were first separated based on whether recordings were made while animals performed a fixation task on an otherwise blank monitor, or while the animals were free to move their eyes in a dark room. For each group of neurons, there were no significant differences in either the gamma-band power or the gamma-indices (described below) calculated from trials where animals were fixating compared to trials where animals were allowed to move their eyes in the dark. Consequently, data from these trials were pooled within each group (input and output neurons) for subsequent analyses.
For each neuron in our sample, power spectral density functions were calculated as previously described (Briggs and Usrey, 2007b
; Friedman-Hill et al., 2000
). First, continuous records of spiking responses were parsed into 4-s windows at a resolution of 1 ms. Individual autocorrelograms and shuffle correlograms of spiking activity were then made for each window of data. Autocorrelograms were calculated by correlating spikes within the 4-s window; shuffle correlograms were calculated by correlating spikes from a given 4-s window with spikes from a randomly selected 4-s window from the same neuronal recording. Cumulative autocorrelograms and cumulative shuffle correlograms were then calculated by summing together the correlograms of each type for each neuron. Only neurons with sufficient numbers of spikes in their cumulative autocorrelogram (>10 spikes/s per bin) were used for further analysis. Cumulative autocorrelograms and shuffle correlograms were then normalized to the peak response in the cumulative autocorrelogram. Fast-Fourier transforms were performed on the cumulative autocorrelograms and shuffle correlograms and power spectral density functions were estimated for each dataset by calculating the complex conjugate of the FFT. Gamma-band activity (20–80 Hz) was quantified using a gamma-band index:
Gamma-band index = (gammaA − gammaS)/(gammaA + gammaS)
where gammaA is the area-under-the-curve for power in the gamma-band for the autocorrelogram and gammaS is the area-under-the-curve for power in the gamma-band for the shuffle correlogram. To ensure that gamma-band index values were not dependent on the window size (4 s) used for calculating correlograms, the analysis described above was repeated using 2- and 3-s windows. Results from this analysis were not significantly different from those using 4-s windows (data not shown).
We recorded single-unit activity from two populations of neurons located in the input and output layers of primary visual cortex (V1) of two alert macaque monkeys. Our goal was to compare the strength of gamma-band activity between neurons located at different levels of the local cortical architecture. Using two modes of electrical stimulation in the LGN (see “Materials and Methods”), we identified 39 input neurons that were post-synaptic to geniculocortical afferents and 58 output neurons that provided corticogeniculate feedback to the LGN. These neurons differed significantly from each other in their distributions of electrically evoked activation latencies (Figure 1
; p = 1.7 × 10⁻⁸, Rank sum test; input neuron orthodromic latency: mean = 3.2 ± 0.3 ms, median = 2.8 ms, range = 1.2–7.5 ms; output neuron antidromic latency: mean = 10.3 ± 1.1 ms, median = 7 ms, range = 1.4–35 ms).
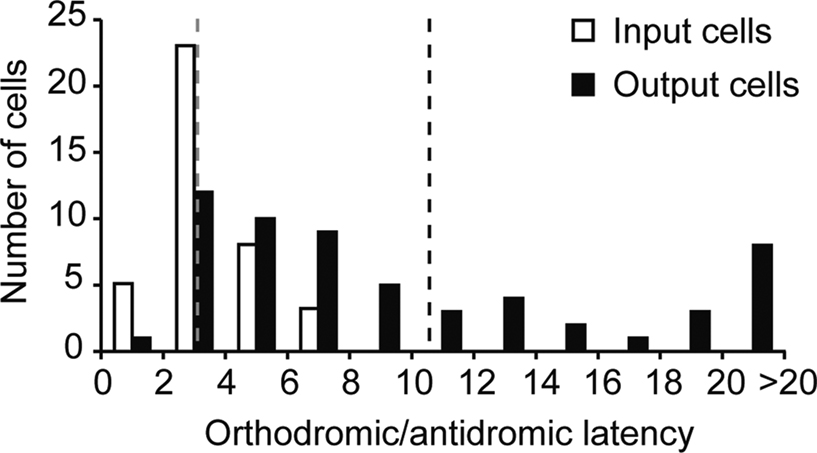
Figure 1. Distribution of orthodromic and antidromic activation latencies for input and output neurons. Orthodromic activation latencies for input (geniculocortical-recipient) neurons are indicated with open bars, mean orthodromic latency illustrated by dashed grey line. Antidromic activation latencies for output (corticogeniculate) neurons are indicated with black bars, mean antidromic latency illustrated by dashed black line.
In order to determine the strength of gamma-band activity for input and output neurons, we first calculated cumulative autocorrelograms and shuffle correlograms for each neuron and then performed a fast-Fourier transform on these correlograms to generate power spectra (see “Materials and Methods”). Individual examples of auto- (red) and shuffle (blue) correlograms for a representative input and output neuron are shown in Figure 2
A. Figure 2
B shows the average power spectra for our sample of input and output neurons.
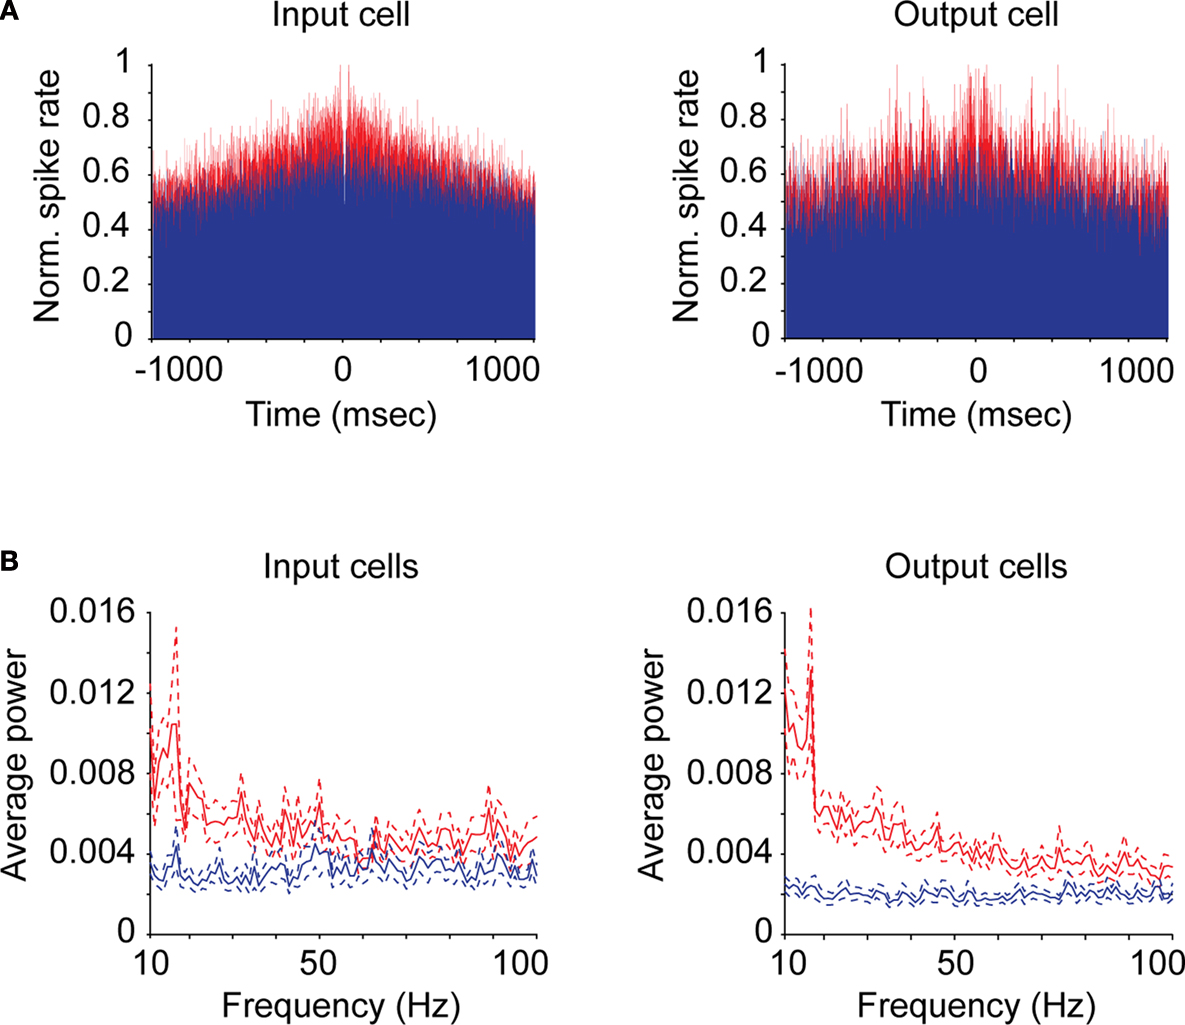
Figure 2. Correlograms and power spectra for input and output neurons. (A) Cumulative autocorrelograms (red) and shuffle correlograms (blue) for representative individual input (geniculocortical-recipient) and output (corticogeniculate) neurons. (B) Average power spectra between 10 and 100 Hz for all input and output neurons generated from autocorrelograms (red) and shuffle correlograms (blue). Dashed lines represent standard errors above and below the mean.
Autocorrelograms for both the input and output groups of neurons contained significantly greater power across the gamma-band compared to shuffle correlograms, indicating that significant gamma-band activity is present at the input and output stages of cortical processing (Figure 2
B, red versus blue, respectively; p < 1 × 10⁻¹⁰, Kruskal–Wallis test). Significant differences between autocorrelogram and shuffle correlogram data were also observed for power in the beta frequency band (10–20 Hz) for both input and output groups of neurons (Figure 2
B; p < 8 × 10⁻⁸, Kruskal–Wallis test).
Interestingly, the relative difference in the power spectra for auto- and shuffle correlogram data appeared to be greater for output neurons compared to input neurons, especially at frequencies in the high-gamma range (>50 Hz). We therefore set out to examine the relative contributions of gamma-band activity in autocorrelogram versus shuffle correlogram data.
To compare relative gamma-band activity across input and output neurons, we first compared the integrals of autocorrelogram and shuffle correlogram power spectra between 20 and 80 Hz for each individual neuron. Consistent with results from the population averages, nearly all input and output neurons displayed increased power in the gamma-band for autocorrelogram versus shuffle correlogram data (Figure 3
A). We next calculated a gamma-band index (see “Materials and Methods”) for each neuron in our sample. Across the two neuronal populations, output neurons displayed significantly greater relative gamma activity, as illustrated by higher gamma-band indices, compared to input neurons (Figure 3
B; p = 0.02, Rank sum test; mean gamma-band index for input cells = 0.31 ± 0.05, median = 0.2; mean gamma-band index for output cells = 0.42 ± 0.04, median = 0.4). This difference in relative gamma-band activity was not due to differences in mean firing rate, as mean firing rates for the input and output neurons in our sample were not significantly different (19.0 ± 2.1 spikes/s versus 22.2 ± 2.7 spikes/s, respectively; p = 0.9, Rank sum test). Finally, we calculated the difference between auto- and shuffle correlogram power spectra in the gamma-band for input and output populations and plotted these values as cumulative differences across frequencies (Figure 3
C). By about 30 Hz, the two curves begin to separate and this trend increases at higher frequencies up to 80 Hz suggesting that the difference between relative gamma contributions to input and output neurons is more pronounced at frequencies above 30 Hz (Figure 3
C).
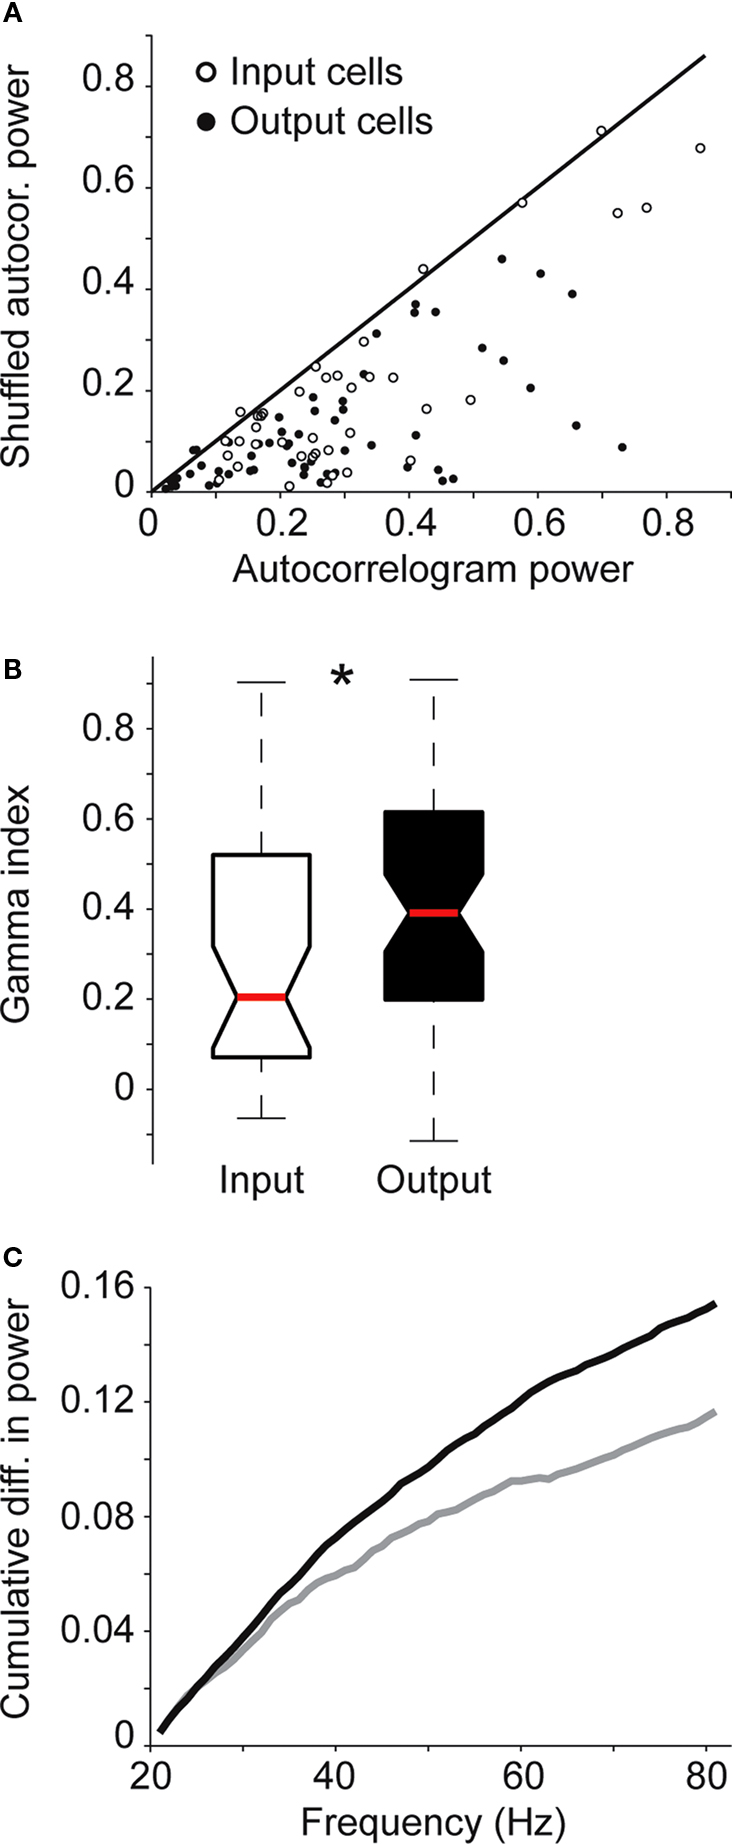
Figure 3. Relative power in the gamma-band for input and output neurons. (A) Comparison of integrals of power in the gamma-band (20–80 Hz) from autocorrelogram and shuffle correlogram data for the sample of input (open circles) and output (filled circles) neurons. (B) Relative gamma-band activity index for input (open box) and output (black box) neurons. Red bars represent medians. Asterisk indicates that gamma-band indices for output neurons were significantly greater than those for input neurons (p = 0.02, Rank sum test). (C) Cumulative plots of the difference between integral values from power spectra in the gamma range from population-averaged autocorrelogram and shuffle correlograms for input (grey) and output (black) populations.
Our goal was to determine whether temporal correlations in on-going activity differ across distinct populations of cortical neurons located at different levels of the local cortical architecture. To address this question, we identified neurons in V1 that either received input from the LGN or provided corticogeniculate output to the LGN. When we examined the temporal correlations in the on-going spiking activity of these two neuronal populations, we discovered that (1) both input and output level V1 neurons exhibit significant activity in the beta and gamma frequency ranges, and (2) relative gamma-band activity is significantly greater in output neurons compared to input neurons. These results suggest that local cortical circuits enhance temporal correlations in specific frequency bands for individual V1 neurons. In the sections below, we discuss details of our neuronal identification technique, possible mechanisms for enhanced correlated activity across local cortical circuits, and the functional implications of these findings for sensory processing.
Technical Details
Electrical stimulation has been widely used over the past 30 years to identify cortical neurons that receive direct input from the LGN as well as neurons that send feedback axons to the LGN (Briggs and Usrey, 2005
, 2007a
,b
, 2009
; Bullier and Henry, 1979a
,b
, 1980
; Grieve and Sillito, 1995
; Harvey, 1978
; Swadlow and Weyand, 1981
, 1987
; Tsumoto and Suda, 1980
). Following an electrical shock to the LGN, spikes propagate to the cortex along the axons of LGN neurons (orthodromic propagation) and the axons of layer 6 feedback neurons (antidromic propagation). As a consequence, orthodromic spikes drive monosynaptic responses from cortical neurons that receive input from the LGN and antidromic spikes drive responses from cortical neurons that project to the LGN. Using extracellular recording techniques, these two classes of neurons (layer 4 and layer 6) can be distinguished from each other with a collision test (see “Materials and Methods” for details). To ensure that electrical stimulation in the current study was restricted to the LGN and did not excite cortical axons traveling to other structures, the stimulating electrode was always positioned such that the exposed tip (∼1 mm) was located entirely within the LGN. In addition, the stimulating electrode was placed in precise retinotopic register (<1°) with recorded cortical neurons in order to use minimal stimulation parameters (current and duration). Electrical stimulation was also delivered at a low frequency (0.2 Hz) to avoid activating layer 4 neurons by the intrinsic axons of layer 6 neurons (Ferster and Lindstrom, 1985
). Using these precautionary measures, it is worth noting that the orthodromic and antidromic activation latencies reported in this study with the alert monkey where histological confirmation of recording location could not be performed match well with those reported previously where histology was feasible (Briggs and Usrey, 2007a
; Bullier and Henry, 1980
).
Most studies examining periodic activity of cortical neurons use multi-unit responses and/or local field potentials for their analysis (see for example, Berens et al., 2008
). Because these measures, by definition, can not distinguish activity patterns of specific classes of identified neurons, we based our analysis on the spiking activity of individual neurons. In addition, single-unit data provide information that can be directly related to spiking activity of cortical neurons whereas the source of the local field signal remains somewhat controversial. Because peaks within the power spectra of activity recorded from single units are likely smaller than those from the LFP, it is important to note that periodic activity was observed in the vast majority of our individually recorded neurons (see Figure 3
A).
Local Circuit Mechanisms
Increasing evidence suggests that oscillations in cortical activity in the gamma-band are controlled by local inhibitory neuronal networks (Compte et al., 2008
; Hasenstaub et al., 2005
; see for review Bartos et al., 2007
; Fries et al., 2007
). Specifically, these studies highlight the importance of precisely timed and balanced interactions between local inhibitory interneurons and excitatory pyramidal cells for entraining synchronous rhythms within and between cortical areas. If local inhibitory/excitatory circuits are indeed important for the generation of temporally correlated activity, one would predict an increase in correlations for cortical neurons located further along the local cortical processing hierarchy. The results of the present study support this prediction, as layer 6 output neurons, which integrate information across multiple local circuits, display significantly greater activity in the gamma-band compared to layer 4C input neurons.
Interestingly, the increase in gamma-band activity observed among layer 6 output neurons cannot be explained by higher firing rates compared to layer 4C input neurons, as mean firing rates were not significantly different for the output and input neurons in our sample. Thus, the increase in gamma-band activity present among layer 6 output neurons likely reflects mechanisms that operate independently of firing rate. Local circuit-mediated changes in the timing of excitation and inhibition could explain changes in correlations without changes in spike rate.
Functional Implications
In primate V1, input neurons in layer 4C and output neurons in layer 6 are connected via reciprocal circuit loops both locally within V1 and through the visual thalamus. These loops likely serve to control the feedforward flow of visual information (see for review Briggs and Usrey, 2008
). Interestingly, correlated oscillations in thalamo-cortico-thalamic loops have been the subject of much study, as experiments in vitro and in silico indicate that the cortex controls rhythm generation in thalamic networks (Bal et al., 2000
; Destexhe, 2000
; Destexhe et al., 1999
; Steriade, 2001
). Here we provide indirect evidence in support of this notion by demonstrating increased correlation structure in cortical neurons providing feedback to the thalamus compared to those receiving thalamic input. Along these lines, cortical neurons that receive LGN input could provide an intriguing model for examining the relative contributions of thalamic versus local cortical connections to oscillatory activity. The fact that input neurons exhibit significant, albeit diminished, gamma-band activity suggests that these cells have inherited oscillatory structure from their LGN afferents, local cortical circuits, or some combination of the two (see for example, Vicente et al., 2008
). Our results indicate that layer 6 corticogeniculate neurons may be involved in both capacities, i.e., via local reciprocal connections and thalamo-cortico-thalamic connections.
Finally, our results likely provide a lower bound for the amount of correlated activity present in V1 neurons. Our measurements of cortical activity were made in the absence of sensory stimuli, thereby diminishing any influences from top-down cognitive processes such as attention (Womelsdorf and Fries, 2007
). Furthermore, top-down influences on cortical processing in primary sensory areas such as V1 are likely to arise from cortico-cortical connections, which primarily target layers 2/3, 5 and 6 (Felleman and Van Essen, 1991
). Therefore, it is likely that sensory and cognitive processes will further increase the difference in gamma-band activity between input and output stages of the local cortical architecture.
The authors declare that the research was conducted in the absence of any commercial or financial relationships that could be construed as a potential conflict of interest.
We thank Katie Neverkovec, Kelly Henning, Dan Sperka, Rhonda Oates O’Brien, and Shelley Lenz for technical and veterinary assistance. This work was supported by NIH grants EY13588, EY15580, NSF grant 0727115 and the McKnight Foundation.