1
Department of Psychology, University of Groningen, Groningen, The Netherlands
2
Division of Medical Psychology, University Clinics Bonn, Bonn, Germany
3
Institute of Cognitive Neuroscience, University College London, London, UK
Functional neuroimaging has increased our understanding of human brain function tremendously and has become a standard tool in clinical and cognitive neuroscience research. We briefly review its methodological foundations and describe remaining challenges for translational research. The application of neuroimaging results to individual subjects, for example in predicting treatment response or determining the veracity of a statement, is limited by these challenges, in particular by the anatomical and statistical procedures commonly employed. We thus argue for sincere caution in the translation of functional neuroimaging to real-world applications.
Functional neuroimaging has arguably had the biggest impact of any technique in furthering our understanding of how the brain processes information. Electroencephalography (EEG), positron emission tomography (PET), magnetoencephalography (MEG) and functional magnetic resonance imaging (fMRI) have revealed profound insights into human brain function. These findings have enabled neuroscientists to bridge the gap between studies in experimental animals and patients with brain damage, revealing striking similarities in brain structure and function in animals and humans.
The stated goal of much neuroimaging research has been translational. As neuroscientists often write in the concluding paragraphs of publications, or when justifying grant proposals, we would like to understand how the human brain works so that disorders in which it goes wrong might be better understood, treated and ideally even prevented. This is a laudable aim, and notably many pioneers in the field of functional neuroimaging are clinicians. Unfortunately, in the two decades since fMRI was invented, its impact outside the laboratory, in particular clinically, has been negligible. Though functional neuroimaging is often said to hold the promise of assisting in diagnosis, predicting treatment response, informing the development of novel treatments and perhaps even revolutionizing psychiatric nosology, these promises have yet to be fulfilled.
In the meantime, neuroimaging in cognitive neuroscience has celebrated huge successes outside of clinical contexts. It is widely believed that these new methods of investigating brain structure and function have revealed new insights into cognition, emotion, and human nature. Recent studies using fMRI have indeed investigated complex mental capacities such as moral and legal judgment, empathy, deception and economic decisions. The reported associations between brain activation and mental processes have already inspired practical applications such as lie detection, neurofeedback and neuromarketing. To avoid harm due to a misapplication or misapprehension of scientific knowledge, it is important to reflect on methodological and conceptual limitations of neuroimaging.
The aim of this article is to explore the challenges in developing real-world applications for functional neuroimaging. Though we restrict our discussion to fMRI, currently the dominant technology in neuroimaging research, many of the same issues exist for EEG, PET and MEG. We begin by briefly describing what fMRI measures, and outlining the standard procedure for fMRI experimental design and analysis. We then consider some of the limitations inherent in using blood-flow as a surrogate for neuronal responses, in particular when studying individuals taking psychotropic medications. We cover some fundamental statistical issues, most importantly the difficulty of making inferences about individual participants on the basis of group-level analyses. These considerations are complemented by an analysis of the conceptualisation and individuation of anatomical areas. We conclude by considering two attempts to extend neuroimaging beyond the laboratory: lie-detection and prediction of treatment response in psychiatry.
What does fMRI Measure?
One of the main advantages of fMRI, besides its good spatial resolution, is that it measures brain function without the need to infuse any contrast agents. Because of the general tolerability of high magnetic fields, it is considered a “non-invasive” method, though the heating of tissue due to electromagnetic radiation, the induction of currents and the exposure to noise have to be controlled to ensure safety. Its most common variant in neuroscience, blood oxygen-level-dependent (BOLD) imaging, is based on the magnetic properties of haemoglobin, in particular that deoxy-haemoglobin distorts its surrounding magnetic field, while oxy-haemoglobin does not. In the strong magnetic fields generated by MRI scanners – thousands times stronger than the earth’s natural magnetic field – this field distortion measurably reduces the magnetic resonance signal produced by hydrogen atoms following stimulation by a radio pulse at their resonance frequency. Thus, blood containing a higher concentration of deoxy-haemoglobin results in a lower BOLD signal.
The concentration of deoxy-haemoglobin depends on the cerebral metabolic rate of oxygen (CMRO2), cerebral blood flow (CBF) and cerebral blood volume (CBV). The common model assumes that neuronal activity increases oxygen consumption, increasing deoxy-haemoglobin concentration (Heeger and Ress, 2002
). After about 2 s, this initial change is followed by increased CBF, overcompensating for oxygen consumption and increasing CBV due to the elastic properties of blood vessels. The overall measured response, called the haemodynamic response function (HRF), reflects the residual effect of changes in CMRO2, CBF and CBV and lasts 16–32 s.
Two different accounts have been proposed to explain the latter part of the HRF. The first considers the oxygen overcompensation as a by-product of the glucose metabolism which is linked to synaptic activity and depends on astrocytes, a kind of nerve cell fulfilling its energy demand through non-oxidative glycolysis. According to this explanation, the BOLD response is only indirectly linked to neural activity, and primarily reflects incoming signals from other cells processed at the neurons’ synapses (e.g., Fox et al., 1988
). The second account emphasises the neurons’ need for oxygen, fulfilling their energy demand through the oxidation of lactate during periods of increased activity (e.g., Buxton and Frank, 1997
).
In an influential study, Logothetis et al. (2001)
recorded electrical and haemodynamic activity simultaneously in the visual cortex of monkeys. Their results showed a strong correlation of the BOLD signal with local field potentials reflecting synaptic activity and thus supported the first account. The signal also correlated with the measurements reflecting neural spiking, but less strongly and particularly for shorter durations of stimulation. Generally, these findings supported the view that BOLD fMRI is a reliable, though indirect indicator of neuronal signals received within a certain portion of brain tissue. In cognitive neuroscience, fMRI researchers employ software packages supplying approximations of the HRF in order to test whether the observed signal matches the expected BOLD response. From this, they infer that neuronal activity in a particular region is related to a particular experimental condition.
How Do We Get to Blobs On Brains?
fMRI data typically consist of a time-series of several hundred 3D images, representing the BOLD signal across the brain over a period of time, with each image acquired every few seconds. These images contain many thousands of 3D pixels, or voxels, which represent the spatial unit of measurement of fMRI. The images are manipulated in a number of ways prior to analysis, called pre-processing. First, the images must be realigned, such that they all lie in the same space. Researchers may correct for the fact that different image slices were collected at slightly different times. The images are often co-registered to an anatomical scan and then spatially-normalised, i.e. squashed and stretched to match some template image. Finally, the images are smoothed (blurred) slightly, which accommodates the heterogeneity in individual anatomy.
Pre-processed BOLD images are then subjected to subject-level analysis. During data collection, the times (onsets) of each of the events of interest are recorded. These onsets are used to create the statistical model (design matrix), with which the data are analysed. Since the BOLD responses associated with neuronal activity occur slowly, the form of each event is modified to match the form of an average HRF, a procedure known as convolution. The convolved onsets of the different types of events form the explanatory variables, or regressors, in the design matrix. It is important to realize that this convolution process means that fMRI and PET can never have the same temporal resolution as EEG or MEG. Their poor ability to determine when responses in the brain occurred is not simply a technical limitation; the physiological process they measure is itself very slow.
The slow timescale of the HRF also has important ramifications for designing sensitive scanning experiments. The most sensitive (efficient) tasks are those that present alternating stimuli/tasks at roughly the same timescale of the HRF; this type of experiment is said to have a block design. However, many psychological tasks operate on a much faster timescale, and block designs may be inappropriate in some cases. Therefore, researchers may adopt more complex designs in which many events in a task are modelled, using shorter timescales, known as event-related designs. While event-related designs allow for a more sophisticated interpretation, they suffer an inherent disadvantage because the events being studied happen so quickly, relative to the timescale of the HRF. This means that event-related designs are invariably less sensitive than block designs, requiring more subjects or time spent in the scanner.
Whichever design is used, in standard fMRI analysis a mass-univariate approach is common, in which linear regression is performed at each voxel separately to estimate the magnitude of the effect of each regressor. This magnitude, the parameter estimate or beta value, is equivalent to the slope of the regression line. The result of this analysis is a new set of brain images, beta images, which summarize the effects a given regressor on the BOLD response.
Parameter estimates generated from the same model can be compared directly to create contrast estimates. Statistical values can also be generated, from which it is possible to infer at a given voxel whether the BOLD signal differs between two or more conditions. In a simple design, for example remembering 4 versus 8 items, the contrast estimate value can be conceptualised intuitively as the difference in the amplitude of the BOLD signal between the two conditions, much as one might calculate a reaction time difference.
Group-level analysis is conducted using the beta or contrast images as summary-statistics. This analysis is also usually performed using a mass-univariate approach, conducting a t-test at every voxel across the whole brain. This is the final stage of standard fMRI analysis, and results in an image of statistical values, which can be thresholded at a given value to identify regionally-specific effects that are statistically reliable across participants. The threshold will be quite conservative to account for the many thousands of statistical comparisons performed.
For ease of viewing, voxels are coloured according to t-values, with warmer colours indicating more significant values. These statistical images can be overlaid on an anatomical scan, giving rise to the familiar presentation of blobs on brains. What is important to remember is that these blobs do not represent activity per se. Instead, they represent statistical values, calculated from subject-level parameter estimates, which were themselves based on BOLD signal changes. These are not trivial points, and give rise to several challenges in interpreting fMRI data.
How Neural is the Bold Signal?
The language prevalent in the interpretation of BOLD fMRI data suggests a tight coupling between the measured signal and neural processes. References to neural “activation”, “bases”, “circuits”, “correlates”, “processes”, “substrates” and so on are abundant (Figure 1
). However, from the previous discussion it should be clear how many assumptions and intermediary steps are required in the logical chain from the statistical result to the common metaphor of neuronal activity.
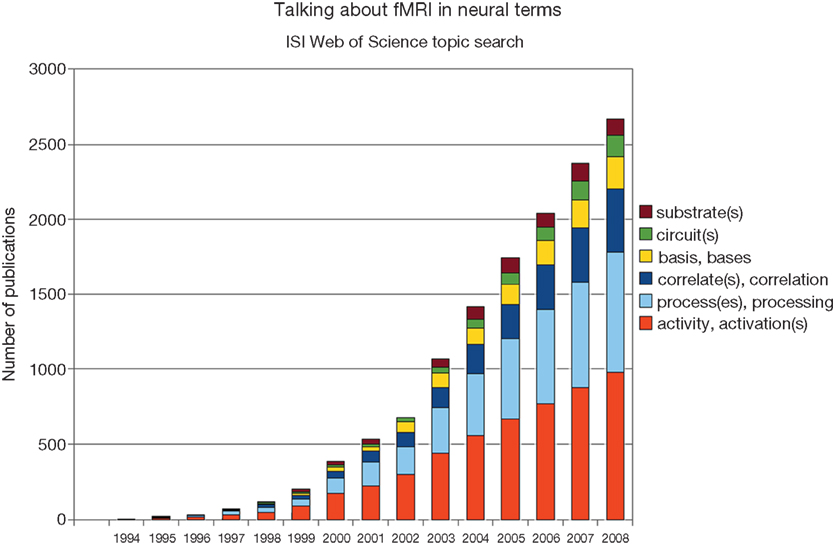
Figure 1. Although the neuronal basis of the fMRI signal remains controversial, researchers frequently associate them with each other. Shown are the results of a topic search for “fMRI” and the respective neural keyword on ISI Web of Science.
Previous research has shown that the BOLD effect can be influenced, eliminated, or even inverted by age or disease (D’Esposito et al., 2003
) and that in some circumstances lower neural activation is associated with stronger BOLD signals (Marcar et al., 2004
). Recent experiments identified situations in which neural activation is not reflected in a BOLD increase or, vice versa, that BOLD responses can be identified in the absence of neural activation (Schummers et al., 2008
; Sirotin and Das, 2009
). Another study recording electrical signals as well as BOLD responses in patients awaiting neurosurgery suggested a heterogeneous relationship between different brain areas. Ekstrom et al. (2009)
reported the expected correlation of both measurements only in the parahippocampus, not in the hippocampus.
Regarding the common interpretation that the BOLD signal reflects synaptic activity, critics refer to alternative neurobiological accounts of the haemodynamic response, emphasizing the removal of lactate, adjustment of the acid-base or ionic balance of the tissue or temperature regulation (Raichle and Mintun, 2006
). Logothetis whose earlier research supported the prevailing explanation (Logothetis et al., 2001
) himself recently concluded that the “fMRI signal cannot easily differentiate between function-specific processing and neuromodulation, between bottom-up and top-down signals, and it may potentially confuse excitation and inhibition” (Logothetis, 2008
, p. 877). While many of these issues are being addressed by basic research and will likely be clarified in the future, they essentially limit our current understanding of the BOLD response in terms of neuronal activation.
Effects of Medication
One of the difficulties in interpreting fMRI data collected in patients with psychiatric disorders is the effect of medication. Most papers comparing groups of psychiatric patients with controls test patients who are predominantly, if not exclusively, taking psychotropic medications. One effect of medication may be either to induce apparent differences between groups in terms of brain responses, or perhaps to mask effects that are really there. This problem is appreciated in psychiatric research generally, for example in interpreting behavioural data.
However, measures of brain responses based on blood-flow face further interpretative difficulties. This is because many of the medications used to treat psychiatric disorders also affect the brain’s vasculature directly, either constricting or dilating blood vessels. Indeed, the neurotransmitter serotonin, which most anti-depressants increase, was originally identified, and named, due to its constricting effect on blood vessels (“sero” – serum; “tonin” – tone: Rapport et al., 1948
). Therefore, if differences in brain responses are observed between medicated patients and controls, it is difficult to interpret whether the differences represent: (1) the effect of the illness itself; (2) the effect of the medication on neuronal responses; (3) the effect of the medication on the vasculature, independent of effects on neuronal responses. For example, Kumar et al. (2008)
reported that administering anti-depressants to healthy volunteers induced quite similar patterns of BOLD responses to those observed in medicated depressed patients, compared with unmedicated healthy volunteers. What is not clear, however, is whether the anti-depressants affected neuronal responses, the brain’s vasculature, or even both.
The medication confound could be addressed in a number of ways. The best strategy is to test unmedicated patients. However, unmedicated patients may be difficult to recruit, and could have a less severe illness than medicated patients, introducing a selection bias. Alternatively, it may be possible to administer medication to healthy volunteer subjects. However, this might raise ethical issues, and the effects of medication could be different between healthy volunteers and patients. Finally, it is possible to estimate the shape and amplitude of the BOLD response independent of neuronal activity by employing a simple breath-hold test (Bright et al., 2009
). While this procedure cannot completely circumvent the aforementioned confounds, such data may aid the interpretation of studies comparing medicated patients and unmedicated controls.
Multiple Comparisons and Effect Sizes
A feature of brain imaging that might be considered both a strength and a weakness is the enormous amount of data collected (Kriegeskorte et al., 2009
). Since many thousands of statistical comparisons are conducted, making it very likely that false positives would be observed, it is necessary to perform correction for multiple comparisons when determining whether an effect is reliable. However, often we are not simply interested in the question “is there an effect”; additionally, we often wish to know “how large is this effect”. This can be expressed in terms of the standardised effect size (Cohen’s d) when comparing means, or the correlation co-efficient (r) when examining linear relationships.
The issue of multiple comparisons in neuroimaging is well known, and standard techniques have been developed to address it (Friston et al., 1991
). What is often not so readily appreciated is the effect of multiple comparisons on effect sizes. Since brain imaging data are smooth (i.e., the response in a given voxel will correlate strongly with the response in its neighbours), different voxels in a small volume of a functional brain image essentially contain a large number of highly correlated observations. When making statistical inference (i.e., rejecting the null-hypothesis), it is common to analyse only the voxel producing the maximal signal, known as the “peak voxel”, with an appropriate correction for multiple comparisons. However, when researchers come to plot the contrast estimates of interest at this voxel, the effect of size will necessarily be over-estimated. This is because the voxel chosen for display is the “best of the bunch”. To put it another way, means will appear more different from each other, and points on a scatterplot will appear closer to the regression line, than really they ought to. This is a particular problem when small numbers of subjects are included (N < 30 per group), as is often the case in expensive neuroimaging studies (Yarkoni, 2009
).
The resolution to this problem is not trivial, and an extensive discussion is beyond the scope of this article (Kriegeskorte et al., 2009
). Suffice it to say that peak voxel-based brain imaging analyses may appear to produce impressively large effect sizes, often much larger than seen in behavioural studies. Although, assuming appropriate correction for multiple comparisons was employed, these effects probably exist (i.e., they are non-zero), their magnitude should not be taken at face value. This is not just a statistical issue, but is extremely relevant for real-world applications. If the apparent predictive value of brain responses is inflated, the value of using such measures in a real-world setting is less than it may at first appear.
Discrimination
While MRI has had a major impact in neurology practice, its penetrance into psychiatric clinics has been negligible. Currently, it would be quite reasonable to describe MRI as purely a research tool in psychiatry, with no diagnostic or treatment utility. At first glance, this might seem surprising, given the large number of MRI papers published that include psychiatric patients, often with compelling results, and the extensive use of MRI in neurology.
In essence, the difference in the use of MRI between the two clinical disciplines relates to discriminability. If a neurologist orders an MRI scan for a patient he suspects to have a tumour or stroke, when the scan is examined there is a very high probability that, if the abnormality is there, it will be seen. Unfortunately, this is not the case in psychiatry. At the gross anatomical level, the brains of patients with psychiatric disorders look broadly similar to those of controls. There may be subtle differences in the volumes of different brain regions, perhaps not appreciable with the naked eye, but it is certainly not the case that almost every patient will look different to a healthy volunteer. The same is true for functional scans. While on average, amygdala BOLD responses to negative emotional faces may be reliably elevated in groups of currently depressed patients (Leppanen et al., 2004
), this does not translate into saying that every depressed patient will show elevated amygdala BOLD responses, or that subjects with greater BOLD responses will be depressed. Moreover, as discussed above, while plotted data may give the impression that the patient and control groups are almost entirely separable in terms of BOLD response in a given region, if the plot is based on the peak voxel this will be an overstatement.
Hence, the diagnostic utility of MRI in psychiatry is currently limited. Without clear hypotheses about functional or structural outcomes based on the clinical observation and anamnesis of a particular patient, we do not recommend that patients should generally undergo expensive and potentially burdening neuroimaging procedures. The number of possible sequences and experimental paradigms to highlight different aspects of brain function and structure is vast. An investigation of a Japanese program that allowed people to voluntarily undergo MRI examinations without a medical reason suggested that clinically relevant findings occur too rarely to justify their general introduction into the standard diagnostic procedure (Tsushima et al., 2005
).
Anatomical Variability
Although we have emphasized the importance of brain function, all approaches of localisation presume a thorough understanding of brain structure, that is, anatomy. The brain is a highly organised structure on different levels, from the microscopic to the macroscopic. Understanding the human mind by means of localising brain function requires understanding both the relationship between brain structure and function and between brain function and mental processes. The success of the project of human brain mapping is therefore subject to our anatomical knowledge. To go from the brain to the mind, logical step called “reverse inference” is frequently employed (Poldrack, 2006
). Its power is dependent on the brain’s functional specialisation: the more functions are realized within one area, the less certain is the engagement of a particular function when activation within this area is found.
Of course, researchers can take steps to reduce the number of plausible cognitive processes that might be indicated by an area’s activation. For example, they could adapt established psychological or experimental designs to their purposes. Yet, if these decisions guaranteed the presence of a certain cognitive process, then the further measurement would be superfluous; if at least some uncertainty remains before the neuroimaging experiment, the findings will have to be interpreted to some extent by relating particular brain areas to those processes they (putatively) process. As long as a respective imaging method depends on spatially localised information, the anatomical knowledge of the brain will constrain the interpretation of its data. Even newer multivariate approaches looking for spatially extended patterns of brain activation eventually depend on anatomical information to explain their findings (Haynes and Rees, 2006
).
Each brain is unique and it would potentially take an expert several hundreds of hours to provide a fine-grained distinction of all of its anatomical parts. One way to deal with this is to operate with high-level concepts, which are roughly classified according to their spatial order. For example, the middle frontal gyrus is the middle ridge on the frontal lobe, located between the superior (upper) and the inferior (bottom) frontal gyri. However, even more coarse-grained labels, for example “dorsolateral prefrontal cortex”, are used frequently. This label roughly relates to that part of the frontal lobe located very much in front (prefrontal), towards the top (dorsal as opposed to ventral) and more on the side (lateral as opposed to medial), and consists of several anatomical structures. Understandably, experts disagree about its precise delineation, and in extreme cases one researcher’s dorsolateral prefrontal cortex (Greene et al., 2004
) can be another’s medial frontopolar cortex (Moll and de Oliveira-Souza, 2007
). Since the spatial localisation of brain activations is essential – qua reverse inference – for the association with cognitive processes, an imprecise localisation will also yield an imprecise understanding of the engagement of the cognitive process. But even if this conceptual hurdle is cleared, we still need a procedure to identify brain areas in experimental data.
Thus, researchers invariably transform their individually recorded anatomical and functional images into a standardised reference space during pre-processing. This transformation process in itself is complex, involving linear and non-linear manipulations and approximations, and is usually followed by smoothing to account for inter-individual variability. Common reference spaces are Brodmann areas, Talairach space and the atlas of the Montreal Neurological Institute. The first is based on the microscopic investigations of the German neuroanatomist Korbinian Brodmann (1868–1918); the second on one hemisphere of the brain of a 60-year-old French woman; and the third on 305 anatomical MRI images of young (on average 23.4-year old), right-handed, North-American and mostly male healthy volunteers (Evans et al., 1993
). These atlases obviously represent only a small part of the human population.
Some neuroscientists, aware of these limitations, have proposed a project to improve anatomical localisation (Mazziotta et al., 2001
). When this work is completed, it will allow researchers to determine the probability with which a co-ordinate in the brain belongs to a certain area in a particular population. Obviously, this probability is subject to inter-subject variability and will be smaller in more variable portions of the brain, for example, the neocortex. Furthermore, its accuracy will be limited by the individual history of each subject, including diseases, accidents and lifestyle, and the prevalence of variations of the norm and abnormalities in the brain was even as high as 25% in a sample of 2,500 healthy, young males (Weber and Knopf, 2006
).
Much less is known about the variability of brain function since the statistical methods in neuroimaging experiments are usually chosen to identify similarities, not differences between subjects. Yet, if there is no significant result within a brain region, this could mean either that there was no change in activation at all (a similarity between subjects) or that the variance was too high (a difference). The idiosyncrasies of the “language” of each brain will essentially limit the possibility of transferring neuroscientific knowledge about one brain or group of brains to another. The technical possibility of a general “mind-reading” device is thus subject to the identification of stable patterns of activation representing certain mental contents, taking anatomical and functional variability within and between subjects into account.
The upshot of these issues is that each map demonstrating the statistical significance of a functional finding should ideally be accompanied by a second map demonstrating the likelihood that its location belongs to a given brain region. While the language employed by many neuroscientists to explain brain imaging findings suggests a high degree of certainty regarding the identification of individual areas, this confidence is not usually reflected in the commonly-used anatomical localisation techniques.
Neuroimaging has increased our knowledge about human brain function tremendously. We wanted to identify the challenges in understanding its results in the practical domain. While many of these issues have been investigated in basic research, they limit the scope of contemporary clinical and cognitive neuroscience. Particularly when claims about individual subjects are involved, we recommend extreme caution. Recent projects approaching “mind-reading”, lie detection and the prediction of future criminal behaviour directly target the individual and promise applications in a vast number of social contexts. While the benefits of some uses are clear, for example enabling disabled patients to regain behavioural or communicative capacities, the possible risks of others, for example judging the veracity of a statement in a courtroom, are abundant as long as the respective method is not built on a solid foundation.
In the clinical domain, some studies have attempted to use brain imaging to characterize individuals who subsequently respond to treatment in terms of BOLD responses, for example in depressed patients (Seminowicz et al., 2004
; Fu et al., 2007
). Fu and colleagues (Fu et al., 2007
) presented a graph depicting an impressively strong relationship between BOLD responses to positive facial stimuli in the lingual gyrus, hippocampus and cerebellum and response to the anti-depressant fluoxetine (r > 0.6). This could potentially be a very important result, since clinicians currently have no way of predicting which patients will respond well to a particular anti-depressant. However, since this result was based on a voxel-wise analysis, and only significant voxels (at p < 0.005) were included in the scatterplot, it is almost certain that the prediction would not be so strong when looking at responses in the same voxels in another group of patients. This is not to say that such studies are not useful – being able to predict treatment response is potentially one of the most important clinical applications of fMRI. However, the number of studies, variable results and lack of independent validation experiments means that this line of research is still in its infancy. Nonetheless, if the challenging relevant longitudinal studies required are carried out, the implications for psychiatric practice could be profound.
How relevant are the described theoretical problems to the practical application of BOLD fMRI? Could one argue that as long as powerful technical devices and statistical tools yield results with a sufficient predictive value in the real world, the theoretical issues do not have to be resolved? To some extent, it is indeed an empirical matter whether a data-driven approach is more successful than a theory-driven approach. Brain-computer-interfaces are a good example because they allow an online-evaluation of the method’s functioning, that is, whether the subject is able to make meaningful interactions with the computer. However, the information necessary for such an evaluation may be unavailable for a present decision in other situations because it is hidden in the past (e.g., lie detection) or the future (e.g., prediction of disease or treatment response).
Particularly the issue of fMRI-based lie detection is interesting in this respect because it is already offered by commercial companies, and has received ethical and legal attention urging for regulation (Greely and Illes, 2007
). If the information necessary for validation (i.e., the truth) was already available, the application of the lie detector would be unnecessary. If it was unavailable, an individual who is truly a liar would try to hide it by all means. Without a general “mind-reading” device to directly and unequivocally identify the meaning or contents of an individual’s brain activity pattern as deceptive, an approach interpreting brain activation and comparing it with samples of other individuals or groups is subject to the limitations we addressed here. The dangers of classifying a statement erroneously as right or wrong, say, in a legal setting are obvious, as are the dangers of an erroneous medical decision.
However, there certainly are other real-world applications to which at least some of our discussion does not apply. “Neuromarketing” or “neuropolitical” research, which predicts general consumptive or voting preference, needs not to worry about the transferability of group findings to individuals since its scope consists of aggregated behaviours. Yet, its inferences are subject to our knowledge of the brain when investigating, for example, whether an advertisement reliably activates “pleasure circuits”, and to general standards of the ecological validity of experiments. Moreover, such conclusions will invariably make use of some form of the reverse inference scheme, and as such require careful validation (see e.g. Krajbich et al., 2009
for a study that successfully provided such validation). The inferential connection between localised differences in brain activation and cognitive processes certainly affects many interpretations in neuroimaging research in general and requires further theoretical and basic research.
In conclusion, knowledge regarding anatomical localisation, individual variability of brain structure and function, the neural component of the BOLD signal and the statistical procedures used in the analysis of fMRI data are often neglected in the interpretation of neuroimaging results relating to practical applications. Unfortunately, this trend continues in public science communication, as the tone of the majority of reports in the print media is uncritical, particularly when health-related research – where hopes and risks are highest – is covered (Racine et al., 2006
). Acknowledging these issues is one of the first steps towards understanding neuroimaging better, its possibilities and limitations, both in applied research and public perception.
The authors declare that the research was conducted in the absence of any commercial or financial relationships that could be construed as a potential conflict of interest.
Fu, C. H., Williams, S. C., Brammer, M. J., Suckling, J., Kim, J., Cleare, A. J., Walsh, N. D., Mitterschiffthaler, M. T., Andrew, C. M., Pich, E. M., and Bullmore, E. T. (2007). Neural responses to happy facial expressions in major depression following antidepressant treatment. Am. J. Psychiatry 164, 599–607.
Mazziotta, J., Toga, A., Evans, A., Fox, P., Lancaster, J., Zilles, K., Woods, R., Paus, T., Simpson, G., Pike, B., Holmes, C., Collins, L., Thompson, P., MacDonald, D., Iacoboni, M., Schormann, T., Amunts, K., Palomero-Gallagher, N., Geyer, S., Parsons, L., Narr, K., Kabani, N., Le Goualher, G., Boomsma, D., Cannon, T., Kawashima, R., and Mazoyer, B. (2001). A probabilistic atlas and reference system for the human brain: International Consortium for Brain Mapping (ICBM). Philos. Trans. R. Soc. Lond., B, Biol. Sci. 356, 1293–1322.