1
Psychiatry Service, San Francisco VA Medical Center and Department of Psychiatry, University of California, San Francisco, CA, USA
2
Department of Psychiatry, Yale University School of Medicine, New Haven, CT, USA
3
Department of Psychology, Lewis and Clark College, Portland, OR, USA
Schizoaffective disorder (SA) is distinguished from schizophrenia (SZ) based on the presence of prominent mood symptoms over the illness course. Despite this clinical distinction, SA and SZ patients are often combined in research studies, in part because data supporting a distinct pathophysiological boundary between the disorders are lacking. Indeed, few studies have addressed whether neurobiological abnormalities associated with SZ, such as the widely replicated reduction and delay of the P300 event-related potential (ERP), are also present in SA. Scalp EEG was acquired from patients with DSM-IV SA (n = 15) or SZ (n = 22), as well as healthy controls (HC; n = 22) to assess the P300 elicited by infrequent target (15%) and task-irrelevant distractor (15%) stimuli in separate auditory and visual “oddball” tasks. P300 amplitude was reduced and delayed in SZ, relative to HC, consistent with prior studies. These SZ abnormalities did not interact with stimulus type (target vs. task-irrelevant distractor) or modality (auditory vs. visual). Across sensory modality and stimulus type, SA patients exhibited normal P300 amplitudes (significantly larger than SZ patients and indistinguishable from HC). However, P300 latency and reaction time were both equivalently delayed in SZ and SA patients, relative to HC. P300 differences between SA and SZ patients could not be accounted for by variation in symptom severity, socio-economic status, education, or illness duration. Although both groups show similar deficits in processing speed, SA patients do not exhibit the P300 amplitude deficits evident in SZ, consistent with an underlying pathophysiological boundary between these disorders.
Kraepelin (1971)
distinguished between “dementia praecox” and “manic-depressive psychosis” based on his observations that these two groups of psychotic patients exhibited different clusters of symptoms and courses of illness. This distinction has persisted in psychiatric nosology, underlying the current diagnostic categories of schizophrenia and major mood disorders. However, it has long been recognized that some patients exhibit symptoms from both diagnostic categories, fueling debate about how to classify them and where to draw the diagnostic boundaries between schizophrenia and psychotic mood disorders (i.e., bipolar disorder and psychotic depression). The term “schizoaffective psychosis” was first proposed by Kasanin (1933)
to describe these patients and it has survived to the present.
Whether schizoaffective disorder is a distinct clinical entity (Tsuang, 1991
; Kasanin, 1933
; Kendler et al., 1995
), a variant of schizophrenia (Williams and McGlashan, 1987
; Evans et al., 1999
) or major mood disorders (Lake and Hurwitz, 2007
), or the reflection of an underlying continuum between them (Peralta and Cuesta, 2008
), is still debated (Evans et al., 1999
; Kempf et al., 2005
; Cheniaux et al., 2008
; Peralta and Cuesta, 2008
). The issue is obscured by clinical heterogeneity within the schizoaffective category (Levitt and Tsuang, 1988
), and its diagnostic unreliability among clinicians (Maj et al., 2000
) and over time (Schwartz et al., 2000
). Validation of the schizoaffective disorder construct as distinct from schizophrenia or bipolar disorder requires consideration of measurement domains other than the clinical data used to initially define the construct. Neurobiological measurement domains are perhaps most informative about whether distinguishing schizoaffective disorder from other psychotic and mood disorders successfully “carves nature at its joints.” Unfortunately, research is sparse for most domains, non-existent for some, and findings have been inconsistent (Kempf et al., 2005
; Cheniaux et al., 2008
). For example, schizoaffective patients have better neurocognitive function than schizophrenia patients in some studies (Stip et al., 2005
; Gruber et al., 2006
; Heinrichs et al., 2008
) but not others (Miller et al., 1996
; Evans et al., 1999
; Fiszdon et al., 2007
). Perhaps because definitive data supporting a pathophysiological boundary between the disorders are lacking, schizoaffective and schizophrenia patients are often combined in schizophrenia research.
Among the measurement domains for which studies comparing schizoaffective disorder and schizophrenia are lacking are event-related brain potentials (ERP). In particular, despite the fact that amplitude reduction of the P300 component of the ERP is one of the most replicated neurobiological abnormalities in schizophrenia (Jeon and Polich, 2003
), no studies have examined whether this biomarker is also compromised in schizoaffective disorder.
P300, a positive voltage deflection in the ERP occurring approximately 300 ms after stimulus onset, reflects neurophysiological processes associated with processing infrequent target, novel, or otherwise salient stimuli. P300 amplitude is thought to reflect attentional resource allocation (Isreal et al., 1980
; Kramer and Strayer, 1988
; Polich, 1989
), phasic attentional shifts (Soltani and Knight, 2000
), working memory updating of stimulus context (Johnson, 1986
; Donchin and Coles, 1988
), or stimulus salience (Sutton et al., 1965
, 1967
). Its latency is thought to reflect processing speed or efficiency during stimulus evaluation (Duncan-Johnson and Donchin, 1977
).
Two subtypes of P300 are distinguished based on the type of deviant stimulus used to elicit it. P3b is the P300 elicited by infrequent task-relevant target stimuli in “oddball” tasks. It reflects top-down allocation of attentional resources to task-relevant events, and has a parietal scalp maximum. P3b amplitude reduction and latency delay in schizophrenia are established findings (Ford, 1999
; Jeon and Polich, 2003
). Cross-sectional studies often show P300 reduction to be associated with greater negative symptoms (Pfefferbaum et al., 1989
; Mathalon et al., 2000a
). In a longitudinal study, P3b amplitude tracked fluctuations in positive symptoms, although it remained abnormally reduced even when symptom severity diminished (Mathalon et al., 2000a
). In addition, P3b is smaller and later in patients with longer illness durations (Mathalon et al., 2000b
), suggesting it may also track illness progression. P3a is the P300 elicited by infrequent task-irrelevant deviant or distractor stimuli, which are typically either novel or otherwise salient, in oddball tasks. It reflects “bottom-up” orienting of attentional resources to these stimuli and has a fronto-central scalp maximum. Although few studies have examined P3a in schizophrenia, limited evidence suggests its amplitude is also reduced (Pfefferbaum et al., 1989
; Mathalon et al., 2000a
). In our longitudinal study, P3a also tracked clinical severity fluctuations but did not normalize when patients were most remitted (Mathalon et al., 2000a
). Although not often directly compared, P300 abnormalities in schizophrenia are usually more prominent in the auditory than visual modality (Jeon and Polich, 2003
).
Our primary aim was to examine whether P300 amplitude and latency elicited by target and task-irrelevant distractor stimuli in auditory and visual oddball tasks show differential sensitivity to schizophrenia. These four types of P300 (target vs. task-irrelevant distractor stimulus, auditory vs. visual modality) have never been directly compared within a single study of patients with schizophrenia. In addition to schizophrenia patients, we also recruited patients with schizoaffective disorder, providing an opportunity to assess whether they would show the same pattern of P300 abnormalities exhibited by schizophrenia patients.
Participants
Electroencephalography (EEG) recordings were acquired from patients with schizophrenia (SZ; n = 22) and schizoaffective disorder (SA; n = 15), as well as healthy comparison subjects (HC; n = 22). All gave written informed consent after procedures had been fully described. Institutional Review Boards at the West Haven VA and Yale University approved this study.
Patients were recruited from community mental health centers and outpatient services of the VA Connecticut Healthcare System. Also, some patients were recruited by Dr. Hoffman to participate in a repetitive transcranial magnetic stimulation (rTMS) clinical trial for auditory hallucinations, in which case they were studied before initiating rTMS treatment. All but one patient were on stable doses of antipsychotic medications and met DSM-IV (American Psychiatric Association, 1994
) criteria for schizophrenia or schizoaffective disorder based on a Structured Clinical Interview for DSM-IV (SCID) (First et al., 1995
). Patients with DSM-IV alcohol or drug abuse in the 30 days preceding the study were excluded.
HC subjects were recruited by newspaper advertisements and word-of-mouth, screened by telephone using questions from the SCID (First et al., 1995
) non-patient screening module, and excluded for any history of Axis I psychiatric illness. All participants were excluded for significant head injury, neurological disorders, or medical illnesses compromising the central nervous system.
Tasks
In the 3-stimulus auditory oddball task, a random series of infrequent (15%) “target” high tones (1000 Hz), frequent (70%) “standard” low tones (500 Hz), and infrequent task-irrelevant distractor sounds (15%), were presented with a 1.25-s stimulus onset asynchrony. Distractor sounds were selected from a corpus of novel sounds developed by Friedman (Friedman et al., 1993
). The tones were 50 ms in duration and 80 dB SPL (C scale). Distractor sounds ranged between 175–250 ms in duration and averaged 80 dB SPL (C scale).
In the 3-stimulus visual oddball task, an infrequent (15%) target stimulus (a plus sign, “+”), a frequent (70%) standard stimulus (a minus sign, “−”), and an infrequent (15%) distractor salient stimulus (a large blue square), were presented for 500 ms in a random sequence with a 1.25-s stimulus onset asynchrony.
In each task, subjects were asked to press a response key to the target stimulus. Each task comprised 3 runs of 100 stimuli, resulting in 45 targets, 45 distractor stimuli, and 210 standards for each modality.
Measures
EEG acquisition and pre-processing
Subjects sat in an acoustically shielded booth in front a computer monitor and wore insert earphones. EEG was recorded at 1000 Hz from 26 scalp sites, bandpass filtered between 0.05–100 Hz, and referenced to linked ears. Additional electrodes were placed at the outer canthi of both eyes and above and below the left eye to record eye movements and blinks (vertical and horizontal electro-oculogram [EOG]; VEOG, HEOG). All electrode impedances were maintained at or below 10 kOhm, with most EEG sites near 5 kOhm.
EEG data from 15 central sites were analyzed (F7, F3, Fz, F4, F8, T3, C3, Cz, C4, T4, T5, P3, Pz, P4, T6). Continuous data were separated into 1000 ms epochs time-locked to stimulus onset, with a 100-ms pre-stimulus baseline. VEOG and HEOG data were used to correct EEG for eye movements and blinks with a regression-based algorithm (Gratton et al., 1983
). After baseline correction, epochs containing artifacts (voltages exceeding ±100 μV) were rejected.
Because P300s elicited by auditory and visual stimuli peak at different latencies, and because target P3b and distractor P3a have different topographies, different rules were used for identifying peaks. Auditory P300 was identified as the most positive peak in a 235–400 ms time window following stimulus onset, whereas visual P300 was identified within a 230–500 ms window. Target P3b peak was first identified at Pz, then a 50-ms window (±25 ms) surrounding this peak’s latency was used to identify target P3b peaks at other sites. Distractor P3a showed more scalp variability in peak latency than target P3b, particularly at frontal sites, leading us to adopt a more flexible peak identification strategy. Distractor P3a peaks were first identified at all central and parietal sites. From the range of peak latencies obtained at central sites (T3, C3, Cz, C4, T4), minimum and maximum latencies were identified. By subtracting 50 ms from the minimum and adding 50 ms to the maximum, the search window for identification of P3a peaks at frontal sites was defined. The somewhat early latency cut-off (400 ms) for auditory P300s was chosen to avoid picking the second late positive component, which peaked around 550 ms (see Figure 1
). Peak amplitudes were used for all P300 measures.
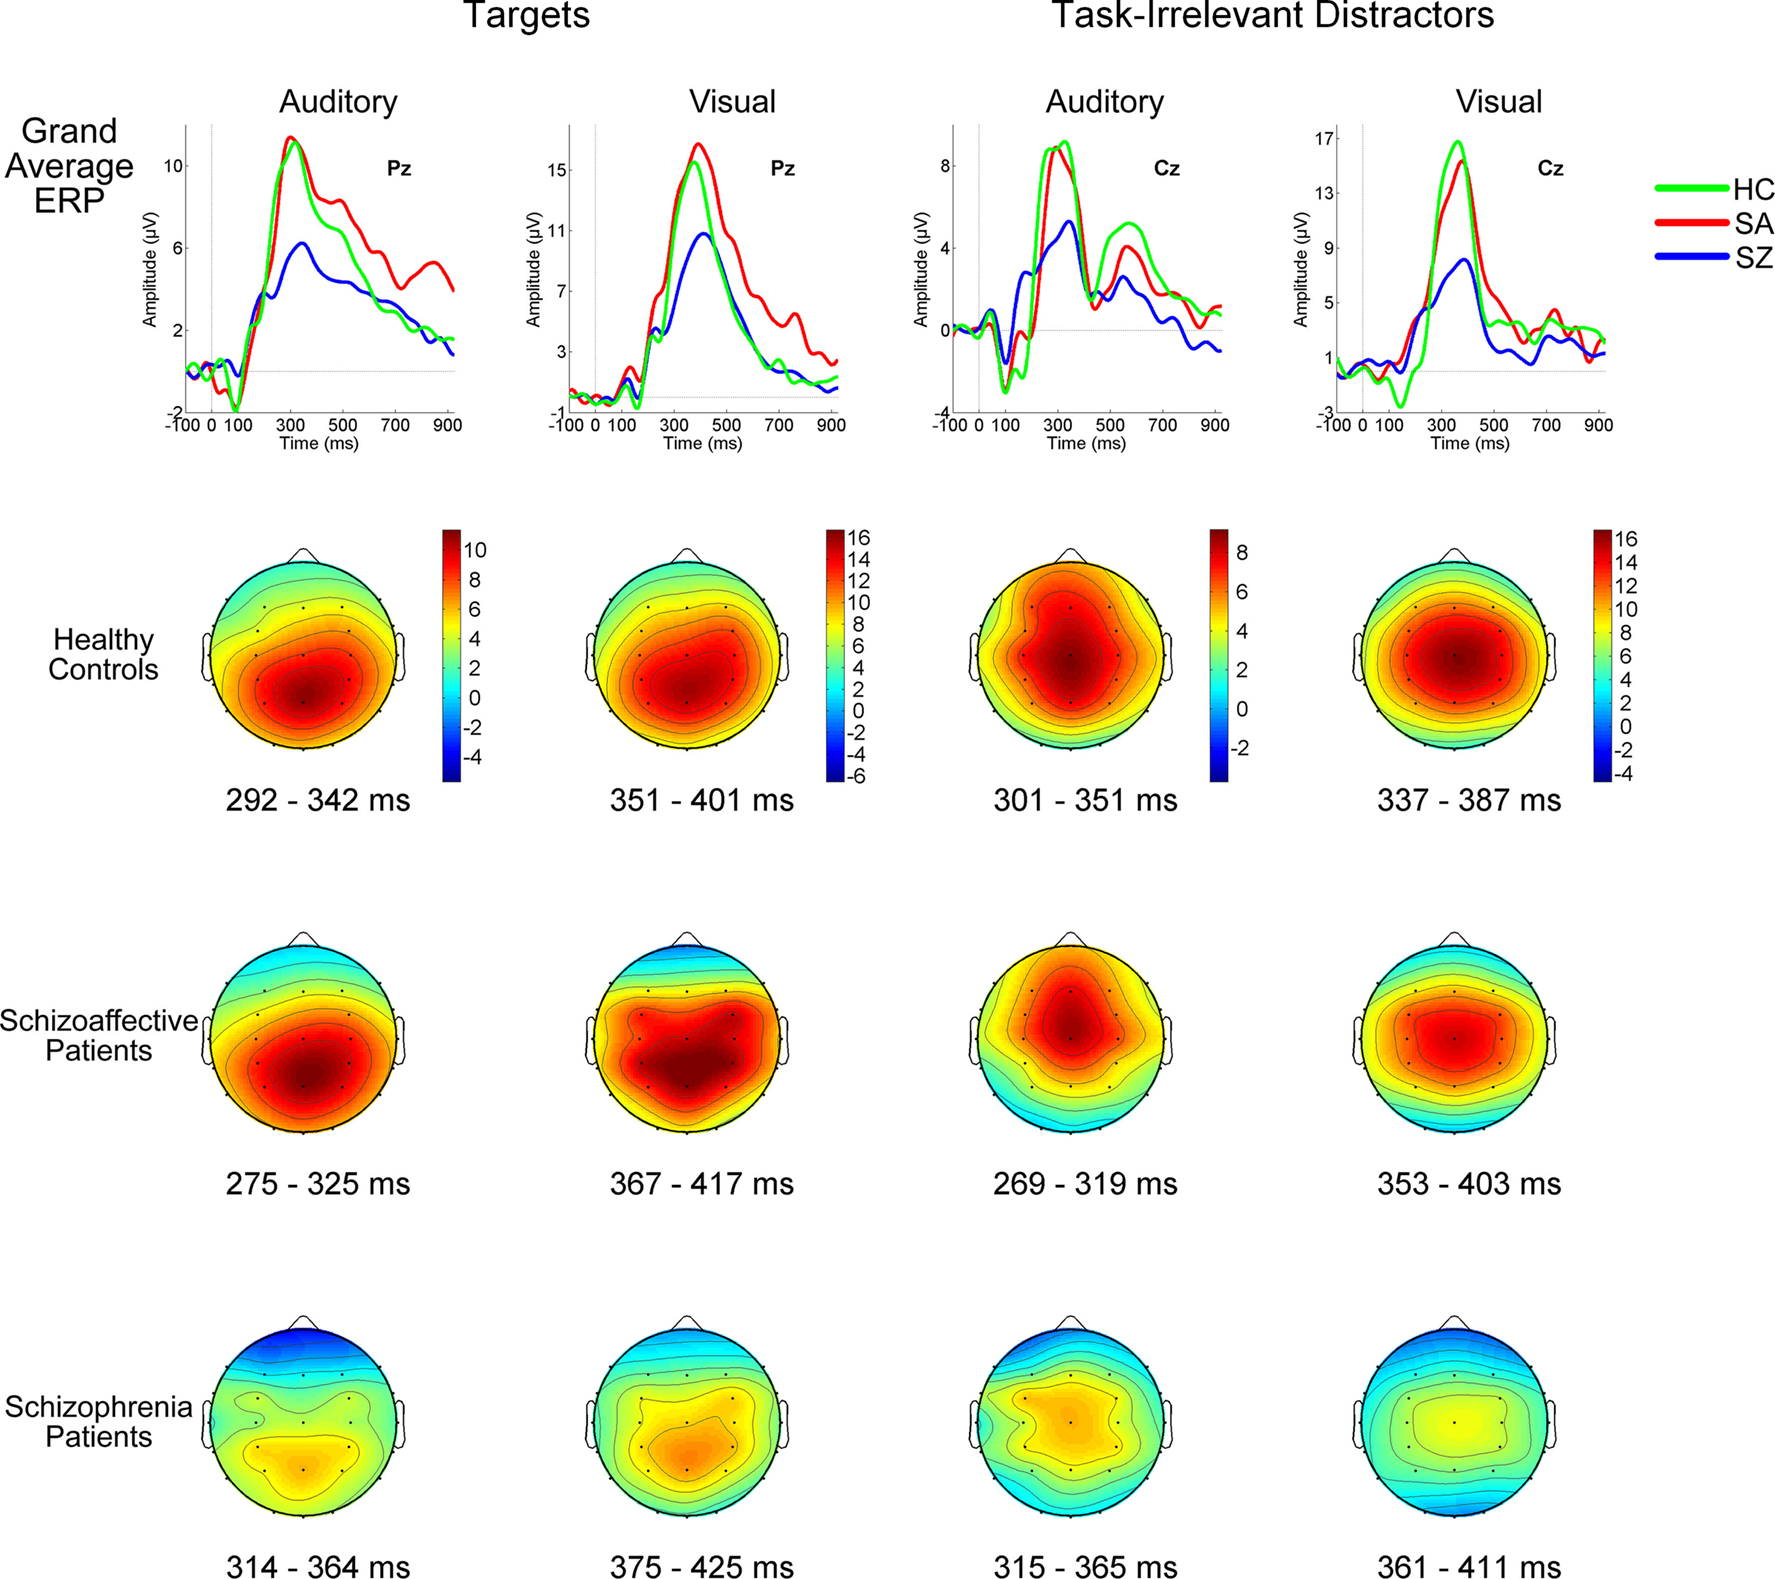
Figure 1. Grand average ERPs (top row) and P300 scalp topography maps for Auditory and Visual Targets (far left and mid-left columns, respectively) and Auditory and Visual Task-Irrelevant Distractors (mid-right and far right columns, respectively) in healthy controls (HC; second row), patients with schizoaffective disorder (SA; third row) and patients with schizophrenia (SZ; fourth row). Latency windows capturing the P300 for each condition and group are indicated below each topographic map. The color-coding on the scalp topography maps reflects voltage for that group at that site. In the grand average plots, target ERPs are plotted from electrode Pz and task-irrelevant distractor ERPs are from Cz. ERPs are overlaid for HC (green tracings), SA (red tracings) and SZ (blue tracings) groups. Time is shown on the x-axis and voltage on the y-axis. Voltage scales are different for the different stimulus types. Positivity relative to the reference electrodes is plotted up.
Clinical and demographic measures
Symptoms were rated by trained interviewers using the Positive and Negative Symptom Scale (PANSS) (Kay et al., 1987
), yielding summary severity measures for all (PANSS General), positive (PANSS Positive) and negative (PANSS Negative) symptoms. Illness duration was calculated based on the age of illness onset estimate from the SCID. Parental socioeconomic status (SES) was assessed using the Hollingshead scale (Hollingshead and Redlich, 1958
) with higher scores indicating lower parental SES. Demographic and clinical data for all groups are summarized in Table 1
.
Statistical Analysis
Analysis of variance
Accuracy (percent correct) was analyzed in a 3-way Group (SZ, SA, HC) × Deviant Type (Target, Distractor) × Modality (Auditory, Visual) analysis of variance (ANOVA). Accuracy for distractor stimuli reflected withholding a response, such that a subject who never false-alarmed to distractor stimuli was 100% correct. Subject median reaction times (RT) to targets were analyzed in a 2-way Group × Modality ANOVA.
P300 amplitudes were analyzed in three ANOVAs, one for midline sites (Fz, Cz, Pz), and two for off-midline sites to assess for hemispheric laterality effects. The midline ANOVA included factors for Group (SZ, SA, HC), Deviant Type (Target, Distractor), Modality (Auditory, Visual) and Anterior-Posterior Site (AP: Frontal, Central, Parietal). The two off-midline ANOVAs each included factors for Group, Deviant Type, Modality, AP, and Hemisphere (Left, Right), but different lateral sites defined the hemisphere effect in each ANOVA. In one, far lateral sites defined a Lateral Hemisphere factor (Lateral Left: F7, T3, P5; Lateral Right: F8, T4, P6). In the other, more medial off-midline sites defined a Medial Hemisphere factor (Medial Left: F3, C3, P3; Medial Right: F4, C4, P4).
P3b and P3a peak latencies for target and distractor stimuli were only measured at Pz and Cz, respectively, because that is where each type of P300 was largest and where its peak latency was likely to be most accurate. P300 latencies were analyzed in a 3-way Group × Deviant Type × Modality ANOVA.
Interactions were parsed using lower order ANOVAs. Differences between groups were assessed with least squares differences (LSD) post-hoc tests.
Hierarchical multiple regression
Relationships of P300 with clinical and demographic variables were evaluated using hierarchical multiple regression models in which P300 amplitude was regressed on the Clinical/Demographic Variable and Diagnosis (SZ versus SA) simultaneously entered into the model at Step 1, and the Diagnosis × Clinical/Demographic Variable interaction added to the model at Step 2. When the interaction, reflecting group differences in the slope of the P300-clinical/demographic variable regression line, was not significant, only regression results at Step 1 were considered, providing tests of (a) the relationship between the clinical/demographic variable and P300 and (b) diagnostic differences in P300 controlling for the clinical/demographic variable. These analyses were limited to target P3b measured at Pz and distractor P3a measured at Cz.
Mann–Whitney U-tests
Non-parametric Mann–Whitney U-tests were performed to compare P300 amplitudes in the SA-Bipolar Type (n = 10) and SA-Depressive Type (n = 5) subgroups. These tests were done separately for each modality and deviant type, using the Pz electrode for target P3b and the Cz electrode for distractor P3a. Non-parametric tests were deemed more appropriate than parametric tests for these analyses because of the small size of these two patient subgroups.
Behavioral Data
Percent correct
ANOVA results are summarized in Table 2
. There was a significant main effect of Group, with post-hoc tests showing that while SZ (94.4%) and SA (93.1%) groups did not differ, both were significantly (p < 0.002) less accurate than the HC group (98.5%). A significant Modality effect, which did not interact significantly with Group, indicated that subjects were more accurate during the visual (96%) than the auditory (94%) task. A significant Deviant Type effect indicated that subjects committed fewer false alarm errors to distractor stimuli than omission errors to targets. A significant Deviant Type × Group interaction was parsed with sub-ANOVAs within each group; the Deviant Type effect on accuracy was greater in the SZ (distractor: 98% versus target: 91%; p = 0.02) and SA (distractor: 95% versus target: 91%; p = 0.04) groups than in the HC group (distractor: 99% versus target: 98%; p = 0.63).
Reaction times to targets
As presented in Table 2
, there was a significant Group effect, with HC (332 ms) responding more quickly than SZ (400 ms; p < 0.001) or SA (379 ms; p = 0.01) groups. RTs in the two patient groups did not differ (p = 0.24). Modality and Group × Modality effects were not significant.
ERP Data
Group overlays of the grand average ERP waveforms and maps of their corresponding scalp topographies, in which the P300 component is evident as a large positive wave peaking around 300 ms, are shown separately for each Deviant Type and Modality in Figure 1
. ANOVA results for P300 amplitude and latency conducted for midline electrodes, and results of the two off-midline ANOVAs assessing Medial and Lateral Hemisphere effects, respectively, are summarized in Table 2
.
Midline analysis
There was a significant Group effect on P300 amplitude at midline sites (see Table 2
). Post-hoc tests showed SZ to have smaller P300 amplitudes than either HC (p < 0.0001) or SA (p < 0.001) groups, but HC and SA groups did not significantly differ. Importantly, Group did not significantly interact with Deviant Type or Modality (see Figure 2
).
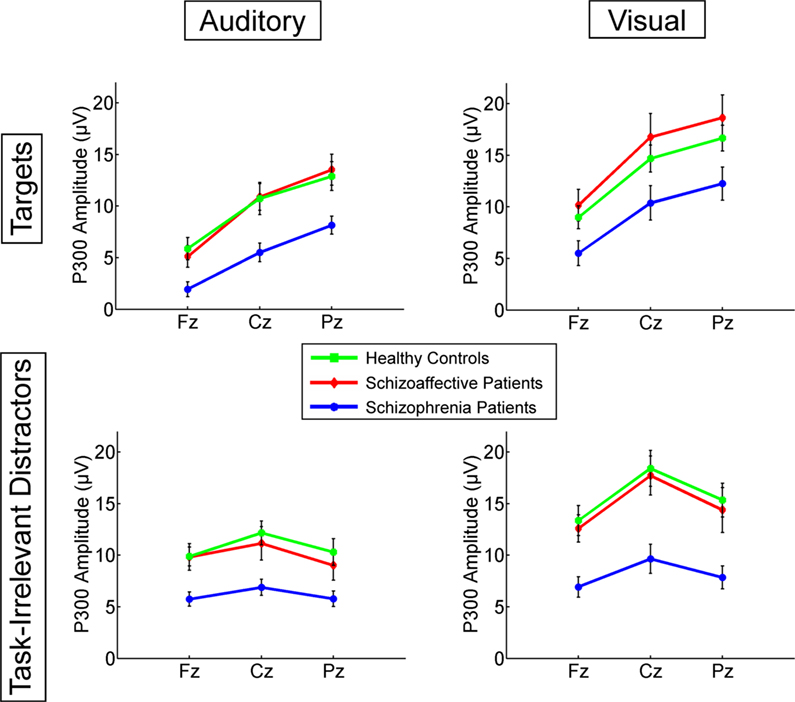
Figure 2. Means for P300 amplitudes from Fz, Cz, and Pz are plotted for Auditory Targets (upper left), Auditory Task-Irrelevant Distractors (lower left), Visual Targets (upper right) and Visual Task-Irrelevant Distractors (lower right). Color-coding is the same as in Figure 1
.
A significant Modality effect on P300 amplitude indicated that visual P300s (12.8 μV) were larger than auditory P300s (8.6 μV). Deviant Type did not significantly affect P300 amplitude (target P300s = 10.5 μV; distractor P300s = 10.9 μV). Although the Modality × Deviant Type interaction was not significant, a significant higher-order Modality × Deviant Type × AP interaction emerged. To parse this interaction, the Deviant Type × AP interaction was assessed separately for auditory and visual modalities. Although the Deviant Type × AP interaction was significant in both modalities, it was stronger for auditory [F(2,112) = 113.5, p < 0.0001] than for visual [F(2,112) = 52.6, p < 0.0001] P300s. In both modalities, distractor stimuli elicited a P300 with a central maximum typical of P3a scalp topography, whereas target stimuli elicited a P300 with a parietal maximum typical of P3b topography (see Figure 1
).
Off-midline analysis
Because schizophrenia patients sometimes have smaller P300s over left than right temporal sites (McCarley et al., 1991
), our focus in the off-midline analyses was only on effects involving Group × Hemisphere interactions. None of these effects was significant for the medial or lateral hemisphere ANOVAs (see Table 2
). Other significant hemisphere effects, which only emerged for the medial hemisphere sites, are not described further because they were not germane to our study aims.
P300 latency
There was a significant Group effect on P300 latency, with HC having an earlier P300 (333 ms) than SZ (355 ms) and SA (352 ms) groups (see Table 2
). Significant main effects for Deviant Type and Modality indicated that P300 was later to target (361 ms) than distractor (333 ms) stimuli and later to visual (375 ms) than auditory (319 ms) stimuli, respectively. Group did not interact significantly with Deviant Type or Modality.
P300 relationships with clinical and demographic variables
Results of hierarchical multiple regression analyses conducted to assess the effects of clinical or demographic variables, diagnosis (SZ versus SA), and their interaction, on P300 amplitude are presented in Table 3
.
SZ patients had more severe symptoms than SA patients for PANSS General [t(32) = −2.31, p = 0.028], PANSS Positive Symptoms (trend level only: [t(32) = −1.86, p = 0.072], and PANSS Negative Symptoms [t(32) = −2.09, p = 0.044]. At step 2, no significant group differences in the slopes of the P300-PANSS Severity score relationships emerged for any of the P300s examined. At step 1, none of the PANSS Severity scores were significantly related to P300 amplitude, and SZ continued to exhibit smaller P300s than SA patients (significant Diagnosis effect) for all but the visual targets (which showed a trend).
The patient groups did not differ in illness duration [t(31) = −1.58, p = 0.12]. At step 2, the slopes of the relationship between illness duration and P300 amplitude significantly differed for the two groups only for P300 elicited by auditory target and visual distractor stimuli. The difference in slopes reflected relatively steeper declines in P300 amplitude with increasing illness duration in the SA group (auditory target P300: r = −0.51, p = 0.06; visual distractor P300: r = −0.72, p = 0.004) but not in the SZ group. As shown in Figure 3
, larger P300 amplitude in SA, relative to SZ, patients was particularly evident early in the illness course. At step 1, P300s elicited by visual target and auditory distractor stimuli were not significantly related to illness duration. Moreover, SZ continued to exhibit smaller P300 than SA patients for auditory distractor stimuli, but not for visual targets (which showed a trend).
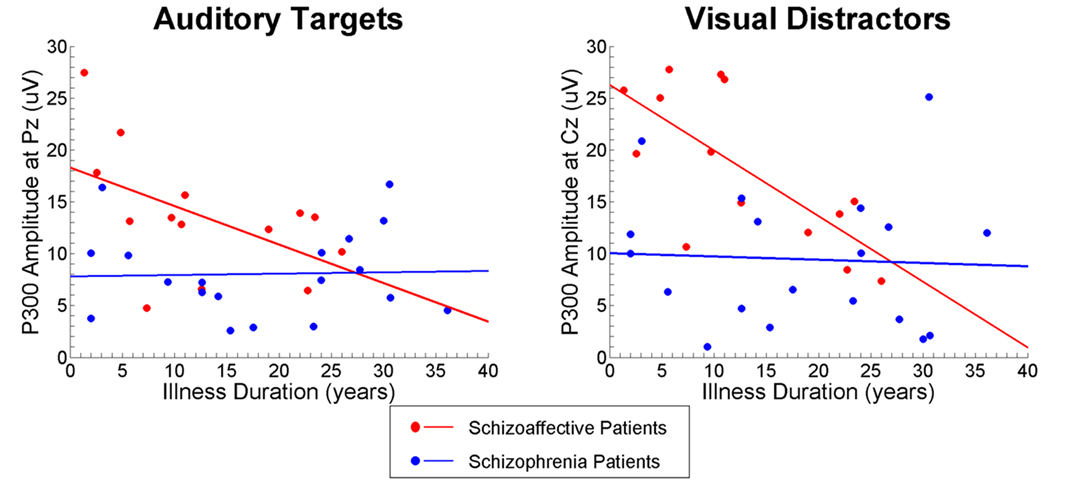
Figure 3. Scatterplots showing relationships between Illness Duration (years) and P300 amplitude elicited by Visual Task-Irrelevant Distractors (right) and Auditory Targets (left) for schizoaffective patients (red) and schizophrenia patients (blue).
The patient groups had similar parental SES (p = 0.25). At step 2, the slopes of the relationship between parental SES and P300 amplitude were not significantly different for any of the types of P300. At step 1, parental SES was not significantly related to P300 amplitude. Controlling for parental SES, P300 amplitudes were smaller in SZ than SA patients for auditory target and visual distractor stimuli, with similar trends evident for visual target and auditory distractor stimuli.
The patient groups did not differ in years of education (p = 0.12). At step 2, the slopes of the relationship between education and P300 amplitude were significantly different in the two groups only for visual targets. This arose because in SA, but not SZ, patients, fewer years of education were associated with larger P300s. At step 1, this inverse relationship between years of education and P300 was evident in both groups for visual distractor stimuli, with a similar trend for auditory targets. Since these inverse relationships were somewhat paradoxical and are not relevant to our study aims, they are not discussed further. Importantly, after accounting for these education-P300 relationships at Step 1, P300 was still significantly reduced in SZ relative to SA patients.
When the 4 SZ patients taking typical antipsychotics were excluded, P300 amplitudes continued to be significantly smaller in the SZ than the SA group.
Comparison of schizoaffective disorder subtypes
Mann–Whitney U-tests comparing the SA-Bipolar Type (n = 10) and SA-Depressed Type (n = 5) subgroups found no significant group differences in P300 amplitude, regardless of which deviant type or sensory modality was examined.
This is the first ERP study to directly compare schizoaffective disorder and schizophrenia. Surprisingly, schizoaffective disorder patients did not exhibit abnormally reduced P300 amplitudes, despite significant P300 reduction in schizophrenia patients evident in both the present study and numerous prior studies (Ford, 1999
; Jeon and Polich, 2003
). This suggests that the neurophysiological mechanisms supporting attentional resource allocation to infrequent stimuli, whether they be task relevant targets or task-irrelevant distractors, are intact in schizoaffective disorder but impaired in schizophrenia.
This finding adds to a very sparse research literature examining neurobiological distinctions between schizophrenia and schizoaffective disorder (Evans et al., 1999
; Kempf et al., 2005
; Cheniaux et al., 2008
; Peralta and Cuesta, 2008
) and provides striking data in support of this distinction. In interpreting the P300 amplitude group differences observed in our study, it is important to note that the two patient groups showed similar deficits on speed and accuracy of responding and similar prolongation of P300 latency. They also had similar backgrounds in terms of education and parental socioeconomic status. Moreover, despite the tendency for the schizophrenia patients to have more severe symptoms than the schizoaffective disorder patients, the group differences in P300 amplitude persisted when these clinical and demographic measures were taken into account.
Although the groups did not differ in illness duration, the schizoaffective patients had particularly large auditory P3b and visual P3a amplitudes earlier in their illness course, relative to schizophrenia patients with similarly short illness durations. This is consistent with data showing schizoaffective disorder to be associated with a better premorbid adjustment than schizophrenia (Saracco-Alvarez et al., 2009
). Subsequent P300 reduction due to illness progression appears to occur at a faster rate in schizoaffective disorder than in schizophrenia, at least for auditory P3b and visual P3a.
One of the hypotheses often subscribed to by clinical researchers is that the depressive type of schizoaffective disorder is more closely related to schizophrenia, whereas the bipolar type of schizoaffective disorder is more closely related to mood disorders. This distinction has received limited and somewhat inconsistent empirical support from family studies and clinical outcome studies (Kendler et al., 1995
; Cheniaux et al., 2008
). This led us to examine whether the normal P300 amplitudes observed in the schizoaffective patients as a group obscured a P300 amplitude deficit evident only within the schizoaffective-depressed type subgroup. With the caveat that our analysis of this question was limited by the small sample size of the depressed type subgroup, the data from the present study showed no significant, or even trend level, difference in P300 amplitude between the two subtypes of schizoaffective patients.
Although this is the first study to explicitly examine the difference in P300 between schizophrenia and schizoaffective disorder based on the application of current diagnostic criteria, prior studies by Strik et al. (1993)
have documented normal or even enhanced P300 (Strik et al., 1997
) amplitudes in patients who met criteria for cycloid psychosis, a psychotic disorder clinically distinguished from schizophrenia based on Leonhard’s diagnostic classification system that has been influential in European psychiatry. The current findings are complementary to, rather than replicative of, Strik’s earlier studies since cycloid psychosis is not clinically synonymous with current definitions of schizoaffective disorder (Vogl and Zaudig, 1985
; Zaudig, 1990
; Peralta et al., 2007
). Nonetheless, both sets of findings underscore the fact that, despite the commonly held view that P300 amplitude reduction is a relatively non-specific electrophysiological abnormality observed in a number of psychiatric disorders, it may nonetheless be useful in demarcating or validating diagnostic boundaries within the clinical heterogeneity encompassed by chronic psychotic disorders. At least within these murky waters, P300 amplitude reduction may be relatively specific to schizophrenia. While the intact P300 amplitudes in observed in patients with schizoaffective disorder in the present study does not prove that this disorder is pathophysiologically distinct from schizophrenia, it does raise questions about the wisdom of combining schizoaffective disorder and schizophrenia patients into a single group, a common practice in schizophrenia studies. Indeed, this practice may introduce neurobiological heterogeneity that obscures the distinct pathophysiologies of each disorder.
The initial aim of this study was to directly compare four types of P300, namely P3b and P3a elicited in auditory and visual oddball paradigms, in terms of their sensitivity to schizophrenia. While prior research suggests that auditory P300 is more sensitive to schizophrenia than visual P300 (Ford, 1999
; Jeon and Polich, 2003
), and that the top-down attentional processes reflected by target P3b may be particularly sensitive to schizophrenia’s higher-order cognitive deficits relative to the bottom-up processes contributing to P3a, these conclusions are mainly derived from studies assessing only one or two of the P300 types assessed in our study. Surprisingly, direct comparison of all four types of P300 failed to support their differential sensitivity to schizophrenia. Instead, our results suggest that P300 is reduced and delayed in schizophrenia to the same degree, irrespective of the sensory modality and attentional system engaged.
The authors declare that the research was conducted in the absence of any commercial or financial relationships that could be construed as a potential conflict of interest.
This work was supported by the VA Schizophrenia Biological Research Center and VA Merit Review and Research Career Development Award, and grants from National Institute of Mental Health (MH 40052, MH 58262, MH 67967), and the National Alliance for Research in Schizophrenia and Affective Disorders (NARSAD).
Cheniaux, E., Landeira-Fernandez, J., Lessa Telles, L., Lessa, J. L., Dias, A., Duncan, T., and Versiani, M. (2008). Does schizoaffective disorder really exist? A systematic review of the studies that compared schizoaffective disorder with schizophrenia or mood disorders. J. Affect. Disord. 106, 209–217.