1
Institute for Advanced Biosciences, Keio University, Japan
2
Graduate School of Media and Governance, Keio University, Japan
3
Department of Biology, Chemistry and Computer Science, University of York, UK
4
Department of Biosciences and Informatics, Faculty of Science and Technology, Keio University, Japan
5
Faculty of Environment and Information Studies, Keio University, Japan
The scale-free and small-world network models reflect the functional units of networks. However, when we investigated the network properties of a signaling pathway using these models, no significant differences were found between the original undirected graphs and the graphs in which inactive proteins were eliminated from the gene expression data. We analyzed signaling networks by focusing on those pathways that best reflected cellular function. Therefore, our analysis of pathways started from the ligands and progressed to transcription factors and cytoskeletal proteins. We employed the Python module to assess the target network. This involved comparing the original and restricted signaling cascades as a directed graph using microarray gene expression profiles of late onset Alzheimer’s disease. The most commonly used method of shortest-path analysis neglects to consider the influences of alternative pathways that can affect the activation of transcription factors or cytoskeletal proteins. We therefore introduced included k-shortest paths and k-cycles in our network analysis using the Python modules, which allowed us to attain a reasonable computational time and identify k-shortest paths. This technique reflected results found in vivo and identified pathways not found when shortest path or degree analysis was applied. Our module enabled us to comprehensively analyse the characteristics of biomolecular networks and also enabled analysis of the effects of diseases considering the feedback loop and feedforward loop control structures as an alternative path.
Network analysis has lead to the discovery of new components of the metabolic pathways in metabolic pathways and in signal transduction cascades. Examples of network analysis models include the small-world network model (Jeong et al., 2000
), in which the average path length is shortened, and the scale-free network model (Wuchty, 2001
), which has a degree distribution that follows a power law. Multilayer structural and motif analyses (Milo et al., 2002
; Shen-Orr et al., 2002
) have shown that metabolic pathways and protein interactions have more notable cluster structures (Ravasz et al., 2002
) than random networks, and that metabolic and signaling pathways behave like complex regulatory networks. In recent research on diseases, network analyses, like degree analysis of cancer-related genes using gene regulatory networks to identify the genes (Futreal et al., 2004
) and various other analyses of disease genes, revealed structural effects of disease on biomolecular networks (Ideker and Sharan, 2008
). Taken together, these findings suggest that cellular functions can be modelled as network structures and that investigation of disease phenomena through network analysis has the potential to reveal novel properties and pathways in biomolecular pathways associated with disease states?
The studies mentioned above assume that proteins do not change in the absence of external stimulation. Proteins in networks are known to be regulated by gene expression patterns, as well as adapting to the external environment (Luscombe et al., 2004
). To characterize the dynamic nature of protein networks, investigations into the effects of diseases on gene expression have been initiated for Alzheimer disease by means of diffusion kernels and microarray data (Ma et al., 2007
) and for cancer by means of gene expression data and network information (Chuang et al., 2007
). However, because networks function as multiple-complex regulatory structures, it is insufficient to study disease dynamics in protein networks through analysis of a single factor affecting the network or through analysis of structural properties.
In the present study, we investigated the protein networks associated with Alzheimer’s disease through feature analysis of regulated signal molecules, as well as by structural analysis of network component. Intraneuronal amyloid β (Aβ) is reported to be a major important factor for Alzheimer’s disease. Aβ, which is the product of the protein catabolic enzyme, is normally transported out of cells (Iwata et al., 2000
). In Alzheimer’s disease the aggregation and deposition of insoluble Aβ leads to nerve cell damage and is thought to be the pathogenic mechanism of Alzheimer’s disease (Hardy and Selkoe, 2002
). Studies of Aβ and protein catabolic enzymes, like β-secretase, have focused on changes in certain proteins. Although a few studies have focused on the entire network, the mechanism underlying the accumulation of Aβ has not been discovered. Thus, it is still unclear if the accumulation of Aβ is the direct cause of Alzheimer’s disease (Heneka and O’Banion, 2007
). Here, we aimed to use a network model to discover the characteristics of structures that most affect the hippocampal signal transduction pathway, and the regulatory mechanisms controlling gene expression in Alzheimer’s disease. We generated a network model for the Alzheimer’s disease patient signal transduction cascade, referred to as the Alzheimer’s disease network (“ADN”), from the signal transduction pathway in the hippocampal CA1 region (Ma’ayan et al., 2005
) and from gene expression data derived from patients with late onset Alzheimer’s disease (Liang et al., 2007
).
In order to understand the network form, we conducted feature analysis of signal molecules in the signal transduction cascade by measuring k-core, degree, closeness, betweenness, the change in the average shortest path length, and the change in the articulation points, following the removal of the Alzheimer’s-related signal molecules from the network. In our structural analysis of the network, we considered the network density, average clustering index, and average shortest path length. Regulatory structures, like the feedback loop and the feedforward loop, are more frequent in hippocampal signaling pathways than in the randomly generated networks (Ma’ayan et al., 2005
). Therefore, we analysed feedback loops and feedforward loops in the model network using the k-cycle structure (Nochomovitz and Li, 2006
). The k-cycle structure is defined as a network structure in which duplicating nodes are removed from the network when one node to the in-neighbours can be reached by the k-step. For analysis of pathway characteristics, the extracellular ligand was set as the input and cytoskeletal proteins and transcription factors were set as the output. Since there are many alternative signal transduction pathways (Coulson, 2006
), we used the k-shortest pathway (Rahman and Schomburg, 2006
) instead of the shortest path or path length for pathway analysis. With our model we were able to reproduce the Alzheimer’s disease shift in gene expression in the hippocampal signal transduction pathway and the shift in signal transduction in Alzheimer’s disease revealed in earlier studies.
Analysis Package for Biomolecular Networks
In our study, we developed the network analysis module “Analysis Package for Biomolecular Networks (BioNetpy)” using the Python software program. Python is suitable as an open resource because it excels in readability over other program languages and has superior system execution by utilizing the just-in-time compiler, psyco
1
. The BioNetpy module was constructed using the Python network analysis module NetworkX-0.3.6
2
and igraph-0.4.5
3
. We also used the numerical package Numpy-1.0.4, which is a Python numerical module
4
. The BioNetpy module performs the three analysis methods outlined in Figure 1
.
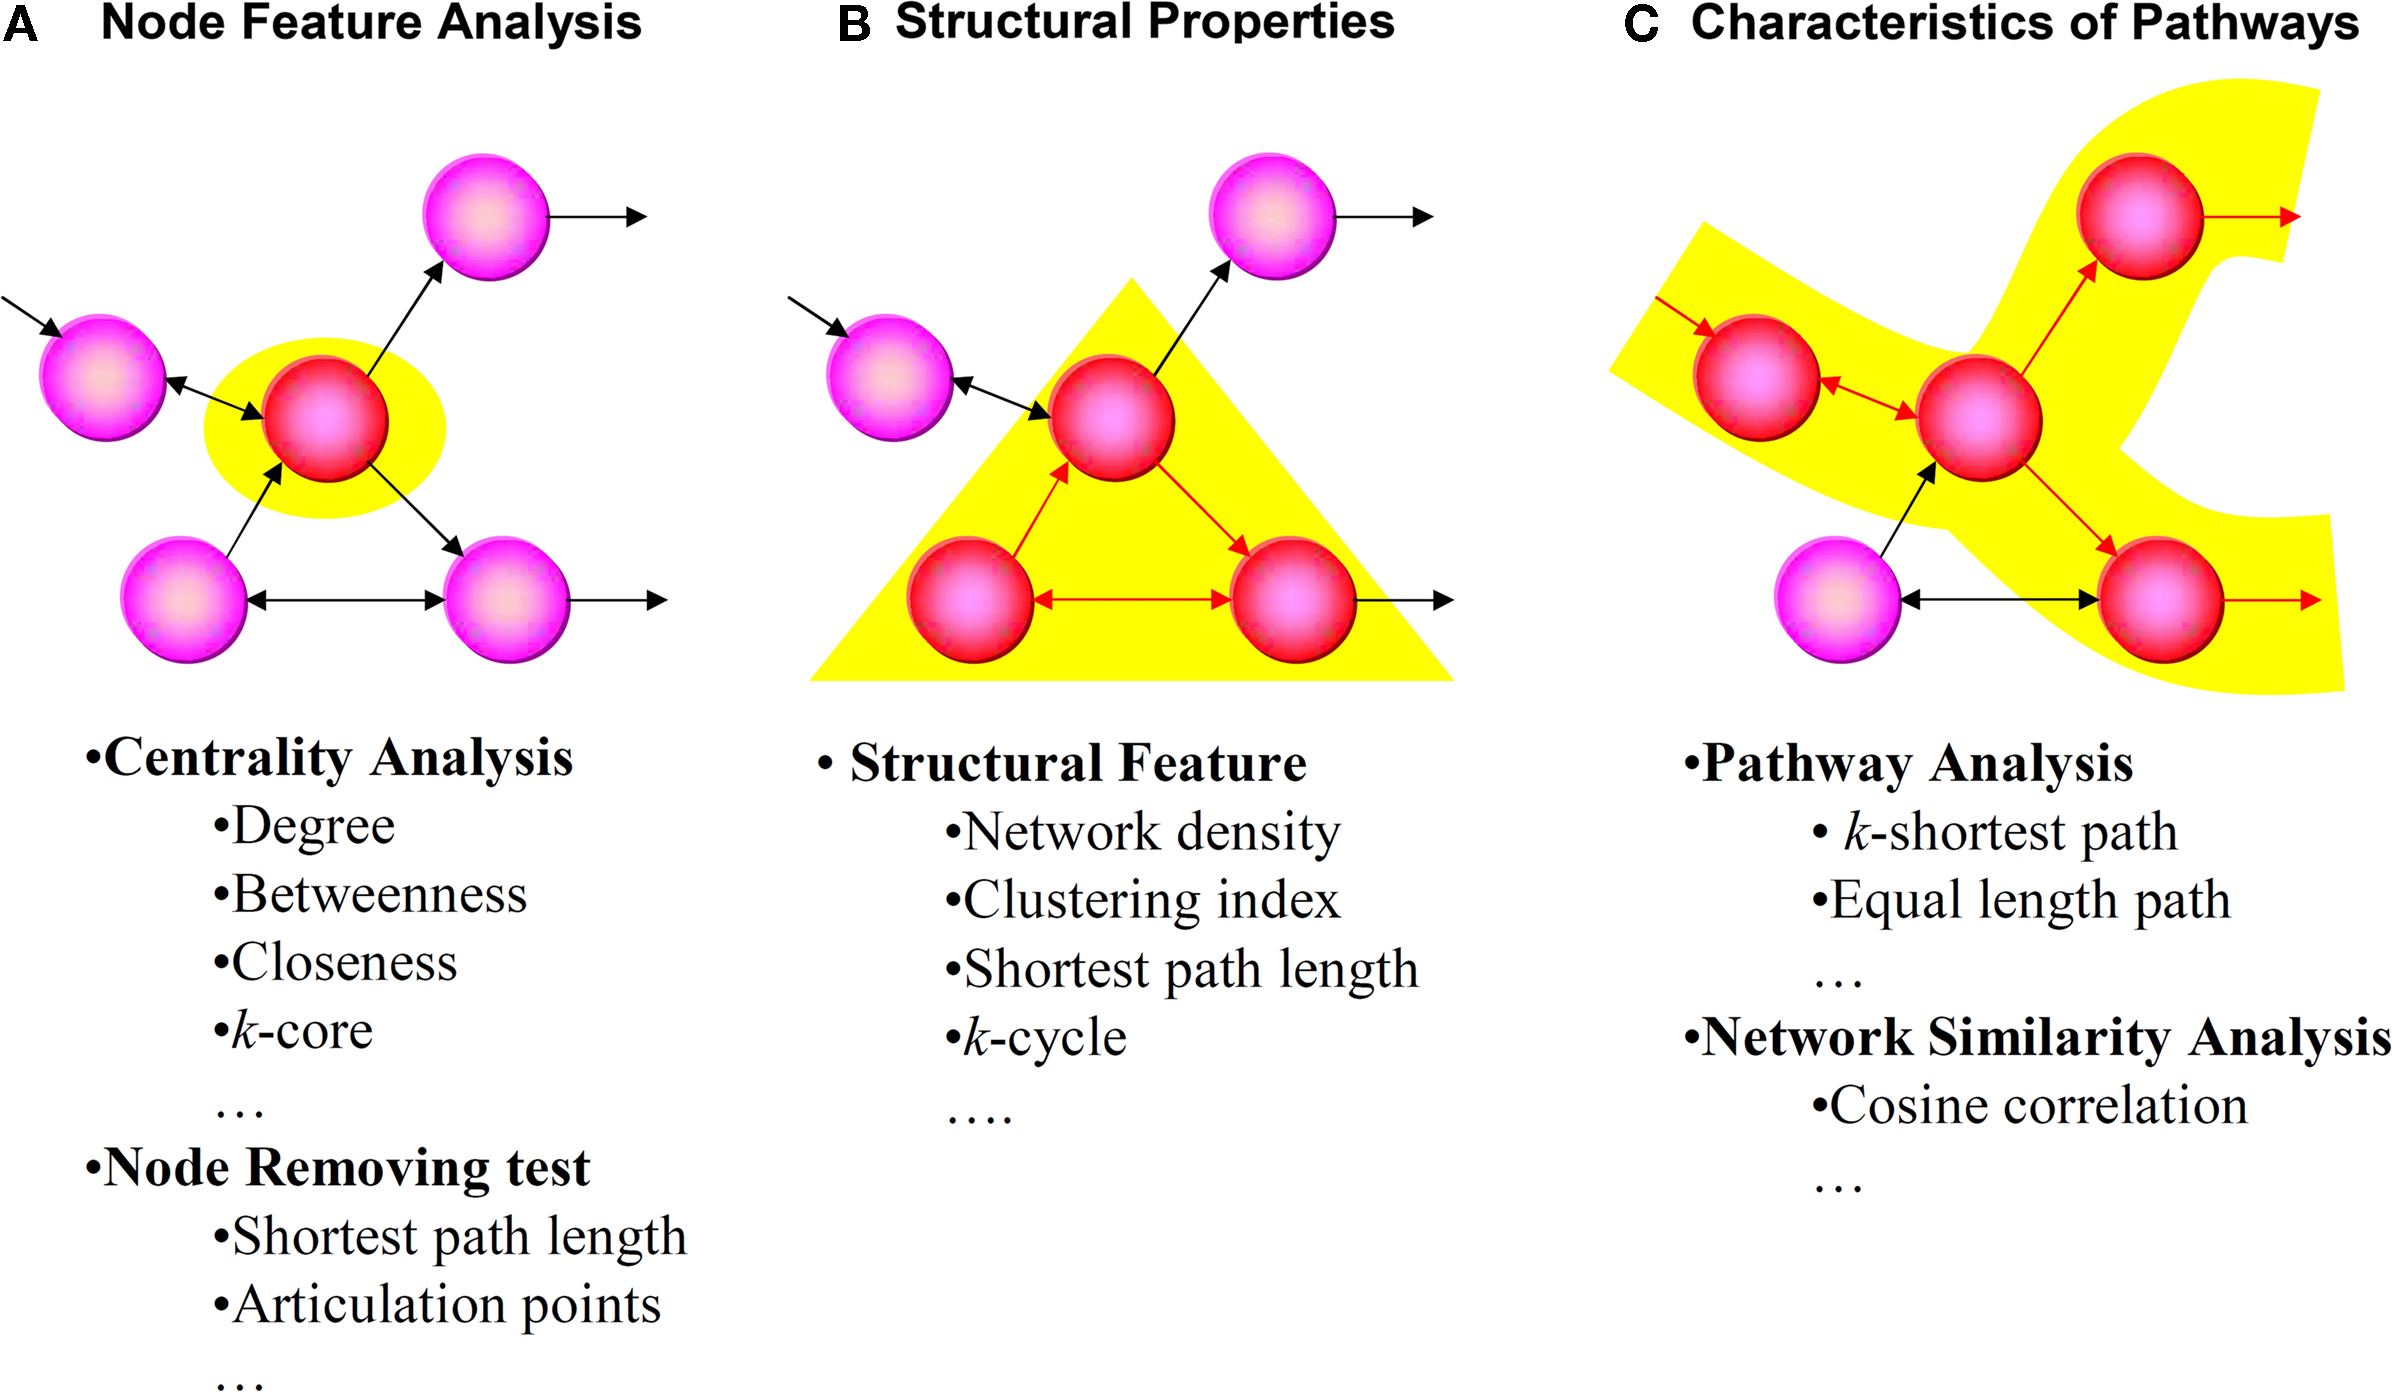
Figure 1. Analysis methods of the BioNetpy module. We used the BioNetpy module to perform the following three types of analyses: (A) node feature analysis (centrality and changes in indicators upon removal of node), (B) structural properties, and (C) characteristics of pathways (analysis of network similarity and pathways analysis). BioNetpy and Supplementary Material can be downloaded from http://medcd.iab.keio.ac.jp/bionetpy/
.
BioNetpy and Supplementary Material can be downloaded from the following website: http://medcd.iab.keio.ac.jp/bionetpy/
; http://www.frontiersin.org/neuroinformatics/paper/10.3389/ neuro.11/013.2009
.
Analysis of Gene Expression Data for Model Assembly
We used a network expressed by a directed graph of the signal transduction pathway of the hippocampal CA1 region in humans (Ma’ayan et al., 2005
). This network contains 570 nodes (signal molecules) and 1,333 edges (reactions). The edges can be categorized into three types of information defined as active, inactive, and bidirected (bidirectional activation or inactivation) information. We extracted gene expression data derived from GeneChip (Affymetrix) analysis of human hippocampal CA1 region. We applied the Bioconductor 2.2 program to analyse gene expression data (Reimers and Carey, 2006
). Bioconductor can be applied to the Python module by using the Rpy program
5
. We used the Human Genome U133 Plus 2.0 Array from the Bioconductor affy package (Gautier et al., 2004
). We extracted Alzheimer’s disease-related genes by analyzing GSE5281, which is a set of gene expression data derived from patients with late-onset Alzheimer’s (n = 10) and controls (n = 13) (Liang et al., 2007
) that has been recorded on the GEO database. We normalized the data by the distribution-free summarization method, which has been tested with the Spike-ins benchmark test on the Human Genome U133 Plus 2.0 Array and is known for its high-resolution summarization of microarray data (Chen et al., 2007
). After data normalization, we used the Bioconductor limma package (Smyth, 2004
) to define genes as Alzheimer’s disease-related genes within the P < 0.005 threshold by employing the empirical Bayes t-statistic test (Jeffery et al., 2006
). We matched genes and the corresponding signal molecules by correlating information from the NCBI Gene ID (Maglott et al., 2007
) and Swiss-Prot ID (Bairoch et al., 2004
) and defined signal molecules coded by Alzheimer’s disease-related genes as Alzheimer’s disease-related signal molecules. We conducted feature analyses by measuring k-core, betweenness centrality, closeness centrality, and degree centrality. We also analysed changes in the shortest path length, which is an indicator of a small-world network (Mason and Verwoerd, 2007
), and changes in articulation points, which is an indicator of network connectivity, after removing nodes from the Alzheimer’s disease-related signal molecule network. The k-core of a graph is the maximal subgraph in which each node’s degree is at least k. Betweenness centrality measures the importance of a node within a network. Nodes that occur on many short paths between other nodes have higher betweenness centrality than those nodes that do not. Closeness centrality is defined as the number of nodes minus one divided by the sum of the lengths of all shortest path lengths from and to the given node. Degree centrality is the number of nodes that a given node is connected to. We were able to analyse the characteristics of signal molecules in the network on multiple dimensions using these indicators.
Structural Properties of Hippocampal Pathways of Patients with Alzheimer’s Disease
We conducted a structural index analysis by generating an ADN after removing Alzheimer’s disease-related signal molecules from the control network (“CN”). We used a k-cycle structure for the analysis of feedback loop in the networks. The k-cycle structure is defined as a network structure from which duplicating nodes are removed when one node can be reached from the in-neighbors. An earlier study (Ma’ayan et al., 2005
) and our pilot study shows that 90% of all nodes can be reached within 9 steps for input (n = 30). Thus, we defined pathways within 9 steps of each other to be important for intercellular signal transduction. Because network structure depends on the number of nodes, we generated a randomly removed network (“RRN”) by removing nodes from the CN to equal the number of nodes of the ADN. We then limited the network density, average clustering index, and average shortest pathway length change of this new CN to 5% and compared the results. The k-cycle data can be analysed according to Eq. 1:

where Ck represents the number of k-cycle structures in the network. The function cyclen represents the number of cycle structures can be reached from the in-neighbors.
Characteristics of Hippocampal Signal Pathways in Patients with Alzheimer’s Disease
Cellular processes are controlled by many alternate signal transduction pathways (Coulson, 2006
). For this reason, we analysed the k-shortest pathway instead of analyzing pathway length or shortest pathways. We also generated an RRN and compared the k-cycle of the RRN with that of the ADN. Through exploration of the k-shortest path length, the number of pathways was carried out by calculating the shortest pathway length between nodes and by using Depth-First Iterative-Deepening (Korf, 1987
). We used the k-shortest pathway with extracellular ligands (n = 30) as input and cytoskeletal proteins (n = 24) and transcription factors (n = 35) as output to define 1,770 pathways for analysis. We defined the input and output of two important functions of the neural cell, neuronal plasticity and neurite outgrowth, to analyse the effects of Alzheimer’s disease on neural functions. Neuronal plasticity is controlled by depolarization of the postsynaptic cell by binding of glutamate to its receptors. Consistent with the network analysis described above, activation of these receptors activates the cAMP response element-binding protein (CREB), thus increasing the level of amino-3-hydroxy-5-methyl-4-isoxazolepropionic acid (AMPA) receptor (Hayashi et al., 2000
). For these reasons, we set glutamate as the starting point of the pathway and CREB as the endpoint for the neuronal plasticity pathway. The direction of neurite outgrowth is determined by guidance factors (Dickson, 2002
). Therefore, we set the guidance factors acetylcholine (ACh), insulin-like growth factor I (IGF1), nerve growth factor (NGF), and Ephrin at the start of the pathway, and tubulin, a microtubule protein, at the endpoint. An evaluation of robustness, defined in Eq. 2, was conducted by comparing the robustness values of all inputs and outputs of the ADN with that of the CN and RRN.
We also conducted a k-shortest pathway analysis of the pathways involved in neural cell death, the pathways that link directly to the amyloid β protein precursor (APP), and the pathways that link extracellular ligands to transcription factors or cytoskeletal proteins. Neuronal cells are known to enter apoptosis readily upon receiving signals of extracellular death ligands or DNA damage (Jellinger, 2006
). We defined the starting points of the neural death pathway as fas ligand (FasL) and tumor necrosis factor-α (TNFα), which induce apoptosis, and the endpoint as the DNA fragmentation factor (ICAD), an inhibitor of caspase-activated DNase, which fragments DNA. In addition, we defined the pathways between all ligands and included the APP-binding family A member 1 (MINT-1) (Yoon et al., 2007
) and caspase 3 (Su et al., 2002
) in the APP-related pathway. These pathways are shorter than that of neural plasticity and neurite outgrowth and can traverse from the input to the output through a shorter path. Therefore, we compared the number of pathways having the same input and output set in the total number of pathways and the number of pathways in the RRN in total number of pathways. The number of steps, k, used in the k-shortest pathway analysis in the k-cycle structure, was defined as 9 steps, using the following equation:

where R is the robustness value (R-value) of the pathway. In the pathways from glutamate to CREB and ACh, NGF, IGF1 and from Ephrin to tubulin, R is the difference between the numbers of k-shortest paths obtained by all inputs to outputs in all k-shortest path sets, which is defined as X. In the pathways from FasL and TNFα to ICAD, including all inputs to MINT-1 and caspase 3, R is the difference in the number of k-shortest paths between node i and node j obtained in the RRN sets, which is defined as X in this case. Nij is the k-shortest path number from node i to node j in the network of interest. MeanX is the mean of all k-shortest path sets or nodes in the RRN sets. SDX is the standard deviation of all k-shortest path sets or nodes in the RRN sets.
Equation 3 below shows the interpretation of network similarity using a single value (Barrett et al., 2006
) for the vector space of inputs and outputs in a network using a matrix expression for equal-length shortest path (Borgwardt and Kriegel, 2005
), which indicates pathways with equal steps. Our study analyzes the change in the entire pathway at step e.
where S represents network similarity between the first mode of singular value c (equal-length shortest-path matrix of CN) and o (equal-length shortest-path matrix of ADN or RRN); e represents the specific step value of the equal-length shortest-path matrix.
Feature Analysis of Signal Molecules
Through empirical Bayes t-statistics, we extracted 76 Alzheimer’s disease-related genes known to downregulate actin (Harigaya et al., 1996
) and beta-catenin (Li et al., 2007
), resulting in a decrease in the level of calcium/calmodulin-dependent protein kinase type II (CaMKII) (Allison et al., 2000
). Please refer to the Supplemental Material for a list of genes aforementioned. By observing the pathway functions of the signal molecules encoded by these 76 genes, we found the largest changes in the actual numbers of molecules with Kinase and Adapter functions, and the largest percentage change for nodes in the Receptor and Bcl2Family functional groups, which decreased at rates greater than the rate of change for the network overall (13%; Table 1
). We conducted a feature analysis of Alzheimer’s disease-related signal molecules and other molecules by measuring k-core, betweenness, closeness, degree, the change in average shortest path length, and the change in articulation points. There were no significant differences in these measurements between Alzheimer’s disease-related signal molecules and other molecules (P < 0.05, Mann–Whitney U-test; Table 2
). When we removed these Alzheimer’s disease-related signal molecules, the ADN contained 494 nodes and 974 edges. In total, 91% of the input–output sets were connected in the CN (average path length = 5.94), and 50% of those sets were connected in the ADN (average path length = 6.68).
k-Cycle Analysis of ADN
By comparing the number of k-cycle structures (k = 4, 5, …, 9) of RRN, CN, and ADN, we showed that the all-step k value decreased (Figure 2
). However, the graph shape was similar for each RRN and for each cycle structure number corresponding to the steps in the random sampling network; the correlation coefficient between ADN/CN and RRN/CN was 0.99. This finding also demonstrates that network size, not external factors, has an effect on cycle structure.
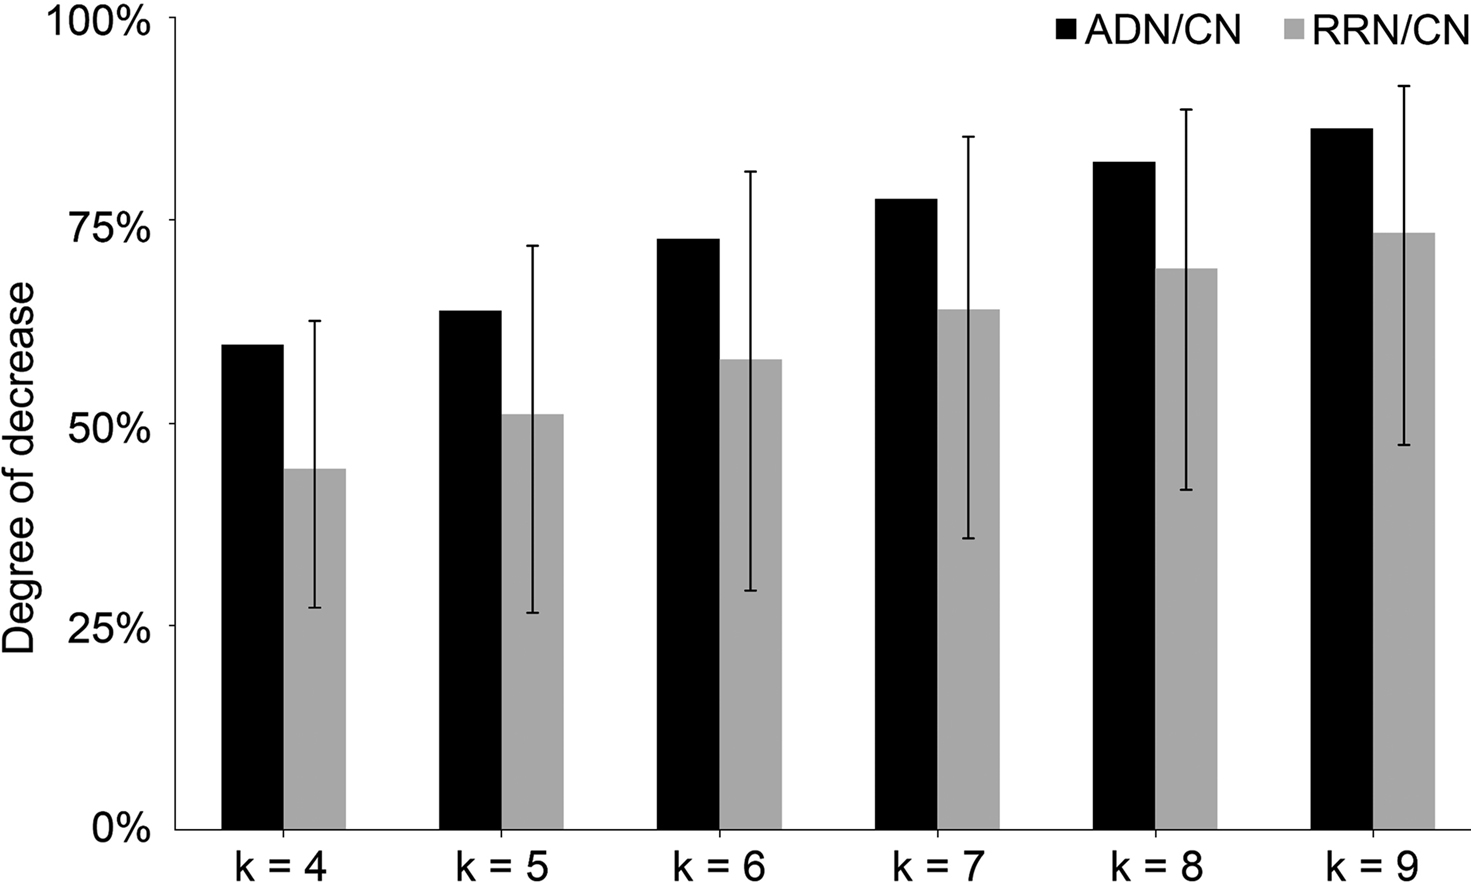
Figure 2. Result of k-cycle structure rate of ADN/CN and RRN/CN. The X-axis represents step k and the Y-axis represents the rate of decrease. The error bar represents a top value of 95% and a bottom value of 5%. We used RRN with a random Alzheimer’s disease-related signal molecule set, in which the rate of change in the three indicators (network density, average clustering index, and average shortest path length) is within 5%. By comparing the number of k-cycle structures (k = 4, 5, …, 9) of RRN, CN, and ADN, we showed that the all-step k value decreased. However, the graph shape was similar for each cycle structure number corresponding to the steps; the correlation coefficient between ADN/CN and RRN/CN was 0.99. This finding also demonstrates that network size, not external factors, has an effect on cycle structure.
k-Shortest Analysis of ADN
The k-shortest pathway analysis (k = 9) of CN, ADN, and RRN showed no notable difference in distribution shape between all inputs and outputs. There were also no differences in the average network pathway between ADN (67 ± 216) and RRN (144 ± 342) at k = 9. Thus, there was no difference in the effect of Alzheimer’s disease-related signal molecules and random signal molecule on any of the inputs or outputs. Next, we conducted an analysis of change in robustness (k = 4, 5, …, 9) for pathways associated with neuronal plasticity and neurite outgrowth, and for pathways associated with neuronal death and APP (Figure 3
). The change in robustness was the greatest for the pathways associated with neuronal plasticity (Walsh et al., 2002
) for ADN subtracted by CN and ADN subtracted by RRN, for each k value. Likewise, for the pathways associated with neurite outgrowth, there was a decrease in robustness for those involving NGF (Tuszynski et al., 2005
), which has a maintenance function in nerve cells, and ACh (Hoshi et al., 1997
), which decreases as Aβ accumulates. For the pathways associated with neuronal plasticity, the decrease in robustness for NGF and ACh was within the top 10% of all combinations. The set that showed the largest change in robustness was the pathway between glutamate and actin signal transduction (R-value was −14.9, −13.6 and −1.29 for ADN subtracted by CN, ADN subtracted by RRN and RRN subtracted by CN). The same change in robustness for the glutamate to actin signal transduction pathway was observed between ADN and RRN and between ADN and CN. This finding suggests that these changes in robustness do not depend on signal molecule number, network density, the average clustering index, or the average shortest path length. In the analysis of the pathways associated with neural cell death, there were no changes in robustness observed for the FasL to ICAD pathway; however, CN and RRN showed increases in each step of the TNFα to ICAD and caspase 3 pathways. TNFα and caspase 3 correlate positively with the accumulation of Aβ (Cacquevel et al., 2004
; McCusker et al., 2001
). Furthermore, these results show that Alzheimer’s disease-related signal molecules have more selective effects on neural plasticity and neurite outgrowth than random signal molecules.
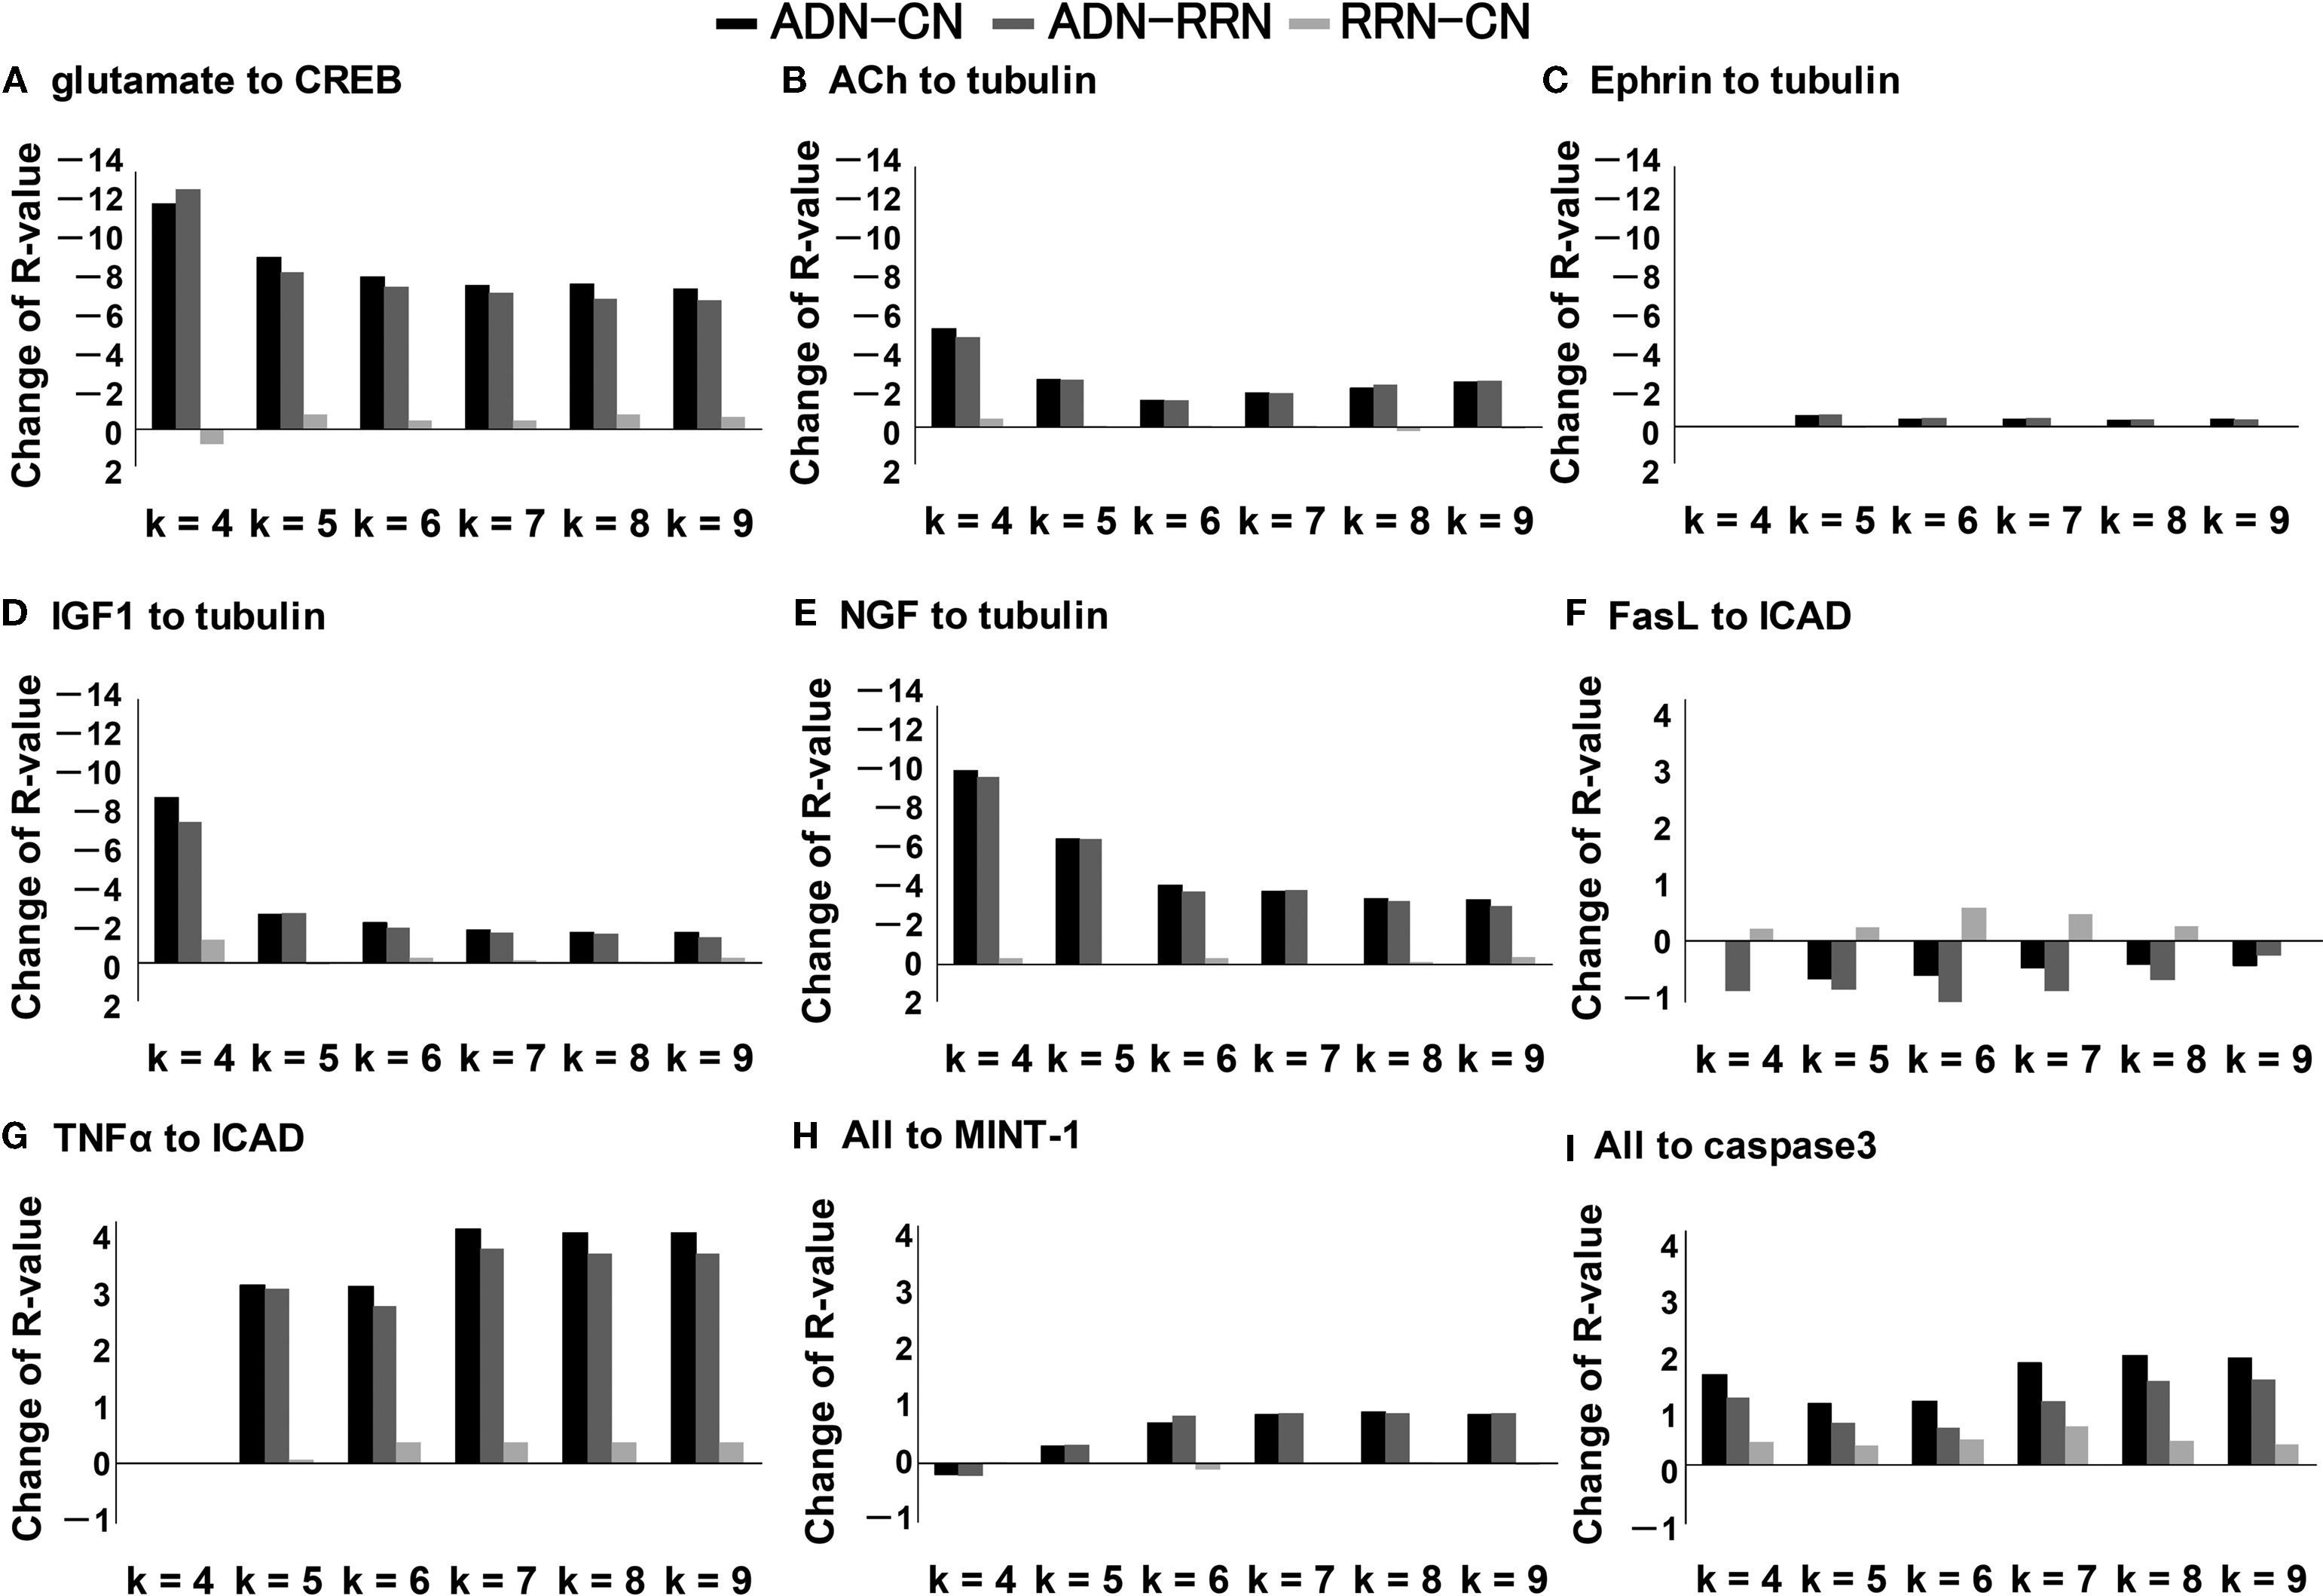
Figure 3. Pathway robustness: individual input–output relationships in ADN subtracted by CN, ADN subtracted by RRN, and RRN subtracted by CN (k = 4, 5, …, 9). (A) Robustness changes in the pathways associated with neuronal plasticity: input is glutamate and output is CREB. (B–E) Robustness changes in the pathways associated with neurite outgrowth: inputs are ACh, Ephrin, IGF1, and NGF, and output is tubulin. The decrease in robustness was large for the pathways involved with NGF, which has a maintenance function in nerve cells, and ACh, which decreases as Aβ accumulates. (F, G) Change in the number of pathways associated with neural cell death: inputs are FasL and TNFα, and output is ICAD. (H, I) Accumulation of APP: all inputs to MINT-1 as output (H) and to caspase 3 as output (I).
Analysis of certain inputs to all outputs showed a large decrease in signal molecules associated with neuregulin (NRG), which is a substrate of BASE1 (Willem et al., 2006
); with NGF, which is the drug target in Alzheimer’s disease; with reelin, which is thought to be related to Alzheimer’s disease (Botella-Lopez et al., 2006
); and with dopamine, which is a neurotransmitter (Figure 4
). By comparison, epidermal growth factor (EGF) and the neurotrophin family, which includes brain-derived neurotrophic factor (BDNF) and neurotrophin 4 (NT4), showed an increase in associated signal molecules. The level of BDNF is increased in patients with Alzheimer’s disease and in the hippocampus of a transgenic mouse model of Alzheimer’s disease (Laske et al., 2006
; Tang et al., 2000
). However, our finding that the R-value of inputs was between 0.8 and −1.2 suggests that the effect of BDNF on robustness in Alzheimer’s disease is small. Analysis of all inputs to certain outputs revealed that the largest decrease in associated signal molecules was for key factors in neural activity, including actin and tubulin, which are cytoskeletal proteins regulating neural plasticity and neurite outgrowth, and CREB, which is a transcription factor (Figure 4
). By comparison, transcription factors, such as the nuclear factor of activated T cells (NFAT), and actin-binding proteins, such as α-actinin and profilin, showed an increase in associated signal molecules. Because the R-value range was between 1.2 and −4.3, the result for the comparison of input to total output implies that Alzheimer’s disease affects the expression of output molecules more than input molecules.
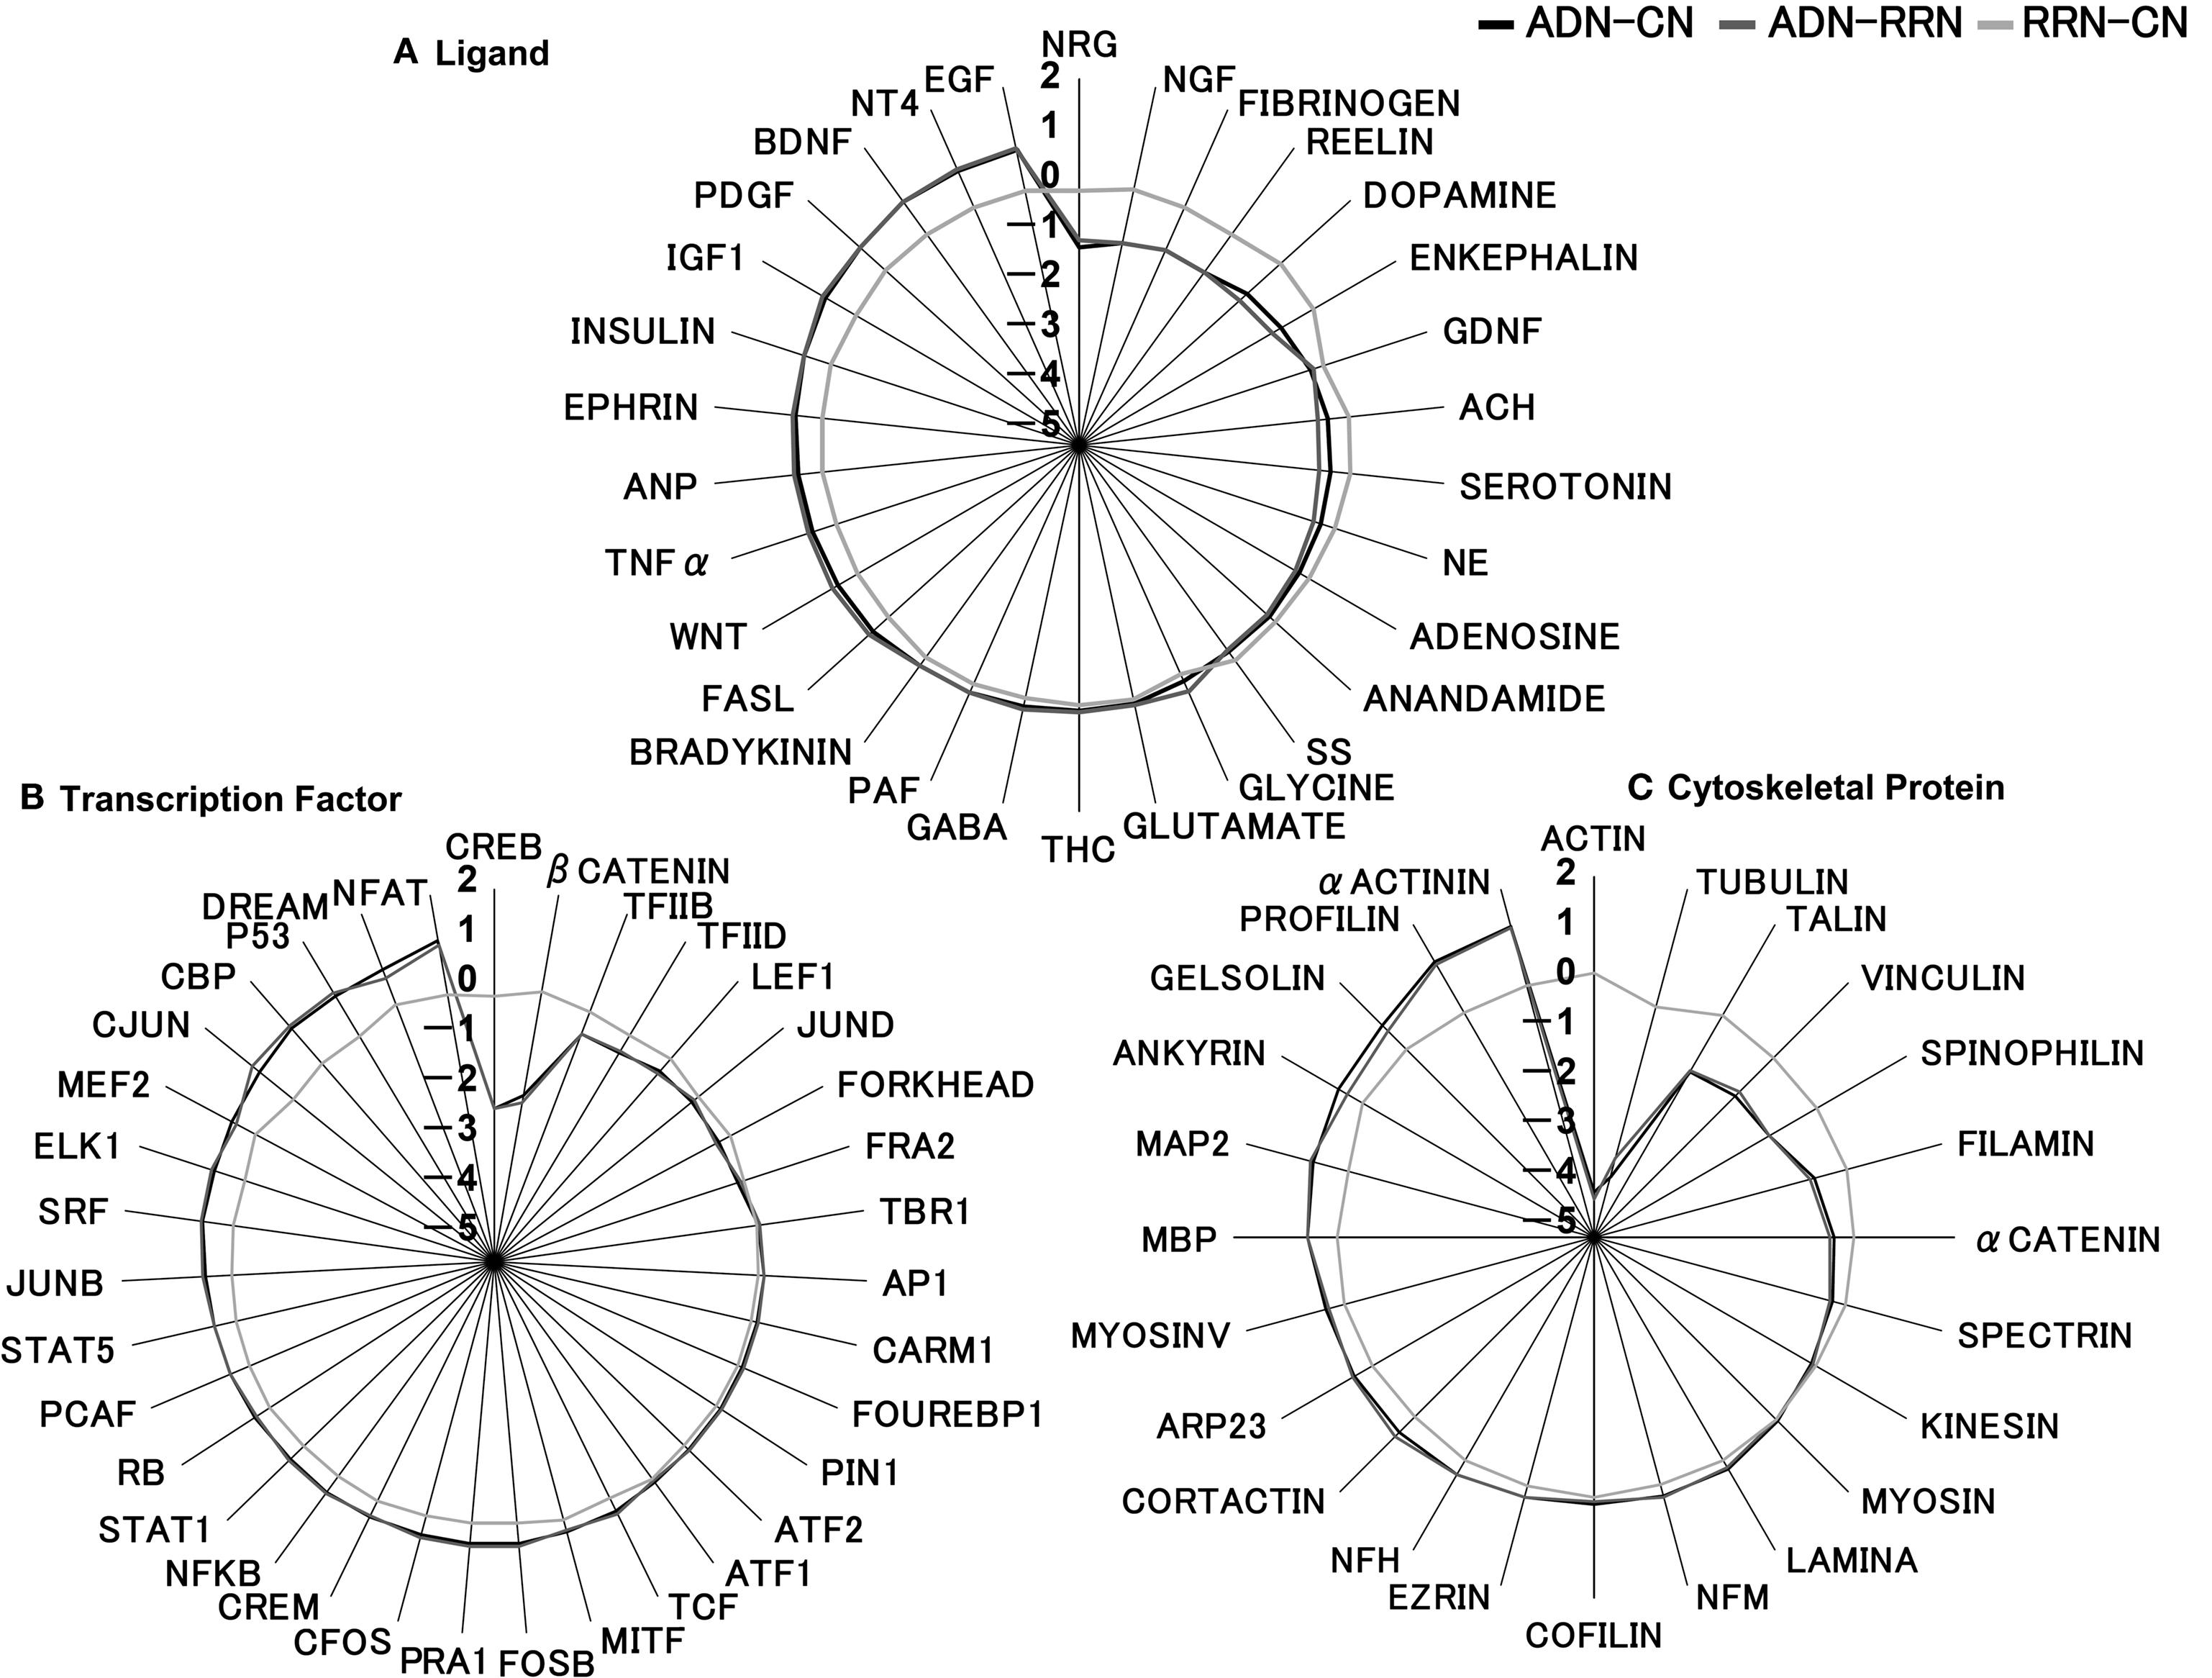
Figure 4. Robustness of inputs and outputs in ADN subtracted by CN, ADN subtracted by RRN, and RRN subtracted by CN (k = 9). (A) Robustness analysis of the pathway from certain ligands to all outputs (transcription factors and cytoskeletal proteins). The R-value range of inputs was between 0.8 and −1.2. Robustness analysis showed a large decrease in signal molecules associated with NRG, which a substrate of BASE1. EGF and the neurotrophin family, which includes BDNF and NT4, showed an increase in associated signal molecules. (B) Robustness analysis of the pathway from all ligands to certain transcription factors (R-value range, −2.1 to 1.1). (C) Robustness analysis of the pathway from all ligands to certain cytoskeletal proteins (R value range, −4.3 to 1.3). Robustness analysis of the key factors in neural activity in (B) and (C) revealed that the largest decrease in signal molecules was for those associated with actin and tubulin, the cytoskeletal proteins that regulate neural plasticity and neurite outgrowth, and for those associated with CREB, which is a transcription factor. By comparison, transcription factors, including the nuclear factor of activated T cells (NFAT), and actin binding proteins, such as α-actinin and profilin, showed an increase in associated signal molecules.
The analysis of the change in similarity between the input and output sets of CN, ADN, and RRN, shown as a matrix, indicate that ADN is lower than RRN when e = 5 and 9, but higher than RRN when e = 6, 7 and 8 (Figure 5
).
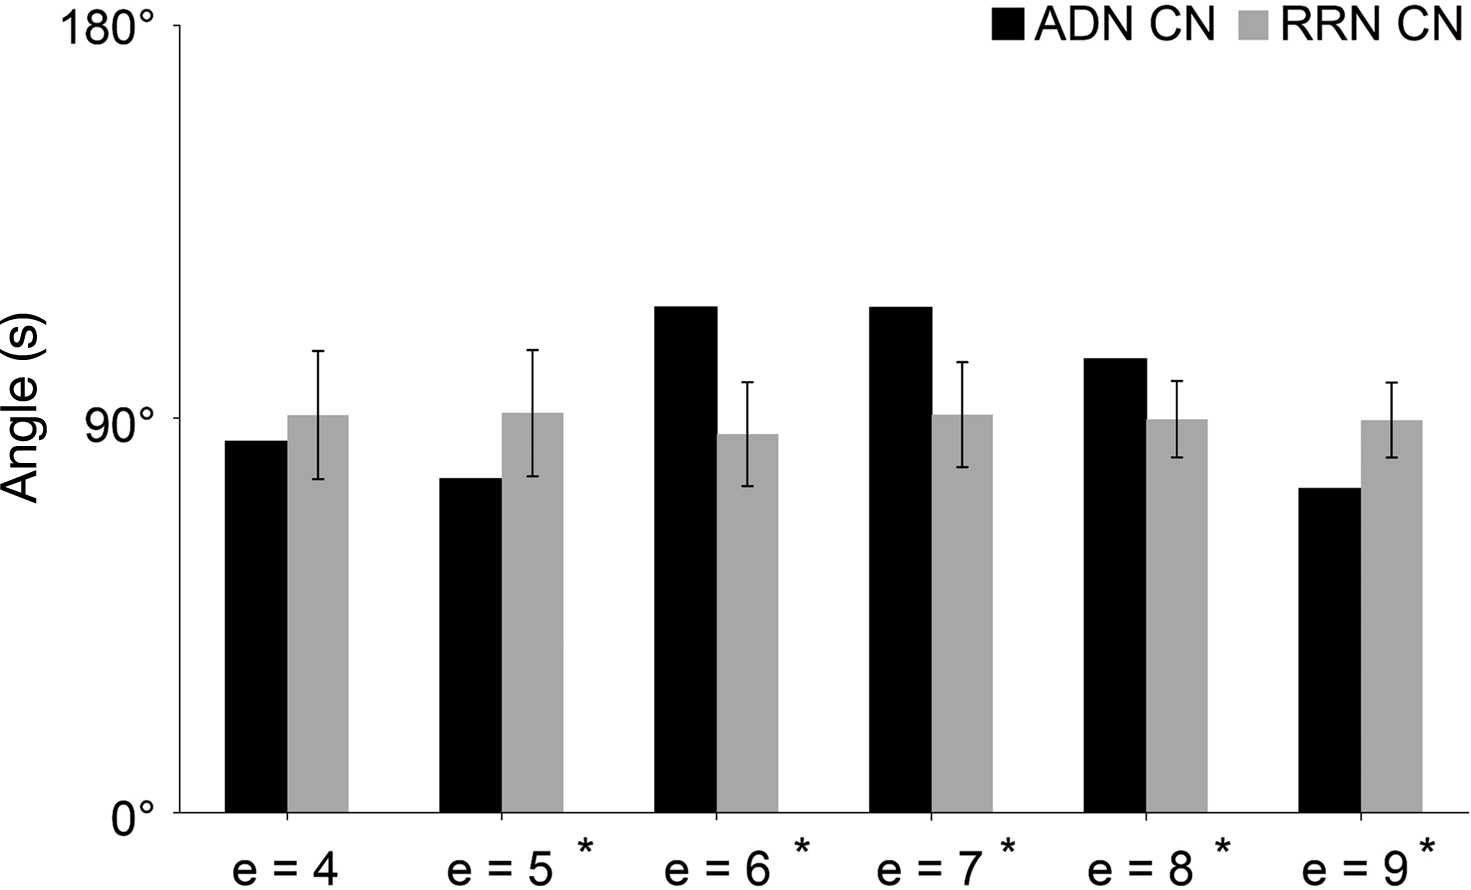
Figure 5. Network similarity analysis of CN, ADN, and RRN. The X-axis represents step e and the Y-axis represents the angle value (S). Error bars represent the SD. The results of the network similarity analysis for the input and output set are converted into a matrix and indicate that ADN is lower than RRN when e = 5 and 9, but is higher than RRN when e = 6, 7 and 8.
Microarray and Centrality Analysis of Signal Molecules
In our study, we conducted a feature analysis of Alzheimer’s disease-related signal molecules in a network. We conducted the analysis on genes from a large sample of patients in the early stage of late-onset Alzheimer’s disease. It is thought that new information on a disease pathogenesis can be gained by observing changes in a signaling pathway produced by the changes in the stages of Alzheimer’s disease. Data similar to that used in the present study, namely the registered expression data derived from the hippocampal CA1 region of Alzheimer’s patients at different stages (Blalock et al., 2004
), may be used for a similar analysis in the future. The data from the aforementioned study covers the four categories of Alzheimer’s disease status termed control, incipient, moderate, and severe. Therefore, we believe that we will be able to conduct time-series network analyses of these symptoms. The present study focuses only on gene expression data, yet Alzheimer’s disease characteristics not regulated by gene expression may also be considered by using alternative experimental methods, for example, the large-scale databases from other in vivo experiments (Bertram et al., 2007
) or positron-emission tomography (PET) studies (Tuszynski et al., 2005
).
In the feature analysis, we found no significant difference in signal molecules for all indicators. By comparison the average of indicators including degree and betweenness increased, for Alzheimer’s disease-related signal molecules compared to the other signal molecules. This trend is the same as that for characteristic disease-related genes defined in earlier studies (Ideker and Sharan, 2008
). Changing the threshold for defining Alzheimer’s disease-related genes has an effect on the results of gene expression data analysis In addition, it is difficult to analyze indicators like degree and betweenness, due to the method of calculating substances at the ends of networks. For this reason, substances like ACh and NGF, which are located at the ends of networks and are targets of drug development, require a combination of signal molecule analysis and pathway analysis that controls the input and output data. Therefore, additional findings on the pathogenesis of Alzheimer’s disease may be discovered through additional feature analysis of networks for data other than gene expression.
Network Structure
In the analysis of k-cycle structure, we discovered that k-cycle numbers decreased in all steps in the ADN/CN compared with that in RRN/CN and that the rate of decrease increased according to the step number. We also discovered that RRN had more k-cycle structure than ADN. However, since the decreasing rate at each step was the same in ADN and CN, the change in k-cycle number in this study has a larger effect on the network scale than the Alzheimer’s disease-related signal molecules. Moreover, the reason for the greater change in cycle structure by step number is believed to result from the effect of an increase in the number of nodes, which were randomly moved into the cycle. In future studies, it may be necessary to normalize changes in the network scale to conduct analyses on k-cycle structure. It must be noted that in this study, we focused on feedforward and feedback loops in the results of loop structure.
Pathway Characteristics
Our k-shortest pathway analysis of pathway characteristics revealed no changes between the R-values of all inputs and outputs and the pathway average. This result suggests that the effect of Alzheimer’s disease on the hippocampal signal transduction pathway does not correspond to the number of pathways or to the distribution of k-shortest pathways. We also discovered that the ADN-CN and ADN-RRN sets of Alzheimer’s disease-related signal molecules affect specific pathways more selectively than the random sets. In addition, the glutamate-actin pathway plays an important role in the formation of mature spines in the rat brain (Serge et al., 2003
), which showed the most significant decrease in R-value, also showed the most significant decrease in the RRN-CN pathway.
In the analysis of inputs, the decrease in robustness of NGF agreed with the decrease in robustness of Alzheimer’s disease. Increase in robustness was seen in both NT4 and BDNF. Earlier studies suggested that BDNF tends to increase in early-onset Alzheimer’s disease and decrease in late-onset Alzheimer’s disease. Also, insulin and IGF1 decreased in our study, but an increase in insulin and IGF1 was thought to occur as the result of an increase in Aβ in prior studies (Cole and Frautschy, 2007
). An increase in the level of the EGF receptor and Aβ is reported to be correlated (Zhang et al., 2007
), yet we found no evidence of this relationship in the present study. With respect to output factors, there were significant decreases of R-value in cytoskeletal proteins, like actin and tubulin, or in CREB thus suggesting that Alzheimer’s disease selectively affects the neural plasticity and neurite outgrowth. Moreover, increase was seen in actin binding proteins such as α-actinin and profilin. The reason for the decrease in actin might be explained by the tendency of actin-binding proteins to bind other proteins, such as cortactin, cofilin, and β-catenin; thus, actin may perform other functions that are specific to Alzheimer’s disease. There was an increase in NFAT in ADN, which is expressed at the same time as BDNF (Groth and Mermelstein, 2003
), and thus we believed that changes in NFAT synchronized with the changes in BDNF. In addition, the angle value in CN showed more change by step compared with RRN. This is because the effects of Alzheimer’s disease-related signal molecules are different at each step, and further interpretation of each step in the k-shortest pathway will be required in future studies. In our study, we succeeded in indicating changes caused by Alzheimer’s disease in signal transduction pathways through analysis of the features of signal molecules and of the properties of pathways in network structures.
We conducted a feature analysis on networks of signal molecules regulated by Alzheimer’s disease and analysed the properties of the network structure. In our analysis of signal molecules, we found no significant difference in all indicators. Network structure analysis revealed that Alzheimer’s disease-related signal molecule sets have a specific effect on the average shortest path length, with effects on motif structures, like feedforward and feedback loops, controlling the functions of neuronal cells. Also, our analyses of pathway characteristics extracted pathways related to neuronal plasticity, neurite outgrowth (including ACh and NGF), and neural death (including the TNFα pathway and caspase 3). In addition, similar changes in R-value in our study were observed for other Alzheimer’s disease signal transduction pathways. Similarity and k-shortest analysis of pathways showed that the effect of Alzheimer’s disease-related genes on networks depends on steps. This finding indicates that a k-shortest pathway analysis is more useful than a shortest pathway analysis. In summary, the Python module use in the present study enabled us to comprehensively analyse the characteristics of biomolecular networks and to assess the effects of Alzheimer’s disease using feedforward and feedback loop control structures as alternative paths.
The authors declare that the research was conducted in the absence of any commercial or financial relationships that could be construed as a potential conflict of interest.
We thank Y. Imanishi for initial help with the paper and N. Yachie and H. Nakamura for help on the website. This research was partially supported by Grant-in-Aid for Scientific Research from the Ministry of Education, Science, Culture, and Sport. This research was also supported by JGC-S Scholarship Foundation.
The Supplementary Material for the network edgelist, the table for mapping the network nodes and Swiss-Prot ID and Python module can be found online at http://medcd.iab.keio.ac.jp/bionetpy/ and http://www.frontiersin.org/neuroinformatics/ paper/10.3389/neuro.11/013.2009
.
Botella-Lopez, A., Burgaya, F., Gavin, R., Garcia-Ayllon, M. S., Gomez-Tortosa, E., Pena-Casanova, J., Urena, J. M., Del Rio, J. A., Blesa, R., Soriano, E., and Saez-Valero, J. (2006). Reelin expression and glycosylation patterns are altered in Alzheimer’s disease. Proc. Natl. Acad. Sci. U.S.A. 103, 5573–5578.
Iwata, N., Tsubuki, S., Takaki, Y., Watanabe, K., Sekiguchi, M., Hosoki, E., Kawashima-Morishima, M., Lee, H. J., Hama, E., Sekine-Aizawa, Y., Saido, T. C. (2000). Identification of the major Abeta1-42-degrading catabolic pathway in brain parenchyma: suppression leads to biochemical and pathological deposition. Nat. Med. 6, 143–150.
Li, H. L., Wang, H. H., Liu, S. J., Deng, Y. Q., Zhang, Y. J., Tian, Q., Wang, X. C., Chen, X. Q., Yang, Y., Zhang, J. Y., Wang, Q., Xu, H., Liao, F. F., and Wang, J. Z. (2007). Phosphorylation of tau antagonizes apoptosis by stabilizing beta-catenin, a mechanism involved in Alzheimer’s neurodegeneration. Proc. Natl. Acad. Sci. U.S.A. 104, 3591–3596.
Liang, W. S., Dunckley, T., Beach, T. G., Grover, A., Mastroeni, D., Walker, D. G., Caselli, R. J., Kukull, W. A., McKeel, D., Morris, J. C., Hulette, C., Schmechel, D., Alexander, G. E., Reiman, E. M., Rogers, J., and Stephan, D. A. (2007). Gene expression profiles in anatomically and functionally distinct regions of the normal aged human brain. Physiol. Genomics 28, 311–322.
Ma’ayan, A., Jenkins, S. L., Neves, S., Hasseldine, A., Grace, E., Dubin-Thaler, B., Eungdamrong, N. J., Weng, G., Ram, P. T., Rice, J. J., Kershenbaum, A., Stolovitzky, G. A., Blitzer, R. D., and Iyengar, R. (2005). Formation of regulatory patterns during signal propagation in a mammalian cellular network. Science 309, 1078–1083.
McCusker, S. M., Curran, M. D., Dynan, K. B., McCullagh, C. D., Urquhart, D. D., Middleton, D., Patterson, C. C., McIlroy, S. P., and Passmore, A. P. (2001). Association between polymorphism in regulatory region of gene encoding tumour necrosis factor alpha and risk of Alzheimer’s disease and vascular dementia: a case-control study. Lancet 357, 436–439.
Tuszynski, M. H., Thal, L., Pay, M., Salmon, D. P., U, H. S., Bakay, R., Patel, P., Blesch, A., Vahlsing, H. L., Ho, G., Tong, G., Potkin, S. G., Fallon, J., Hansen, L., Mufson, E. J., Kordower, J. H., Gall, C., and Conner, J. (2005). A phase 1 clinical trial of nerve growth factor gene therapy for Alzheimer disease. Nat. Med. 11, 551–555.