Genetics of the hippocampal transcriptome in mouse: a systematic survey and online neurogenomics resource
1
Genomics of Regeneration, DFG Research Center for Regenerative Therapies Dresden, Technische Universität, Dresden, Germany
2
Departments of Anatomy and Neurobiology, University of Tennessee Health Science Center, Memphis, TN, USA
3
Laboratory of Genetics, The Salk Institute for Biological Studies, La Jolla, CA, USA
4
W. Harry Feinstone Center for Genomic Research, University of Memphis, Memphis, TN, USA
5
Department of Molecular and Cellular Neurobiology, Vrije Universiteit, Amsterdam, The Netherlands
6
Department of Pharmacology, Vanderbilt University School of Medicine, Nashville, TN, USA
7
Department of Neurology, Beth Israel Deaconess Medical Center, Boston, MA, USA
8
Social, Genetic and Developmental Psychiatry, Institute of Psychiatry, King’s College, London, UK
9
Department of Neuroscience and Cell Biology, Robert Wood Johnson Medical School, Piscataway, NJ, USA
10
Department of Neuroscience, Institute of Psychiatry, King’s College, London, UK
Differences in gene expression in the CNS influence behavior and disease susceptibility. To systematically explore the role of normal variation in expression on hippocampal structure and function, we generated an online microarray database for a diverse panel of strains of mice, including most common inbred strains and numerous recombinant inbred lines (www.genenetwork.org
). Using this resource, coexpression networks for families of genes can be generated rapidly to test causal models related to function. The data set is optimized for quantitative trait locus (QTL) mapping and was used to identify over 5500 QTLs that modulate mRNA levels. We describe a wide variety of analyses and novel synthetic approaches that take advantage of this resource, and demonstrate how both the data and associated tools can be applied to the study of gene regulation in the hippocampus and relations to structure and function.
Variation in hippocampal structure and function between different mouse strains is enormous (Wimer et al., 1978
; van Abeelen and van den Heuvel, 1982
; Crusio et al., 1987
; Kempermann and Gage, 2002
) and a genetic basis for this much of this variation is now well established. The contribution of single genes to complex behavioral phenotypes, however, is usually small, meaning such phenotypes need to be described in terms of networks of interacting genes (Flint and Mott, 2008
). Insight into the genetic modulation of these networks can be achieved by measuring transcript expression in well characterized isogenic lines of mice that are reared in tightly controlled environments. Correlations between genetic variation and differences in traits such as locomotion, memory, or adult neurogenesis can be quantified and functional differences mapped to genomic loci, known as quantitative trait loci (QTLs). Traditionally, physiological phenotypes have been used for such analyses – although transcript levels can also be used as quantitative traits to identify genetic loci influencing gene expression (Jansen and Nap, 2001
). Previous gene array studies on whole brain from mouse RI strains identified genes that exert a large influence on other genes, providing initial insights into genetic hierarchies (Chesler et al., 2005
). This kind of ‘expression genetics’ or ‘genetical genomics’ has been applied to other tissues as well (Bystrykh et al., 2005
; Gatti et al., 2007
). By correlating physiological phenotypes like adult hippocampal neurogenesis with gene expression data from RI strains, QTLs and gene variants can be mapped that presumably have central positions in genetic networks associated with the trait of interest (Kempermann et al., 2006
). Statistical limitations due to the small numbers of strains used, however, meant that the structure of the genetic networks themselves remained elusive in these studies, although large numbers of potentially interacting partners could be identified. The BXD RI panel, derived from C57BL/6J and DBA/2J (Taylor, 1978
; Taylor et al., 1999
), has been expanded, by the addition of advanced intercross lines (Peirce et al., 2004
) to become the largest mammalian RI panel currently available. The present analysis of the hippocampal transcriptome is the first to make use of this extended BXD panel. To complement this information, expression data were also obtained from the two BXD F1 hybrids, 15 CXB RI strains and 13 strains of the mouse diversity panel. These additional strains provide genetic diversity invaluable for the fine mapping of QTLs.
The GeneNetwork is a database of genotype and phenotype data for mapping studies as well as online tools for their analysis. At the time of writing, the GeneNetwork holds data from 14 mouse genetic panels including microarray expression data from a range of tissues as well as many diverse physiological phenotypes. The BXD panel is the best represented of these with 33 studies covering 19 anatomical regions, over half of which are neural tissue. The data presented here have been deposited online as part of this resource.
The present study applied expression genetics to the adult murine hippocampus and at the same time increased the resolution of the database to a level that first conclusions about the architecture of hippocampal genetic networks would become possible. To achieve this end, an international consortium joined efforts to generate hippocampal transcriptome data and has made this information available online. This new database is described here together with a range of analyses that demonstrate how transcriptome data can be used to uncover the coordinated genetic regulation underlying the biology of the hippocampus.
Animals, Tissue Processing and Array Hybridization
This study used a total of 604 animals from 71 BXD strains (67 BXD lines plus the two parentals, C57BL/6J and DBA/2J, and the two F1 hybrids), 15 CXB strains (13 RI lines plus the two parentals, BALB/cByJ and C57BL/6ByJ), and a selection of 13 strains from the mouse diversity panel.
The hippocampal formation, excluding most of the subiculum, from two to three animals was dissected and pooled for hybridization to a single Affymetrix M430 2.0 array. A total of 201 arrays were used, and were processed at the W. Harry Feinstone Center for Genomic Research. Detailed information about the animals used in this study, including strain expression values, gender and processing information as well as detailed tables of individual array-level information can be found online at the GeneNetwork
1
.
All procedures involving mouse tissue were approved by the Institutional Animal Care and Use Committee at the University of Tennessee Health Science Center.
Raw microarray data were transformed using the PDNN, MAS5 and RMA methods. Transformed values were standardized to 2z + 8, thus yielding a data set with a standard deviation of 2 and an overall mean of 8. This ensures there are no negative values for further processing, and means that a one point difference is approximately equal to a twofold change in RNA levels. The PDNN transform consistently yielded the best results (as discussed in Results) and thus, unless otherwise specified, all analyses presented use the PDNN-transformed data.
Probe Set Quality Control
The M430 2.0 probe set annotations in GeneNetwork have been manually and automatically curated for 4 years with a special focus on transcripts with high expression in the CNS. All probe sets mentioned in this manuscript were manually checked against the latest mouse genome assembly (mm9) using the UCSC Mouse Genome Browser
2
and the Entrez Gene repository
3
and verified to have unique targets consistent with the currently available genomic data.
QTL Mapping
For the analyses presented here, whole genome association mapping was carried out using the 69 BXD strains (excluding parentals and F1 hybrids). QTL mapping was done in GeneNetwork and has been described previously (Chesler et al., 2005
).
Transcript Correlation and Network Graphs
All correlations presented are Pearson’s product-moment. When considering threshold values for networks, absolute value correlations have been used; thus a strong correlation may indicate either a positive or a negative relationship between probe sets. The network graph (Figure 1
) was generated using an implementation of the Kamada–Kawai layout algorithm (Kamada and Kawai, 1989
) provided by the Java package ‘KKLayout’ from the Java Universal Network/Graph Framework
4
. Gene Ontology analysis was done using the web-based tool ‘WebGestalt’ (Zhang et al., 2005
)
5
.
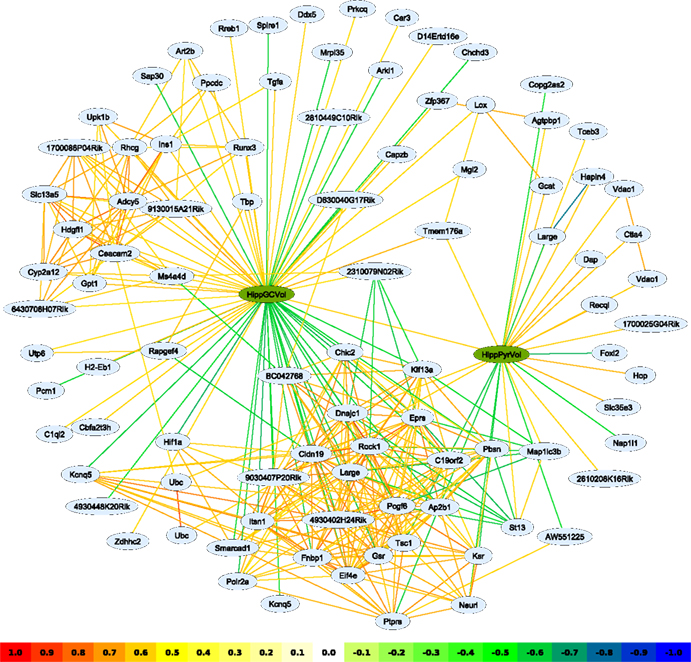
Figure 1. A network graph based on transcripts correlating with the hippocampal pyramidal- and granule cell layer volume traits (green nodes). Interactions have been filtered for an absolute correlation above 0.57 and are colored following the key shown. The graphing algorithm has attempted to draw stronger interactions as shorter lines, with the result that transcripts with similar expression patterns tend to cluster together. Two main clusters can be discerned; one, very dense, at the bottom of the image, is clearly associated with the granule cell layer volume trait and, to a lesser extent, the pyramidal cell layer volume trait. A second cluster, to the upper left, is hardly connected to pyramidal cell layer volume at all. Such a representation reveals the relationship between clusters of transcripts linked to the different phenotypes, thus potentially uncovering cell type-specific genetic pathways. Representation in tables alone would obscure such relationships.
Online Data Access at the Gene Network
The gene expression data generated in this study, information on sample preparation and detailed methodology, the Published Phenotypes database, and a collection of online tools for data analysis are all publicly available at GeneNetwork
6
, an open, freely accessible web site that combines genetic and phenotypic databases with online tools to analyze the available data.
Variation in Hippocampal Traits in the BXD Panel
The BXD panel contains a large number of polymorphisms accompanied by up to 94-fold differences in hippocampal transcript levels, with over 700 probe sets exhibiting a 10-fold or greater range of expression and over 4000 with greater than fourfold. This makes the BXD panel an attractive platform for investigating the phenotypic manifestations of these genes without the issues involved in the generation and analysis of knockout animals. While some highly polymorphic genes are inherited in a Mendelian manner, many are true polygenic complex traits with sufficient variability to allow further analysis. Some examples of such transcripts with known relevance to hippocampal function are Marcks (Hussain et al., 2006
; 1415972_at; fourfold range in expression across the BXD panel), Dcx (Corbo et al., 2002
1418141_at; 12-fold), Ncam1 (Cremer et al., 1997
; 1426865_a_at; fivefold), Nos1 (Kirchner et al., 2004
; 1422949_at; fivefold), Grin1 (Niewoehner et al., 2007
; 1450202_at; eightfold) and Grin2b (von Engelhardt et al., 2008
; 1422223_at; fivefold).
Covariation Between Hippocampal Traits in the BXD Panel
Transcripts with similar expression patterns are likely involved in common processes, and such related genes can be easily retrieved from the database to aid in the functional annotation of genes of interest. By computing the Pearson’s product-moment correlation for any probe set against every other probe set in the database, a list of the most strongly correlated genes can be obtained. As an example, the probe set 1432108_at (Pcgf6), was investigated. This transcript has been identified as a dentate gyrus marker by in situ hybridisation (Lein et al., 2004
; Allen Brain Atlas, Image Series ID: 638729) and is present in our data set with a mean expression of 8.96 and a 6.27-fold range across the BXD panel. Expression of the probe set 1432108_at correlates at r >.0.75| with 110 other probe sets and the functional annotation of these genes using the DAVID tool
7
revealed an enrichment in zinc-finger and RING proteins. Such a correlation analysis is not limited to traits of the same type, so that repeating the above search against the phenotypes database identifies a number of well-correlating entries, including Trait IDs 10378 (hippocampus granule cell number, r = −0.67), 10345 (probe trial water maze time spent in swim path r = −0.78), 10456 (total hippocampus volume r = −0.65), 10459 (granule cell layer volume r = −0.587), 10338 (proliferation of BrdU-labeled cells in subgranular zone r = −0.65) and 10604 (mean seizure severity r = 0.59). Interestingly, Pcgf6 is negatively correlated with granule cell number and dentate gyrus volume. Pcgf6, a member of the polycomb family of RING zinc finger proteins, has been identified as a transcriptional repressor (Akasaka et al., 2002
) which suggests a role as a negative controller of dentate gyrus granule cell number.
Networks of Correlated Traits
Expression correlation can be used to conceptually link genes into networks visualizing parts of the transcriptional interactome. The distance between transcripts is governed by the correlation, with higher correlations drawn closer together, so that groups of similarly expressed genes form visible clusters.
Networks are not limited to expression data, indeed any trait may be used – as well as mixtures of different trait types. Particularly interesting is the use of phenotypic and gene expression traits in the same analysis. To illustrate this, the published phenotypes ‘pyramidal cell layer volume’ (HippPyrVol; BXD Published Phenotypes 10458) and ‘granule cell layer volume’ (HippGCVol; BXD Published Phenotypes 10459) (Peirce et al., 2003
) were each correlated to the expression database and transcripts with an absolute correlation of 0.57 or above were used to build a network (Figure 1
). It is interesting to note that Pcgf6, introduced above as a dentate gyrus expression marker, is also present in this network, negatively correlated to HippGCVol. Because the phenotypes HippGCVol and HippPyrVol are themselves correlated (r = 0.60), many transcripts are associated with both traits, as evidenced by the larger cluster in the lower part of the graph. A smaller cluster is positively correlated with only HippGCVol and may be involved in granule cell-specific functions – although the genes in this cluster have not yet been studied in this context.
Genetic Control of Hippocampal Phenotypes
The key advantage of a panel of recombinant inbred strains is that it is a genetically stable resource that can be used by a research community for years. Archived experiments, such as those in GeneNetwork’s BXD phenotypes database, can be reanalyzed in the context of new data and the improved genotype maps (Peirce et al., 2004
; Shifman et al., 2006
). We used our new expression data to remap the HipV13a QTL on chromosome 13 that controls the volume of the dentate gyrus (Trait ID 10460 in the BXD Published Phenotypes database) (Peirce et al., 2003
) and identified a significant QTL [P < 0.05; likelihood ratio statistic (LRS) = 19.3] on chromosome 13 (47–55 Mb) (Figure 2
).
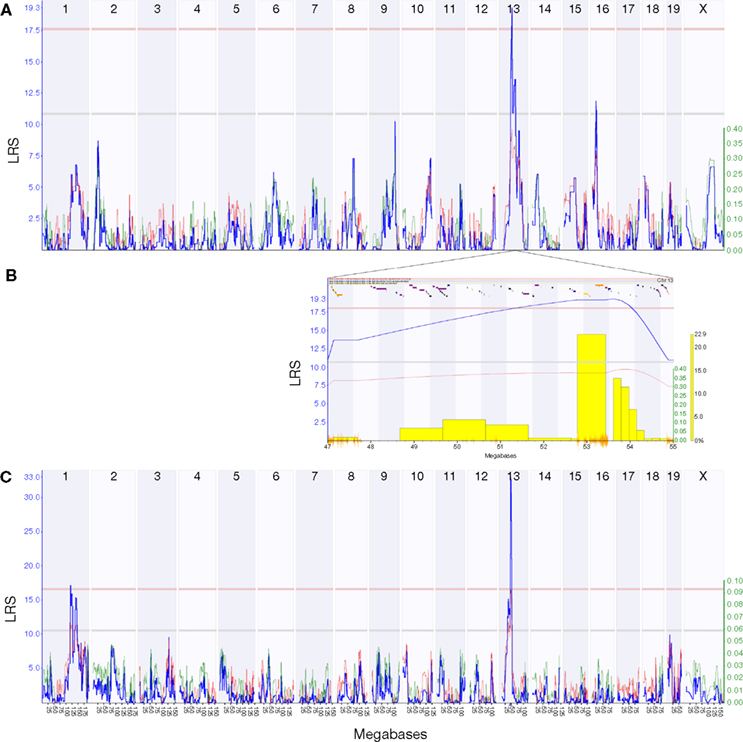
Figure 2. The HipVol1a QTL identified by interval mapping the Published Phenotypes trait 10460 (dentate gyrus volume) against dense genotype data for 69 BXD strains. Plots show interval maps for the whole genome (A) and the HipVol1a region on chromosome 13 at 47–55 Mb (B). The candidate gene Tpmt (1419121_at) has a strong cis-QTL at the same locus as HipVol1a (C). Blue lines show the likelihood ratio statistic (LRS) and secondary lines indicate whether C57BL/6J (red) or DBA/2J (green) alleles increase trait values. Yellow bars in (B) indicate results of a bootstrap analysis and orange lines show SNP density.
We can exploit the current expression data to go one step further and identify transcripts within the locus that may be critical in dentate gyrus volume. Tpmt is within the QTL region and has an excellent correlation with dentate gyrus volume (Probeset ID 1419121_at, r = 0.67). Although the peak likelihood interval for dentate gyrus volume is centered around 53 Mb and includes the genes for Ror2 and Sptlc1, both of which have a large number of SNPs within their coding regions (Ror2: 637, and Sptlc1: 239), Ror2 was only poorly expressed and Sptlc1 showed a rather weak correlation (r = 0.35) with dentate gyrus volume. The Tpmt transcript, in contrast, had a strong QTL (LRS = 33.0) at this same locus.
Expression Genetics in the Hippocampus
Besides its implications for refining mapping intervals in classical QTL studies, expression genetics reveals fundamental insights into the genetic structure of a given tissue. By whole-genome QTL mapping, we have identified a large number of transcripts whose expression is modulated by polymorphisms between the two parental strains.
Cis regulatory genes or loci are operationally defined as those whose peak association lies within a 10 Mb interval surrounding its own physical location in the genome. Functionally, cis-acting genes are considered to be largely auto-regulatory in that they control their own expression. Trans-acting QTLs, in contrast, are controlled by genes at a different physical location. To get an idea of the increase in power obtained from this data set, we counted the number of QTLs from data processed using three alternative normalization methods (PDNN, RMA, and MAS5). Especially the number of strong cis-QTLs is considered a good indicator of the quality and power of the data (Carlborg et al., 2005
). The results are summarized in Table 1
.
For genes whose expression is strongly modulated by polymorphisms which are also associated with changes in hippocampal function, we can use transcriptional QTLs as a starting point for more detailed analyses of the genetic bases of hippocampal function in health and disease (Figure 3
). As an example, we searched the PDNN data set for genes associated with hippocampus-related entries in the Entrez GeneRIF field. A search for the keyword ‘Alzheimer’ returned 101 probe sets with a significant QTL; among the genes targeted by these probe sets are Apod, Ncam1, Bcl2 and Bcl2l2. The query ‘neurodegenerative’ yielded 54 probe sets, including Cdk5, Nos1, Park7 and Polg. Among the 60 QTLs associated with the keyword ‘cognitive’ were Comt, Drd1a, Prnp, Mapt and Ntrk2. Such results will serve as starting points for what we call ‘reverse complex trait analysis’, in which a gene associated with a strong cis-acting effect can be worked backwards to investigate downstream consequences of known variation in gene expression.
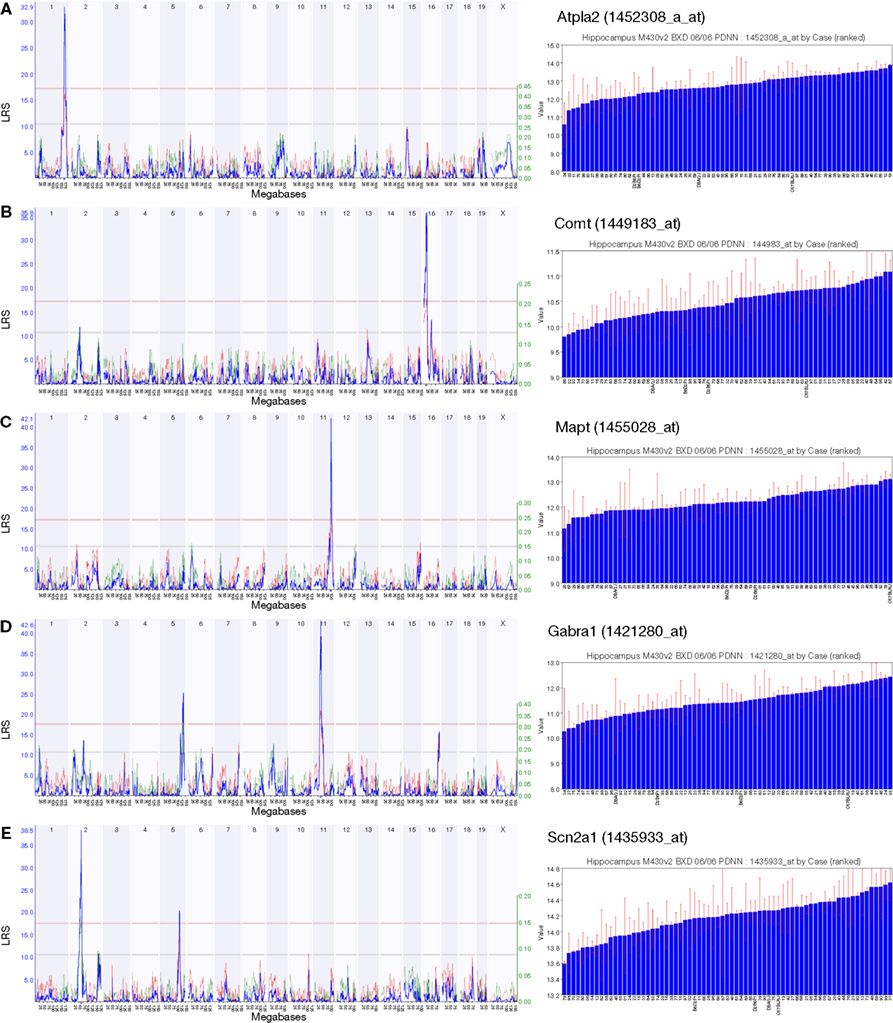
Figure 3. A selection of strong cis-QTLs relating to transcripts of known importance in hippocampal function. The expression levels of probe sets 1452308_a_at (Atp1a2) (A), 1449183_at (Comt) (B), 1455028_at (Mapt) (C), 1421280_at (Gabra1) (D) and 1435933_at (Scn2a1) (E) are associated with strong cis-QTLs indicating that a sequence polymorphism affecting transcript expression exists in proximity to the encoding gene. The large variance in genetically-determined expression makes such genes good starting points for further analyses. Linkage maps are shown with marker position on the x-axis (chromosomes are drawn in juxtaposition) and the likelihood ratio statistic (LRS) on the y-axis. Purple triangles below the major peak indicate the position of the gene encoding the transcript. The pale red line delineates the threshold for significance as determined by 1000 genome-wide permutation tests. Bar graphs to the right of each plot show the ordered expression level in each strain to demonstrate the wide range across the BXD panel.
Pleiotropic Effects of Trans-Acting Regulatory Loci
Trans-QTLs associated with expression of diverse genes can often be localized to common loci. Genes at these loci appear to control the expression of large numbers of downstream genes, suggesting that they act as ‘master modulatory loci’ (Chesler et al., 2005
). Comparing transcriptome maps of whole brain and hippocampus, some trans-QTL bands are common between the two tissues, whereas others appear to be tissue-specific (data not shown). In the hippocampus, major bands were identified on chromosomes 1, 2, 5, 12, 15 and 19 (Figure 4
). A particularly strong ‘trans-band’ in the hippocampus, which is not as prominent in whole brain, lies on distal chromosome 5. This was named Trans5a and can be localized to three markers: rs13478539, rs3708411, and rs8265855. The inclusive interval extending to the two next flanking markers is around 6 Mb wide (from 132.834686 to 138.965374), including 121 known genes. Interestingly this interval spans the region homologous to the region deleted in humans with Williams–Beuren syndrome (OMIM 194050). Characterized by the ‘elfin’ features thought to be caused by the (diagnostic) haploinsufficiency of the elastin gene, Williams syndrome is also associated with cardiac malformation, social disinhibition, hyperacuity and usually some degree of cognitive impairment. Functional and metabolic abnormalities in the hippocampal formation affecting cognitive ability have been reported (Meyer-Lindenberg et al., 2005
), which might help explain the deficits in memory and spatial navigation in this disease.
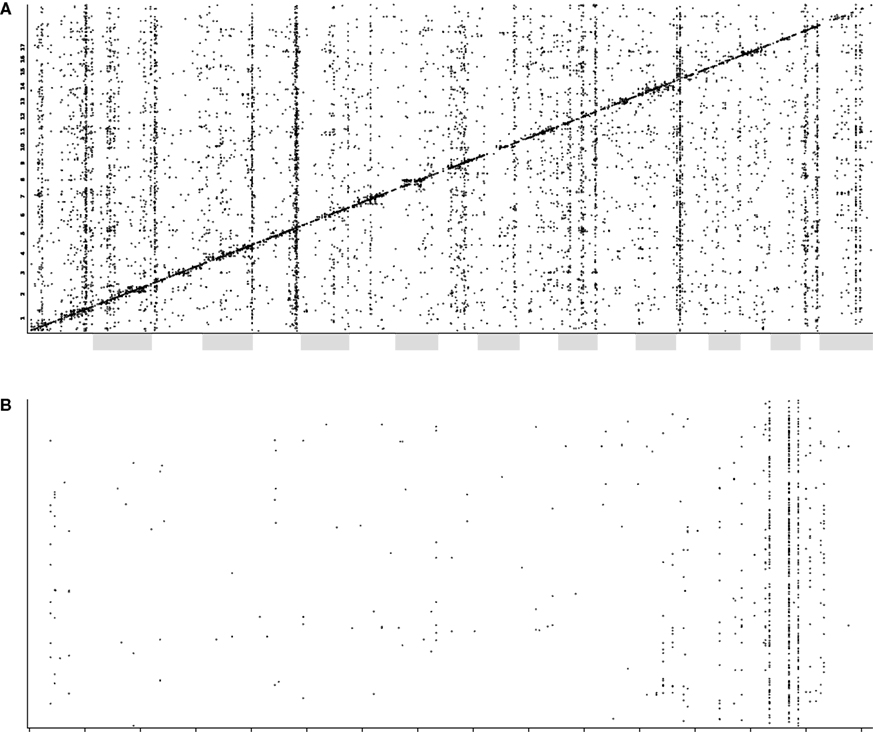
Figure 4. (A) A plot of QTLs from transcript expression phenotypes. The x-axis shows the global genomic position of the associated marker (chromosomes are alternately shaded) and the y-axis shows the position of the gene encoding the transcript. (B) A QTL plot, as above, for chromosome 5 only. Here, cis-QTLs (QTL position within 10 Mb of gene position) have been removed for clarity. The Trans5A trans-band can be clearly seen localized to three adjacent markers.
The 100 probe sets with the strongest trans-QTLs in the Trans5a interval, and with expression above 7.0, were analyzed for functional significance. A Gene Ontology analysis revealed genes with trans-QTLs in Trans5a to be enriched for the categories ‘intracellular signaling cascade’, ‘protein amino acid phosphorylation’, ‘regulation of transferase activity’, ‘ATP binding’ and ‘protein tyrosine kinase activity’. Correlation of these transcripts with the BXD phenotype database yielded, among the 60 strongest associations, phenotypes such as water maze learning ability (six traits), seizure severity (five traits), hippocampal neurogenesis (two traits) and total hippocampal granule cell number.
To suggest genes that might be candidates for the modulatory locus, we searched for genes with a cis-QTL in the Trans5a interval. The probe sets 1448760_at (Zfp68), 1420095_at (Zipro1), 1425531_at (Znhit1), 1429152_at (Zkscan1) and 1415901_at (Plod3) had above average expression levels and significant cis-QTLs within this interval. As expression of most genes controlled by the Trans5a locus should correlate well with the expression of the responsible gene at the locus itself, we surveyed each of the transcripts exhibiting the trans-QTL for strongly correlating transcripts whose genes are among those in the Trans5a interval. The best candidate using this approach was Zkscan1 (Probeset ID 1429152_at), a zinc finger protein of the SCAN domain family.
Epistatic Interactions between QTLs
Most genes do not act in isolation and therefore will not have a Mendelian effect on expression. Such genes will usually not exhibit a single strong QTL but will rather be associated with several smaller-effect loci relating to genes whose products work together to modulate expression of the target gene. Historically, the statistical power required for the identification of these effects has not been available. The size of the current data set, however, is sufficient for the discovery of strong epistatic interactions. As an example, the probe set 1435411_at (Neurod2) was used as a query with the Pair Scan function in GeneNetwork’s mapping module. A two-locus interaction plot identifies a suggestive interaction between loci at Chr3@67.9 Mb (Neurod2Epi3) and Chr4@54.1 Mb (Neurod2Epi4) (Figure 5
). The conventional mapping analyses for these two loci are not above background (LRS of 0.939 and 0.002 respectively) whereas the peak LRS of the interaction is 30.973 (LRS of the full model is 31.915). This suggests genetic factors at the two loci Neurod2Epi3 and Neurod2Epi4 which together influence the expression of Neurod2. Using the literature correlation function in GeneNetwork, we identified a strong correlation (r = 0.76) between Neurod2 and Lxn (latexin) on Chr3@67.55 Mb at the Neurod2Epi3 locus. These findings suggest Lxn as a candidate component of the Neurod2 pathway, important in granule cell differentiation (Schwab et al., 2000
), and recent evidence suggests an anti-proliferative role of Lxn in hemopoietic cells (Liang et al., 2007
). A possible candidate for Neurod2Epi4 is Rod1 (regulator of differentiation 1; Probeset ID 1455819_at), on Chr4@59.57 Mb, which has a correlation with 1435411_at (Neurod2) of r = 0.39. Rod1 is a homolog of a yeast gene involved in regulating the onset of differentiation (Yamamoto et al., 1999
).
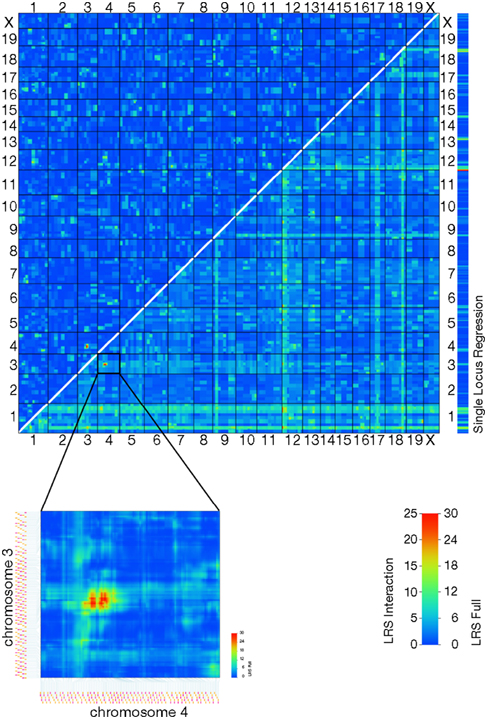
Figure 5. A two-way QTL plot reveals an epistatic interaction between loci on chromosomes 3 and 4 affecting the expression of Neurod2 (1435411_at). Individually, these loci do not significantly correlate with the trait analyzed, but together they generate a strong QTL (LRS Full = 31.92).
We have presented here a database of hippocampal expression information together with a range of example analyses showcasing a number of ways in which this resource can be mined. QTL analyses have long been valued as a way of identifying the molecular correlates of complex traits, and the data described above offer an unprecedented source of transcript expression QTLs for the detailed molecular study of the mouse hippocampus model. The large scale and exceptionally high quality of the data have, in addition, made possible more daring investigations of complex QTL interactions.
The BXD RI panel is the largest available in a mammalian species, and due to the logistics of assembling such a resource, we are confident that it will remain so until similar studies become available using the 8-way Collaborative Cross (Churchill et al., 2004
), a community project that is under way but will require several more years to reach completion. The 69 BXD strains studied here also represent one of the largest expression databases of its kind, and the addition of comparable data from the CXB and Mouse Diversity panels has resulted in a resource that is significantly larger than anything else currently available.
The key advantage afforded by the large size of the panel is the additional statistical power this gives to the linkage associations and thus to the strength of the resulting QTLs. This can be seen most clearly in Table 1
where the number of QTLs above the statistical significance threshold is a dramatic indication of the improvement of the hippocampal database over those previously available for the mouse model. Many of the QTLs identified are particularly strong and resolve to clear peaks that can be localized with high precision (Figure 3
). A side effect of this QTL quality is that one can now identify large numbers of less strong, secondary QTLs which were previously lost to background noise, and this information opens up a whole new range of possible analyses, such as the identification of epistatic interactions (Figure 5
), that promise to uncover pathways of genetic control within the tissue studied.
Traditionally, QTL mapping starts with a phenotype of interest, measured in a genetic reference population, and aims to map this trait to a genomic sequence variant. The advent of larger panels and denser marker maps, in conjunction with high quality gene expression data, now means that expression QTLs are statistically robust enough to be considered starting points for further study in their own right. This can be used to great effect in reverse complex trait analysis, a powerful new approach in which segregating genetic variation, as evidenced by a strong QTL, is mapped to other potentially interacting genes, and ultimately back to candidate phenotypes. With a known QTL and a body of evidence suggesting possible roles for the affected gene, phenotypes can be predicted that may be modulated as a result of this sequence variation. If this phenotype is of interest, it can be directly measured and a traditional ‘forward’ QTL analysis carried out to confirm the prediction. Such an approach is extremely attractive when the enormous cost and time required for phenotyping a large panel is considered. The ‘reverse’ component of the study is entirely computer based, and no further laboratory work is needed beyond that already invested in the database resource described here.
These different approaches have been summarized in a visual model which shows the various relationships between genotype and phenotype (Figure 6
). Variation exists both at the level of genotype, as sequence polymorphism between different strains, and at the level of phenotype, in that animals from different genetic backgrounds exhibit large ranges of expression in phenotypic traits. Covariation between any two of these sources of variation falls into one of the four categories shown: gene–gene covariation is genetic linkage, most often as a result of genomic proximity; trait–trait covariation refers to the correlation between phenotypes and/or transcript expression, as in Figure 1
; mapping variation in trait expression to genotype is the essence of QTL analysis, as shown in Figures 2 and 3
; and reversing this process to identify traits whose expression co-varies with a known sequence variant or genomic locus is what we have termed reverse complex trait analysis.
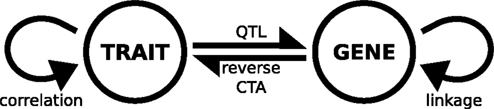
Figure 6. Model of gene-trait interactions in complex trait analysis. The figure shows two sources of variation, phenotypic – meaning the quantitative differences in trait expression measured across the panel of strains (labeled TRAIT) – and the differences in genotype, as measured at a discrete number of marker loci in the different strains (GENE). Interactions between these sources of variation are the basis of complex trait analysis. QTL, quantitative trait locus; reverse CTA, reverse complex trait analysis.
The link between expression correlation and functional association is indirect and complex, involving many variables at the level of transcriptional and translational control, post-translational modification and protein interaction. The availability of genome–scale interaction data, however, presents an attractive entry-point for more detailed studies of candidate genes. Although the constraints of space have prevented a detailed treatment of individual candidates in this manuscript, ongoing work in our own laboratories is using these data to identify potential interaction partners for already known regulatory genes and thus to suggest pathways in which these might be working.
The expression data generated by this study have been deposited online as a part of the GeneNetwork, a repository of genotypes, and physiological and expression phenotypes which is openly accessible
8
.
In addition to the transcriptional data provided by studies such as the one presented here, a range of related information is becoming available to support in silico identification of candidate pathways. Together with evidence from other sources, a compelling case can often be made for more focused experimental study. Sources of gene–gene interaction meta data are now offered by projects such as the Semantic Gene Organizer© (Homayouni et al., 2005
), built into GeneNetwork as the Literature Correlation function which uses latent semantic indexing of PubMed abstracts to assign a correlation metric to pairs of genes; and an initiative from the Allen Institute for Brain Science in which genes are correlated based on the similarity of their spatial in situ expression patterns (Lau et al., 2008
).
The aim of our new resource is to uncover genetic pathways underlying complex hippocampal phenotypes, and the utility of the current database will only grow as additional phenotypes are measured in the BXD mice and deposited online.
The authors declare that the research was conducted in the absence of any commercial or financial relationships that could be construed as a potential conflict of interest.
The authors would like to acknowledge the following sources of financial support: Volkswagenstiftung grant to G.K., U01AA13499, U24AA13513 and U01-AA014425 to L.L., Lookout Foundation grant, McDonnell Foundation, and the Picower Foundation to F.H.G., NIH 1U01 AA13515 to T.R.S., NIAAA INIA AA013503 to D.G, NIAAA INIA U01AA013515 to S.G., NIH P20MH062009 and U01CA105417 to K.F.M., R01 NS049445-01 to R.S.N., NIH P20 to G.D.R., MRC grant G0000170 to L.C.S., BSIK 03053 to G.S., NIAAA U01AA13499, U24AA13513, NIDA/NIMH/NIAAA P20-DA 21131, NCI MMHCC U01CA105417 and NCRR U24 RR021760 to R.W.W.
Bystrykh, L., Weersing, E., Dontje, B., Sutton, S., Pletcher, M. T., Wiltshire, T., Su, A. I., Vellenga, E., Wang, J., Manly, K. F., Lu, L., Chesler, E. J., Alberts, R., Jansen, R. C., Williams, R. W., Cooke, M. P., and de Haan, G. (2005). Uncovering regulatory pathways that affect hematopoietic stem cell function using ‘genetical genomics’. Nat. Genet. 37, 225–232.
Chesler, E. J., Lu, L., Shou, S., Qu, Y., Gu, J., Wang, J., Hsu, H. C., Mountz, J. D., Baldwin, N. E., Langston, M. A., Threadgill, D. W., Manly, K. F., and Williams, R. W. (2005). Complex trait analysis of gene expression uncovers polygenic and pleiotropic networks that modulate nervous system function. Nat. Genet. 37, 233–242.
Churchill, G. A., Airey, D. C., Allayee, H., Angel, J. M., Attie, A. D., Beatty, J., Beavis, W. D., Belknap, J. K., Bennett, B., Berrettini, W., Bleich, A., Bogue, M., Broman, K. W., Buck, K. J., Buckler, E., Burmeister, M., Chesler, E. J., Cheverud, J. M., Clapcote, S., Cook, M. N., Cox, R. D., Crabbe, J. C., Crusio, W. E., Darvasi, A., Deschepper, C. F., Doerge, R. W., Farber, C. R., Forejt, J., Gaile, D., Garlow, S. J., Geiger, H., Gershenfeld, H., Gordon, T., Gu, J., Gu, W., de Haan, G., Hayes, N. L., Heller, C., Himmelbauer, H., Hitzemann, R., Hunter, K., Hsu, H. C., Iraqi, F. A., Ivandic, B., Jacob, H. J., Jansen, R. C., Jepsen, K. J., Johnson, D. K., Johnson, T. E., Kempermann, G., Kendziorski, C., Kotb, M., Kooy, R. F., Llamas, B., Lammert, F., Lassalle, J. M., Lowenstein, P. R., Lu, L., Lusis, A., Manly, K. F., Marcucio, R., Matthews, D., Medrano, J. F., Miller, D. R., Mittleman, G., Mock, B. A., Mogil, J. S., Montagutelli, X., Morahan, G., Morris, D. G., Mott, R., Nadeau, J. H., Nagase, H., Nowakowski, R. S., O’Hara, B. F., Osadchuk, A. V., Page, G. P., Paigen, B., Paigen, K., Palmer, A. A., Pan, H. J., Peltonen-Palotie, L., Peirce, J., Pomp, D., Pravenec, M., Prows, D. R., Qi, Z., Reeves, R. H., Roder, J., Rosen, G. D., Schadt, E. E., Schalkwyk, L. C., Seltzer, Z., Shimomura, K., Shou, S., Sillanpää, M. J., Siracusa, L. D., Snoeck, H. W., Spearow, J. L., Svenson, K., Tarantino, L. M., Threadgill, D., Toth, L. A., Valdar, W., de Villena, F. P., Warden, C., Whatley, S., Williams, R. W., Wiltshire, T., Yi, N., Zhang, D., Zhang, M., Zou, F., and Complex Trait Consortium. (2004). The Collaborative Cross, a community resource for the genetic analysis of complex traits. Nat. Genet. 36, 1133–1137.
Kirchner, L., Weitzdoerfer, R., Hoeger, H., Url, A., Schmidt, P., Engelmann, M., Villar, S. R., Fountoulakis, M., Lubec, G., and Lubec, B. (2004). Impaired cognitive performance in neuronal nitric oxide synthase knockout mice is associated with hippocampal protein derangements. Nitric Oxide 11, 316–330.
Meyer-Lindenberg, A., Mervis, C. B., Sarpal, D., Koch, P., Steele, S., Kohn, P., Marenco, S., Morris, C. A., Das, S., Kippenhan, S., Mattay, V. S., Weinberger, D. R., and Berman, K. F. (2005). Functional, structural, and metabolic abnormalities of the hippocampal formation in Williams syndrome. J. Clin. Invest. 115, 1888–1895.
Niewoehner, B., Single, F. N., Hvalby, Ø., Jensen, V., Meyer zum Alten Borgloh, S., Seeburg, P. H., Rawlins, J. N. P., Sprengel, R., and Bannerman, D. M. (2007). Impaired spatial working memory but spared spatial reference memory following functional loss of NMDA receptors in the dentate gyrus. Eur. J. Neurosci. 25, 837–846.
Schwab, M. H., Bartholomae, A., Heimrich, B., Feldmeyer, D., Druffel-Augustin, S., Goebbels, S., Naya, F. J., Zhao, S., Frotscher, M., Tsai, M., and Nave, K. (2000). Neuronal basic helix-loop-helix proteins (NEX and BETA2/Neuro D) regulate terminal granule cell differentiation in the hippocampus. J. Neurosci. 20, 3714–3724.
von Engelhardt, J., Doganci, B., Jensen, V., Hvalby, Ø., Göngrich, C., Taylor, A., Barkus, C., Sanderson, D. J., Rawlins, J. N. P., Seeburg, P. H., Bannerman, D. M., and Monyer, H. (2008). Contribution of hippocampal and extra-hippocampal NR2B-containing NMDA receptors to performance on spatial learning tasks. Neuron 60, 846–860.