Correlative microscopy of densely labeled projection neurons using neural tracers
- Institute of Neuroinformatics, University of Zurich and ETH Zurich, Zurich, Switzerland
Three-dimensional morphological information about neural microcircuits is of high interest in neuroscience, but acquiring this information remains challenging. A promising new correlative technique for brain imaging is array tomography (Micheva and Smith, 2007 ), in which series of ultrathin brain sections are treated with fluorescent antibodies against neurotransmitters and synaptic proteins. Treated sections are repeatedly imaged in the fluorescence light microscope (FLM) and then in the electron microscope (EM). We explore a similar correlative imaging technique in which we differentially label distinct populations of projection neurons, the key routers of electrical signals in the brain. In songbirds, projection neurons can easily be labeled using neural tracers, because the vocal control areas are segregated into separate nuclei. We inject tracers into areas afferent and efferent to the main premotor area for vocal production, HVC, to retrogradely and anterogradely label different classes of projection neurons. We optimize tissue preparation protocols to achieve high fluorescence contrast in the FLM and good ultrastructure in the EM (using osmium tetroxide). Although tracer fluorescence is lost during EM preparation, we localize the tracer molecules after fixation and embedding by using fluorescent antibodies against them. We detect signals mainly in somata and dendrites, allowing us to classify synapses within a single ultrathin section as belonging to a particular type of projection neuron. The use of our method will be to provide statistical information about connectivity among different neuron classes, and to elucidate how signals in the brain are processed and routed among different areas.
Introduction
A complete understanding of neural mechanisms underlying simple and complex behaviors must include information about synaptic connectivity. A widely used and highly successful method for obtaining information about synaptic connectivity is electron microscopy (Anderson et al., 1994a ,b ; Gray, 1959 ; White et al., 1986 ). At high resolution, EM allows the detection of synapses in densely labeled material by resolving minute details such as synaptic vesicles and post-synaptic densities. However, from detecting a synapse there is a long way to identifying the associated pre- and post-synaptic cell types and their topological positions in the network. Among the difficulties are that small cellular processes must be followed over hundreds of ultrathin serial sections to obtain the necessary contextual information in the surrounding of the synapse. To simplify this difficult task, EM methods have been designed to stain single neurons or groups of neurons with electron-dense materials (LaVail and LaVail, 1972 ; Reiner et al., 2000 ; Xue et al., 2004 ; Fairen, 2005 ). Currently, it is feasible to stain only up to three structures in the EM using for example diaminobenzidine (DAB), benzidinedihydrochloride, and silver-intensified immunogold (Anderson et al., 1994a ,b ). To stain more structures, optical fluorescence and EM methods have to be combined (Deerinck et al., 1994 ; Takizawa et al., 1998 ; Gaietta et al., 2002 ; Giepmans et al., 2005 ; Micheva and Smith, 2007 ). In array tomography (Micheva and Smith, 2007 ), arrays of ultrathin serial sections of resin-embedded tissue are repeatedly stained and imaged using FLM and scanning EM. This technique has the advantage over other techniques based solely on light microscopy (LM) in that it yields higher axial resolution (resolution is determined by section thickness, i.e., on the order of 70 nm compared to 500 nm in confocal laser scanning microscopy (CLSM), depending on the wavelength and optical properties of the tissue). Advantages are also that array tomography is compatible in principle with a large number of fluorescent markers or combinations thereof and allows for three-dimensional use of immunohistochemical methods without penetration issues. Also, array tomography allows for straightforward correlation of LM and EM data without being hampered by image registration problems, because the same ultrathin sections are imaged in both microscopes. Array tomography has been used for visualizing transgenetically labeled structures and endogenous antigens.
We extend array tomography by implementing the use of neural tracers to label different classes of projection neurons. Projection neurons are important neurons that relay information among distant brain areas. In our system of choice, the songbird, we label these neurons using dextran-coupled fluorescent dyes. Although tracer fluorescence is quenched during standard fixing and staining protocols for EM, we demonstrate that tracers can be detected anew in ultrathin sections using fluorescent antibodies. Antigenicity is preserved despite treatment of the tissue with potassium ferrocyanide-reduced osmium tetroxide and uranyl acetate. Immunofluorescence signal is mainly localized within vesicles near the cell nucleus, but some tracer signal can be reliably detected also in the whole soma and in patches of dendrite distant from the soma.
Our work demonstrates that fluorescent neural tracers can be used to classify the neuron types associated with a particular synapse observed in the EM. Our correlative approach reduces the risk of erroneous synapse classification that arises in dense reconstructions. That is, rather than having to follow and reconstruct dendritic and axonal processes up to the soma and beyond to identify the cell type, in future work it will be sufficient to reconstruct the processes just up to locations where tracer signal is found. We anticipate that the main usage of our method will be to obtain statistical information about connection specificity among various neuron types without having to reconstruct the entire circuit.
Materials and Methods
Surgery
All experiments were carried out in accordance with protocols approved by the Veterinary Office of the Canton of Zurich, Switzerland. Birds were anesthetized with isofluorane (2% in O2) and held in a stereotaxic apparatus. Brain areas were located by stereotaxic coordinates and were pressure injected unilaterally with ∼0.5 µl of different conjugated dextrans. In the robust nucleus of the arcopallium (RA) we injected Lucifer yellow, in Area X we injected Alexa Fluor 647, and in the nucleus uveaformis (Uva) we injected tetramethylrhodamine (Fluororuby, Invitrogen). Injections were performed via a glass micropipette attached to a Picospritzer Microinjector (General Valve Corporation). After a survival time of 5 days, the bird was given a lethal dose of pentobarbital (Kantonsapotheke, Zurich) and perfused through the left ventricle of the heart with 20 µl heparin (Braun) and 5 ml 0.9% NaCl followed by 20 min of 2% paraformaldehyde and 0.075% glutaraldehyde in phosphate buffer (0.1 M, pH 7.4). The brain was removed, post-fixed in the same fixative for 1 h, and 60-µm-thick sagittal sections were cut (Pelco 101 Vibratome, Series 1000). Images were taken using a widefield fluorescence microscope (Olympus BX61) to localize the area of interest.
CLSM Imaging
Sections containing HVC were transferred onto glass slides and imaged on a confocal microscope (Leica SP5) using the 405, 561, and 633 laser lines with a pinhole of 1 Airy unit. Sections were examined with a 63×, NA 1.3 glycerol objective. Data were collected sequentially for each channel, with excitation lasers and detection spectra calibrated to minimize channel crosstalk. A series of 60 optical sections was collected throughout the entire section. The image format was 2048 × 2048 pixels, with a voxel size of 120 × 120 × 400 nm. Confocal image stacks were analyzed using Bitplane Imaris 3.1 software.
Electron Microscopy
After washing the sections in cacodylate buffer (0.1 M, pH 7.4), they were post-fixed for 40 min in 1.5% potassium ferrocyanide and 1% osmium tetroxide, followed by 1 h in 1% osmium tetroxide, each in the same buffer, and finally for 1 h in 1% uranyl acetate in distiled water. After dehydration, the sections were embedded in Durcupan ACM resin (Fluka, Buchs, Switzerland). The embedded sections were cured for 48 h at 52°C.
Once cured, HVC was localized with the light microscope, resected, attached to a blank resin block, and serially sectioned at a thickness in the range of 60–90 nm. Sections were collected on pioloform-coated 2 × 1 mm nickel slot grids (Agar Scientific, UK).
Immunofluorescence Staining
Grids were treated for 10 min with 1% periodic acid and were washed 15 times in ddH2O. Grids were washed two times for 10 min in tris and phosphate-buffered saline (TPBS, pH 7.4), then treated for 30 min with 5% goat serum in TPBS and for 10 min with 1% goat serum in TPBS. Grids were inverted on small droplets of diluted primary antibody for 1.5 h (1:50, rabbit anti-Lucifer yellow, Invitrogen). After washing four times for 10 min with Tris–HCl buffer (0.05 M, pH 7.5), grids were inverted on small droplets of secondary antibody (1:50, Alexa Fluor 594 goat anti-rabbit IgG, Invitrogen). After exposure to secondary antibody for 1.5 h, grids were washed 15 times with ddH2O. Finally sections were imaged on an Olympus BX61 fluorescence microscope using a 40×, NA 0.6 air lens.
Electron Microscopy and Image Processing
After imaging in the FLM, grids were stained for 3 min in 1% uranyl acetate, washed three times for 30 s in ddH2O. They were then stained for 2 min in Reynold’s lead citrate and washed three times for 30 s in ddH2O. Sections were imaged on a FEI Morgagni 268 microscope. Images were manually stitched and registered with fluorescence micrographs using Adobe Photoshop CS3 software.
Results
The main forebrain premotor brain areas for adult song production are connected in a feedforward manner (Figure 1 ). In this feedforward architecture, the thalamic nucleus Uva projects to the nucleus interface of the nidopallium (NIf) and to HVC (Akutagawa and Konishi, 2005 ; Hahnloser et al., 2008 ), the main premotor nucleus for song production (Nottebohm et al., 1982 ; Hahnloser et al., 2002 ). A class of HVC neurons project to RA and form a sparse premotor code that is relayed by RA neurons onto motor neurons of the vocal organ and to respiratory areas in the hindbrain (Vu et al., 1994 ; Ashmore et al., 2005 ). A different class of HVC neurons project to Area X, a basal ganglia nucleus involved in generating song variability (Nottebohm and Arnold, 1976 ).
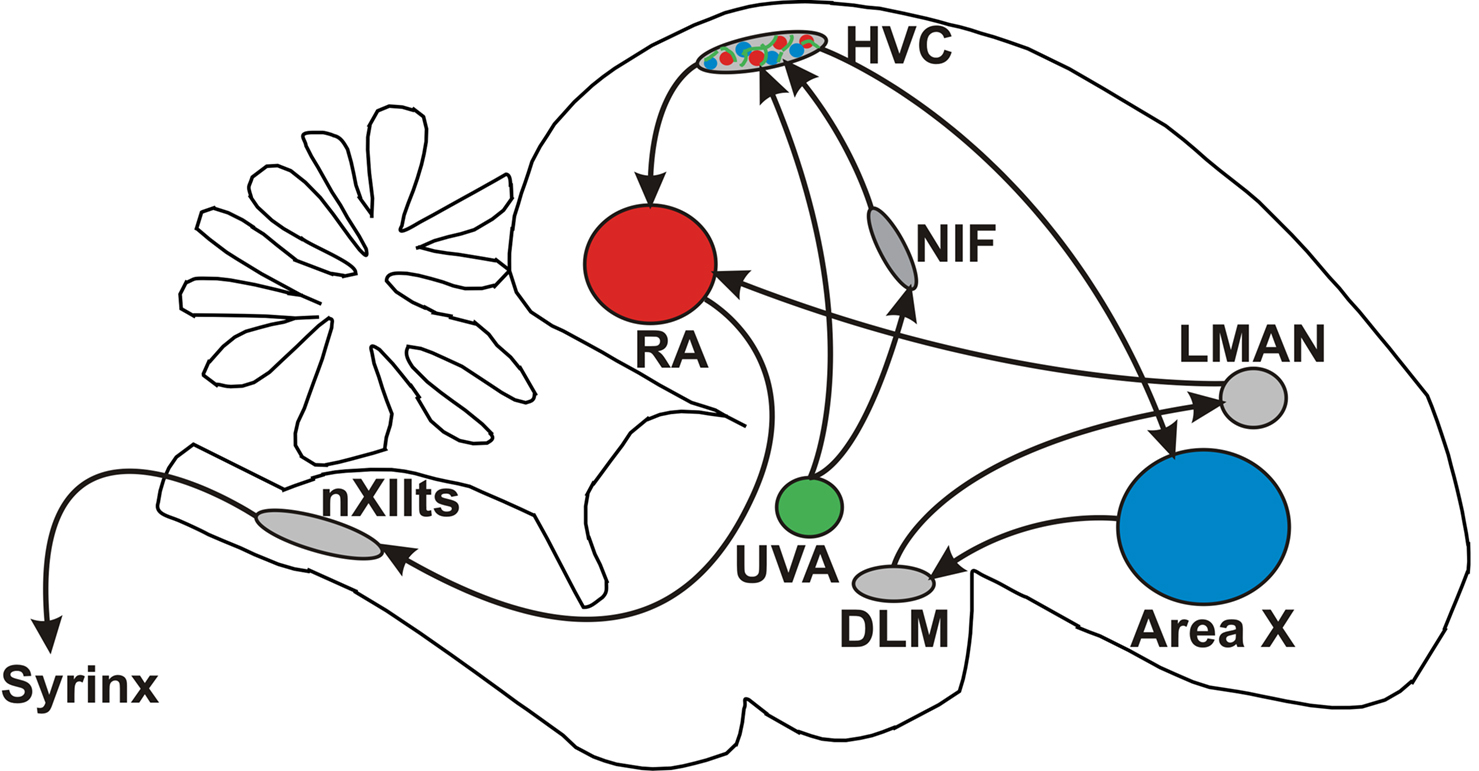
Figure 1. Schematic representation of the songbird brain. Highlighted are regions involved in song learning and song production. Injections were made in RA (red), UVA (green), and Area X (blue).
An important question pertaining to the song-control architecture is how signals are fed to HVC, processed there, and relayed to HVC’s targets. Answering this question involves identifying the connection targets among afferent and efferent projection neurons in HVC. As a first step towards identifying connections, we injected different dextran-coupled fluorescent dyes into RA, Area X, and Uva, to label cell bodies and axons within HVC (Figures 1 and 2 ). We injected dextran-coupled Lucifer yellow into RA, dextran-coupled Alexa Fluor 647 into Area X, and dextran-coupled Fluororuby into Uva. Imaging in the CLSM revealed retrograde labeling of X-projecting HVC neurons with relatively large somata and RA-projecting neurons with smaller somata (Figure 2 ). This separation and size difference between the two populations is in agreement with previous findings (Wild et al., 2005 ). Additionally, Uva axons were well stained by the Uva injection.

Figure 2. Confocal image stack of HVC region (maximum intensity projection). Injections of three different tracers in afferent and efferent brain regions of HVC reveal distinct neuron types. RA-projecting neurons filled with Lucifer yellow are visible in red, Area X-projecting neurons filled with Alexa Fluor 647 in blue, and axons from Uva filled with Fluororuby in green. Scale bar: 50 µm.
To assess the connectivity among these neuron types, we processed the tissue for transmission electron microscope (TEM) imaging. This preparation included staining and post-fixation of the tissue with highly reactive chemicals (osmium tetroxide, uranyl acetate), dehydration, and resin embedding. These treatments resulted in the loss of fluorescence signal (which in our hands was unavoidable given that ultrastructure had to be well preserved for TEM imaging). Although fluorophores undergo conformational changes and tend to bleach during TEM preparation, they may still be present in the embedded tissue and can sometimes be detected by indirect methods (Haraguchi and Yokota, 2002 ). To test for this possibility, we applied antibodies against the fluorophores on ultrathin sections of the resin-embedded tissue. To visualize RA-projecting neurons we applied anti-Lucifer yellow antibodies followed by secondary fluorescent antibodies. Treatment of ultrathin sections with periodic acid, a chemical which oxidizes the Durcupan resin, was necessary for good immunostaining, although it decreased EM quality. Durcupan resin produced better ultrastructure than the more hydrophilic LR White resin. We observed bright fluorescence in somata as well as in thin processes, revealing that TEM preparation did not eliminate antigenicity of the tracer (Figure 3 A). Moreover, fluorescence signal on ultrathin sections was in registration with the spatial arrangement of RA-projecting neurons as assessed from optical sections of confocal stack images taken prior to EM preparation. In particular, somata could be easily correlated in confocal image stack versus ultrathin data based on their shape and location (Figures 3 B,C).

Figure 3. Comparison of post-embedding tracer immunolabeling and pre-embedding confocal microscopy. (A) Immunolabeling of tracer on ultrathin HVC section. Anti-Lucifer yellow was used as the primary antibody. (B) Confocal optical slice of the same region as in (A), imaged prior to preparation of the tissue for TEM imaging. The selection of the optical section was based on the shape and location of the cells in the white dashed rectangle (no corrective image transformations were performed). (C) Maximum projection of a confocal image stack of 60 optical sections. Scale bar: 25 µm.
We transferred the ultrathin sections to an EM and imaged the previously immunolabeled regions (Figures 4 A,B). The light micrographs could be easily registered and superimposed with the EM images based on anatomical landmarks (blood vessels, labeled cells, and tracer-filled vesicles, Figure 4 C). Indeed, the contours of somata indicated by immunolabeling signal agreed with the contours delimited by the cell membranes in the EM. More importantly, the same neuronal processes could be found and correlated in the two image types. EM image quality and contrast was sufficient to clearly identify synaptic vesicles and post-synaptic densities (Figures 5 and 6 ). Some dendritic spines of RA-projecting neurons were part of a multi-synapse bouton that engulfed several spine heads (Figure 6 A, bottom). Such bouton embedding around the spine head and presence of multiple synapses on the same pre-synaptic bouton has been previously observed in other systems, for example in synapses from cortical area V1 to V5 in the macaque monkey, and has been suggested to have some significance for the spread of neurotransmitter between synapses (Anderson et al., 1998 ). In conclusion, our findings demonstrate that correlative FLM/EM imaging of tracer-filled cells in ultrathin sections is feasible and represents a possible route for further studies of the songbird anatomy.

Figure 4. Correlation of LM and EM images. (A) Light micrograph of the two cells immunostained for Lucifer yellow highlighted in Figure 3 . (B) The same region as in (A) is imaged in the TEM, revealing preservation of ultrastructure. (C) Immunofluorescence image superimposed on the TEM image. Scale bar: 5 µm.

Figure 5. Magnified view of part of Figure 4 . (A) LM image of a dendrite immunostained for Lucifer yellow. (B) TEM micrograph of the same region as in (A). (C) Superposition of immunofluorescence and TEM images allows classification of the dendrite (asterisk) as belonging to an RA-projecting cell. Synapses are clearly identifiable: an example pre-synaptic terminal is marked by dashed white ellipse; the corresponding post-synaptic density is indicated by the arrow. Scale bar: 1 µm.
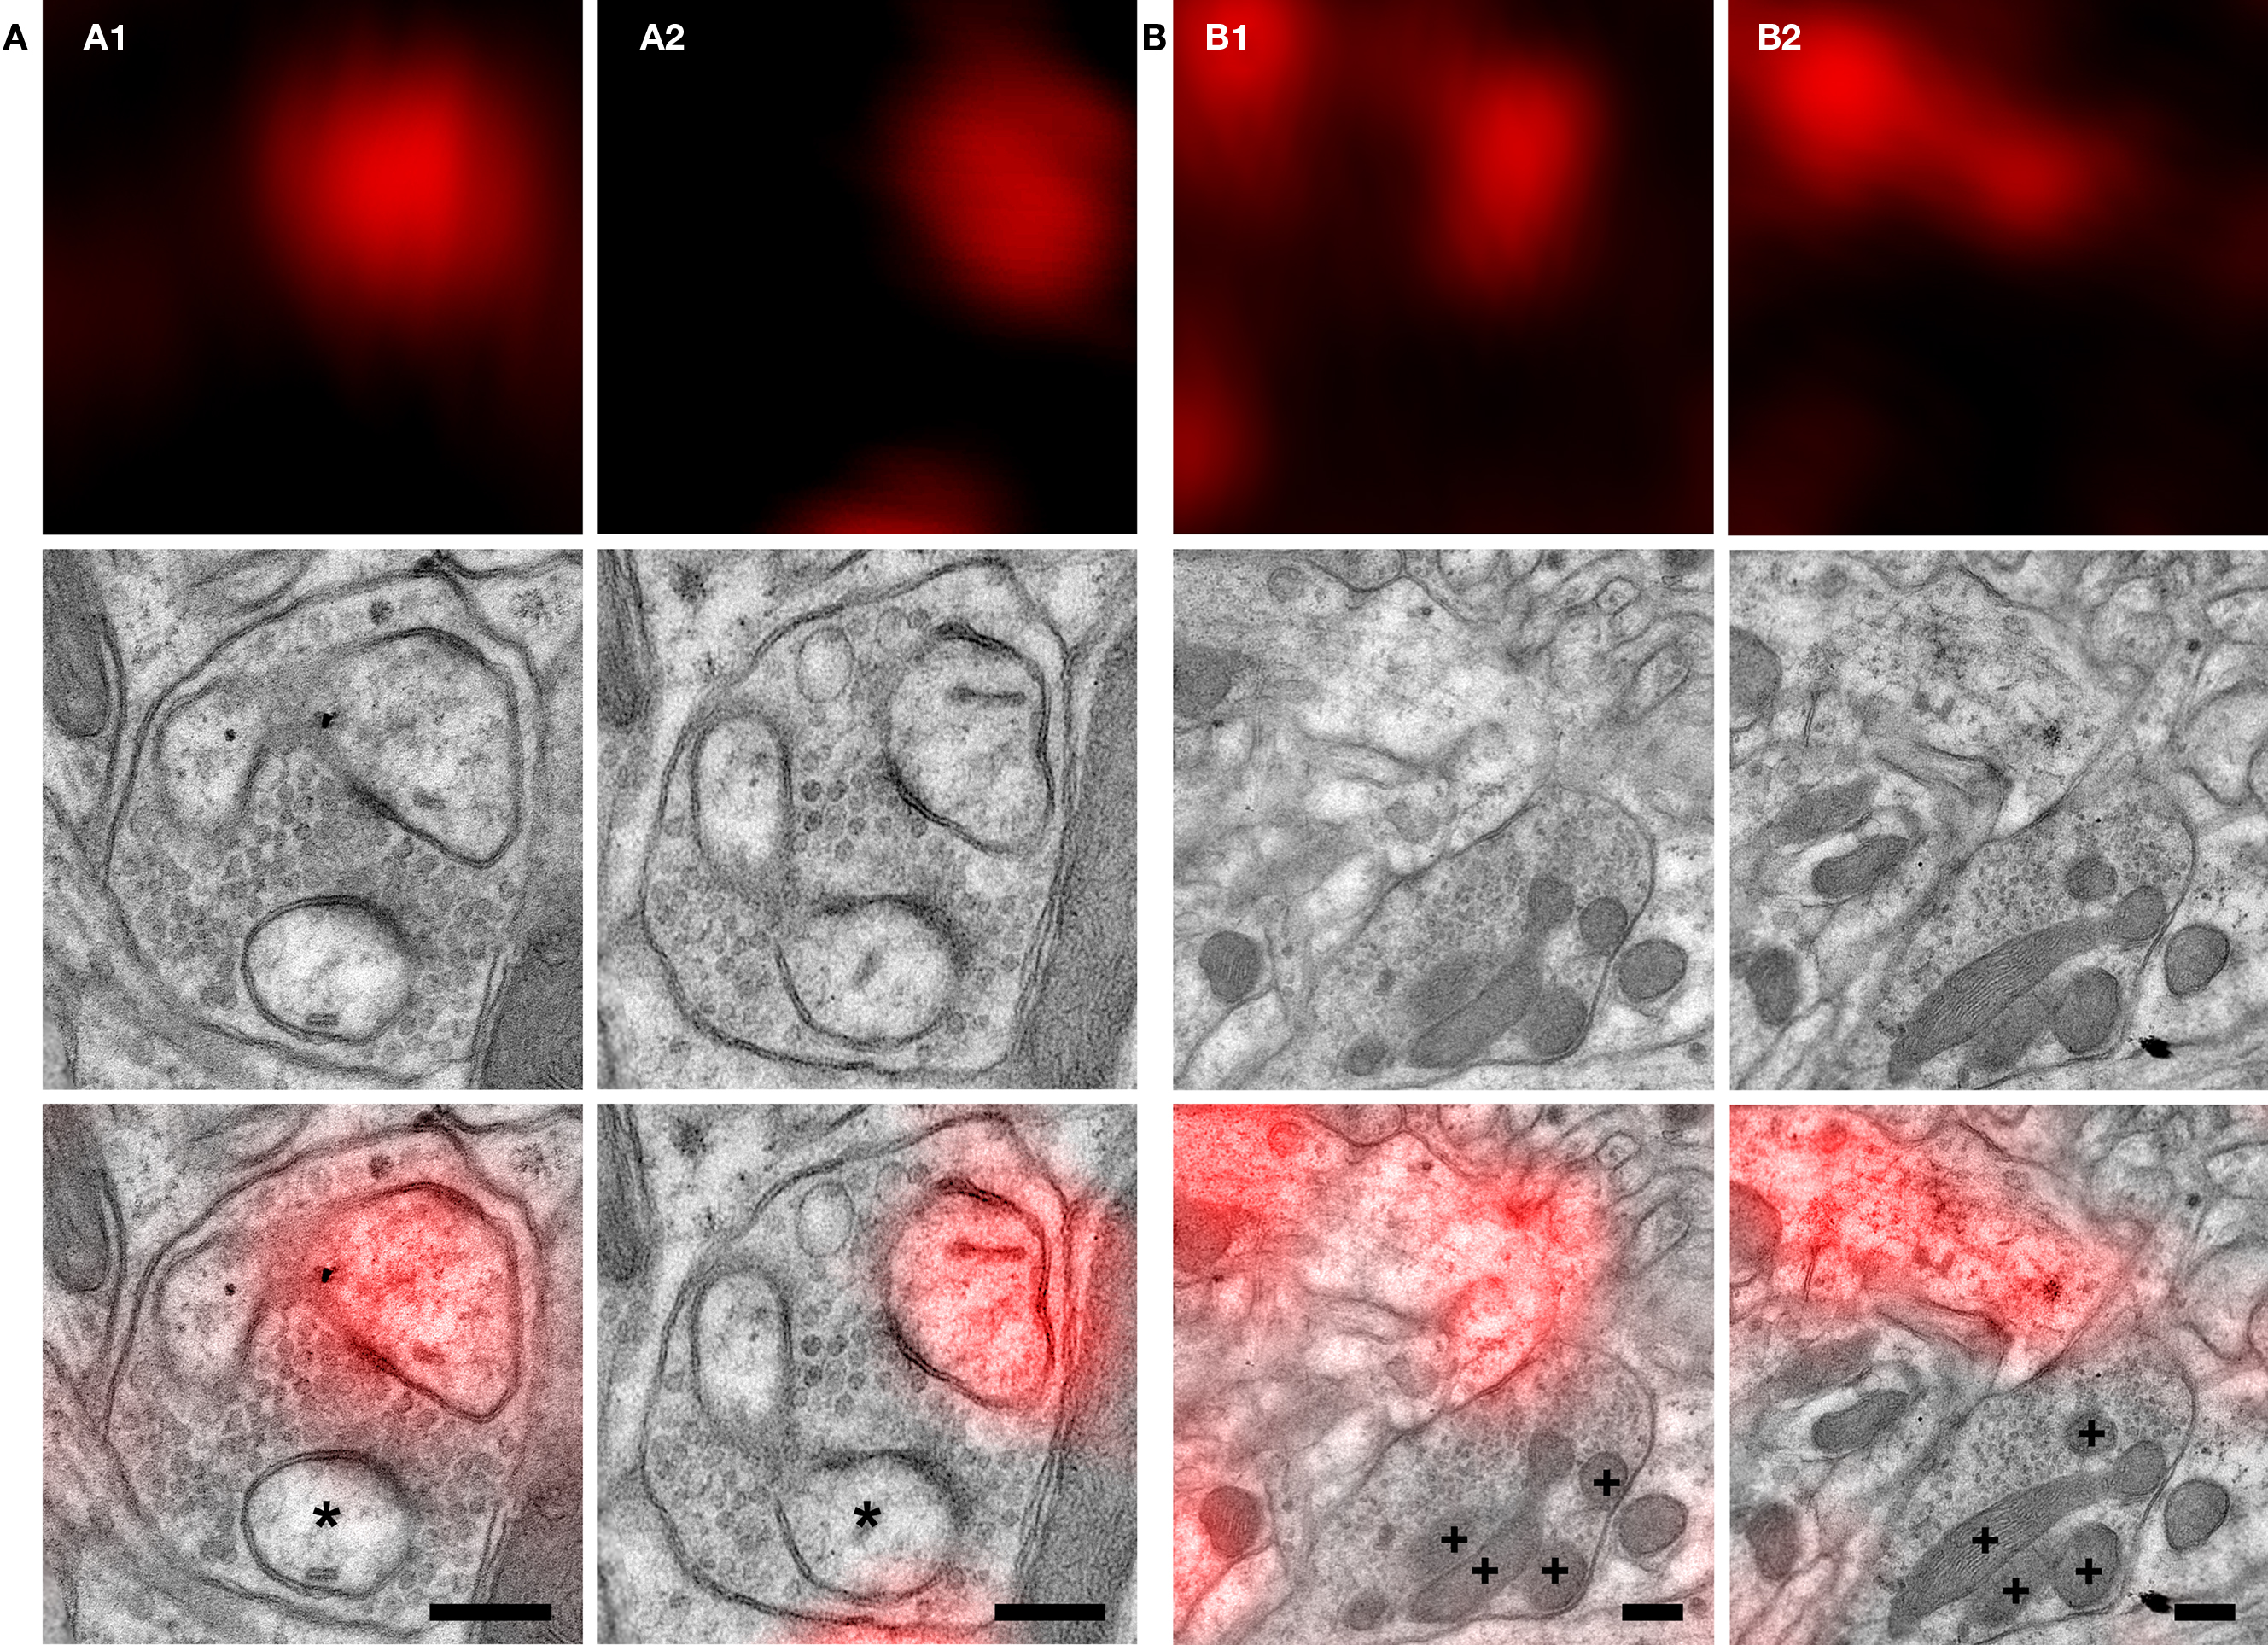
Figure 6. High-magnification micrographs of two synapses made by labeled neurons. Both synapses (A,B) were imaged in two consecutive ultrathin sections (A1 and A2, B1 and B2, respectively). Top row: light micrographs. Middle row: electron micrographs. Bottom row: superposition of LM and EM images. Fluorescence signal overlaps with a post-synaptic compartment and is consistent for this region between the two consecutive sections (A1, A2 and B1, B2 top). (A) The labeled spine is completely embraced by the pre-synaptic bouton, which also makes a synaptic contact with a second spine (asterisk in A1 and A2 bottom). (B) The large pre-synaptic terminal is characterized by the presence of many mitochondria (crosses in B1 and B2 bottom). Tissue preservation is sufficient to resolve synaptic vesicles (A and B middle and bottom). Scale bars: 250 nm.
Discussion
The main difficulty of combining FLM and EM is incompatibility of tissue preparation, resulting either in good fluorescence signal but poor ultrastructure quality, or in good ultrastructure but loss of fluorescence. Nevertheless, we showed that tracers can be re-detected by immunolabeling after their fluorescence is quenched by osmium treatment. Preparation of the tissue with reduced osmium and embedding in epoxy resin preserved the ultrastructure well and yielded high membrane contrast. In combination, our correlative imaging method allows for unambiguous identification of synapses. Such beneficial effects of reduced osmium for post-embedding immunoreactivity have been reported previously in LR White- resin-embedded tissue (Tamaki and Yamashina, 1994 ).
Our approach allows the mapping of different projection neuron types using antibodies against the tracers used to stain them. Such flexibility is useful when complex pathways have to be traced and presents an advantage over classical EM tracers, in which typically only a single subset of neurons can be reconstructed. Classical EM tracing requires an electron-dense substrate usually achieved by HRP-catalyzed polymerization of a chromogen and subsequent heavy-metal intensification. Tracing in the EM is therefore typically limited to only a subset of neurons. Using such traditional EM methods, it would not be possible to trace HVC-projecting Uva neurons and to distinguish whether synapses are made onto RA-, X-projecting, or HVC interneurons (HVCRA, HVCX, HVCI, respectively). By contrast, multi-color fluorescent tracers as we have applied them can provide this information.
We hope that using our fixation and staining protocols, it will be possible to immunolabel also other antigens, for example associated with interneurons. Interneurons could be identified with antibodies against the GABA neurotransmitter, GABA-synthesizing enzymes, or specific calcium-binding proteins. Also, of interest for synapse detection and identification in EM imagery are pre- and post-synaptic markers such as synapsin (De Camilli et al., 1983 ; Micheva and Smith, 2007 ). It may also be possible to use viruses to label neurons and improve the subsequent immunostaining, as viruses are known to express bright fluorescence in neurons or parts thereof. Diverse sets of viruses are used to label neurons in the anterograde direction (lentiviruses, Roberts et al., 2008 ), or the retrograde direction (herpes viruses, Song et al., 2005 , and adeno-associated viruses, Kaspar et al., 2002 ).
Other correlative microscopy techniques exist, for example based on indirect conversion of markers to electron-dense material. Photoconversion is one way to render LM markers visible in the EM. In photoconversion, fluorescence light of a fluorophore is used to transform a substrate into a stable electron-dense material in the presence of DAB (Maranto, 1982 ; Deerinck et al., 1994 ). However, photoconversion times differ among fluorophores (Meisslitzer-Ruppitsch et al., 2009 ) and, to our knowledge, this technique has never been applied successfully to photoconvert fluorophores of different colors at the same time.
Immunolabeling with fluorescent antibodies on ultrathin sections has also been performed on cryosections (Takizawa et al., 1998 ; Slot and Geuze, 2007 ; van Rijnsoever et al., 2008 ). In principle, cryosectioning techniques could be used to detect neural tracers in ultrathin sections without immunolabeling, because fluorescence quenching steps can be omitted (tissue preparation is limited to paraformaldehyde fixation, infiltration with sucrose and freezing). The caveats of cryosectioning are that collecting large numbers of serial sections is almost impossible due to section instability. Also, membrane contrast in cryosections is low, which may ultimately impede automated segmentation approaches. In the method we described here, membrane contrast is high and serial sectioning is feasible.
We anticipate that our work on array tomography will be most useful for automatically registering CLSM and EM image stacks. Today several factors impede straightforward registration of such stacks, which include non-linear distortions of tissue geometry due to treatment with heavy metals, dehydration, resin embedding, and ultrathin sectioning. Non-homogeneous tissue distortions make a simple global alignment of CLSM and EM image stacks impossible based on solely translation and rotation of one stack. However, we believe that array tomography will provide data to help establish local correspondences between CLSM and EM image stacks. On the one hand, in array tomography, images are taken from the same ultrathin section and distortions between EM and LM images seem to be minimal. On the other hand, correlation of array tomographic data with electron micrographs is straightforward and correlation with CLSM image stacks seems to be computationally simple (cross-correlation approach). Our correlative approach will be that specific landmarks such as labeled cell bodies, vesicles containing high concentration of tracer, labeled axons and dendrites, blood vessels, etc, are first detected in CLSM image stacks, then re-detected in ultrathin sections, and then correlated with structure in EM micrographs. Helpful is also that a single ultrathin section imaged in the FLM can show finer details than confocal optical slices, because axial resolution in the confocal microscope is worse than 500 nm while ultrathin sections have a thickness below 100 nm. In other words, we propose to use array tomography to supervise machine learning algorithms that solve the correspondence and local warping problems associated with registration of CLSM and EM image stacks. When such algorithms are well trained, array tomographic steps may become redundant, at which point other serial high-throughput imaging techniques may be applied instead of serial-section EM.
For our animal of choice, the songbird, we will employ our method to statistically quantify connections between different projection neurons in song-control nuclei. The overall goal is to learn how neural signals are routed into and out of HVC, and to understand more about the wiring diagram of this complex sensorimotor network. Our method will hopefully allow us to obtain statistical information about synaptic connectivity between forebrain neurons projecting to HVC, and HVC neurons projecting to downstream motor areas. This information pertains to quantitative questions such as: What is the relative strength/number of connections made by one neuron type (e.g., HVCRA, HVCX, projection neuron afferent to HVC) onto another or same neuron type (HVCRA, HVCX, and HVCI)? By attaining this goal, we will be able to formulate better circuit models of the song-control network and to better understand how the brain is able to generate stereotyped motor behaviors with sub-millisecond precision (Chi and Margoliash, 2001 ). Although our approach will not provide us with the full connection matrix among all individual neurons, it will allow us to address questions related to the relative number of connections made by afferent projection neurons onto projection neurons versus interneurons, to investigate if there is connection preference for one particular type of projection neurons, and to examine if the two populations of projection neurons connect preferentially onto the same or another type.
Conflict of Interest Statement
The authors declare that the research was conducted in the absence of any commercial or financial relationships that could be construed as a potential conflict of interest.
Acknowledgments
The authors would like to thank Prof. Kevan Martin, Rita Bopp, German Koestinger and Simone Rickauer for technical advice.
References
Akutagawa, E., and Konishi, M. (2005). Connections of thalamic modulatory centers to the vocal control system of the zebra finch. Proc. Natl. Acad. Sci. USA 102, 14086–14091.
Anderson, J. C., Binzegger, T., Martin, K. A., and Rockland, K. S. (1998). The connection from cortical area V1 to V5: a light and electron microscopic study. J. Neurosci. 18, 10525–10540.
Anderson, J. C., Douglas, R. J., Martin, K. A., and Nelson, J. C. (1994a). Map of the synapses formed with the dendrites of spiny stellate neurons of cat visual cortex. J. Comp. Neurol. 341, 25–38.
Anderson, J. C., Douglas, R. J., Martin, K. A., and Nelson, J. C. (1994b). Synaptic output of physiologically identified spiny stellate neurons in cat visual cortex. J. Comp. Neurol. 341, 16–24.
Ashmore, R. C., Wild, J. M., and Schmidt, M. F. (2005). Brainstem and forebrain contributions to the generation of learned motor behaviors for song. J. Neurosci. 25, 8543–8554.
Chi, Z., and Margoliash, D. (2001). Temporal precision and temporal drift in brain and behavior of zebra finch song. Neuron 32, 899–910.
De Camilli, P., Harris, S. M., Jr., Huttner, W. B., and Greengard, P. (1983). Synapsin I (Protein I), a nerve terminal-specific phosphoprotein. II. Its specific association with synaptic vesicles demonstrated by immunocytochemistry in agarose-embedded synaptosomes. J. Cell Biol. 96, 1355–1373.
Deerinck, T. J., Martone, M. E., Lev-Ram, V., Green, D. P., Tsien, R. Y., Spector, D. L., Huang, S., and Ellisman, M. H. (1994). Fluorescence photooxidation with eosin: a method for high resolution immuno localization and in situ hybridization detection for light and electron microscopy. J. Cell Biol. 126, 901–910.
Fairen, A. (2005). Pioneering a golden age of cerebral microcircuits: the births of the combined Golgi-electron microscope methods. Neuroscience 136, 607–614.
Gaietta, G., Deerinck, T. J., Adams, S. R., Bouwer, J., Tour, O., Laird, D. W., Sosinsky, G. E., Tsien, R. Y., and Ellisman, M. H. (2002). Multicolor and electron microscopic imaging of connexin trafficking. Science 296, 503–507.
Giepmans, B. N., Deerinck, T. J., Smarr, B. L., Jones, Y. Z., and Ellisman, M. H. (2005). Correlated light and electron microscopic imaging of multiple endogenous proteins using quantum dots. Nat. Methods 2, 743–749.
Gray, E. G. (1959). Electron microscopy of synaptic contacts on dendrite spines of the cerebral cortex. Nature 183, 1592–1593.
Hahnloser, R. H., Kozhevnikov, A. A., and Fee, M. S. (2002). An ultra-sparse code underlies the generation of neural sequences in a songbird. Nature 419, 65–70.
Hahnloser, R. H., Wang, C. Z., Nager, A., and Naie, K. (2008). Spikes and bursts in two types of thalamic projection neurons differentially shape sleep patterns and auditory responses in a songbird. J. Neurosci. 28, 5040–5052.
Haraguchi, C. M., and Yokota, S. (2002). Immunofluorescence technique for 100-nm-thick semithin sections of Epon-embedded tissues. Histochem. Cell Biol. 117, 81–85.
Kaspar, B. K., Erickson, D., Schaffer, D., Hinh, L., Gage, F. H., and Peterson, D. A. (2002). Targeted retrograde gene delivery for neuronal protection. Mol. Ther. 5, 50–56.
LaVail, J. H., and LaVail, M. M. (1972). Retrograde axonal transport in the central nervous system. Science 176, 1416–1417.
Maranto, A. R. (1982). Neuronal mapping: a photooxidation reaction makes Lucifer yellow useful for electron microscopy. Science 217, 953–955.
Meisslitzer-Ruppitsch, C., Rohrl, C., Neumuller, J., Pavelka, M., and Ellinger, A. (2009). Photooxidation technology for correlated light and electron microscopy. J. Microsc. 235, 322–335.
Micheva, K. D., and Smith, S. J. (2007). Array tomography: a new tool for imaging the molecular architecture and ultrastructure of neural circuits. Neuron 55, 25–36.
Nottebohm, F., and Arnold, A. P. (1976). Sexual dimorphism in vocal control areas of the songbird brain. Science 194, 211–213.
Nottebohm, F., Kelley, D. B., and Paton, J. A. (1982). Connections of vocal control nuclei in the canary telencephalon. J. Comp. Neurol. 207, 344–357.
Reiner, A., Veenman, C. L., Medina, L., Jiao, Y., Del Mar, N., and Honig, M. G. (2000). Pathway tracing using biotinylateddextran amines. J. Neurosci. Methods 103, 23–37.
Roberts, T. F., Klein, M. E., Kubke, M. F., Wild, J. M., and Mooney, R. (2008). Telencephalic neurons monosynaptically link brainstem and forebrain premotor networks necessary for song. J. Neurosci. 28, 3479–3489.
Song, C. K., Enquist, L. W., and Bartness, T. J. (2005). New developments in tracing neural circuits with herpesviruses. Virus Res. 111, 235–249.
Takizawa, T., Suzuki, K., and Robinson, J. M. (1998). Correlative microscopy using FluoroNanogold on ultrathin cryosections. Proof of principle. J. Histochem. Cytochem. 46, 1097–1102.
Tamaki, H., and Yamashina, S. (1994). Improved method for post-embedding cytochemistry using reduced osmium and LR white resin. J. Histochem. Cytochem. 42, 1285–1293.
van Rijnsoever, C., Oorschot, V., and Klumperman, J. (2008). Correlative light-electron microscopy (CLEM) combining live-cell imaging and immunolabeling of ultrathin cryosections. Nat. Methods 5, 973–980.
Vu, E. T., Mazurek, M. E., and Kuo, Y. C. (1994). Identification of a forebrain motor programming network for the learned song of zebra finches. J. Neurosci. 14, 6924–6934.
White, J. G., Southgate, E., Thomson, J. N., and Brenner, S. (1986). The structure of the nervous-system of the nematode Caenorhabditis elegans. Phil. Trans. Roy. Soc. Lond. B Biol. Sci. 314, 1–340.
Wild, J. M., Williams, M. N., Howie, G. J., and Mooney, R. (2005). Calcium-binding proteins define interneurons in HVC of the zebra finch (Taeniopygiaguttata). J. Comp. Neurol. 483, 76–90.
Keywords: correlative microscopy, electron microscopy, light microscopy, immunofluorescence, array tomography, songbird, HVC, neural tracer
Citation: Oberti D, Kirschmann MA and Hahnloser RHR (2010) Correlative microscopy of densely labeled projection neurons using neural tracers. Front. Neuroanat. 4:24. doi: 10.3389/fnana.2010.00024
Received: 05 February 2010;
Paper pending published: 19 March 2010;
Accepted: 14 May 2010;
Published online: 14 June 2010
Edited by:
Kristen M. Harris, The University of Texas at Austin, USAReviewed by:
Tom Reese, National Institutes of Health, USACharles A. Greer, Yale University School of Medicine, USA
Copyright: © 2010 Oberti, Kirschmann and Hahnloser. This is an open-access article subject to an exclusive license agreement between the authors and the Frontiers Research Foundation, which permits unrestricted use, distribution, and reproduction in any medium, provided the original authors and source are credited.
*Correspondence: Richard H. R. Hahnloser, Institute of Neuroinformatics, University of Zurich and ETH Zurich, Winterthurerstrasse 190, 8057 Zurich, Switzerland. e-mail: rich@ini.phys.ethz.ch