Relaxin-3-deficient mice showed slight alteration in anxiety-related behavior
- 1 Department of Basic Geriatrics, Kyoto Prefectural University of Medicine, Kyoto, Japan
- 2 Frontier Technology Center, Graduate School of Medicine, Kyoto University, Kyoto, Japan
- 3 Division of Systems Medicine, Institute for Comprehensive Medical Science, Fujita Health University, Aichi, Japan
- 4 Frontier Research Laboratories, Pharmaceutical Research Division, Takeda Pharmaceutical Company Ltd., Tsukuba, Japan
- 5 Pharmacology Research Laboratories, Pharmaceutical Research Division, Takeda Pharmaceutical Company Ltd., Osaka, Japan
- 6 Department of Psychiatry, Kyoto Prefectural University of Medicine, Kyoto, Japan
Relaxin-3 is a neuropeptide belonging to the relaxin/insulin superfamily. Studies using rodents have revealed that relaxin-3 is predominantly expressed in neurons in the nucleus incertus (NI) of the pons, the axons of which project to forebrain regions including the hypothalamus. There is evidence that relaxin-3 is involved in several functions, including food intake and stress responses. In the present study, we generated relaxin-3 gene knockout (KO) mice and examined them using a range of behavioral tests of sensory/motor functions and emotion-related behaviors. The results revealed that relaxin-3 KO mice exhibited normal growth and appearance, and were generally indistinguishable from wild genotype littermates. There was no difference in bodyweight among genotypes until at least 28 weeks after birth. In addition, there were no significant differences between wild-type and KO mice in locomotor activity, social interaction, hot plate test performance, fear conditioning, depression-like behavior, and Y-maze test performance. However, in the elevated plus maze test, KO mice exhibited a robust increase in the tendency to enter open arms, although they exhibited normal performance in a light/dark transition test and showed no difference from wild-type mice in the time spent in central area in the open field test. On the other hand, a significant increase in the acoustic startle response was observed in KO mice. These results indicate that relaxin-3 is slightly involved in the anxiety-related behavior.
Introduction
Relaxin-3/insulin-like peptide7 (INSL7) has been identified as a new member of the insulin/relaxin family using human genomic databases (Bathgate et al., 2002). The 142 amino acid human precursor polypeptide sequence is well conserved between human, pig, rat, and mouse (Kizawa et al., 2003). Structurally, this precursor polypeptide consists of signal peptides as well as a B-chain, C-peptide and A-chain, and contains the RXXXRXXI motif in the B-chain (B12–B19 in human) for binding to the relaxin receptor (Bullesbach et al., 1992). Like insulin, a mature two-chain peptide is produced after removal of the C-peptide and the formation of three disulfide bonds between respective cysteine residues of the A-chain and B-chain (James et al., 1977). Relaxin and relaxin-3 are thought to have different functions. Relaxin plays a role in female reproductive organs (Sherwood, 1994). Female mice without functional relaxin gene have difficulties in delivering milk to their pups and interpubic ligament does not relax during pregnancy (Zhao et al., 1999). On the other hand, the expression of relaxin-3 has been found in the brain and testis using reverse transcriptase-polymerase chain reaction (RT-PCR; Liu et al., 2003). In addition, relaxin-3 activates RXFP3, a G-protein-coupled receptor, with highest affinity (0.31 nM), but, to a lesser extent, can bind RXFP1, the receptor for relaxin, and RXFP4, the receptor for INSL5, which is poorly expressed in the brain (Boels and Schaller, 2003; Liu et al., 2005a,b). Relaxin-3 expression in the brain is confined to the brainstem, and is predominantly expressed by neurons in the gray matter of the midline dorsal pons, termed the NI (Burazin et al., 2002; Tanaka et al., 2005; Ma et al., 2007). Relaxin-3-expressing neurons project axons forward to various regions of the forebrain, densely in the septum, hippocampus, lateral hypothalamus, and intergeniculate leaflet of the thalamus (Tanaka et al., 2005). Several functions of relaxin-3 have been suggested by studies using rats and mice, including a role in food intake, stress responses, neuroendocrine function, and spatial memory (McGowan et al., 2005, 2006; Tanaka et al., 2005; Hida et al., 2006; Ma et al., 2009). One evolutionary study reported that relaxin-3 orthologs are present in puffer fish and zebrafish, but not in any invertebrate or prokaryote, and that these orthologs show high homology between different species in the mature peptide region (Wilkinson et al., 2005). This finding suggests that the function of this protein is highly conserved.
In the present study, to investigate the function of this peptide in the whole body, we generated mice carrying a null mutation in the relaxin-3 gene and examined them using a range of behavioral tests of sensory/motor functions and emotion-related behaviors as relaxin-3 is widely distributed in the forebrain. These mice grow normally, and are fertile. The general appearance of knockout (KO) mice is indistinguishable from that in wild-type mice. However, behavioral screening revealed significant differences in the elevated plus maze test, with relaxin-3 KO mice exhibiting slight anxiolytic behavior.
Materials and Methods
Generation of Relaxin-3 KO Mice
To construct a targeting vector, a 5.5-kb DNA fragment containing the initial codon of the relaxin-3 gene and a 4.5-kb DNA fragment containing the 3′-flanking region of relaxin-3 were inserted into the pKO Scrambler NTKV1901 targeting vector. A linearized targeting vector was transfected into embryonic stem (ES) cells derived from 129/SvJ mouse strain by electroporation. ES cells were selected with G418 (250 μg/ml) and ganciclovir (5 μM), followed by colony isolation. A targeted clone was confirmed by Southern blot analysis and was injected into C57BL/6N blastocysts to generate chimeric mice. Male chimeric mice were bred with C57BL/6N female mice. Mutant mice were backcrossed at least eight generations to the C57BL/6N background. Male mice from the sixth and eighth generations were screened with two microsatellite markers, D8Mit205 and D8Mit248, using the “speed congenics” approach. PCR genotyping of the wild-type mice and the targeted allele was performed using primers 5′-TAGCAAGGAGATGGTAAAGGTCAGGTT-3′, 5′-CAGAGATTCGTGGGCCAAGATGTC-3′, and 5′-ACGCCGAGTTAACGCCATCAAAAATA-3′.
Southern Blot Analysis
The lack of relaxin-3 gene was verified by Southern hybridization of BamHI-digested tail DNA using the Dig-labeled 3′ Probe fragment. Synthesis of DIG-labeled probe was performed with DIG-High Prime DNA Labeling and Detection Starter Kit II (Roche Diagnostics, Mannheim, Germany) according to the manufacturer’s instructions. The PCR primer set for probe amplification was 5′-GGAGTGCAGCCCAGAAATAGAGC-3′/5′-AGCTTTTTACGTGGTTCCTGAGACTGA-3′.
Immunohistochemistry and in situ Hybridization
We previously reported the expression of relaxin-3 in the brain at the mRNA and peptide levels. Briefly, wild-type and KO type mice were deeply anesthetized with sodium pentobarbital i.p. and perfused with 0.1 M phosphate-buffered saline followed by 4% paraformaldehyde. Coronal sections 30 mm thick in the NI were cut with a cryostat. For immunohistochemistry, sections were incubated with monoclonal anti-relaxin-3 antibody (dilution 1:1000), then with Cy3-labeled anti-mouse IgG (dilution 1:750). The specificity of this primary antibody has been described elsewhere (Kizawa et al., 2003; Tanaka et al., 2005). For in situ hybridization, sections were deproteinized, acetylated and hybridized with DIG-labeled riboprobe synthesized from full-length mouse relaxin-3 cDNA in hybridization buffer at 60°C for 12–14 h. After hybridization, sections were washed, and relaxin-3 mRNA was visualized with DIG-coloring steps using alkaline phosphatase-conjugated anti-DIG antibody. These procedures have been previously described elsewhere (Tanaka et al., 2005).
Animals and Experimental Design
Relaxin-3 KO mice and wild-type littermates were obtained by breeding heterozygote mice. Behavioral tests were performed with male mice from this generation, which were 10 weeks old at the start of the behavioral studies (n = 20 for both groups). Housing conditions included a 12-h light/dark cycle, with lights on at 7:00 a.m. and access to food and water ad libitum. Behavioral testing was performed between 9:00 a.m. and 6:00 p.m. After the tests, all apparatus were cleaned with super hypochlorous water to prevent bias caused by olfactory cues in the apparatus. All animal experiments, including the production and maintenance protocols, were reviewed and approved by the Animal Care and Use Committee of the Kyoto Prefectural University of Medicine. Behavioral studies were performed in accordance with the guidelines for animal experimentation of Graduate School of Medicine, Kyoto University. The raw data of the behavioral tests have been disclosed in the mouse behavioral phenotype database1.
General Health and Neurological Screening
To compare the physical characteristics of relaxin-3 KO mice and wild-type littermates, we first conducted neurological screening as previously described (Miyakawa et al., 2001). The righting, whisker touch, and ear twitch reflexes were evaluated, and a number of physical measures including body weight, body temperature, and the presence of whiskers or bald patches were recorded.
Neuromuscular Examination
Neuromuscular strength was examined using the grip strength and wire-hanging tests. The grip strength meter (O’Hara Co., Tokyo, Japan) was used to assess forelimb grip strength. Mice were lifted and held by their tail so that their forepaws could grasp a wire grid. Mice were then gently pulled backward by the tail with their posture parallel to the surface of the table until they released the grid. The peak force applied by mouse forelimbs was recorded in newtons (N). Each mouse was tested three times and the highest value measured was used for statistical analysis. In the wire-hanging test, mice were placed on a wire mesh, which was then inverted and shaken gently, so that the subject gripped the wire. Latency to fall was recorded, with a 60-s cut-off time.
Light/Dark Transition Test
A light/dark transition test was conducted, as previously described (Takao and Miyakawa, 2006). The apparatus used for the light/dark transition test comprised a cage (21 cm × 42 cm × 25 cm) divided into two sections of equal size by a partition with a door (Ohara Co.). One chamber was brightly illuminated (390 lux), whereas the other chamber was dark (2 lux). Mice were placed into the dark side and allowed to move freely between the two chambers with the door open for 10 min. The total number of transitions, time spent in each compartment, first latency of movement to light side, and distance traveled were recorded automatically, using Image LD software (see Image Analysis).
Open Field Test
Locomotor activity was measured using an open field test. Each subject was allowed to move freely in the open field apparatus (40 cm × 40 cm × 30 cm; AccuScan Instruments, Columbus, OH, USA) equipped with photocells (beam spacing 2.5 cm, beam diameter 4 mm, beam frequency 50 cycles/s). Total distance traveled, vertical activity (rearing measured by counting the number of photobeam interruptions), time spent in the center area of the open field, and counts of stereotypic behavior were recorded using the VersaMax system (AccuScan Instruments, Columbus, OH, USA). The center areas were defined as an inner section 1 cm away from each of the walls. If the beam at the edge of the open field, 1 cm apart from the wall, was not interrupted, mice were considered to be in the center area. If a mouse broke the same beam (or set of beams) repeatedly, it was considered to exhibit stereotypic activity. This type of activity is often exhibited as grooming or head bobbing behaviors. Stereotypic counts are the number of beam breaks that occur during any period of stereotypic activity. Data were collected for 120 min.
Elevated Plus Maze Test
Elevated plus maze test was performed as described previously (Komada et al., 2008). The elevated plus maze consisted of two open arms (25 cm × 5 cm) and two enclosed arms of the same size, with 15 cm high transparent walls. The arms and central square were constructed from white plastic sheets, elevated to a height of 55 cm above the floor. To minimize the likelihood of animals falling from the apparatus, 3-mm high Plexiglas sides were used for the open arms. Arms of the same type were arranged at opposite sides to each other. This device was set up under low illumination (center square 100 lux). Each mouse was placed in the central square of the maze (5 cm × 5 cm), facing one of the closed arms. Mouse behavior was recorded during a 10-min test period. The number of entries into, and the time spent on open and enclosed arms were recorded. For data analysis, we employed the following four measures: the percentage of entries onto open arms, the stay time on open arms (seconds), the number of total entries, and the total distance traveled (centimeters). Data acquisition and analysis were performed automatically using Image EP software.
Hot Plate Test
The hot plate test was used to evaluate the nociception or the sensitivity to a painful stimulus. Mice were placed on a hot plate at 55.0 ± 0.3°C (Columbus Instruments, Columbus, OH, USA), and the latency to the first hind-paw response was recorded. The hind-paw responses counted were foot shakes or a paw licks.
Social Interaction Test in a Novel Environment
Social interaction test was performed as described previously (Yamasaki et al., 2008). Two mice of identical genotypes that were previously housed in different cages were placed in a box together (40 cm × 40 cm × 30 cm) and allowed to explore freely for 10 min. Social behavior was monitored with a CCD camera connected to a Macintosh computer, and analysis was performed automatically using Image SI software (see Data Analysis). The total number of contacts, total duration of active contacts, total contact duration, mean duration per contact, and total distance traveled were measured. The active contact was defined as follows. Images were captured at 3 frames per second, and distance traveled between two successive frames was calculated for each mouse. If the two mice contacted each other and the distance traveled by either mouse was longer than 3 cm, the behavior was considered an “active contact.”
Rotarod Test
Motor coordination and balance were tested with the rotarod test. We performed the rotarod test using an accelerating rotarod (UGO Basile Accelerating Rotarod; Ugo Basile, Comerio VA, Italy) by placing a mouse on a rotating drum (3 cm diameter) and measuring the period that each animal was able to maintain its balance on the rod, as latency to fall (seconds). The rotarod was accelerated from 4 to 40 rpm over a 5-min period.
Startle Response/Prepulse Inhibition Tests
Startle responses and prepulse inhibition (PPI) of startle responses were measured using an automatic startle reflex measurement system (O’Hara Co.). At the beginning of each test session, a mouse was placed in a Plexiglas cylinder, and left undisturbed for 10 min. The startle stimulus for all trial types was a 40-ms burst of broadband white noise, and the startle response was recorded during this time period (measuring the response every 1 ms) without the prepulse stimulus. The PPI response was recorded for 140 ms, beginning with the onset of the prepulse stimulus. The background noise level in each chamber was 70 dB. The peak startle amplitude recorded during the 140-ms sampling window was used as the dependent variable. A test session consisted of six trial types (i.e., two types for startle stimulus only trials, and four types for PPI trials). The intensity of the startle stimulus was 110 or 120 dB. The prepulse stimulus was presented 100 ms before the startle stimulus, with an intensity of 74 or 78 dB. Four combinations of prepulse and startle stimuli were employed (74–110, 78–110, 74–120, and 78–120). Six blocks of the six trial types were presented in pseudorandom order, such that each trial type was presented once within a block. The average intertrial interval was 15 s (range: 10–20 s).
Porsolt Forced Swim Test
The Porsolt forced swim test was conducted as described previously (Miyakawa et al., 2001). The apparatus consisted of four Plexiglas cylinders (20 cm height × 10 cm diameter). The cylinders were filled with water at 23°C, up to a height of 7.5 cm. Mice were placed into the cylinders. The duration of immobility and distance traveled were recorded over a 10-min test period (days 1 and 2). Images were captured at one frame per second. For each pair of successive frames, the amount of area (pixels) within which the mouse moved was measured. When the amount of area was below a certain threshold, mouse behavior was judged as “immobile.” When the amount of area equaled or exceeded the threshold, the mouse was considered as “moving.” The optimal threshold by which to judge was determined by adjusting it to the amount of immobility measured by human observation. Immobility lasting for less than a 2-s was not included in the analysis. Data acquisition and analysis were performed automatically, using Image J based original program Image PS software. Data are presented as the percentage of immobility time and the distance traveled per each minute of the 10-min observation period.
Y-Maze Test
Exploratory activity was measured using a Y-maze apparatus (arm length: 40 cm, arm bottom width: 3 cm, arm upper width: 10 cm, height of wall: 12 cm). Each subject was placed in the center of the Y-maze field. The numbers of entries and alterations were recorded using a modified version of the Image EP program. Data were collected for 10 min (Tamada et al., 2010).
Contextual and Cued Fear Conditioning
Contextual and cued fear conditioning was performed as described previously (Takao et al., 2010). Each mouse was placed in a test chamber (26 cm × 34 cm × 29 cm) within a larger sound-attenuated chamber (O’Hara Co.), and allowed to explore freely for 2 min. A 30-s burst of 60 dB white noise served as the conditioned stimulus (CS). Next, a mild (2 s, 0.5-mA) foot shock, which served as the unconditioned stimulus (US), was administered immediately after the CS. Two more CS–US pairings were presented with a 2-min interstimulus interval (three times). Conditioning data were recorded for 8 min. Context testing was conducted 24 h after conditioning in the same chamber for 5 min. Cued testing with altered context was conducted for 6 min after conditioning using a triangular box (35 cm × 35 cm × 40 cm) constructed from white opaque Plexiglas, which was located in a different room. During the last 3 min, the auditory stimulus was presented. Data acquisition, control of stimuli (i.e., tones and shocks), and data analysis were performed automatically using Image FZ software. Images were captured at 1 frame per second. The distance moved by the mouse (in pixels) was measured for each pair of successive frames. If this distance was below 20 pixels, the behavior was operationally defined as “freezing.” When the distance equaled or exceeded the threshold, the behavior was defined as “non-freezing.” The optimal threshold (amount of pixels) for determining freezing versus non-freezing was calibrated by human observation of the behavior. Freezing lasting less than 2 s was not included in the analysis.
Tail Suspension Test
The tail suspension test was performed for a 10-min test session according to procedures described by (Steru et al., 1985). Mice were suspended 30 cm above the floor in a visually isolated area by adhesive tape placed ∼1 cm from the tip of the tail. The duration of immobility and distance traveled were recorded over a 10-min test period. Images were captured as described in Porsolt forced swim test section. Data acquisition and analysis were performed automatically using Image TS software (see Image Analysis below).
Image Analysis
The software used for the behavioral studies (Image LD, Image EP, Image FZ, Image SI, and Image TS) was based on the public domain NIH Image program (developed at the U.S. National Institutes of Health and available on the Internet at http://rsb.info.nih.gov/nih-image/) and ImageJ software2, modified for each test by one of the authors (TM; available through O’Hara Co.).
Statistical Analysis
Statistical analysis was conducted using Stat View (SAS institute, Cary, NC, USA). The significance of between two groups was calculated by Student’s t-test, except when there was a significant difference between the variances of the two groups (F-test), in which case a non-parametric method (Mann–Whitney’s U-test) was used. In body weight, open field, rotarod, Porsolt forced swim, and fear conditioning, data were analyzed using two-way repeated measures ANOVA. Alpha level was set to 0.05. Values in tables and graphs are presented as mean ± SEM.
Results
Generation of Relaxin-3 KO Mice
To disrupt the relaxin-3 gene, exon 1 and exon 2 were replaced with a PGK-neomycin resistance cassette (Figure 1A). After electroporation and double selection with G418 and ganciclovir, ES cell lines in which the relaxin-3 locus was correctly targeted were identified with Southern blot analysis. We used these lines to generate chimeric animals. Male chimeras were mated with wild-type C57BL/6N females, and their offspring were analyzed for relaxin-3 recombination using PCR and Southern blotting analysis. After eight generations of backcrossing with C57BL/6N, relaxin-3 null mice were generated by mating heterozygous mice (Figure 1B). In situ hybridization analysis and immunohistochemistry showed that the mRNA and peptides of relaxin-3 were never exhibited in the NI (Figure 1C).
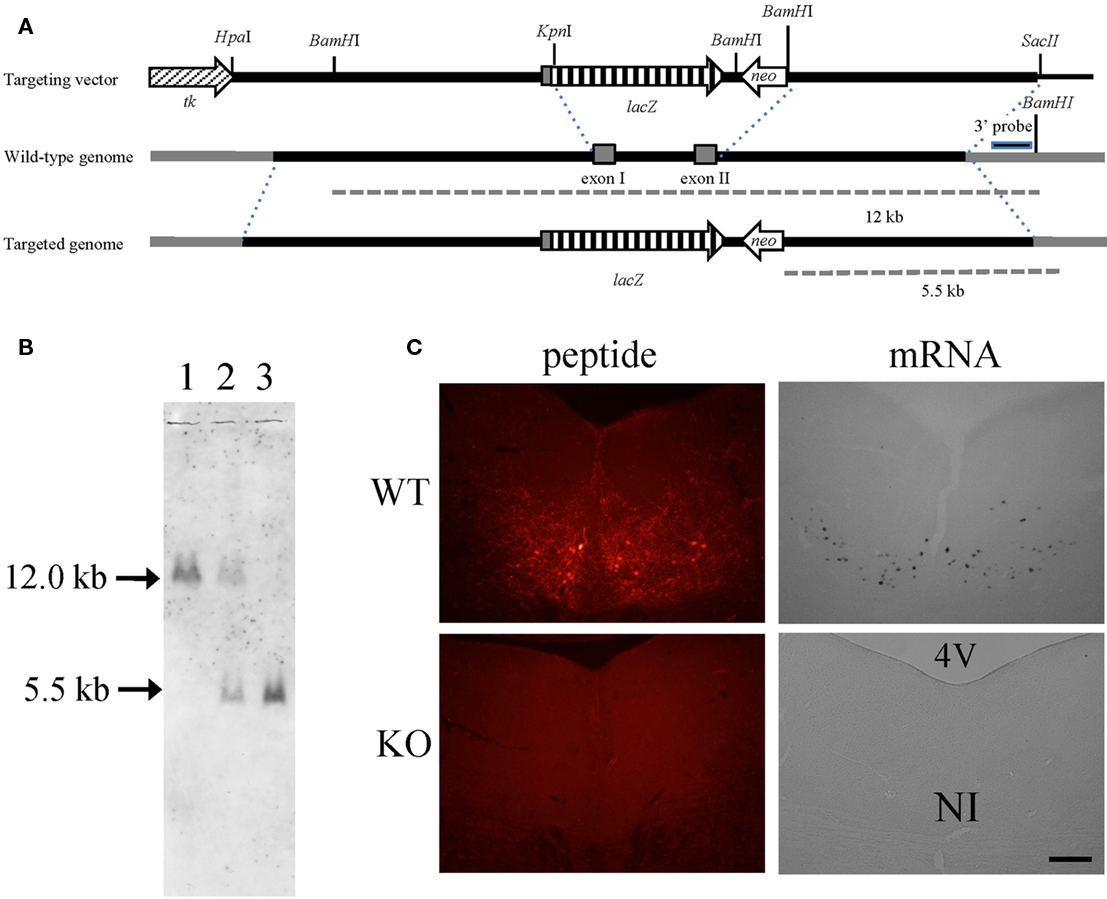
Figure 1. Relaxin-3 KO mice. (A) Construction of the targeting vector for producing relaxin-3 KO mice. The genomic region between exon I and exon II of relaxin-3 gene was disrupted by PGK-neomycin resistance cassette. (B) Southern blot of BamHI-digested genomic DNA using a 3′ external probe. The DNA bands indicated by arrows (12 kb and 5.5 kb) correspond to the BamHI-fragments shown in (A). Lanes 1, 2, and 3 are WT (relaxin-3+/+), heterozygote (relaxin-3+/−), and KO (relaxin-3−/−), respectively. Note that the DNA band in lane 2 is half as intense as that in lane 1 and 3. (C) The expression of relaxin-3 was confirmed by immunohistochemistry (left) and in situ hybridization (right) of brain sections from wild-type (upper) and relaxin-3 KO (lower) mice. Neither relaxin-3 nor mRNA peptide was detected in the nucleus incertus (NI) of KO mice.
General Health of Relaxin-3 KO Mice
There were no evident abnormalities in the physical characteristics of relaxin-3 KO mice, including reproductive capability, and no significant differences in body temperature, grip strength or wire-hanging time between relaxin-3 KO and wild-type littermates (Table 1). The body weight of wild-, hetero- or homozygous relaxin-3 KO mice was also measured once weekly between 3 and 28 weeks of age (Figure 2). Mean body weight was not different among three genotypes. The life-span of KO and heterozygote mice was at least 18 months, not different from that of wild genotype mice.
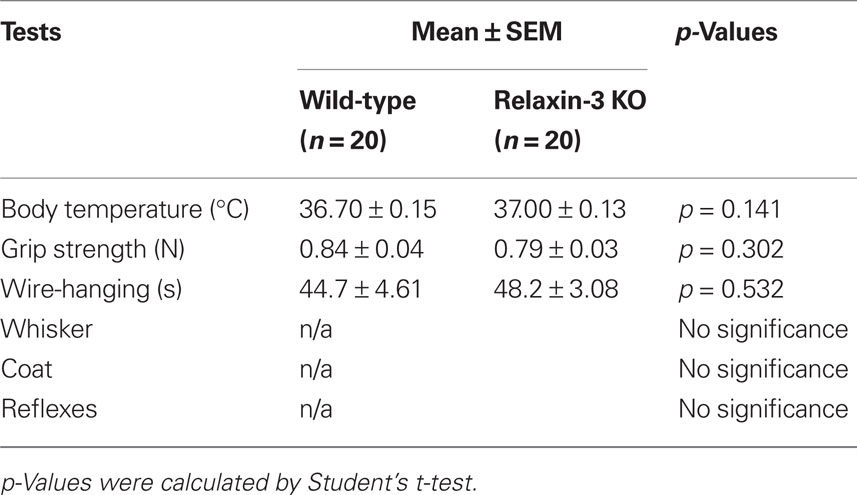
Table 1. General health of relaxin-3 KO mice.
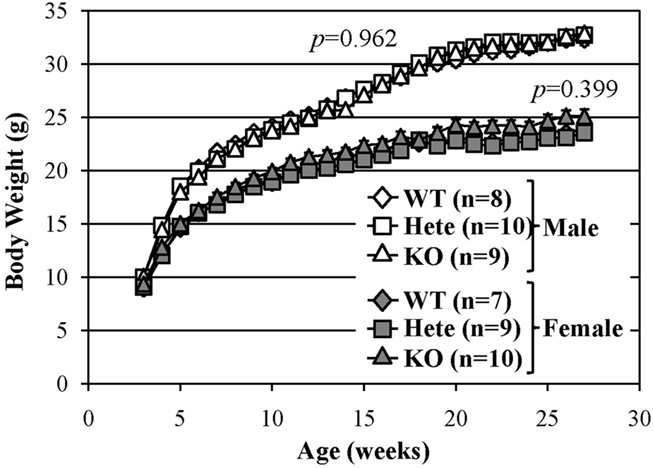
Figure 2. Normal growth of relaxin-3 KO mice. The body weight in the wild-type (WT), heterozygote (Hete), or KO male and female mice was measured during postnatal development. Body weight is presented as mean ± SEM. Data were analyzed with repeated measures ANOVA. p-Values indicate significance of genotype effect.
Anxiety-Related Behavior in Relaxin-3 KO Mice
The light/dark transition test, open field test, and elevated plus maze were conducted as indices of anxiety-related behavioral phenotype (Figures 3–5). In the light/dark transition test, there were no significant differences between relaxin-3 KO and wild-type mice in the distance traveled (Figure 3A; light: p = 0.555, dark: p = 0.825), stay time in the light chamber (Figure 3B; p = 0.671), number of transitions between chambers (Figure 3C; p = 0.777), or latency to first enter the light chamber (Figure 3D; p = 0.325, Mann–Whitney’s U-test). In the open field test, no significant differences were observed in the distance traveled (Figure 4A; F1,38 = 0.839, p = 0.366) or the counts of stereotypic behavior (Figure 4D; F1,38 = 0.01, p = 0.921) among the two genotypes. Although vertical activity was slightly increased in relaxin-3 KO mice compared with wild-type (Figure 4B; F1,38 = 2.411, p = 0.129), significant difference was observed in the vertical activity during the first 30 min (F1.38 = 4.134, p = 0.049). There was no significant difference between the two groups in the time spent in the central area (Figure 4C; F1,38 = 0.278, p = 0.601). Similarly, the major differences were not seen in the time spent in the central area during the first 10 min (Figure 4E; p = 0.508). On the other hand, the elevated plus maze revealed that relaxin-3 KO mice performed a significantly higher percentage of entries into the open arms, and spent a higher percentage of their time in the open arms, indicating mildly decreased anxiety-like behavior compared with wild-type mice (Figure 5B; p = 0.001, Figure 5D; p = 0.111), although there were no significant differences in distance traveled (Figure 5C; p = 0.984), or the number of entries into the arms (Figure 5A; p = 0.758). These results further indicate mildly decreased anxiety-like behavior in relaxin-3 KO mice.
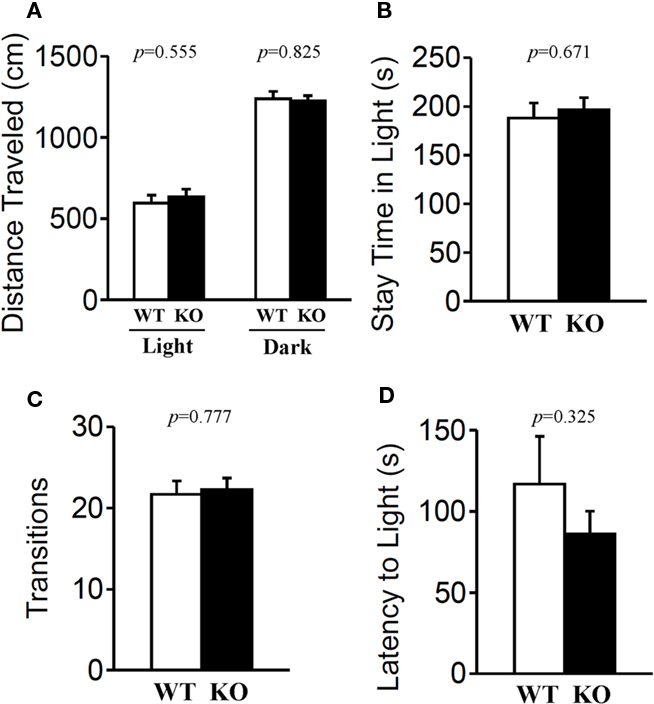
Figure 3. Light/dark transition test. Wild-type (n = 19) and relaxin-3 KO (n = 20) mice were placed individually in the dark compartment at the start of the test. Distance traveled in the light/dark compartments (A), time spent in light compartment (B), number of light/dark transitions (C), and latency to enter the light compartment (D) were recorded. Data are presented as mean ± SEM. p-Values were calculated by Student’s t-test or Mann–Whitney’s U-test.
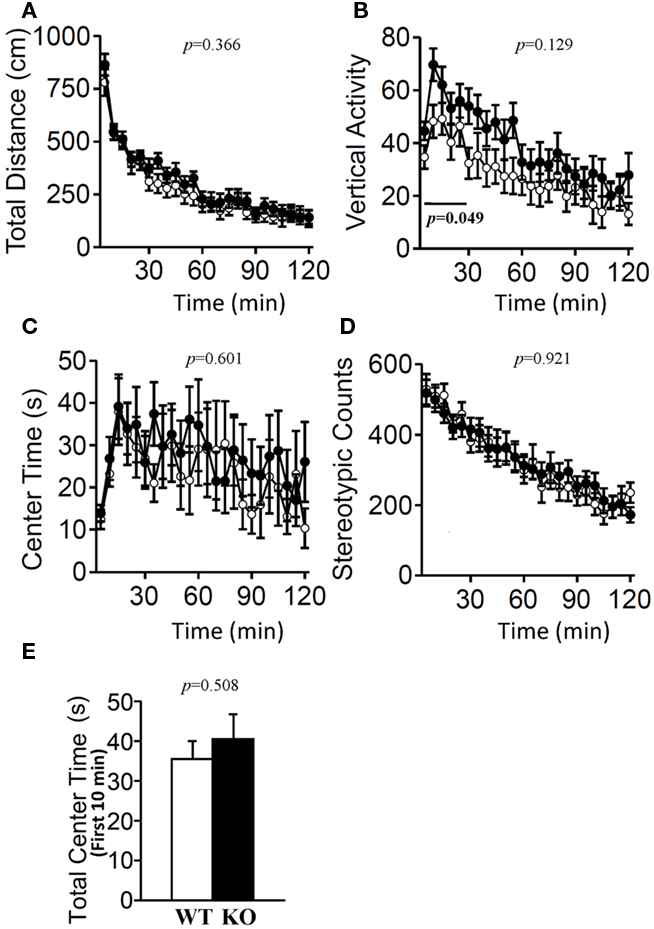
Figure 4. Open field test. Total locomotion distance traveled (A), vertical activity (B), time spent in the center of the compartment (C), and stereotypic behavior (D) were recorded. Data are presented as mean ± SEM (n = 20 each). p-Values indicate significance of genotype effect in two-way repeated measures ANOVA. The vertical activity during the first 30 min (bar) was statistically significant (p = 0.049). (E) Data of the time spent in the central area during the first 10 min were also statistically analyzed using Student’s t-test.
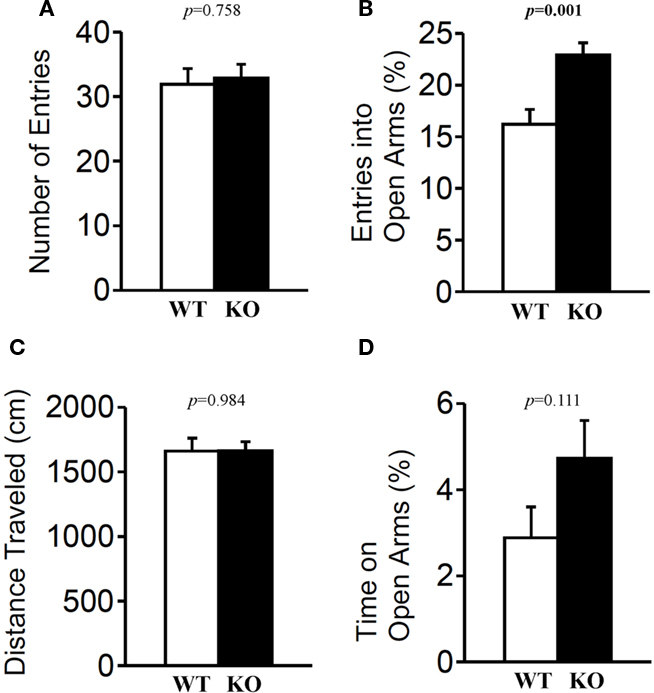
Figure 5. Elevated plus maze test. Mice (n = 20 each) completed the elevated plus maze test. The number of arm entries (A), percentage of entry into open arms (B), distance traveled (C), and time spent in open arms (D) were recorded. Data are presented as mean ± SEM. p-Values were calculated by Student’s t-test.
Locomotor Activity in Relaxin-3 KO Mice
In accord with the lack of a difference in the distance traveled in the open field test, the rotarod test revealed no significant differences in mean locomotor activity between the two genotypes (Figure 6; F1,38 = 2.111, p = 0.155).
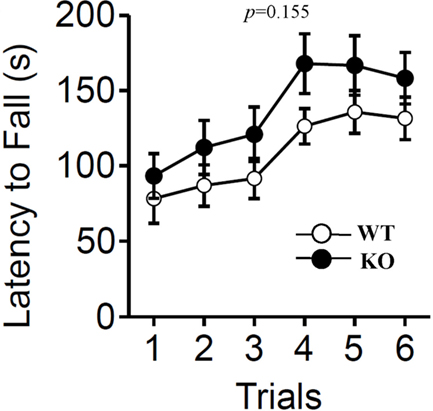
Figure 6. Rotarod test. The rotarod test was performed to measure motor function of wild-type (WT) and relaxin-3 KO (KO) mice. The latency to fall from an accelerating rotarod was measured in three trials per day. Data are presented as mean ± SEM (n = 20 each). p-Values indicate significance of genotype effect in two-way repeated measures ANOVA.
Social Interaction in Relaxin-3 KO Mice
In the social interaction test conducted in a novel environment, the total duration of contacts (Figure 7A; p = 0.828), mean duration per contact (Figure 7D; p = 0.504), total duration of active contacts (Figure 7C; p = 0.154), distance traveled (Figure 7E; p = 0.743), and mean number of contacts (Figure 7B; p = 0.347) did not differ between genotypes.
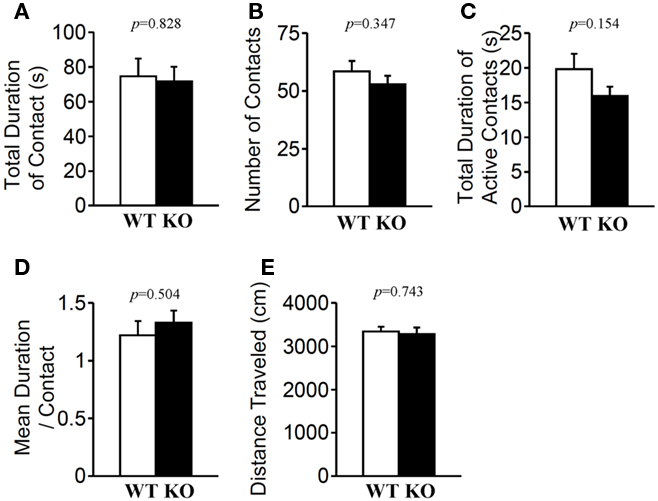
Figure 7. Social interaction in a novel environment. Total duration of contacts (A), number of contacts (B), total duration of active contacts (C), mean duration of each contact (D), and total distance traveled (E) were recorded. p-Values were calculated by Student’s t-test.
Schizophrenia- and Depression-Related Characteristics of Relaxin-3 KO Mice
Prepulse inhibition of the acoustic startle response (ASR) is a model of sensorimotor gating in which a weak stimulus modifies the behavioral effect of a second, more intense stimulus. PPI is a time-linked phenomenon that has been characterized extensively in humans and animals, and is markedly diminished in schizophrenia (Geyer et al., 2002). The startle response to acoustic stimulation at 110 and 120 dB was significantly elevated in relaxin-3 KO mice (Figure 8A; 110 dB p = 0.002, 120 dB p = 0.037). However, the percent PPI, an index of sensorimotor gating, was greater in relaxin-3 KO than in wild-type mice. In particular, a significant difference in PPI between genotypes was observed at 78 dB prepulse to 110 dB startle (Figure 8B; p = 0.024, Mann–Whitney’s U-test). On the same background of startle response (WT_120 dB startle versus KO_110 dB startle), the percent PPI of KO mice were significantly elevated by both 74 dB and 78 dB of prepulse (Figure 8C; 74 dB p = 0.017, 78dB p = 0.002, Mann–Whitney’s U-test).
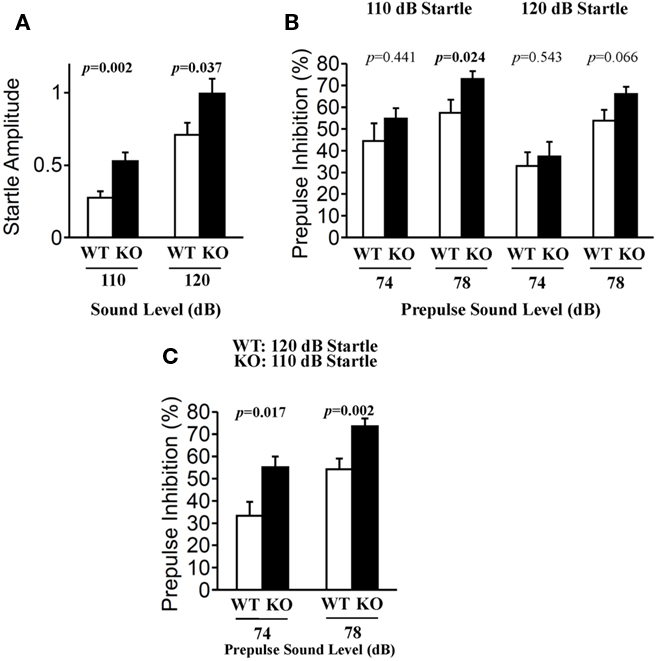
Figure 8. Prepulse inhibition test. Prepulse inhibition was measured by a combination of startle (110 or 120 dB) and two prepulse levels (74 and 78 dB) in wild-type (n = 20) and relaxin-3 KO (n = 20) mice. Startle responses without prepulses (A) and prepulse inhibition of the startle reflex (B,C) were recorded. Startle response amplitude and prepulse inhibition are presented as mean ± SEM and as the mean percent reduction ± SEM, respectively. p-Values were calculated by Student’s t-test or Mann–Whitney’s U-test.
Furthermore, we examined depression-like behavior of relaxin-3 KO mice using the Porsolt forced swim test and the tail suspension test (Figure 9). The results of the Porsolt forced swim test revealed no significant differences in immobility on the first (Day 1) and second (Day 2) trial between the mutant and wild-type mice (Figure 9A; F1,38 = 0.658, p = 0.422 and F1,38 = 0.747, p = 0.393). In accord with the results of the Porsolt forced swim test, no significant difference between genotypes was observed in the tail suspension test (Figure 9C; F1,38 = 0.127, p = 0.724).
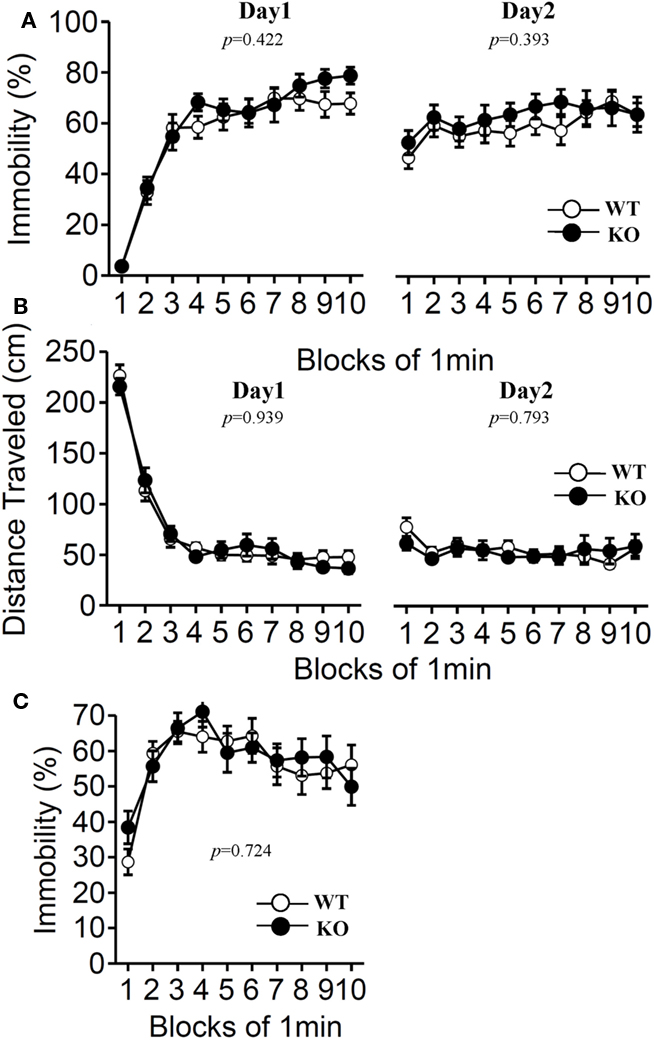
Figure 9. Porsolt forced swim test and tail suspension test. The Porsolt forced swim test (A,B). Immobility time (A) and total distance traveled (B) were recorded in each block for days 1 and 2 (n = 20 each). Tail suspension test (C). Data are presented as mean ± SEM. p-Values indicate significance of genotype effect in two-way repeated measures ANOVA.
Cognitive Function in Relaxin-3 KO Mice
Contextual and cued fear conditioning test
Both genotypes were assessed with contextual and cued fear conditioning measures on the day after exposure to a footshock paired with an auditory-CS. To examine shock sensitivity, we measured the distance traveled when the footshock was delivered during training. Both mutant and wild-type mice responded to footshock (Figure 10F). The examination of pain sensitivity by the hot plate test also revealed no significant differences in the latency to the first hind-paw response between genotypes (Figure 10G; p = 0.418), suggesting normal pain sensitivity in relaxin-3f KO mice. In the conditioning phase, there was no significant difference in freezing behavior between genotypes (Figure 10A; F1,38 = 0.108, p = 0.745). Furthermore, we found no significant differences between genotypes in the percentage of time spent freezing and travel distance in the contextual and cued tests (Figure 10B; F1,38 = 0.517, p = 0.477, Figure 10C; F1,38 = 0.091, p = 0.765, Figure 10D; F1,38 = 0.279, p = 0.601, Figure 10E; F1,38 = 1.248, p = 0.271).
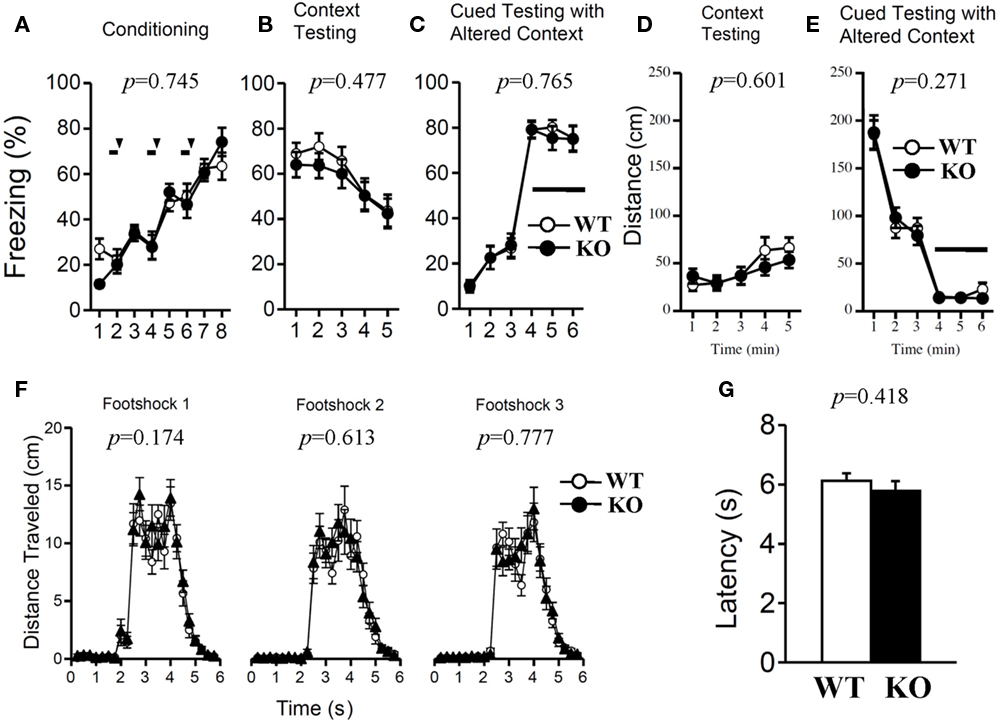
Figure 10. Contextual and cued fear conditioning and hot plate test. Memory consolidation was assessed with contextual and cued fear conditioning tests. Wild-type (n = 20) or relaxin-3 KO (n = 20) mice were placed in a novel environment chamber for 8 min, where they received three electrical foot shocks. Freezing time (A) and distance traveled (F) were recorded. A tone was presented for 30 s (bars) followed by a 2-s foot shock (arrowheads). Twenty-four hours later, mice were placed in the same [context; (B,D)] or modified [cue; (C,E)] chamber, and freezing time was measured as an indicator of memory consolidation. Data are presented as mean ± SEM. p-Values indicate significance of genotype effect in two-way repeated measures ANOVA. Pain sensitivity was confirmed by the hot plate test (G). Data are presented as mean ± SEM. p-Values were calculated by Student’s t-test.
Y-maze
Short-term spatial working memory was examined by monitoring spontaneous alternation behavior in a Y-maze (Parada-Turska and Turski, 1990). There were no significant differences in these measures between relaxin-3 KO and wild-type littermates in the number of arm entries (Figure 11A; p = 0.923), in total alternations (Figure 11B; p = 0.689), in alternation percentage (Figure 11C; p = 0.284) or in total distance (Figure 11D; p = 0.884), indicating that the relaxin-3 mutation did not affect short-term memory.
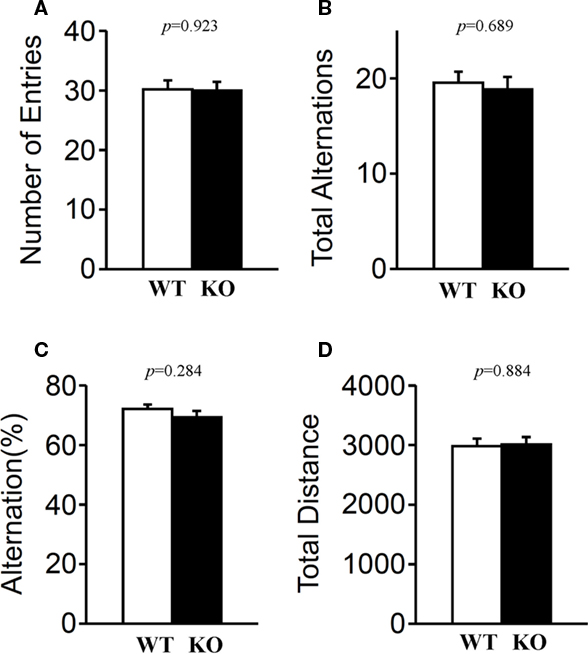
Figure 11. Y-maze test. Mice (n = 20 each) were individually placed into a symmetrical Y-maze. Total number of arm entries (A), number (B) and percentage (C) of alternation between Y-maze arms, and total distance (D) were recorded. Data presented as mean ± SEM. p-Values were calculated by Student’s t-test.
Discussion
The current results indicated that relaxin-3 KO mice generally showed normal development and growth. In addition, KO mice did not exhibit any difference in body weight compared with wild-type or heterozygote mice. Relaxin-3 is known to elicit hyperphagic behavior when administered into the cerebral ventricle or hypothalamic nuclei such as the paraventricular (PVN), supraoptic (SON), and arcuate nucleus (McGowan et al., 2005, 2007). Two studies have examined relaxin-3 KO mice with mixed backgrounds (129S5:B6; Smith et al., 2009; Sutton et al., 2009). Sutton et al. (2009) reported that KO mice were smaller and leaner than congenic controls. However, Smith et al. (2009) reported no significant difference in body weight between genotypes. The discrepancy between Sutton et al.’s (2009) report and the current findings may have arisen from the breeding diet, because the mice in their study were fed on a diet with a higher fat content. Our data is in accord with that of Smith et al. (2009), suggesting that the absence of relaxin-3 does not affect energy consumption and metabolism under normal conditions. Not only relaxin-3 KO mice but also mice deficient in other potent orexigenic peptides such as neuropeptide Y and ghrelin have also been reported to have normal body weight and ad libitum food intake (Hollopeter et al., 1998; Sun et al., 2003).
Across a range of behavioral paradigms, KO mice exhibited significant differences in tests to assess anxiety and fear. In the elevated plus maze, the percentage of entries into the open arms was increased in KO mice compared with the wild phenotype. A modified elevated plus maze test with closed arms made of transparent walls induces moderate stress and is more sensitive to the anxiolytic effects than the standard test which presents concurrent states of anxiety and fear (Anseloni et al., 1995; Anseloni and Brandao, 1997), suggesting that relaxin-3 deficiency would decrease anxiety-related behavior. In the open field test, KO mice exhibited an increase in vertical activity, indicating increased exploratory behavior, although the time spent in the central area was not significantly different. These data indicate that relaxin-3 KO mice exhibited mild anxiolytic-like behavior compared with wild genotype mice. This effect might be mediated via corticotropin releasing factor (CRF) and its receptor CRF receptor type 1 (CRF-R1), both of which are known to play an important role in stress response and anxiety (Reul and Holsboer, 2002). CRF-R1-deficient mice have been reported to exhibit reduced anxiety-related behavior, while transgenic mice overexpressing CRF show increased anxiety-related behavior (Stenzel-Poore et al., 1994; Smith et al., 1998; Timpl et al., 1998). The relaxin-3 receptor, RXFP3 and RXPP1 are strongly expressed in the PVN, a major expression site of CRF in the hypothalamus, which regulates the hypothalamic–pituitary–adrenal axis of stress response (Sutton et al., 2004; Ma et al., 2006; Smith et al., 2010). We recently demonstrated that intracerebroventricular administration of relaxin-3 induced c-Fos expression in CRF neurons in the PVN and increased plasma corticotropin levels, suggesting that relaxin-3 activates CRF neurons (Watanabe et al., 2011). Moreover, CRF-expressing neurons are distributed in the central amygdala and the bed nucleus stria terminalis where relaxin-3 immunoreactive nerve fibers and RXFP3 are moderately expressed (Swanson et al., 1983; Sutton et al., 2004; Tanaka et al., 2005). Taken together, these findings suggest that relaxin-3 regulates anxiety-related responses by activating CRF–CRF-R1 system. In addition to CRF, other candidate peptides, including vasopressin and oxytocin, are thought to be involved in anxiety-like behaviors (Rotzinger et al., 2010), possibly mediating the effects of relaxin-3, since they exist in neurons of the PVN and SON where relaxin-3 receptors (RXFP3 and RXFP1) are strongly expressed (Sutton et al., 2004; Ma et al., 2006; Smith et al., 2010).
In the present study, KO mice showed an increased startle response to acoustic stimulation and were inclined to exhibit greater PPI than wild-type mice. CRF and CRF-R1 are also known to influence the ASR and PPI (Risbrough et al., 2004; Sutherland et al., 2010). Mice overexpressing CRF have been reported to exhibit reduced startle responses and PPI (Dirks et al., 2002). In addition, intracerebroventricular infusion of CRF was found to reduce PPI in mice and rats (Conti et al., 2002; Risbrough et al., 2004). If the CRF response is decreased in relaxin-3 KO mice, ASR and PPI might be increased relative to wild-type mice. ASR is mediated by an oligosynaptic pathway located in the lower brainstem, and its important element is the caudal nucleus of the pontine reticular formation (Koch and Schnitzler, 1997). Relaxin-3 neurons are distributed not only in the NI of the pons but also in the pontine raphe nucleus (Tanaka et al., 2005). Therefore, there is a possibility that relaxin-3 has a direct effect on ASR.
Furthermore, relaxin-3 containing fibers with relaxin-3 receptors are densely distributed in brain areas related to emotion such as the septum, hippocampal formation, diagonal band, amygdaloid complex and hypothalamus (Sutton et al., 2004; Tanaka et al., 2005; Ma et al., 2007). Therefore, relaxin-3 may influence anxiety status directly via its receptors. Smith et al. (2009) reported that relaxin-3 KO mice with mixed backgrounds did not display genotype-related differences in the elevated plus maze. This discrepancy is likely to be related to differences in the genetic background of mice, or differences in housing conditions. The mechanisms by which relaxin-3 affects anxiety-like behavior should be further examined in future studies. Elucidating this question may lead to the development of novel drug treatments, such as receptor antagonists for the mitigation of anxiety responses in humans.
In conclusion, relaxin-3 KO mice with a C57BL/6N background exhibited mild but significant anxiolytic-like behavior, as indicated by the number of entries into open arms in the elevated plus maze test, but showed generally normal characteristics in most other examinations.
Conflict of Interest Statement
The authors declare that the research was conducted in the absence of any commercial or financial relationships that could be construed as a potential conflict of interest.
Acknowledgments
This study was supported by Grants-in-Aid for Scientific Research on Innovative Areas (Comprehensive Brain Science Network) and for Masaki Tanaka (No. 21500329) from the Ministry of Education, Culture, Sports, Science and Technology, Japan, and was also supported by the Research Project in Kyoto Prefectural University of Medicine Research Institute for Neurological Diseases and Geriatrics to Masaki Tanaka.
Footnotes
References
Anseloni, V. Z., and Brandao, M. L. (1997). Ethopharmacological analysis of behaviour of rats using variations of the elevated plus-maze. Behav. Pharmacol. 8, 533–540.
Anseloni, V. Z., Motta, V., Lima, G., and Brandao, M. L. (1995). Behavioral and pharmacological validation of the elevated plus maze constructed with transparent walls. Braz. J. Med. Biol. Res. 28, 597–601.
Bathgate, R. A., Samuel, C. S., Burazin, T. C., Layfield, S., Claasz, A. A., Reytomas, I. G., Dawson, N. F., Zhao, C., Bond, C., Summers, R. J., Parry, L. J., Wade, J. D., and Tregear, G. W. (2002). Human relaxin gene 3 (H3) and the equivalent mouse relaxin (M3) gene. Novel members of the relaxin peptide family. J. Biol. Chem. 277, 1148–1157.
Boels, K., and Schaller, H. C. (2003). Identification and characterisation of GPR100 as a novel human G-protein-coupled bradykinin receptor. Br. J. Pharmacol. 140, 932–938.
Bullesbach, E. E., Yang, S., and Schwabe, C. (1992). The receptor-binding site of human relaxin II. A dual prong-binding mechanism. J. Biol. Chem. 267, 22957–22960.
Burazin, T. C., Bathgate, R. A., Macris, M., Layfield, S., Gundlach, A. L., and Tregear, G. W. (2002). Restricted, but abundant, expression of the novel rat gene-3 (R3) relaxin in the dorsal tegmental region of brain. J. Neurochem. 82, 1553–1557.
Conti, L. H., Murry, J. D., Ruiz, M. A., and Printz, M. P. (2002). Effects of corticotropin-releasing factor on prepulse inhibition of the acoustic startle response in two rat strains. Psychopharmacology (Berl.) 161, 296–303.
Dirks, A., Groenink, L., Schipholt, M. I., van der Gugten, J., Hijzen, T. H., Geyer, M. A., and Olivier, B. (2002). Reduced startle reactivity and plasticity in transgenic mice overexpressing corticotropin-releasing hormone. Biol. Psychiatry 51, 583–590.
Geyer, M. A., McIlwain, K. L., and Paylor, R. (2002). Mouse genetic models for prepulse inhibition: an early review. Mol. Psychiatry 7, 1039–1053.
Hida, T., Takahashi, E., Shikata, K., Hirohashi, T., Sawai, T., Seiki, T., Tanaka, H., Kawai, T., Ito, O., Arai, T., Yokoi, A., Hirakawa, T., Ogura, H., Nagasu, T., Miyamoto, N., and Kuromitsu, J. (2006). Chronic intracerebroventricular administration of relaxin-3 increases body weight in rats. J. Recept. Signal Transduct. Res. 26, 147–158.
Hollopeter, G., Erickson, J. C., Seeley, R. J., Marsh, D. J., and Palmiter, R. D. (1998). Response of neuropeptide Y-deficient mice to feeding effectors. Regul. Pept. 75–76, 383–389.
James, R., Niall, H., Kwok, S., and Bryand-Greenwood, G. (1977). Primary structure of porcine relaxin: homology with insulin and related growth factors. Nature 267, 544–546.
Kizawa, H., Nishi, K., Ishibashi, Y., Harada, M., Asano, T., Ito, Y., Suzuki, N., Hinuma, S., Fujisawa, Y., Onda, H., Nishimura, O., and Fujino, M. (2003). Production of recombinant human relaxin 3 in AtT20 cells. Regul. Pept. 113, 79–84.
Koch, M., and Schnitzler, H. U. (1997). The acoustic startle response in rats-circuits mediating evocation, inhibition and potentiation. Behav. Brain Res. 89, 35–49.
Komada, M., Takao, K., and Miyakawa, T. (2008). Elevated plus maze for mice. J. Vis. Exp. 1088. Available at: http://www.jove.com/details.php?id=1088
Liu, C., Chen, J., Kuei, C., Sutton, S., Nepomuceno, D., Bonaventure, P., and Lovenberg, T. W. (2005a). Relaxin-3/insulin-like peptide 5 chimeric peptide, a selective ligand for G protein-coupled receptor (GPCR)135 and GPCR142 over leucine-rich repeat-containing G protein-coupled receptor 7. Mol. Pharmacol. 67, 231–240.
Liu, C., Kuei, C., Sutton, S., Chen, J., Bonaventure, P., Wu, J., Nepomuceno, D., Kamme, F., Tran, D. T., Zhu, J., Wilkinson, T., Bathgate, R., Eriste, E., Sillard, R., and Lovenberg, T. W. (2005b). INSL5 is a high affinity specific agonist for GPCR142 (GPR100). J. Biol. Chem. 280, 292–300.
Liu, C., Eriste, E., Sutton, S., Chen, J., Roland, B., Kuei, C., Farmer, N., Jornvall, H., Sillard, R., and Lovenberg, T. W. (2003). Identification of relaxin-3/INSL7 as an endogenous ligand for the orphan G-protein-coupled receptor GPCR135. J. Biol. Chem. 278, 50754–50764.
Ma, S., Bonaventure, P., Ferraro, T., Shen, P. J., Burazin, T. C., Bathgate, R. A., Liu, C., Tregear, G. W., Sutton, S. W., and Gundlach, A. L. (2007). Relaxin-3 in GABA projection neurons of nucleus incertus suggests widespread influence on forebrain circuits via G-protein-coupled receptor-135 in the rat. Neuroscience 144, 165–190.
Ma, S., Olucha-Bordonau, F. E., Hossain, M. A., Lin, F., Kuei, C., Liu, C., Wade, J. D., Sutton, S. W., Nunez, A., and Gundlach, A. L. (2009). Modulation of hippocampal theta oscillations and spatial memory by relaxin-3 neurons of the nucleus incertus. Learn. Mem. 16, 730–742.
Ma, S., Shen, P. J., Burazin, T. C., Tregear, G. W., and Gundlach, A. L. (2006). Comparative localization of leucine-rich repeat-containing G-protein-coupled receptor-7 (RXFP1) mRNA and [33P]-relaxin binding sites in rat brain: restricted somatic co-expression a clue to relaxin action? Neuroscience 141, 329–344.
McGowan, B. M., Stanley, S. A., Smith, K. L., Minnion, J. S., Donovan, J., Thompson, E. L., Patterson, M., Connolly, M. M., Abbott, C. R., Small, C. J., Gardiner, J. V., Ghatei, M. A., and Bloom, S. R. (2006). Effects of acute and chronic relaxin-3 on food intake and energy expenditure in rats. Regul. Pept. 136, 72–77.
McGowan, B. M., Stanley, S. A., Smith, K. L., White, N. E., Connolly, M. M., Thompson, E. L., Gardiner, J. V., Murphy, K. G., Ghatei, M. A., and Bloom, S. R. (2005). Central relaxin-3 administration causes hyperphagia in male Wistar rats. Endocrinology 146, 3295–3300.
McGowan, B. M., Stanley, S. A., White, N. E., Spangeus, A., Patterson, M., Thompson, E. L., Smith, K. L., Donovan, J., Gardiner, J. V., Ghatei, M. A., and Bloom, S. R. (2007). Hypothalamic mapping of orexigenic action and Fos-like immunoreactivity following relaxin-3 administration in male Wistar rats. Am. J. Physiol. Endocrinol. Metab. 292, E913–E919.
Miyakawa, T., Yamada, M., Duttaroy, A., and Wess, J. (2001). Hyperactivity and intact hippocampus-dependent learning in mice lacking the M1 muscarinic acetylcholine receptor. J. Neurosci. 21, 5239–5250.
Parada-Turska, J., and Turski, W. A. (1990). Excitatory amino acid antagonists and memory: effect of drugs acting at N-methyl-D-aspartate receptors in learning and memory tasks. Neuropharmacology 29, 1111–1116.
Reul, J. M., and Holsboer, F. (2002). Corticotropin-releasing factor receptors 1 and 2 in anxiety and depression. Curr. Opin. Pharmacol. 2, 23–33.
Risbrough, V. B., Hauger, R. L., Roberts, A. L., Vale, W. W., and Geyer, M. A. (2004). Corticotropin-releasing factor receptors CRF1 and CRF2 exert both additive and opposing influences on defensive startle behavior. J. Neurosci. 24, 6545–6552.
Rotzinger, S., Lovejoy, D. A., and Tan, L. A. (2010). Behavioral effects of neuropeptides in rodent models of depression and anxiety. Peptides 31, 736–756.
Sherwood, O. D. (1994). “Relaxin,” in The Physiology of Reproduction, eds E. Knobil and J. Neil (New York: Raven Press), 861–1009.
Smith, C. M., Lawrence, A. J., Sutton, S. W., and Gundlach, A. L. (2009). Behavioral phenotyping of mixed background (129S5:B6) relaxin-3 knockout mice. Ann. N. Y. Acad. Sci. 1160, 236–241.
Smith, C. M., Shen, P. J., Banerjee, A., Bonaventure, P., Ma, S., Bathgate, R. A., Sutton, S. W., and Gundlach, A. L. (2010). Distribution of relaxin-3 and RXFP3 within arousal, stress, affective, and cognitive circuits of mouse brain. J. Comp. Neurol. 518, 4016–4045.
Smith, G. W., Aubry, J. M., Dellu, F., Contarino, A., Bilezikjian, L. M., Gold, L. H., Chen, R., Marchuk, Y., Hauser, C., Bentley, C. A., Sawchenko, P. E., Koob, G. F., Vale, W., and Lee, K. F. (1998). Corticotropin releasing factor receptor 1-deficient mice display decreased anxiety, impaired stress response, and aberrant neuroendocrine development. Neuron 20, 1093–1102.
Stenzel-Poore, M. P., Heinrichs, S. C., Rivest, S., Koob, G. F., and Vale, W. W. (1994). Overproduction of corticotropin-releasing factor in transgenic mice: a genetic model of anxiogenic behavior. J. Neurosci. 14, 2579–2584.
Steru, L., Chermat, R., Thierry, B., and Simon, P. (1985). The tail suspension test: a new method for screening antidepressants in mice. Psychopharmacology (Berl.) 85, 367–370.
Sun, Y., Ahmed, S., and Smith, R. G. (2003). Deletion of ghrelin impairs neither growth nor appetite. Mol. Cell. Biol. 23, 7973–7981.
Sutherland, J. E., Burian, L. C., Covault, J., and Conti, L. H. (2010). The effect of restraint stress on prepulse inhibition and on corticotropin-releasing factor (CRF) and CRF receptor gene expression in Wistar-Kyoto and Brown Norway rats. Pharmacol. Biochem. Behav. 97, 227–238.
Sutton, S. W., Bonaventure, P., Kuei, C., Roland, B., Chen, J., Nepomuceno, D., Lovenberg, T. W., and Liu, C. (2004). Distribution of G-protein-coupled receptor (GPCR)135 binding sites and receptor mRNA in the rat brain suggests a role for relaxin-3 in neuroendocrine and sensory processing. Neuroendocrinology 80, 298–307.
Sutton, S. W., Shelton, J., Smith, C., Williams, J., Yun, S., Motley, T., Kuei, C., Bonaventure, P., Gundlach, A., Liu, C., and Lovenberg, T. (2009). Metabolic and neuroendocrine responses to RXFP3 modulation in the central nervous system. Ann. N. Y. Acad. Sci. 1160, 242–249.
Swanson, L. W., Sawchenko, P. E., Rivier, J., and Vale, W. W. (1983). Organization of ovine corticotropin-releasing factor immunoreactive cells and fibers in the rat brain: an immunohistochemical study. Neuroendocrinology 36, 165–186.
Takao, K., and Miyakawa, T. (2006). Light/dark transition test for mice. J. Vis. Exp. 104. Available at: http://www.jove.com/details.php?id=104
Takao, K., Tanda, K., Nakamura, K., Kasahara, J., Nakao, K., Katsuki, M., Nakanishi, K., Yamasaki, N., Toyama, K., Adachi, M., Umeda, M., Araki, T., Fukunaga, K., Kondo, H., Sakagami, H., and Miyakawa, T. (2010). Comprehensive behavioral analysis of calcium/calmodulin-dependent protein kinase IV knockout mice. PLoS ONE 5, e9460. doi: 10.1371/journal.pone.0009460
Tamada, K., Tomonaga, S., Hatanaka, F., Nakai, N., Takao, K., Miyakawa, T., Nakatani, J., and Takumi, T. (2010). Decreased exploratory activity in a mouse model of 15q duplication syndrome; implications for disturbance of serotonin signaling. PLoS ONE 5, e15126. doi: 10.1371/journal.pone.0015126
Tanaka, M., Iijima, N., Miyamoto, Y., Fukusumi, S., Itoh, Y., Ozawa, H., and Ibata, Y. (2005). Neurons expressing relaxin 3/INSL 7 in the nucleus incertus respond to stress. Eur. J. Neurosci. 21, 1659–1670.
Timpl, P., Spanagel, R., Sillaber, I., Kresse, A., Reul, J. M., Stalla, G. K., Blanquet, V., Steckler, T., Holsboer, F., and Wurst, W. (1998). Impaired stress response and reduced anxiety in mice lacking a functional corticotropin-releasing hormone receptor 1. Nat. Genet. 19, 162–166.
Watanabe, Y., Miyamoto, Y., Matsuda, T., and Tanaka, M. (2011). Relaxin-3/INSL7 regulates the stress-response system in the rat hypothalamus. J. Mol. Neurosci. 43, 169–174.
Wilkinson, T. N., Speed, T. P., Tregear, G. W., and Bathgate, R. A. (2005). Evolution of the relaxin-like peptide family. BMC Evol. Biol. 5, 14. doi: 10.1186/1471-2148-5-14
Yamasaki, N., Maekawa, M., Kobayashi, K., Kajii, Y., Maeda, J., Soma, M., Takao, K., Tanda, K., Ohira, K., Toyama, K., Kanzaki, K., Fukunaga, K., Sudo, Y., Ichinose, H., Ikeda, M., Iwata, N., Ozaki, N., Suzuki, H., Higuchi, M., Suhara, T., Yuasa, S., and Miyakawa, T. (2008). Alpha-CaMKII deficiency causes immature dentate gyrus, a novel candidate endophenotype of psychiatric disorders. Mol Brain 1, 6.
Keywords: relaxin-3, gene knockout, elevated plus maze, anxiety, mouse
Citation: Watanabe Y, Tsujimura A, Takao K, Nishi K, Ito Y, Yasuhara Y, Nakatomi Y, Yokoyama C, Fukui K, Miyakawa T and Tanaka M (2011) Relaxin-3-deficient mice showed slight alteration in anxiety-related behavior. Front. Behav. Neurosci. 5:50. doi: 10.3389/fnbeh.2011.00050
Received: 15 April 2011;
Accepted: 01 August 2011;
Published online: 17 August 2011.
Edited by:
Nuno Sousa, University of Minho, PortugalReviewed by:
Gernot Riedel, University of Aberdeen, UKJosé M. Pêgo, Universidade do Minho, Portugal
Copyright: © 2011 Watanabe, Tsujimura, Takao, Nishi, Ito, Yasuhara, Nakatomi, Yokoyama, Fukui, Miyakawa and Tanaka. This is an open-access article subject to a non-exclusive license between the authors and Frontiers Media SA, which permits use, distribution and reproduction in other forums, provided the original authors and source are credited and other Frontiers conditions are complied with.
*Correspondence: Masaki Tanaka, Department of Basic Geriatrics, Kyoto Prefectural University of Medicine, Kawaramachi-Hirokoji, Kamikyo-ku, Kyoto 602-8566, Japan. e-mail: mtanaka@koto.kpu-m.ac.jp