 Juan Sulca1,2*†Mathias Vuille3†Ken Takahashi1†Paul Roundy3†Bo Dong4†Victor Mayta5†Jose Tacza6†James Apaestegui1
- 1Instituto Geofisico del Perú, Lima, Peru
- 2Universidad Nacional de Ingeniería, Lima, Peru
- 3Department of Atmospheric and Environmental Sciences, University at Albany, State University of New York, Albany, NY, United States
- 4National Centre for Earth Observation, Department of Meteorology, University of Reading, Reading, United Kingdom
- 5Department of Atmospheric and Oceanic Sciences, University of Wisconsin–Madison, Madison, WI, United States
- 6Institute of Geophysics, Polish Academy of Sciences, Warsaw, Poland
Lowest events in Lake Titicaca’s water level (LTWL) significantly impact local ecosystems and the drinking water supply in Peru and Bolivia. However, the hydroclimatic mechanisms driving extreme lake-level lowstands remain poorly understood. To investigate these low lake-level events, we analyzed detrended monthly LTWL anomalies, sea surface temperature (SST) datasets covering the period 1921–2023. ERA5 reanalysis covers the period 1940–2023. A multiple linear regression model was developed to compute detrended LTWL anomalies, excluding multidecadal and residual components. Interdecadal Pacific Oscillation (IPO) and Pacific Decadal Oscillation (PDO) indices were also analyzed for the same period. Results indicate that 25% of all LTWL minima events have a short duration of <5 months, while the remaining 75% of all events have a long duration of more than 9 months, respectively. All long-lived LTWL minima events are associated with reduced moisture flow from the Amazon basin toward Lake Titicaca, but the large-scale forcing varies with the phase change of the decadal component in the 11–15 years band of the PDO (PDO11–15 years). Under warm PDO11–15 years phases, LTWL minima are driven by an enhanced South American low-level jet (SALLJ) caused by warm SST anomalies over the eastern Pacific Ocean. Warm SST anomalies over tropical North Atlantic and central Pacific cold events, which reinforce the cold PDO11–15 years phases, driving long-lived LTWL minima through the reduction of SALLJ. Conversely, long-lived LTWL minima events under neutral PDO11–15 years phases are caused by westerly flow anomalies confined to the Peruvian Altiplano. Therefore, PDO and IPO do not drive long-lived LTWL minima events because their relationship does not remain consistent over time. In conclusion, long-lived LTWL minima events exhibit a regional nature and are not driven by the PDO or IPO, as LTWL shows no consistent relationship with these decadal SST modes over time.
1 Introduction
The Lake Titicaca Basin (LTB) is situated in the Central Andes between 68° 33′ and 70° 01’W longitude and 15° 06′ and 16° 50’S latitude along the border between Peru and Bolivia, with an average altitude of 3,810 m (Figure 1a). Lake Titicaca covers an area of 8,500 km2 and is renowned as the world’s highest-elevation navigable lake. The availability of water from Lake Titicaca is crucial for local ecosystems, domestic use, and a variety of economic activities, including industry, fishing, agriculture, and tourism (Hastenrath and Kutzbach, 1985; Chura-Cruz et al., 2013; Villar et al., 2024).
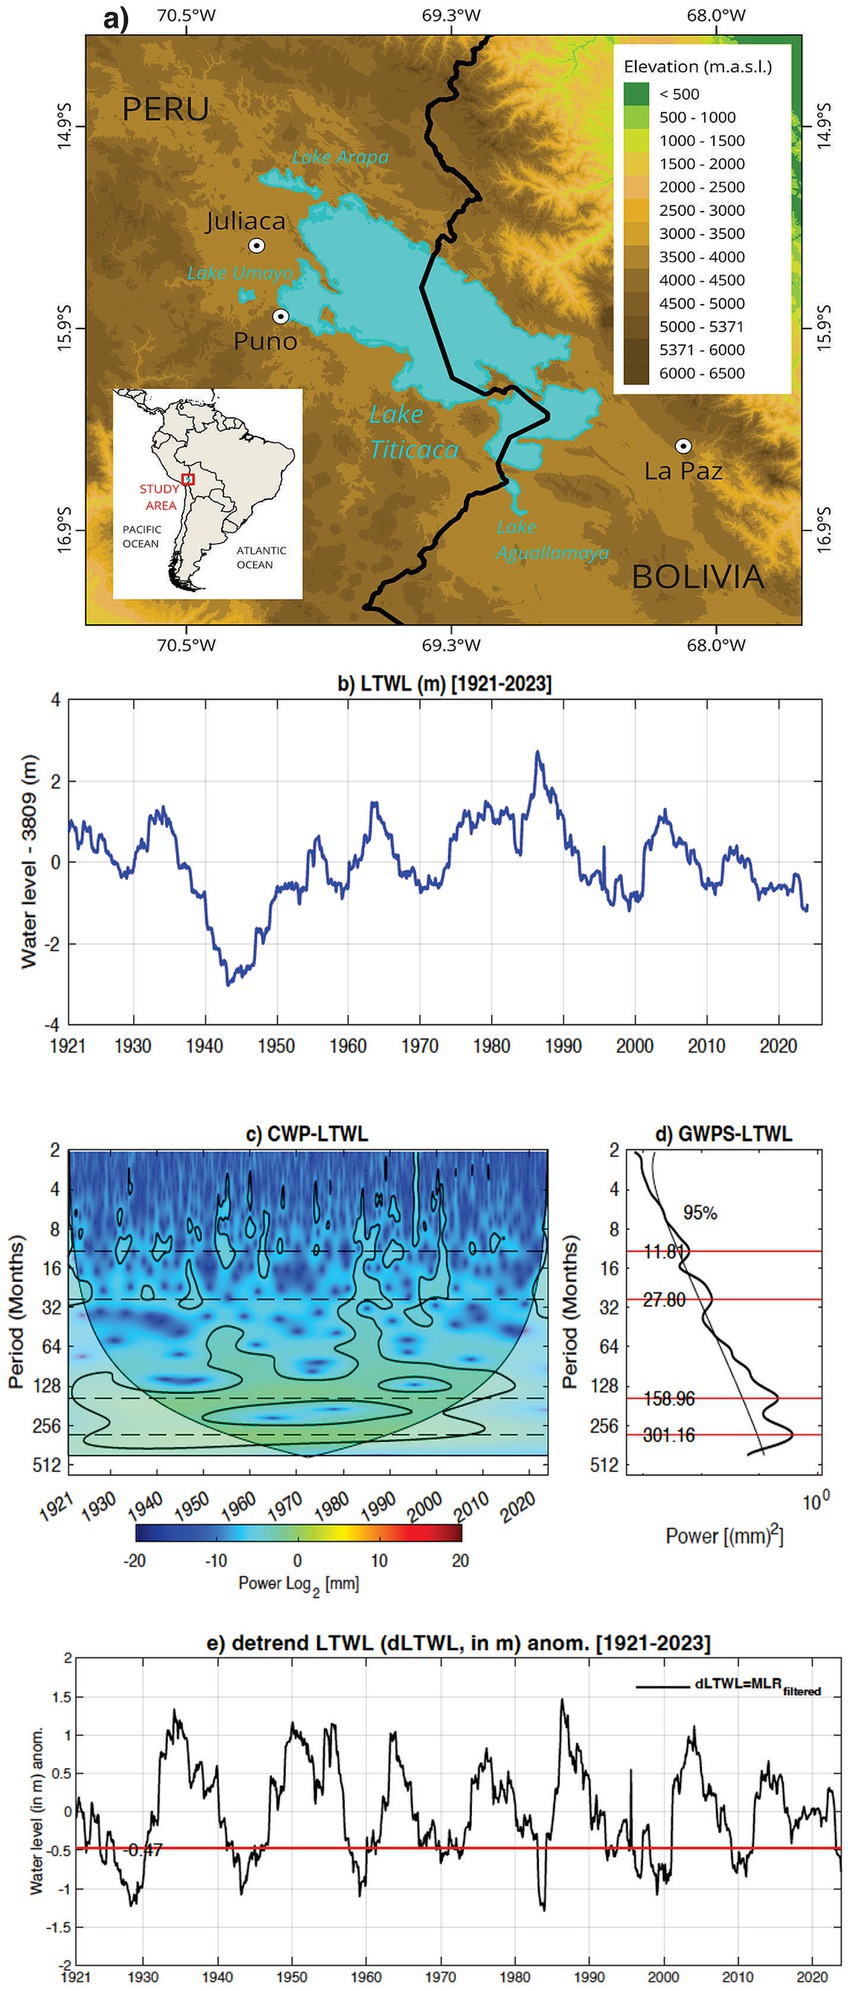
Figure 1. (a) Location of Lake Titicaca Adapted from Sulca et al. (2024). (b) The time series of monthly water levels in Lake Titicaca (LTWL, in m) Adapted from Sulca et al. (2024). (c) Continuous wavelet power spectrum of the detrended LTWL. The solid line indicates the 95% confidence interval assuming a red noise model suggested by Torrence and Compo (1998). (d) Profile of the global power spectrum of the detrended time series of the monthly anomalies of LTWL (in mm2). The red lines represent period peaks Adapted from Sulca et al. (2024). (e) Monthly time series of the detrended LTWL anomalies (dLTWL; in m) during the period 1921–2023. The red lines represent the value of 80% of the standard deviation of the original and filtered monthly time series of LTWL.
The precipitation in the Central Andes presents a rainy season from December to February of the following year, while the dry season occurs between June and August (Garreaud et al., 2003; Imfeld et al., 2019; Canedo-Rosso et al., 2019). Upper-level easterly flow induces a wet season in this region by entraining a lower-level moisture influx from the Amazon basin (Garreaud et al., 2003; Vuille and Keimig, 2004). However, the remote effect of anomalous deep convection over the northwestern Peruvian Amazon has led to a weakening of the negative linear relationship between Altiplano precipitation and 200-hPa zonal wind since 2000 (Segura et al., 2020). In the lower troposphere, the change in direction of the South American low-level jet (SALLJ, Jones, 2019; Montini et al., 2019; Gelbrecht et al., 2021), which transports humidity from the Amazon basin to the subtropics along the eastern flank of the Andes mountains, affects the depth of the water level in Lake Titicaca by modulating the intensity of the humidity flux from the east (Sulca et al., 2024). The intrusion of extratropical Rossby wave trains into South America and along the coast of Brazil can change the intensity and direction of the SALLJ (Montini et al., 2019; Jones et al., 2023).
The atmospheric circulation over the Altiplano is known to be linked to sea surface temperature (SST) patterns in the Pacific and Atlantic Oceans varying on both high- and low-frequency temporal scales (Mantua et al., 1997; Zhang and Levitus, 1997; Trenberth et al., 1998; Dong and Dai, 2016; Dong et al., 2018). High-frequency SST variability primarily consists of biennial and interannual components, while low-frequency SST variability includes decadal, interdecadal, and multidecadal components. The El Niño-Southern Oscillation (ENSO) primarily drives high-frequency, interannual temperature and precipitation variability in the tropics (Trenberth et al., 1998). Tropical Pacific SST oscillate between a warm and cold phase known as El Niño and La Niña, respectively. The oscillation period varies between 2 and 7 years, showing biennial (2–3 year) and low-frequency (3–7 year) components. From February 2023 to January 2024, El Niño conditions prevailed across the entire Pacific basin, including the emergence of a coastal El Niño in February 2023 (IGP, 2023a) and El Niño conditions in the Niño 3.4 region in May 2023 (IGP, 2023b; CPC, 2024). The main modes representing SST anomalies on decadal to multidecadal timescales are known as the Pacific Decadal Oscillation (PDO, Mantua et al., 1997), the Interdecadal Pacific Oscillation (IPO, Zhang and Levitus, 1997; Dai, 2013; Dong and Dai, 2016), and the Atlantic Multidecadal Oscillation (AMO, Knight et al., 2006). Deser et al. (2004) observed that the PDO and IPO exhibit similar interdecadal variability. The PDO typically oscillates over a period of 20–30 years, while the AMO’s cycle spans 50–70 years.
Several studies have quantified the contribution of the precipitation and evaporation to the water level in Lake Titicaca using a water balance analysis over different timescales (Delclaux et al., 2007; Pillco-Zolá et al., 2019; Lima-Quispe et al., 2021; Guédron et al., 2023; Lima-Quispe et al., 2025). Climatologically, the LTWL follows a well-defined annual distribution, with the maximum water levels occurring between March and May and minimum levels between November and January (Sulca et al., 2024). The authors also noted that the LTWL lags the annual precipitation cycle in the Bolivian Altiplano (December–February) by 3 months. Lima-Quispe et al. (2021) reported that 80% of the fluctuations in the water level in Lake Titicaca are attributed to natural climate variability. Lima-Quispe et al. (2025) recently found that Lake Titicaca’s water level is primarily driven by precipitation (744 mm year−1) and evaporation (1,616 mm year−1), while snow and ice processes, and net irrigation withdrawals have a minimal impact on its variations. Regarding lake evaporation, Delclaux et al. (2007) identified a well-defined evaporation annual cycle, with maximum evaporation in January and a minimum in August. The authors also found that annual evaporation causes 90% of lake output, ranging from 1,350 to 1900 mm year−1 between 1965 and 1983. Using a simulated water balance, Lima-Quispe et al. (2025) recently estimated annual evaporation at 1616 mm yr.−1, with monthly values of 170 mm yr.−1 in January and 95 mm yr.−1 in August for the period 1982–2016.
The Lake Titicaca water level (LTWL) exhibits variability on multiple timescales, including semiannual, annual, biennial, decadal, interdecadal, and multidecadal modes (Alburqueque et al., 2018; Angulo and Pereira-Filho, 2022; Sulca et al., 2024). Sulca et al. (2024) documented that the LTWL exhibits variability on various timescales: biennial (22–27 months), interannual (80–108 months), decadal (13–14 years), interdecadal (25–27 years), and multidecadal (30–65 years). Furthermore, Angulo and Pereira-Filho (2023) reported a negative correlation between LTWL and the IPO, while Sulca et al. (2024) observed a negative correlation with the PDO. However, Angulo and Pereira-Filho (2022) observed that the simultaneous warm phases of ENSO and PDO induced drought conditions in the Lake Titicaca basin. This is consistent with a reduction in precipitation over the Bolivian Altiplano due to the combined effect of the warm phases of PDO and El Niño, which drive the northward displacement of the Bolivian high during the DJF season (Rojas-Murillo et al., 2022). These findings align with the decrease in summer precipitation over the Altiplano region during the concurrent presence of the IPO warm phase and El Niño (Dong et al., 2018; Canedo-Rosso et al., 2021; Sulca et al., 2022b). Sulca et al. (2024) identified a significant negative linear relationship between LTWL and the AMO from 1921 to 2018. However, none of these studies have directly established a dynamic link between LTWL minima and ENSO, PDO, IPO, and AMO.
Limited research has been conducted on mechanisms that lead to LTWL extremes. Ronchail et al. (2014) observed an approximately 5-meter range of extreme LTWL variations between 1915 and 2009, from an absolute minimum of 3806.7 meters in 1944 to a high-stand of 3811.6 meters in 1986 (see Figure 1b). Sztorch et al. (1989) reported that heavy precipitation in 1985/86 resulted in the highest LTWL, significantly impacting the local population. Sulca et al. (2024) reported that the LTWL exhibited a multidecadal regime from 1921 to 1990 and transitioned to a decadal-interdecadal regime thereafter. Additionally, SENAMHI (2023) reported a progressive reduction in water levels since September 2022 due to drought conditions across the entire Altiplano region. This reduction persisted until November 2023, marking a new extreme LTWL minimum (SENAMHI, 2024). Gutierrez-Villareal et al. (2024) pointed out that 2022–23 drought conditions in the Altiplano region were caused by the intrusion of a cold and dry air mass originating over the subtropical South Atlantic. The authors suggested that the 2022–23 drought in the Altiplano region was caused by concurrent La Niña conditions through subtropical teleconnections. However, the authors used a short time series of 30 years, which is not capable of evaluating the role of longer-term climate modes, such as the PDO. Here we assess the relationship between LTWL minima events and long-term climate modes above 10 years using a much longer record of 103 years.
Numerous dynamical and statistical downscaling studies have projected that drought conditions in the Lake Titicaca basin are likely to increase in frequency, duration, and intensity by the mid-21st century (Urrutia and Vuille, 2009; Minvielle and Garreaud, 2011; Vera et al., 2019; Zubieta et al., 2021; Sulca and Da Rocha, 2021; Alonso et al., 2022; Morales et al., 2023). Morales et al. (2023) identified an increase in the drought conditions over the northern South American Altiplano since the mid-1970s, based on 389 years of reconstructed precipitation data. The authors also highlighted that the last 17 years of the period 1970–2013 stands out as the driest in their 389 years of reconstructed precipitation data. Other studies, however, have come to different conclusions, finding no evidence for a recent precipitation decline (e.g., Segura et al., 2020). Nonetheless, it is crucial to better characterize the most severe reductions seen in the Lake Titicaca water level to mitigate the impacts of future drought conditions in this region by enabling their long-range prediction and thereby improving water resources management.
In consideration of these aspects, this study aims to (a) describe the climatological characteristics of LTWL fluctuations, (b) to document the connection between low-frequency climate modes (PDO and IPO) and LTWL minima, and (c) assess the global SST and upper-level atmospheric circulation anomalies associated with Lake Titicaca’s water level minima. These new findings will be used to monitoring and to develop prediction models that forecast Lake Titicaca’s water level minima and help mitigate future adverse effects on water resources, such as droughts and related climate change impacts.
2 Data and methods
2.1 Data
Monthly data of the water level of Lake Titicaca (LTWL, in m) from the Peruvian National Service of Meteorology and Hydrology (SENAMHI, 2021) for the 1921–2023 period were used in this study. The record 1921–2023 was selected to achieve the same temporal window as for the SST observations, which are of good quality in the tropical Pacific after 1921 (Dong and Dai, 2016).
The European Reanalysis version 5 (ERA5, Hersbach et al., 2020) monthly mean data of divergence (DIV, kg m−2 s−1) and vertically integrated humidity transport (VIHT, kg m−1 s−1) were obtained from the European Center for Medium-Range Weather Forecasts (ECMWF). We compute VIHT using Equation 1:
Where g is the acceleration due to gravity (10 m s−2), q is specific humidity (kg kg−1), p is pressure and Vh is the horizontal wind. The ERA5 reanalysis presents a horizontal grid of 0.25° × 0.25° and covers the 1940–2023 period. We chose ERA5 reanalysis because it performs better over the Andes than the Japanese 55-year MERRA2 and the NCEP/NCAR reanalysis (Birkel et al., 2022).
Monthly SST data from HadISST v1.1 from the Met Office Hadley Centre (Rayner et al., 2003) were used. The resolution of the HadISST data is 1° x 1° and covers the 1921–2023 period.
The National Oceanic and Atmospheric Administration-Physical Sciences Laboratory (NOAA-PSL) provided the nonfiltered monthly time series of the AMO index (Enfield et al., 2001). The AMO index is computed as the time series of the area-weighted average of SSTs over the North Atlantic (0–70°N). The AMO index covers the period 1921–2022 and can be downloaded from https://psl.noaa.gov/data/correlation/amon.us.long.data.
The Pacific Decadal Oscillation (PDO) index was obtained from the Tokyo Climate Center.1 The PDO index represents the monthly time series of the principal component of the first empirical orthogonal function (EOF) of North Pacific SST anomalies north of 20°N. The monthly time series of the PDO covers the period 1921–2023.
The IPO index was obtained following the methodology described by Dong and Dai (2016). Dong and Dai (2016) calculated a 3-year moving average of global SST prior to performing an EOF analysis of the SST data for the period 1921–2023. Two consecutive 9-year moving average filters were applied on the second principal component time series, which represents the IPO.
2.2 The multiple linear regression (MLR) model
We developed a multiple linear regression (MLR) model using the iterative reweighted least squares method (Beaton and Tukey, 1974; DuMouchel and O’Brien, 1989) to reconstruct monthly anomalies of LTWL following the methodology proposed by Sulca et al. (2022a, 2024). The MLR predictors correspond to the principal modes of LTWL, which are mutually uncorrelated and identified using the robust empirical mode decomposition (REMD) technique (Liu et al., 2022; Liu, 2024). The REMD technique is an effective tool for identifying dominant oscillation modes in the water level (Heddam et al., 2024).
The MLR model represented by Equation 2:
Where Y (t) represents the target variable (LTWL, Figure 1b) that varies with time t; X (t) represents the time series of the predictors (LTWL modes); and an and b represent the least-squares regression parameters (slope and intercept of each predictor of the multiple linear regression model and the regression coefficients, respectively). The local regression parameters are estimated by minimizing the model error ε. The calibration and validation periods for the MLR models were 1921–2010 and 2011–2023, respectively. The MLR models were tested using the F-test at a 95% confidence level (Wilks, 2011).
2.3 Methods
We propose a method to calculate detrended monthly anomalies of LTWL, referred to hereafter as dLTWL. Since the goal of this method is to identify the primary drivers of the long-term LTWL minima events occurring on timescales shorter than 30 years, we removed the long-term components of the monthly LTWL time series, including the multidecadal and residual components. The AMO influences the multidecadal component of LTWL as they have been shown to be negatively correlated (Sulca et al., 2024). The residual component of LTWL can be removed because it represents the trend of the original time series. To exclude the multidecadal and residual components of LTWL, we set the regression coefficients for the multidecadal and residual modes to zero in the MLR model (denoted as LTWLfiltered). Finally, we removed the linear trend from the monthly LTWL time series after filtering. The technical details are shown in Supplementary material.
We defined LTWL minima events as periods when dLTWL falls below 80% of its standard deviation of the monthly anomaly time series. As this study focuses on LTWL minima events with long duration, we defined long-lived LTWL minima events as those lasting nine or more consecutive months. This definition allows us to identify more LTWL minima events compared to using only the threshold of the standard deviation of observed monthly LTWL anomalies. Since this study focuses on LTWL minima events with long durations (> 9 months duration), we will not discuss these short-lived LTWL minima events in this study.
We applied a superposed epoch analysis to describe changes in the values of the detrended LTWL before and after the peak of long-term LTWL minima events.
The continuous wavelet transform (CWT) technique is a robust technique for identifying principal oscillation modes in SST anomalies (Dewitte et al., 2011; Illig et al., 2014), precipitation anomalies (Labat et al., 2005, 2012; Mortensen et al., 2018; Sulca et al., 2022a, 2024), and water level variations in Lake Titicaca (Angulo and Pereira-Filho, 2022). The confidence level of the power spectrum profile is based on the red noise model, as suggested in Torrence and Compo (1998). We applied a bandpass-filter of 11–15 years to extract the decadal component of the PDO index (hereafter PDO11-15-years). This bandpass-filter is based on the Morlet wavelet (Torrence and Compo, 1998). We did not analyze the interdecadal component of the PDO index because it is similar to the IPO index (Deser et al., 2004; Dong and Dai, 2016). Similarly, we extracted the decadal component of the global SST anomalies and divergence and vertically integrated humidity transport filtering the 11-15-years band of the monthly SST anomalies (hereafter dSST, dDIV, and dVIHT).
A composite analysis for the patterns of the global dSST and dDIV and dVIHT anomalies over South America during long-lived LTWL minima events under warm and cold phases of the PDO11–15 years was performed. In contrast, unfiltered global SST, DIV and VIHT anomalies are utilized for long-lived LTWL minima events under neutral phases of the PDO11–15 years. The statistical significance is based on a two-tailed Student’s t-test at a 90% confidence level (Wilks, 2011).
3 Results
3.1 Climatological characteristics of the LTWL minima events
Using the detrended monthly anomalies of LTWL from 1921 to 2023 (Figure 1e), we identified 16 LTWL minima (Table 1). Figure 2a shows that 18.75, 6.25, and 75% of all LTWL minima have a duration that varies in range from 1 to 2 months, 3 to 4 months, and more than 9 months, respectively. Long-lived LTWL minima have an average duration of 26.3 months. Hence a long-term, persistent change in the large-scale circulation over South America is required to cause these long-lived LTWL minima. On average, these events are characterized by a decrease in water level from −0.2 m in month −19, to an average minimum of −0.65 m in month +3, followed by a recovery from month +4 to month +24 (Figure 2b).
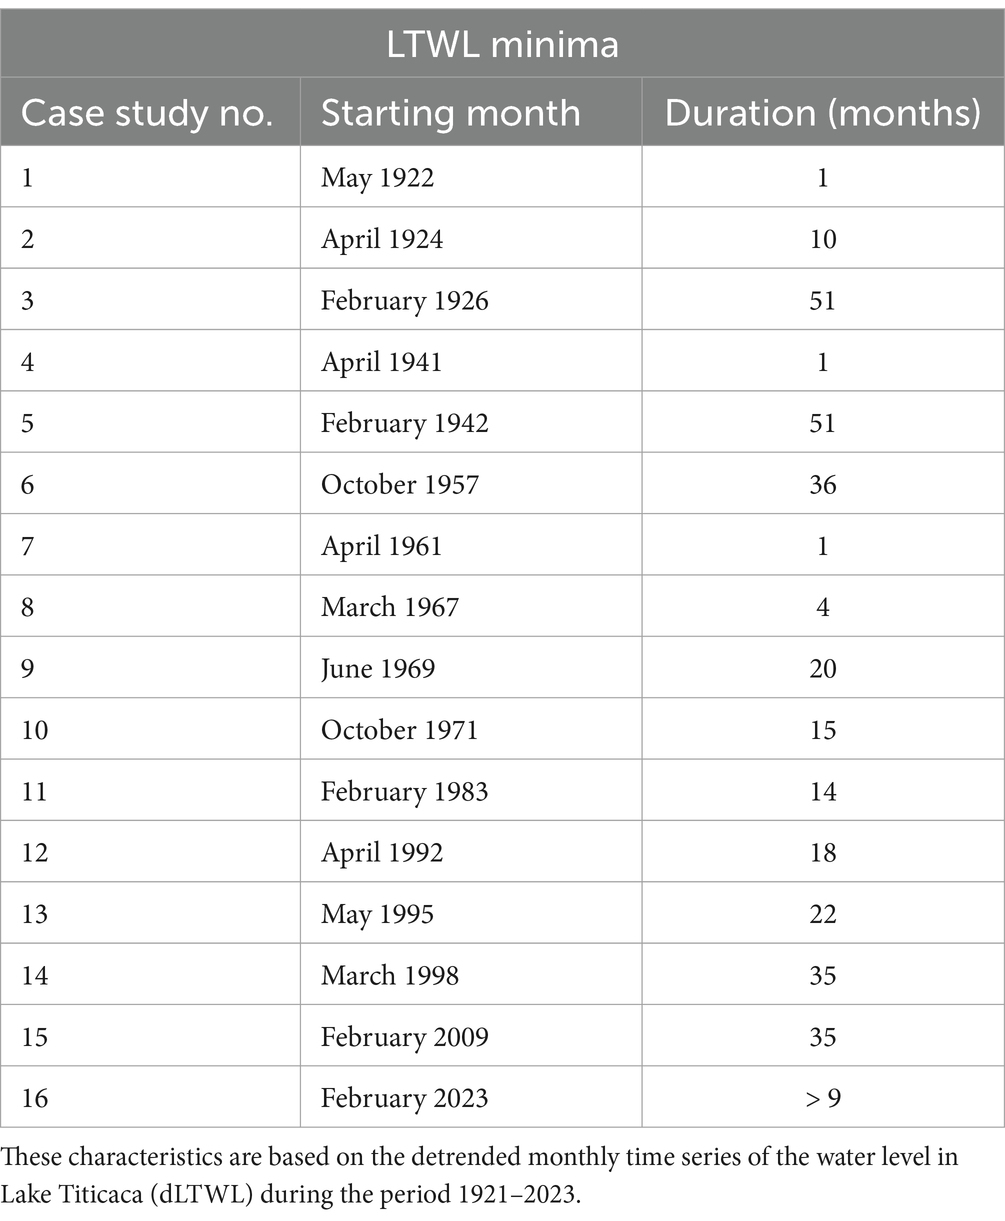
Table 1. List of case studies, their onset date, and the total number of months.
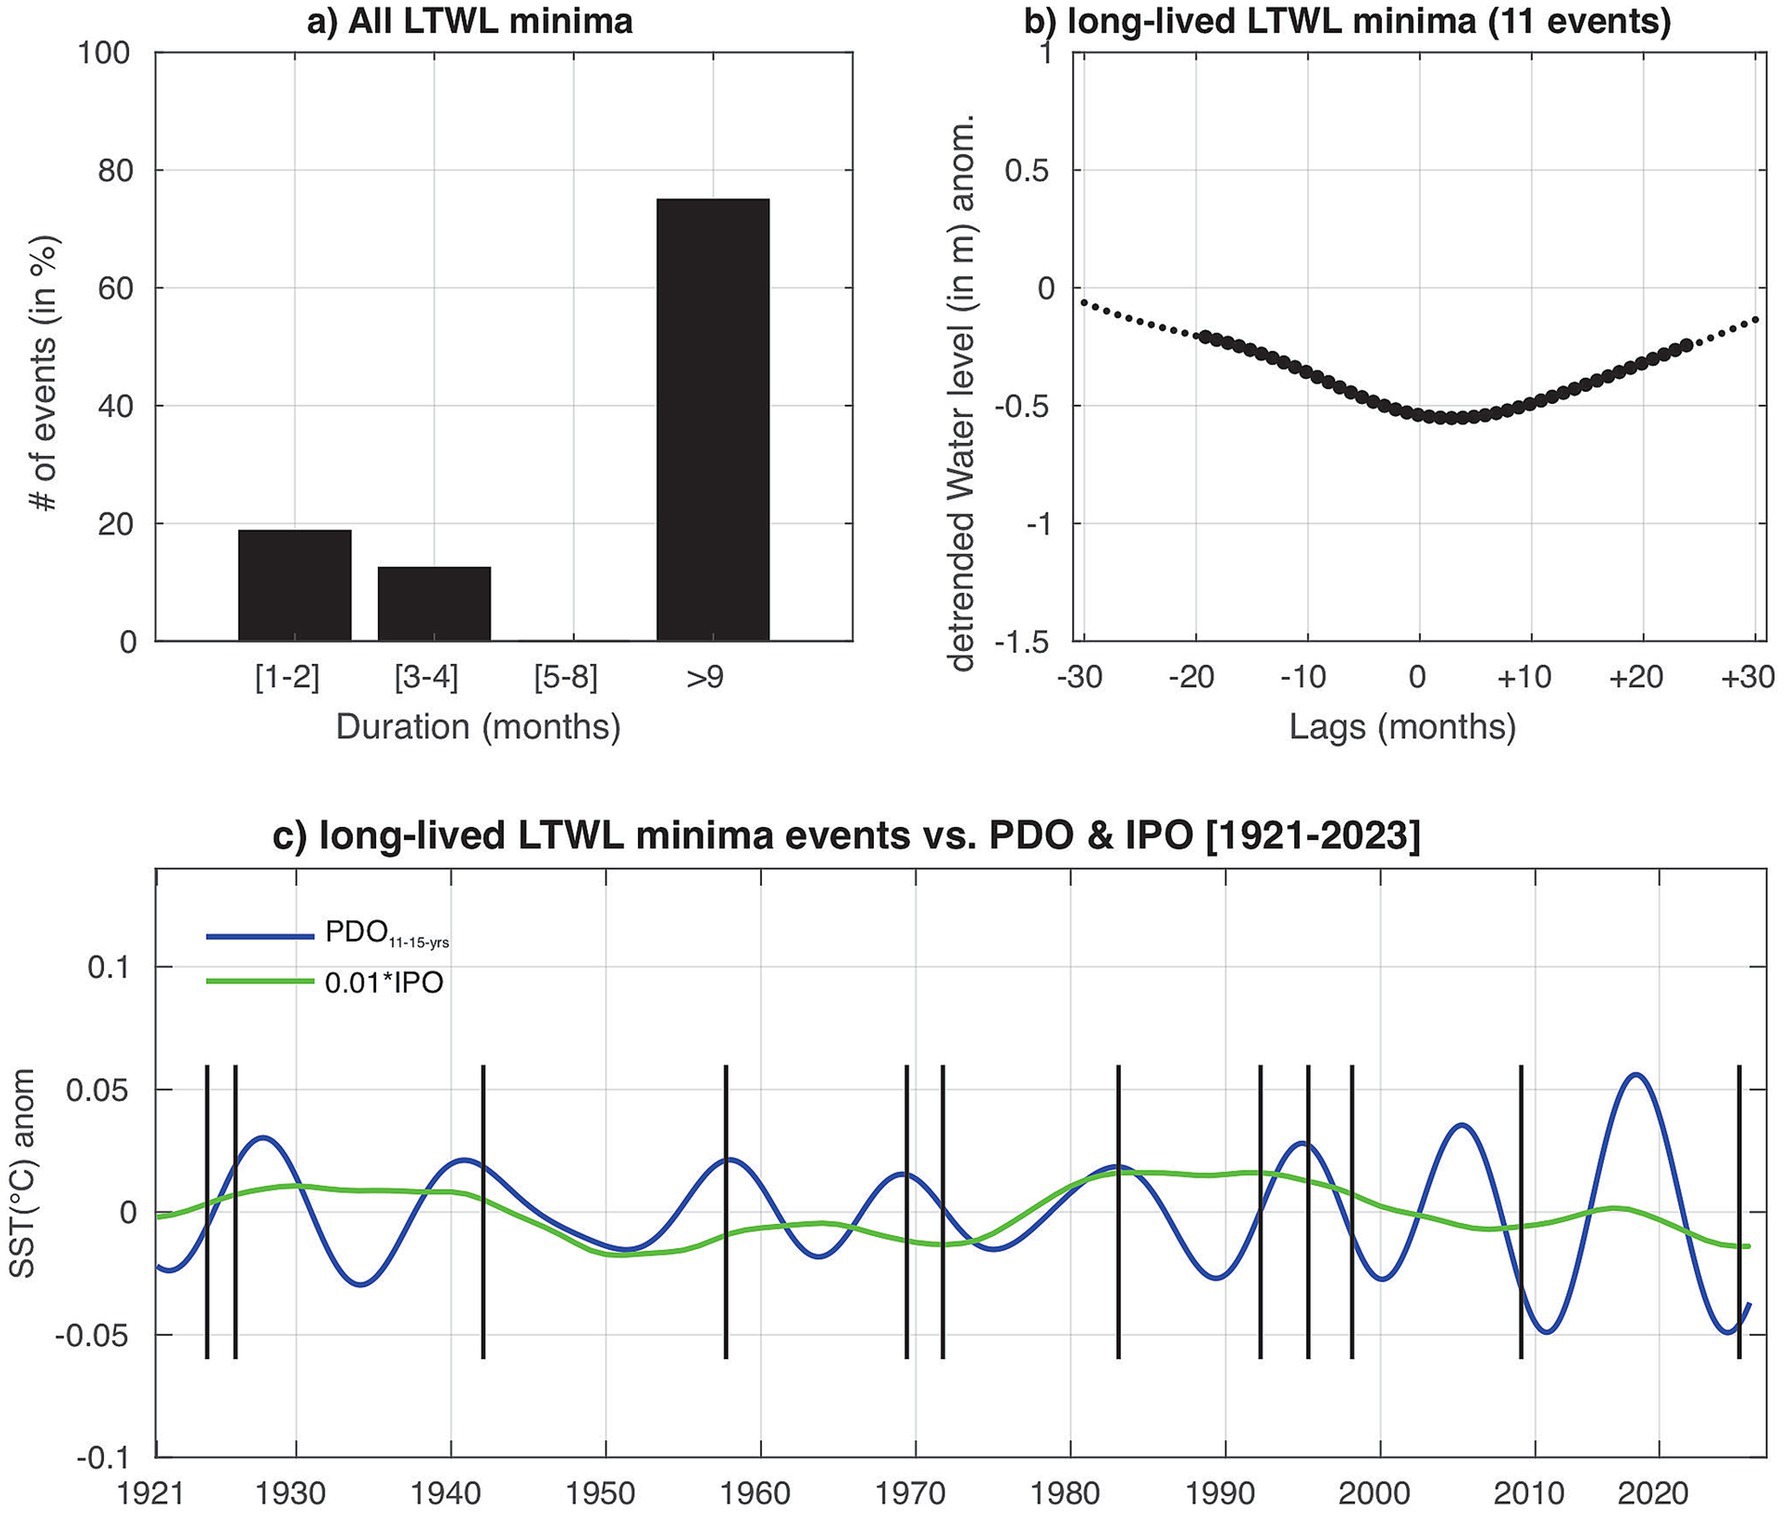
Figure 2. (a) Histogram of the number of events (in %) with respect to the duration (in months) of the LTWL minima. (b) Superposed epoch analysis applied to detrended monthly water level anomalies in Lake Titicaca (dLTWL, in m) for the long-lived LTWL minima events. The black circles represent months statistically significant from zero at the 95%-confidence level based on the Student’s t-test. (c) Monthly time series of the decadal component (11–15-years) of the Pacific Decadal Oscillation (PDO, blue line) and the Interdecadal Pacific Oscillation (IPO, green line). The black vertical lines represent the initiation (e.g., month zero) of the water level minima in Lake Titicaca (LTWL minima) with a duration above nine consecutive months (April 1924, February 1926, February 1942, October 1957, June 1969, October 1971, February 1983, April 1992, May 1995, March 1998, February 2009 and February 2023). The IPO index was rescaled by a factor of 0.01. The analysis is based on the period 1921–2023.
Since many LTWL minima persist for more than 9 consecutive months, we assess the connection between long-lived LTWL minima and the PDO11–15 years and IPO during the period 1921–2023. Figure 2c illustrates the phases of the PDO11–15 years and the IPO for the onset month of each LTWL minima episode, covering the period from 1921 to 2023. The warm, cold, and neutral phases of the IPO represent 40, 40, and 20% of all LTWL minima events, respectively (Table 2), showing that IPO does not favor or prevent LTWL minima events. According to Table 2, warm PDO11–15 years phases represent 50% of all LTWL minima events between 1921 and 2000, while cold PDO phases account for 30% of these events after 2001. This suggests that the positive phase of the PDO11–15 years may favor long-lived LTWL minima events, consistent with prior research (Garreaud et al., 2009; Flantua et al., 2016). In addition, Figure 2c shows an increase in the amplitude of the PDO11–15 years in the mid-2010’s and late in 2022. The increase in the amplitude of the negative phase of the PDO11–15 years around mid-2010 is caused by strong cold anomalies in the Niño region (e.g., strong La Niña conditions), which persisted from mid-2010 to April 2012 (CPC, 2024). The increase in the amplitude of the negative phase of the PDO11–15 years in 2022–23 is due to the triple-dip Las Niñas 2020–2023 (Jiang et al., 2023; Li et al., 2023; Iwakiri et al., 2023).
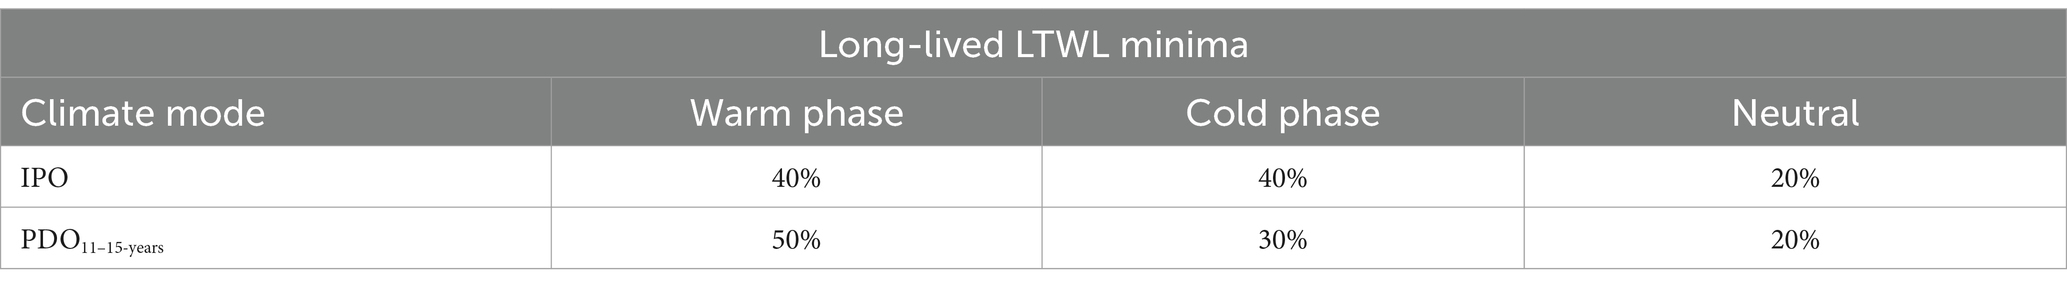
Table 2. Percentage of the detrended Lake Titicaca water level events (dLTWL, in m) that start during the warm, cold and neutral phases of the interdecadal Pacific Oscillation (IPO, in °C) and the decadal component (11–15-years band) of the Pacific Decadal Oscillation (PDO11–15-years, in °C) index during the period 1921–2013.
3.2 Circulation patterns associated with the different types of long-lived LTWL minima events
LTWL minima occur during the neutral, positive and negative phases of the PDO11–15 years. We analyzed filtered anomalies of the VIHT and divergence over South America to describe the atmospheric circulation patterns associated with the warm and cold phases of the PDO11–15 years. In contrast, unfiltered anomalies of VIHT and divergence over South America were analyzed to describe circulation patterns associated with long-term LTWL minima during neutral phases of PDO11–15 years.
During positive phases of the PDO11–15 years, long-term LTWL minima are associated with positive divergence anomalies over the Altiplano region (Figure 3a), implying dry conditions, consistent with the long-term LTWL minima. Figure 3a also highlights significant convergence anomalies over the Peruvian Amazon and northeasterly VIHT anomalies originating in the tropical North Atlantic. This suggests strengthened moisture transport from the Amazon basin to the midlatitudes but no upward moisture flow from the east to the Altiplano region. These findings suggest that warm phases of the PDO11–15 years induce long-term LTWL minima by inhibiting moisture transport from the lowlands. In addition, these long-term LTWL minima are correlated with significant warm SST anomalies over the eastern Pacific and western North Atlantic oceans on decadal timescales within the 11–15 years band (Figure 3b). These findings are consistent with previous studies showing that warm SST anomalies over the eastern Pacific Ocean and western North Atlantic oceans reduce water levels in Lake Titicaca on decadal timescales (13–14 years) (Sulca et al., 2024).
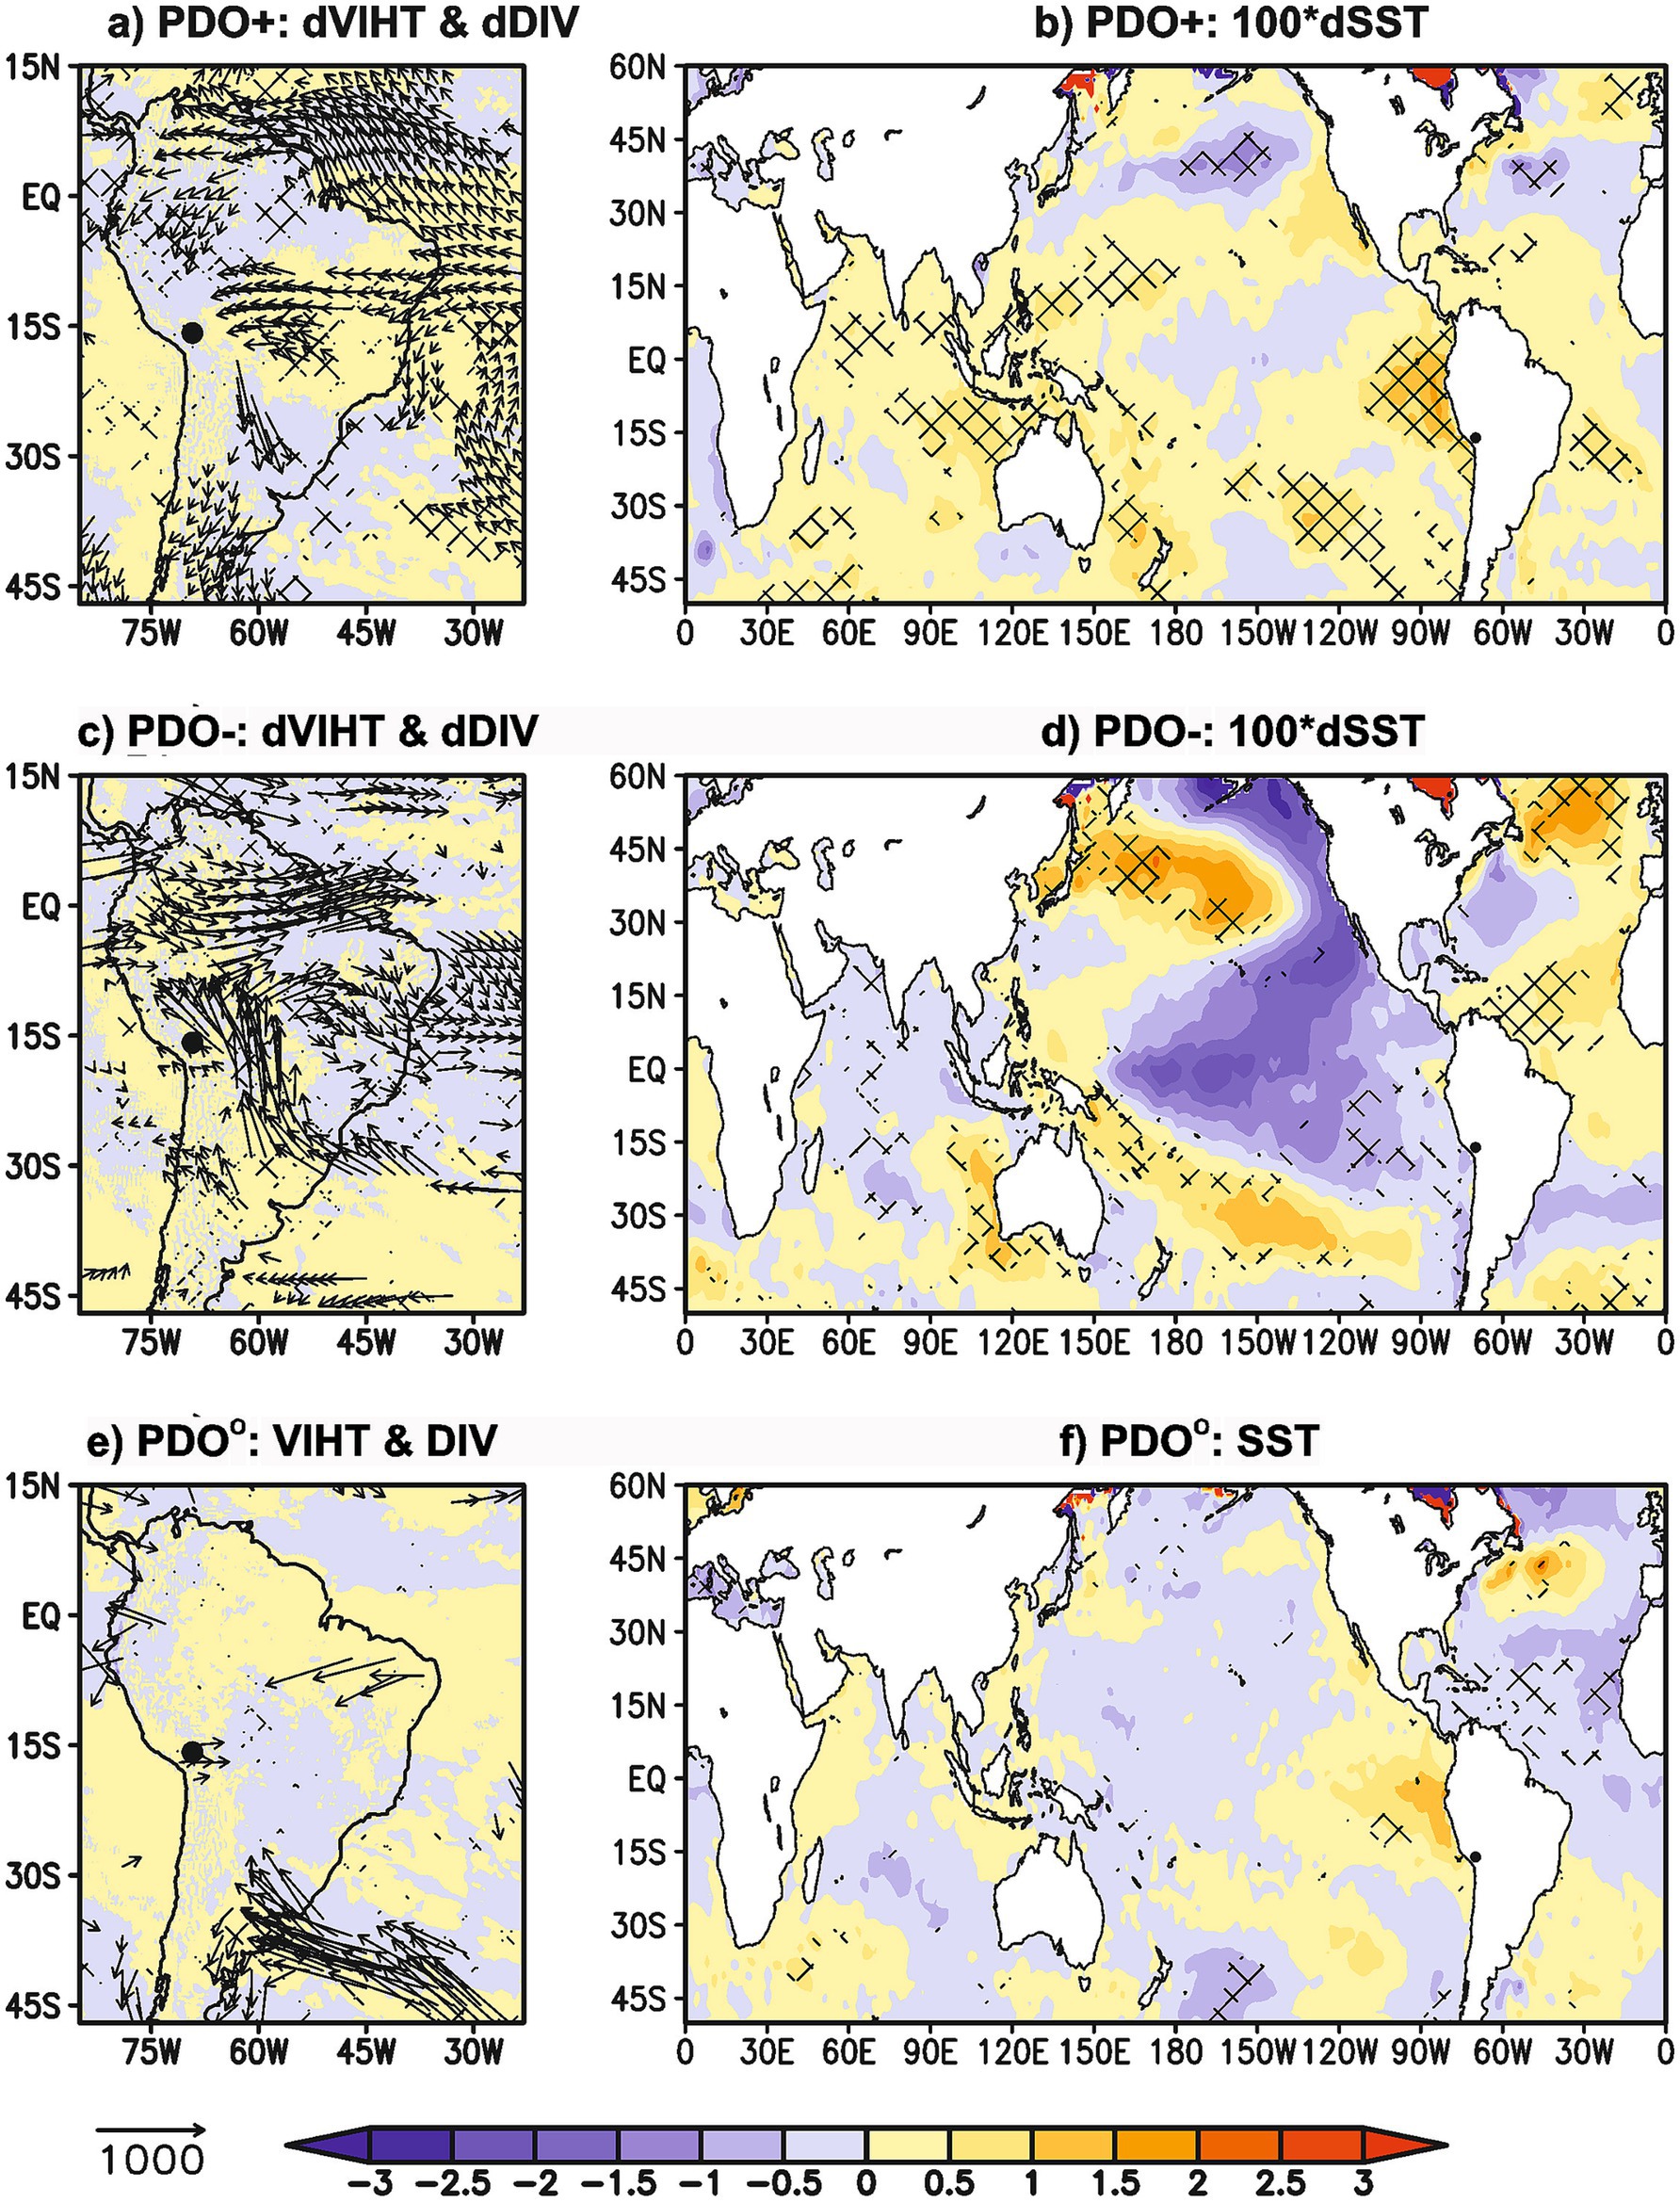
Figure 3. Composite of the decadal component in the 11–15-year band of the (a) vertically integrated humidity transport (dVIHT, kg m−1 s−1) and divergence (dDIV, kg m−1 s−2) anomalies during the long-lived events of water level minima in Lake Titicaca under the warm phase of the 11-15-year band of the PDO index (PDO+) during the period 1921–2023. (c) As in (a) but for cold phase of the 11-15-year band of the PDO index (PDO−). (e) Composite of the vertically integrated humidity transport (VIHT, kg m−1 s−1) anomalies during the long-lived events of water level minima in Lake Titicaca under neutral phases of the 11–15-year band of the PDO (PDOO) during the period 1921–2023. The black circle represents the location of Lake Titicaca. The black vectors represent nonfiltered and filtered VIHT anomalies that are statistically significant at the 90% confidence level. The divergence anomalies were rescaled by a factor of 5*104. Hatching areas represent nonfiltered and filtered divergence anomalies that are statistically significant at the 90% confidence level. The analysis is based on ERA5 reanalysis. (b) SST anomaly composite for the decadal component in the 11-15-year band (dSST, in °C) during the long-lived events of water level minima in Lake Titicaca under the warm phase of the 11-15-year band of the PDO index (PDO+) during the period 1921–2023. (d) As in (b) but for cold phase of the 11–15-year band of the PDO index (PDO−). (f) Composite for the global SST (in °C) anomalies during the long-lived events of water level minima in Lake Titicaca under the neutral phase of the 11–15-year band of the PDO index (PDOO). The dSST anomalies were rescaled by a factor of 100. Hatching areas represent nonfiltered and filtered SST anomalies that are statistically significant at the 90% confidence level.
During negative phases of the PDO11–15 years, long-term LTWL minima are linked to positive divergence anomalies and southeasterly VIHT anomalies over the Altiplano region (Figure 3c), resulting in dry conditions. These conditions result from the weakening of the SALLJ. Figure 3c also depicts significant westerly VIHT anomalies and convergence anomalies over the eastern tropical Amazon and tropical South Atlantic, showing the weakening of trade winds limiting moisture availability in the eastern part of the continent. These results indicate that extreme cold phases of the PDO11–15 years can lead to long-term LTWL minima by reducing moisture over the Altiplano region. Notably, these extreme cold phases of the PDO11–15 years are associated with extreme central-Pacific cooling events (Figure 3d). In addition, Figure 3d also shows that these long-term LTWL minima events are linked to a significant SST anomaly dipole in the southwestern South Pacific Ocean, suggesting a northeastward displacement of the SPCZ. Warm SST anomalies dominate the western tropical North Atlantic, leading to westerly VIHT anomalies that reduce humidity flow from the Atlantic Ocean to South America on decadal timescales within the 11–14 years band (Sulca et al., 2024). These westerly VIHT anomalies over the eastern and central equatorial Amazon basin weaken the SALLJ.
During neutral PDO11–15 years phases, long-term LTWL minima are associated with positive divergence anomalies and westerly VIHT anomalies confined locally over the Peruvian Altiplano (Figure 3e), suggesting that the regionally dry conditions are causing the reduction of the water level in Lake Titicaca. However, there are no significant VIHT or divergence anomalies along the eastern flank of the Andes Mountains, suggesting that these long-term LTWL minima are primarily caused by westerly flow anomalies over the Peruvian Altiplano. In addition, Figure 3f exhibits that these long-term LTWL minima are associated with weak warm SST anomalies over eastern Pacific Ocean and the Peruvian coast, with strongest values in the far-eastern Pacific Ocean and near the Peruvian coast. This suggests that eastern El Niño-like conditions may contribute to long-term LTWL minima by weakening the upper-level easterly flow over the Peruvian Altiplano (Sulca et al., 2018).
4 Discussion and conclusions
In this paper, we documented the low-frequency atmospheric dynamics associated with water level minima in Lake Titicaca during the period 1921–2023, performing composite and superposed epoch analyses using monthly time series of Lake Titicaca water level (LTWL) and the global SST, divergence (DIV) and vertically integrated humidity transport (VIHT) anomalies over South American continent from the ERA5 reanalysis.
The multiple linear regression model shows that monthly LTWL anomalies can be explained as a linear combination of their principal modes. The result enables us to propose a new method for calculating detrended LTWL anomalies by removing the multidecadal and residual components of LTWL (Figure 1b). This new criterion enabled the identification of May 1922, November 1924, June 1927, February 1959, April 1961, January 1970, July 1972, December 1983, June 1992 and November 2009 as months marking the peak of LTWL minima, in contrast to relying solely on the traditional threshold based on the standard deviation of observed LTWL (Figure 1a).
We identified 16 LTWL minima based on detrended LTWL anomalies during the period 1921–2023. 25% of all LTWL minima events have a duration of 4 months or less, indicating that short-term changes in the large-scale atmospheric circulation cause these extreme events. Conversely, 75% of all LTWL minima events are long-lived, with an average duration of 26.33 months. This suggests that these extreme events are driven by long-term changes in global SST anomalies and large-scale atmospheric circulation. All long-lived LTWL minima events result from a weakened moisture flux from the Amazon basin to Lake Titicaca, though large-scale drivers primarily vary with the season and the phase of the decadal component in the 11-15-year band of the PDO (PDO11–15 years) index. Prior to the year 2000, long-lived LTWL events were associated with warm phases of the PDO11–15 years, coupled with warm SST anomalies over the tropical North Atlantic and the eastern Pacific Ocean, and an enhanced SALLJ, reducing moisture flux from the Amazon basin to the Lake Titicaca basin, ultimately leading to an extreme reduction in the lake’s water level. After 2001, long-lived LTWL events appear to be linked to cold phases of the PDO11–15 years, coupled with cold SST anomalies over the western and central equatorial Pacific Ocean, which have recently been prolonged by a period of strong La Niña conditions (Jiang et al., 2023; Li et al., 2023; Iwakiri et al., 2023). In contrast, long-lived LTWL events during neutral PDO11–15 years phases are primarily caused by a weakened moisture flux from the east induced by prevailing westerly VIHT anomalies localized over the Peruvian Altiplano.
This study has some limitations, including the absence of a water balance analysis for Lake Titicaca’s water level due to the lack of long-term records of precipitation, evaporation, and upstream and downstream flows needed to assess how each component influences LTWL variability. The primary limitation is the lack of identification of the physical processes that explains the change of sign of the connection between long-lived LTWL minima and the PDO11–15 years in the 21st century. Hence, the development of dynamical downscaling models is required to address this limitation as well as future changes, similar to those observed in the Great Lake (Kayastha et al., 2022).
Finally, this study provides a detailed description of the mechanisms and the teleconnections related to long-lived LTWL minima events. These new findings will help reduce the strain on water resources and natural areas caused by the significant reduction of the water level in Lake Titicaca, which is currently decreasing due to ongoing drought conditions over the Altiplano region, with a future decrease projected by climate models, which project a reduction of precipitation accompanied by significant westerly flow anomalies over the Altiplano region at upper-tropospheric levels by the end of the 21st century (Minvielle and Garreaud, 2011; Neukom et al., 2015; Vera et al., 2019; Sulca and Da Rocha, 2021). However, further dynamic analyses will be required to build and implement a predictive model for long-lived LTWL minima events.
Data availability statement
The original contributions presented in the study are included in the article/Supplementary material, further inquiries can be directed to the corresponding author. The monthly time series of Lake Titicaca water levels is available upon request from Sixto Flores (c2Zsb3Jlc0BzZW5hbWhpLmdvYi5wZQ==).
Author contributions
JS: Conceptualization, Data curation, Formal analysis, Funding acquisition, Investigation, Methodology, Validation, Visualization, Writing – original draft, Writing – review & editing. MV: Formal analysis, Investigation, Methodology, Validation, Visualization, Writing – original draft, Writing – review & editing. KT: Formal analysis, Investigation, Methodology, Validation, Writing – original draft, Writing – review & editing. PR: Formal analysis, Investigation, Methodology, Writing – original draft, Writing – review & editing. BD: Formal analysis, Investigation, Methodology, Writing – original draft, Writing – review & editing. VM: Formal analysis, Investigation, Methodology, Writing – original draft, Writing – review & editing. JT: Formal analysis, Investigation, Methodology, Writing – original draft, Writing – review & editing. JA: Formal analysis, Investigation, Methodology, Writing – original draft, Writing – review & editing.
Funding
The author(s) declare that financial support was received for the research and/or publication of this article. JS, KT, and JA were funded by Peruvian PPR 068 program “Reducción de vulnerabilidad y atención de emergencias por desastres”. JS was also funded by the Consejo Nacional de Ciencia, Tecnología e Innovación Tecnológica (CONCYTEC) and the Programa Nacional de Investigación Científica y Estudios Avanzados (PROCIENCIA) within the framework of the competition E033-2023-01-BM “ALIANZAS INTERINSTITUCIONALES PARA PROGRAMAS DE DOCTORADOS, contract (PE501093367-2024-PROCIENCIA-BM).” JT acknowledges funding from the National Science Centre, Poland (grant no. 2023/51/D/ST10/01757). MV acknowledges funding from U.S. National Science Foundation (NSF) (grants No. AGS-2438298 and EAR-2103041).
Acknowledgments
JS, KT, and JA acknowledge funding from the Peruvian PPR 068 program “Reducción de Vulnerabilidad y Atención de Emergencia por Desastres”. This work was subsidized by CONCYTEC through the PROCIENCIA Program under the framework of the contest “Scholarships in educational doctorate programs through inter-institutional partnerships”, according to contract No. PE501093367-2024] and the Interinstitutional Alliances Contest for Doctoral Programs corresponding to the UNIVERSIDAD NACIONAL DE INGENIERIA, according to contract PE501084296-2023- PROCIENCIA-BM. MV was supported by NSF grants AGS-2438298 and EAR-2103041. JT acknowledges funding from the National Science Centre, Poland (grant no. 2023/51/D/ST10/01757). The authors thank Ing. Sixto Flores for providing the monthly Lake Titicaca water level time series. The authors also thank the two reviewers with their comments to improve the quality of the manuscript.
Conflict of interest
The authors declare that the research was conducted in the absence of any commercial or financial relationships that could be construed as a potential conflict of interest.
Generative AI statement
The authors declare that no Gen AI was used in the creation of this manuscript.
Publisher’s note
All claims expressed in this article are solely those of the authors and do not necessarily represent those of their affiliated organizations, or those of the publisher, the editors and the reviewers. Any product that may be evaluated in this article, or claim that may be made by its manufacturer, is not guaranteed or endorsed by the publisher.
Supplementary material
The Supplementary material for this article can be found online at: https://www.frontiersin.org/articles/10.3389/fclim.2025.1564040/full#supplementary-material
Footnotes
References
Alburqueque, E., Espino, M., Segura, M., and Chura, R. (2018). Nivel hídrico y precipitaciones del lago Titicaca en relación con las variables de macroescala del océano Pacífico. Trad. Segunda época. 17, 36–43. doi: 10.31381/tradicion.v0i17.1364
Alonso, W. A., Lavado-Casimiro, W., Espinoza-Villar, R., and Chavarri-Velarde, E. (2022). Spatial Distribution of Droughts in the Titicaca Lake Basin. Rev. Bras. Meteorol. 37, 289–304. doi: 10.1590/0102-77863730054
Angulo, E. C., and Pereira-Filho, A. J. (2022). Ocean forcing on Titicaca Lake water volume. Open J. Mod. Hydrol. 12, 1–10. doi: 10.4236/ojmh.2022.121001
Angulo, E. C., and Pereira-Filho, A. J. (2023). Extreme droughts and their relationship with the Interdecadal Pacific oscillation in the Peruvian Altiplano region over the last 100 years. Atmos. 14:1233. doi: 10.3390/atmos14081233
Beaton, R. H., and Tukey, J. W., (1974). The fitting of power series, meaning polynomials, illustrated on band-spectroscopic data. Technometrics, 16, 147–185, doi: 10.1080/00401706.1974.10489171
Birkel, S. D., Mayewski, P. A., Perry, L. B., Seimon, A., and Andrade-Flores, M. (2022). Evaluation of reanalysis temperature and precipitation for the Andean Altiplano and adjacent cordilleras. Earth Space Sci. 9:e2021EA001934. doi: 10.1029/2021EA001934
Canedo-Rosso, C., Hochrainer-Stigler, S., Pflug, G., Condori, B., and Berndtsson, R. (2021). Drought impact in the Bolivian Altiplano agriculture associated with El Niño-southern oscillation using satellite imagery data. Nat. Hazards Earth Syst. Sci. 21, 995–1010. doi: 10.5194/nhess-21-995-2021
Canedo-Rosso, C., Uvo, C. B., and Berndtsson, R. (2019). Precipitation variability and its relation to climate anomalies in the Bolivian Altiplano. Int. J. Climatol. 39, 2096–2107. doi: 10.1002/joc.5937
Chura-Cruz, R., Cubillos, L. A., Tam, J., Segura, M., and Villanueva, C. (2013). Relationship between lake water level and rainfall on the landing of Argentinian silverside Odontesthes bonariensis (Valenciennes, 1835) in the Peruvian sector of the Titicaca Lake from 1981 to 2010. Ecol. Apl. 12, 19–28. doi: 10.21704/rea.v12i1-2.434
CPC (2024). The Oceanic Niño index. Available online at: https://origin.cpc.ncep.noaa.gov/products/analysis_monitoring/ensostuff/ONI_v5.php (accessed February 8, 2024).
Dai, A. (2013). The influence of the inter-decadal Pacific oscillation on US precipitation during 1923-2010. Clim. Dyn. 41, 633–646. doi: 10.1007/s00382-012-1446-5
Delclaux, F., Coudrain, A., and Condom, T. (2007). Evaporation estimation on Lake Titicaca: a synthesis review and modelling. Hydrol. Process. 21, 1664–1677. doi: 10.1002/hyp.6360
Deser, C., Phillips, A. S., and Hurrell, J. W. (2004). Pacific Interdecadal variability: linkages between the tropics and the North Pacific during boreal winter since 1900. J. Clim. 17, 3109–3124. doi: 10.1175/1520-0442(2004)017<3109:PICVLB>2.0.CO;2
Dewitte, B., Illig, S., Renault, L., Goubanova, K., Takahashi, K., Gushchina, D., et al. (2011). Modes of covariability between sea surface temperature and wind stress intraseasonal anomalies along the coast of Peru from satellite observations (2000–2008). J. Geophys. Res. 116:C04028. doi: 10.1029/2010JC006495
Dong, B., and Dai, A. (2016). The influence of the Interdecadal Pacific oscillation on temperature and precipitation over the globe. Clim. Dyn. 45, 2667–2681. doi: 10.1007/s00382-015-2500-x
Dong, B., Dai, A., Vuille, M., and Elison-Timm, O. (2018). Asymmetric modulation of ENSO teleconnections by the Interdecadal Pacific oscillation. J. Clim. 31, 7337–7361. doi: 10.1175/JCLI-D-17-0663.1
DuMouchel, W. H., and O’Brien, F. L. (1989). “Integrating a robust option into a multiple regression computing environment” in Computer science and statistics, proceedings of the 21st symposium on the Interface. eds. K. Berk and L. Malone (American Statistical Association: Alexandria, VA), 297–302.
Enfield, D. B., Mestas-Nuñez, A. M., and Trimble, P. (2001). The Atlantic multidecadal oscillation and its relation to rainfall and river flows in the continental U.S. Geophys. Res. Lett. 28, 2077–2080. doi: 10.1029/2000GL012745
Flantua, S. G. A., Hooghiemstra, H., Vuille, M., Behling, H., Carson, J. F., Gosling, W. D., et al. (2016). Climate variability and human impact in South America during the last 2000 years: synthesis and perspectives from pollen records. Clim. Past 12, 483–523. doi: 10.5194/cp-12-483-2016
Garreaud, R., Vuille, M., and Clement, A. C. (2003). The climate of the Altiplano: observed current conditions and mechanisms of past changes. Palaeogeogr. Palaeoclimatol. Palaeoecol. 194, 5–22. doi: 10.1016/S0031-0182(03)00269-4
Garreaud, R. D., Vuille, M., Compagnucci, R. H., and Marengo, J. (2009). Present-day south American climate. Palaeogeogr. Palaeoclimatol. Palaeoecol. 281, 180–195. doi: 10.1016/j.palaeo.2007.10.032
Gelbrecht, M., Boers, N., and Kurths, J. (2021). Variability of the low-level circulation of the south American monsoon analysed with complex networks. Eur. Phys. J. Spec. Top. 230, 3101–3120. doi: 10.1140/epjs/s11734-021-00187-w
Guédron, S., Delaere, C., Fritz, S. C., Tolu, J., Sabatier, P., Devei, A.-L., et al. (2023). Holocene variations in Lake Titicaca water level and their implications for sociopolitical developments in the Central Andes. Proc. Natl. Acad. Sci. USA 120:e2215882120. doi: 10.1073/pnas.2215882120
Gutierrez-Villareal, R. A., Espinoza, J.-C., Lavado-Casimiro, W., Junquas, C., Molina-Carpio, J., Condom, T., et al. (2024). The 2022–2023 drought in the south American Altiplano: ENSO effects on moisture in the western Amazon during the pre-wet season. Wea. Clim. Extrem. 45:100710. doi: 10.1016/j.wace.2024.100710
Hastenrath, S., and Kutzbach, J. (1985). Late Pleistocene climate and water budget of the south American Altiplano. Quat. Res. 24, 249–256. doi: 10.1016/0033-5894(85)90048-1
Heddam, S., Vishwakarma, D. K., Abed, S. A., Sharma, P., Al-Ansari, N., Alataway, A., et al. (2024). Hybrid river stage forecasting based on machine learning with empirical mode decomposition. Appl Water Sci 14:46. doi: 10.1007/s13201-024-02103-8
Hersbach, H., Bell, B., Berrisford, P., Hirahara, S., Horányi, A., Muñoz-Sabater, J., et al. (2020). The ERA5 global reanalysis. Q. J. R. Meteorol. Soc. 146, 1999–2049. doi: 10.1002/qj.3803
IGP (2023a). Informe Técnico N° PpR/El Niño-IGP/2023–03. Available online at: https://repositorio.igp.gob.pe/bitstream/handle/20.500.12816/5391/Informe-Tecnico-PPR-El-Ni%C3%B1o-IGP-2023-03.pdf?sequence=1&isAllowed=y (accessed February 8, 2024).
IGP (2023b). Informe Técnico N° PpR/El Niño-IGP/2023–06. Available online at: https://repositorio.igp.gob.pe/bitstream/handle/20.500.12816/5438/Informe-Tecnico-PPR-El-Ni%C3%B1o-IGP-2023-06.pdf?sequence=1&isAllowed=y (accessed February 8, 2024).
Illig, S., Dewitte, B., Goubanova, K., Cambon, G., Boucharel, J., Monetti, F., et al. (2014). Forcing mechanisms of intraseasonal SST variability off Central Peru in 2000–2008. J. Geophys. Res. Oceans 119, 3548–3573. doi: 10.1002/2013JC009779
Imfeld, N., Barreto-Schuler, C., Correa-Marrou, K. M., Jacques-Coper, M., Sedlmeier, K., and Gubler, S. (2019). Summertime precipitation deficits in the southern Peruvian highlands since 1964. Int. J. Climatol. 39, 4497–4513. doi: 10.1002/joc.6087
Iwakiri, T., Imada, Y., Takaya, Y., Kataoka, T., Tatebe, H., and Watanabe, M. (2023). Triple-dip La Niña in 2020–23: North Pacific atmosphere drives 2nd year La Niña. Geophys. Res. Lett. 50:e2023GL105763. doi: 10.1029/2023GL105763
Jiang, S., Zhu, C., Hu, Z.-Z., Jiang, N., and Zheng, F. (2023). Triple-dip La Niña in 2020–23: understanding the role of the annual cycle in tropical Pacific SST. Environ. Res. Lett. 18:084002. doi: 10.1088/1748-9326/ace274
Jones, J. (2019). Recent changes in the South America low-level jet. NPJ Clim. Atmos. Sci. 2:20. doi: 10.1038/s41612-019-0077-5
Jones, C., Mu, Y., Carvalho, L. M. V., and Ding, Q. (2023). The South America low-level jet: form, variability and large-scale forcings. NPJ Clim. Atmos. Sci. 6:175. doi: 10.1038/s41612-023-00501-4
Kayastha, M. B., Ye, X., and Huang, C. (2022). Future rise of the Great Lakes water levels under climate change. J. Hydrol. 612:128205. doi: 10.1016/j.jhydrol.2022.128205
Knight, J. R., Folland, C. K., and Scaife, A. (2006). Climate impacts of the Atlantic multidecadal oscillation. Geophys. Res. Lett. 33:L17706. doi: 10.1029/2006GL026242
Labat, D., Espinoza, J. C., Ronchail, J., Cochonneau, G., de Oliveira, E., Doudou, J. C., et al. (2012). Fluctuations in the monthly discharge of Guyana shield rivers, related to Pacific and Atlantic climate variability. Hydrol. Sci. 57, 1–11. doi: 10.1080/02626667.2012.695074
Labat, D., Ronchail, J., and Guyot, J. L. (2005). Recent advances in wavelet analyses: Part 2—Amazon, Parana, Orinoco and Congo discharges time scale variability. J. Hydrol. 314, 289–311. doi: 10.1016/j.jhydrol.2005.04.004
Li, X., Hu, Z.-Z., McPhaden, M. J., Zhu, C., and Liu, Y. (2023). Triple-dip La Niñas in 1998–2001 and 2020–2023: impact of mean state changes. J. Geophys. Res. Atmos. 128:e2023JD038843. doi: 10.1029/2023JD038843
Lima-Quispe, N., Escobar, M., Wickel, A. J., von Kaenel, M., and Purkey, D. (2021). Untangling the effects of climate variability and irrigation management on water levels in lakes Titicaca and Poopó. J. Hydrol. Reg. Stud. 37:100927. doi: 10.1016/j.ejrh.2021.100927
Lima-Quispe, N., Ruelland, D., Rabatel, A., Lavado-Casimiro, W., and Condom, T. (2025). Modeling Lake Titicaca's water balance: the dominant roles of precipitation and evaporation. Hydrol. Earth Syst. Sci. 29, 655–682. doi: 10.5194/hess-29-655-2025
Liu, Z. (2024). Robust empirical mode decomposition (REMD). MATLAB Central File Exchange. Available online at: https://www.mathworks.com/matlabcentral/fileexchange/70032-robust-empirical-mode-decomposition-remd (accessed July 4, 2024).
Liu, Z., Peng, D., Zuo, M. J., Xia, J., and Qin, Y. (2022). Improved Hilbert–Huang transform with soft sifting stopping criterion and its application to fault diagnosis of wheelset bearings. ISA Trans. 125, 426–444. doi: 10.1016/j.isatra.2021.07.011
Mantua, N. J., Hare, S. R., Zhang, Y., Wallace, J. M., and Francis, R. C. (1997). Pacific interdecadal climate oscillation with impacts on salmon production. Bull. Am. Meteorol. Soc. 78, 1069–1079. doi: 10.1175/1520-0477(1997)078<1069:APICOW>2.0.CO;2
Minvielle, M., and Garreaud, R. D. (2011). Projecting rainfall changes over the south American Altiplano. J. Clim. 24, 4577–4583. doi: 10.1175/JCLI-D-11-00051.1
Montini, T. L., Jones, C., and Carvalho, L. M. V. (2019). The south American low-level jet: a new climatology, variability, and changes. J. Geophys. Res. Atmos. 124, 1200–1218. doi: 10.1029/2018JD029634
Morales, M. S., Crispín-DelaCruz, D. B., Álvarez, C., Christie, D. A., Ferrero, M. E., Andreu-Hayles, L., et al. (2023). Drought increase since the mid-20th century in the northern south American Altiplano revealed by a 389-year precipitation record. Clim. Past 19, 457–476. doi: 10.5194/cp-19-457-2023
Mortensen, E., Wu, S., Notaro, M., Vavrus, S., Montgomery, R., De Piérola, J., et al. (2018). Regression-based season-ahead drought prediction for southern Peru conditioned on large-scale climate variables, Hydrol. Earth Syst. Sci., 22, 287–303, doi: 10.5194/hess-22-287-2018
Neukom, R., Rohrer, M., Calanca, P., Salzmann, N., Huggel, C., Acuña, D., et al. (2015). Facing unprecedented drying of the Central Andes? Precipitation variability over the period AD 1000-2100. Environ. Res. Lett. 10:084017. doi: 10.1088/1748-9326/10/8/084017
Pillco-Zolá, R., Bengtsson, L., Berndtsson, R., Martí-Cardona, B., Satgé, F., Timouk, F., et al. (2019). Modelling Lake Titicaca’s daily and monthly evaporation. Hydrol. Earth Syst. Sci. 23, 657–668. doi: 10.5194/hess-23-657-2019
Rayner, N. A., Parker, D. E., Horton, E. B., Folland, C. K., Alexander, L. V., Rowell, D. P., et al. (2003). Global analyses of sea surface temperature, sea ice, and night marine air temperature since the late nineteenth century. J. Geophys. Res. 108:4407. doi: 10.1029/2002JD002670
Rojas-Murillo, K., Lupo, A. R., Garcia, M., Gilles, J., Korner, A., and Rivera, M. A. (2022). ENSO and PDO related interannual variability in the north and east-central part of the Bolivian Altiplano in South America. Int. J. Climatol. 42, 2413–2439. doi: 10.1002/joc.7374
Ronchail, J., Espinoza, J. C., Labat, D., Callède, J., and Lavado, W. (2014). “Evolución del nivel del Lago Titicaca durante el siglo XX. Línea Base de Conocimientos Sobre Los Recursos Hidrológicos e Hidrobiológicos” in El Sistema TDPS con enfoque en la Cuenca del Lago Titicaca (Quito: TDPS), 320.
Segura, H., Espinoza, J. C., Junquas, C., Lebel, T., Vuille, M., and Garreaud, R. (2020). Recent changes in the precipitation-driving processes over the southern tropical Andes/western Amazon. Clim Dyn 54, 2613–2631.doi: 10.1007/s00382-020-05132-6
SENAMHI (2021). Caracterización de las sequías meteorológicas en el departamento de Puno. Servicio Nacional de Meteorología e Hidrología del Perú, Proyecto Pachayatiña/Pachayachay. Peru: SENAMHI–HELVETAS–PREDES.
SENAMHI (2023). Condiciones hidrológicas en la Región hidrográfica del Titicaca (Perú): déficit de caudales periodo setiembre 2022 a enero 2023. Available online at: https://www.senamhi.gob.pe/pdf/estudios/deficit-caudales-RHT-N-02.pdf (accessed January 22, 2024).
SENAMHI (2024). Boletín Regional Puno N° 12: Diciembre 2023. Servicio Nacional de Hidrología e Hidrología. Available online at: https://www.senamhi.gob.pe/load/file/04701SENA-133.pdf (accessed February 7, 2024).
Sulca, J., Apaéstegui, J., and Tacza, J. (2024). New insights into the biennial-to-multidecadal variability of the water level fluctuation in Lake Titicaca in the 20th century. Front. Clim. 5:1325224. doi: 10.3389/fclim.2023.1325224
Sulca, J. C., and da Rocha, R. P. (2021). Influence of the coupling South Atlantic convergence zone–El Niño-southern oscillation (SACZ–ENSO) on the projected precipitation changes over the Central Andes. Climate 9:77. doi: 10.3390/cli9050077
Sulca, J., Takahashi, K., Espinoza, J.-C., Vuille, M., and Lavado-Casimiro, W. (2018). Impacts of different ENSO flavors and tropical Pacific convection variability (ITCZ, SPCZ) on austral summer rainfall in South America, with a focus on Peru. Int. J. Climatol. 38, 420–435. doi: 10.1002/joc.5185
Sulca, J., Takahashi, K., Tacza, J., Espinoza, J., and Dong, B. (2022a). Decadal variability in the austral summer precipitation over the Central Andes: observations and the empirical-statistical downscaling model. Int. J. Climatol. 42, 9836–9864. doi: 10.1002/joc.7867
Sulca, J., Vuille, M., and Dong, B. (2022b). Interdecadal variability of the austral summer precipitation over the Central Andes. Front. Earth Sci. 10:954954. doi: 10.3389/feart.2022.954954
Sztorch, L., Gicquel, V., and Desencios, J. C. (1989). The relief operation in Puno district, Peru, after the 1986 floods of Lake Titicaca. Disasters 13, 33–43. doi: 10.1111/j.1467-7717.1989.tb00693.x
Torrence, C., and Compo, G. P. (1998). A practical guide to wavelet analysis. Bull. Am. Meteorol. Soc. 79, 61–78. doi: 10.1175/1520-0477(1998)079<0061:APGTWA>2.0.CO;2
Trenberth, K. E., Branstator, G. W., Karoly, D., Kumar, A., Lau, N. C., and Ropelewski, C. (1998). Progress during TOGA in understanding and modeling global teleconnections associated with tropical sea surface temperatures. J. Geophys. Res. 103, 14291–14324. doi: 10.1029/97JC01444
Urrutia, R., and Vuille, M. (2009). Climate change projections for the tropical Andes using a regional climate model: temperature and precipitation simulations for the end of the 21st century. J. Geophys. Res. 114:D02108. doi: 10.1029/2008JD011021
Vera, C. S., Díaz, L. B., and Saurral, R. I. (2019). Influence of anthropogenically-forced global warming and natural climate variability in the rainfall changes observed over the south American Altiplano. Front. Environ. Sci. 7:87. doi: 10.3389/fenvs.2019.00087
Villar, D. A., Yanes, E., Gutierrez-Tito, E. R., and Gosler, A. G. (2024). Short Communication: Addressing conflict between fishermen and the Titicaca Grebe (Rollandia microptera) through diet analysis. Ibis International journal of avian science. 166, 1395–1403. doi: 10.1111/ibi.13337
Vuille, M., and Keimig, F. (2004). Interannual variability of summertime convective cloudiness and precipitation in the Central Andes derived from ISCCP-B3 data. J. Clim. 17, 3334–3348. doi: 10.1175/1520-0442(2004)017<3334:IVOSCC>2.0.CO;2
Wilks, S. D. (2011). Statistical methods in the atmospheric sciences. 3rd ed. international geophysics series, Vol. 100. New York, NY: Academic Press, 676.
Zhang, R.-H., and Levitus, S. (1997). Structure and cycle of decadal variability of upper-ocean temperature in the North Pacific. J. Clim. 10, 710–727. doi: 10.1175/1520-0442(1997)010<0710:SACODV>2.0.CO;2
Keywords: Lake Titicaca water level minima, Niño diversity, South American low-level jet, Western tropical North Atlantic, Pacific Decadal oscillation, interdecadal Pacific oscillation, multiple linear regression model
Citation: Sulca J, Vuille M, Takahashi K, Roundy P, Dong B, Mayta V, Tacza J and Apaestegui J (2025) Multi-time scale analysis of the water level minima in Lake Titicaca over the past 103 years. Front. Clim. 7:1564040. doi: 10.3389/fclim.2025.1564040
Edited by:
Jung-Eun Chu, City University of Hong Kong, Hong Kong SAR, ChinaReviewed by:
Eduardo Zorita, Helmholtz Centre for Materials and Coastal Research (HZG), GermanyMario Bruno Rohrer, Meteodat GmbH, Switzerland
Copyright © 2025 Sulca, Vuille, Takahashi, Roundy, Dong, Mayta, Tacza and Apaestegui. This is an open-access article distributed under the terms of the Creative Commons Attribution License (CC BY). The use, distribution or reproduction in other forums is permitted, provided the original author(s) and the copyright owner(s) are credited and that the original publication in this journal is cited, in accordance with accepted academic practice. No use, distribution or reproduction is permitted which does not comply with these terms.
*Correspondence: Juan Sulca, c3VsY2FmNUBnbWFpbC5jb20=
†ORCID: Juan Sulca, orcid.org/0000-0003-4393-3161
Mathias Vuille, orcid.org/0000-0002-9736-4518
Ken Takahashi, orcid.org/0000-0003-3670-2939
Paul Roundy, orcid.org/0000-0002-2201-0002
Bo Dong, orcid.org/0000-0002-1191-7960
Victor Mayta, orcid.org/0000-0003-4037-1722
Jose Tacza, orcid.org/0000-0002-2625-7803