 Ettore Mosca1*
 Matteo Bersanelli2
 Matteo Gnocchi1
 Marco Moscatelli1
 Gastone Castellani2
 Luciano Milanesi1
 Alessandra Mezzelani1
- 1Bioinformatics Group, Institute of Biomedical Technologies, National Research Council of Italy, Segrate, Italy
- 2Applied Physics Group, Department of Physics and Astronomy, University of Bologna, Bologna, Italy
Autism spectrum disorder (ASD) is marked by a strong genetic heterogeneity, which is underlined by the low overlap between ASD risk gene lists proposed in different studies. In this context, molecular networks can be used to analyze the results of several genome-wide studies in order to underline those network regions harboring genetic variations associated with ASD, the so-called “disease modules.” In this work, we used a recent network diffusion-based approach to jointly analyze multiple ASD risk gene lists. We defined genome-scale prioritizations of human genes in relation to ASD genes from multiple studies, found significantly connected gene modules associated with ASD and predicted genes functionally related to ASD risk genes. Most of them play a role in synapsis and neuronal development and function; many are related to syndromes that can be in comorbidity with ASD and the remaining are involved in epigenetics, cell cycle, cell adhesion and cancer.
Introduction
“Autism spectrum disorder” (ASD) includes clinically and etiologically wide range of neurodevelopmental disorders such as the less severe disorders Asperger's syndrome and pervasive developmental disorder, not otherwise specified, as well as the most severe childhood disintegrative disorder. ASD symptoms are recognized mainly by the complex behavioral phenotype that manifests within the first 3 years of life: difficult in communication and social interaction, limited interests and repetitive behaviors (National Institute of Mental Health, 2013).
Genetics play a crucial role in autism pathogenesis (Devlin and Scherer, 2012). Indeed, ASD has a high-heritability index (0.85–0.92) (Monaco and Bailey, 2001), a significant sib recurrence risks (8.6%) and 64% concordance among monozygotic twins (Smalley, 1998). Thousands of causative or predisposing genetic variations have been found in ~30% of autistic patients (O'Roak et al., 2012), thus making autism a complex multifactorial disorder involving many genes and loci contributing to the phenotype. Genetic variations involved in ASD are chromosomal abnormalities (~5%), copy number variations (CNVs) (10–20%) and single-gene mutations (~5%) (Miles, 2011). Although the role of genetics in ASD etiology is recognized for ~70% of cases, the causative factor is still unknown.
The approaches currently used to disentangle the genetic complexity of ASDs include large genome-wide association studies (GWAS), CNV testing and genome sequencing. Interestingly, the application of these different approaches yielded many non-overlapping genes, which may suggest different molecular mechanisms within connected pathways (Pinto et al., 2014). The analysis of molecular interactions and pathways is therefore crucial for the interpretation of the results emerging from genome-scale studies on a pathology marked by a significant genetic heterogeneity. Indeed biological pathways associated with a specific pathology are likely to be more conserved than individual genetic variations, because multiple combinations of variations might perturb each pathway (Barabási et al., 2011). Network-based and pathway-based analyses can therefore provide a functional explanation to non-overlapping genes and narrow the targets for therapeutic intervention (Devlin and Scherer, 2012).
One of the problems that network-based analyses can solve is indeed the identification of the so-called disease modules, i.e., network regions associated with a disease (Barabási et al., 2011). Recently, molecular interaction networks have been used in the analysis of ASD genetic data to define gene networks associated with ASD. The identification of a subnetwork with desired properties from a large biological network (like the one formed by all protein-protein interactions) poses many challenges and therefore several approaches have been proposed (Mitra et al., 2013).
Regarding the integration of networks and ASD genetic data, Cristino et al. (2014) studied the interacting partners of genes known to be associated with ASDs and other related disorders; Noh et al. (2013) identified a significantly interconnected network of genes affected by CNVs; Li et al. (2014) studied the association between ASDs and genes forming topological communities (clusters of genes with a high density of connection between genes of the community and less connections with genes outside the community); Gilman et al. (2011) found functionally connected clusters of genes affected by CNVs.
Recently, network smoothing index (NSI) was proposed as a network-based quantity that allows to define a network region enriched with a priori information (Bersanelli et al., 2016). The NSI is based on network diffusion, a method that simulates the flow of a fluid throughout a network. NSI quantifies the network relevance of each gene in relation to a set of input genes (e.g., ASD genes), considering the whole network and mitigating the importance of hubs.
In this work, we use network diffusion and the NSI to propose a possible disease module for ASD, encompassing the network regions most frequently hit by molecular variations reported in several studies and collected in curated public databases. Moreover, our study introduces a network-based genome-wide prioritization of genes in relation to their known and predicted relevance for ASDs.
Materials and Methods
Molecular Interactions
STRING interactions were collected from STRING (version 10), a database of direct and indirect PPIs (Szklarczyk et al., 2015). Native identifiers were mapped to Entrez Gene (Brown et al., 2015) identifiers. In case multiple proteins mapped to the same gene identifier, only the pair of gene identifiers with the highest STRING confidence score was considered. A total of 11,535 genes and 207,157 links with confidence score ≥700 was retained.
ASD Risk Genes
ASD risk genes were collected from The Simons Foundation Autism Research Initiative SFARI Gene database (Abrahams et al., 2013, version available in July 2015) and from Li et al. (2014).
SFARI Gene provides a publicly available database where genes are scored according to the strength of the evidence of gene's association with autism. In particular, genes are assigned to 7 categories (Supplementary Table 1): “syndromic” (S), “high confidence” (1), “strong candidate” (2), “suggestive evidence” (3), “Minimal evidence” (4), “Hypothesized” (5), and “Not supported” (6). SFARI genes were divided into to broad classes of high and low strength of association with ASD. Genes belonging to categories S, 1, 2, 3, 1S, 2S, 3S, 4S were included in SFARIh list, while genes of categories 4 and 5 were grouped into SFARIl. Native gene identifiers were converted to Entrez Gene (Brown et al., 2015) identifiers.
In addition to SFARIh genes, we considered 5 sources (namely dnCNVn, dnCNV3s, rCNV, dMUT, mMUT) of genes harboring CNVs and mutations associated with ASDs, proposed by large recent studies (Li et al., 2014). dnCNVn contains genes from an ASD-associated network composed of genes with de novo CNVs identified in 181 individuals and genes previously implicated in ASDs (Noh et al., 2013). dnCNV3s contains genes with de novo CNVs found in all three independent studies on more than 1,000 families (Levy et al., 2011; Sanders et al., 2011; Pinto et al., 2014). rCNV contains genes with rare CNVs found in a study involving approximately 1000 ASD individuals of European ancestry and matched controls (Pinto et al., 2010). dMUT and mMUT include genes with, respectively, disruptive and missense mutations (Neale et al., 2012; O'Roak et al., 2012; Sanders et al., 2012; Li et al., 2014).
Only genes occurring in STRING network were considered in network-based analyses (Table 1). Therefore, whenever appropriate, we will specifically refer to the original gene lists and the corresponding derived lists with only genes occurring in STRING network using suffixes “i” and “n0” respectively (e.g., SFARIhi, SFARIhn0).
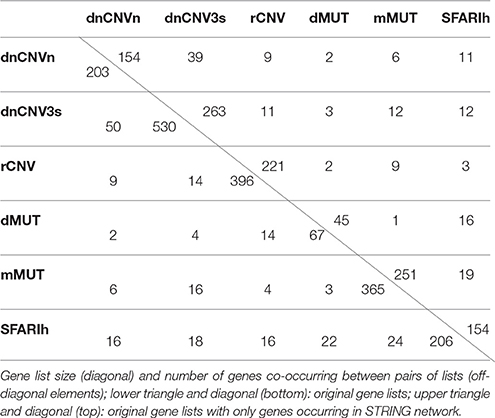
Table 1. Overlap between lists of genes harboring variations associated with ASDs.
Network-Based Analysis
Given an input gene list L and a gene network encoded as the n-by-n symmetrically normalized adjacency matrix W (Bersanelli et al., 2016), the n-sized vector X0 was defined in order to have positive quantities only in its elements representing the genes in L, and null values for all the other genes. Network diffusion finds the vector X∗, in which the quantities initially available in X0 are subject to smoothing according to the pattern of interactions W. The vector X∗ was calculated using an iterative procedure (Zhou et al., 2004), as described in Bersanelli et al. (2016):
where α [here set to 0.7 as in previous works (Bersanelli et al., 2016)] is a parameter that weights to which extent the initial information is retained or spread throughout the network. In the independent smoothing of each of the six ASD gene lists described above, genes belonging to the list were set to 1. In the joint analysis of all gene lists, genes belonging to SFARIhn0 were set to 1, while genes belonging to other lists were set to 0.5: this setting was chosen so that genes strongly associated with ASD had a higher priority.
For each gene g, the network smoothing index S quantifies the network proximity of g to genes marked by a positive value in X0, i.e., associated with ASD, as ratio between gene values after and before network diffusion:
where ε is a small positive quantity that weights the importance of the initial values X0. In order to mitigate the tendency of hub genes to gather excessive amounts of information only because of their central position, the permutation-adjusted network smoothing index Sp was introduced as,
where pS(g) is an empirical p-value, computed using K permutations of X0, each one denoted as , and the corresponding Sk(g) (calculated using ):
In the analysis of the six ASD risk gene lists, ε values were defined in order to predict genes in network proximity to the input genes. Given a gene set of size N, ε was set in order to obtain, among the first N top ranking genes by Sp, a ratio of 1:1 between (i) the number of input genes and (ii) the number of genes in network proximity to input genes. The resulting values were 0.21 for dnCNVnn0 and 0.19 for dnCNV3sn0, RcnVn0, dMUTn0, mMUTn0 and SFARIhn0. In the joint analysis of all gene lists ε was set equal to 1, because the analysis was mainly aimed at defining a network-based prioritization of the 956 input genes, rather than at predicting other genes in network proximity. In all these analyses we used K = 999.
Network resampling (NR) shows to which extent a network score, resulting from the combination of gene scores, is expected if links among genes are shuffled. Also in this case permutations are used to define the null model. Given a number m of genes at the top of a ranked gene list, NR consists of two steps. First, a non-decreasing quadratic objective function Ω(m) is defined:
where Sp(m) is the vector referring to the first m-scoring genes and Am is the adjacency matrix between such genes. In the second step, q permutations of Am are defined keeping the same degree distribution. Lastly, an empirical p-value (pN) is calculated to quantify the fraction of times the objective function calculated on a permuted network, Ωk(m), is greater than or equal to Ω(m). The procedure is repeated for different m, providing an overview on whether gene links and gene scores determine significant network scores when moving down in the ranked gene list (see figures below).
Network resampling (NR) was applied to genes ranked by Sp in descending order and using a total of 200 permutations, which was enough to underline the presence of significantly connected components (gene modules).
Pathway Analysis
Pathway analysis was carried out using over-representation analysis (ORA). ORA estimates the significance of a pathway in relation to an input gene list, calculating the hypergeometric probability of finding the observed number of input genes that are also members of the considered pathway, in the context of a background set of genes. As a background we considered all the genes occurring in original lists and all genes occurring in the gene network. Gene-pathway associations were downloaded from NCBI Biosystems (version: February 2017) (Geer et al., 2010); in particular, only pathways (gene sets) with a number of genes between 10 and 200 were considered. Hypergeometric probabilities were calculated using “phyper” and “dhyper” R functions, and were corrected for multiple hypotheses testing using the Benjamini-Hochberg method, implemented in “p.adjust” R routine. The similarity between two gene sets (A, B) was calculated using the overlap coefficient: o = |A ∩ B|/ min(|A|, |B|).
Results
Network Location of Genes Associated with ASDs in SFARI Database
With the aim of characterizing the functional relations among SFARI genes and predict relevant risk genes for ASDs, we considered direct and indirect protein-protein interactions (PPI) and quantified, via the permutation-adjusted NSI (Sp) (Bersanelli et al., 2016), the network proximity of each human gene in relation to the network location of 154 genes reported as strongly associated with ASD (SFARIhn0 list, Table 1).
We found several genes in significant network proximity to SFARIhn0 genes, with high S and low pS (Figure 1A and Supplementary Table 2). Interestingly, among these genes, we found a significant number of genes having minimal/hypothetical evidences of association with autism in SFARI (SFARIln0) (Table 2).
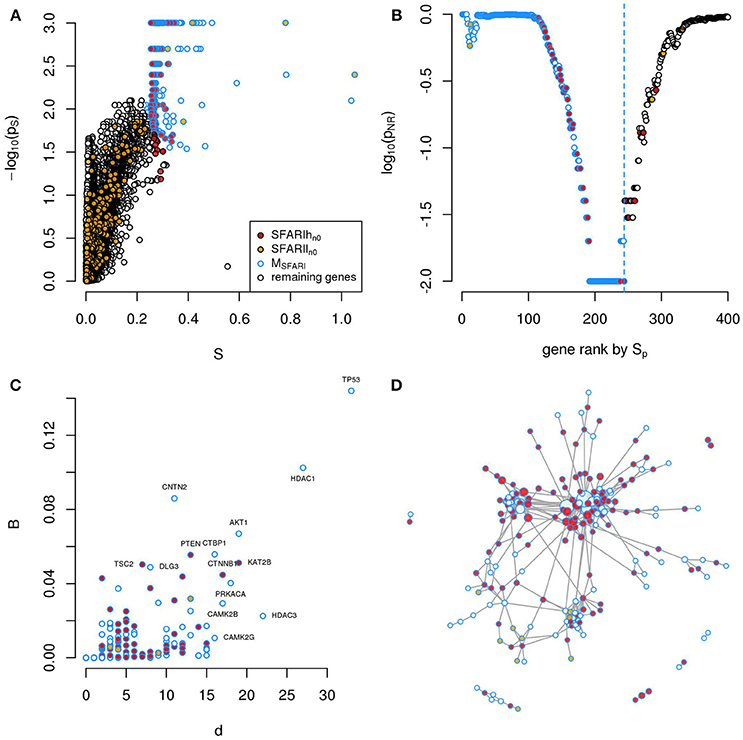
Figure 1. A significantly connected gene module based on SFARIh genes. The network-diffusion based analysis of SFARIh genes (red) leads to the definition of a significantly connected gene module of 244 genes (blue border). (A) Network smoothing index and corresponding estimated p-value (ps). (B) For each rank n (horizontal axis), the estimated p-value (pNR) that quantifies the significance of the gene network defined by the genes ranked up to the n-th rank. (C) Number of interactions (d) and normalized betweenness (B) of genes in MSFARI. (D) Visualization of MSFARI gene module, in which genes are circles and PPI are links; circle size is proportional to gene degree. (A–D) G: all genes included in the STRING network.
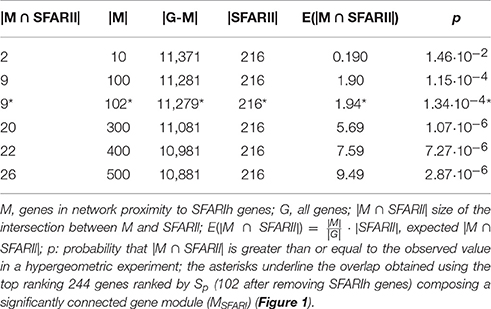
Table 2. Number of SFARIl genes in network proximity to SFARIh genes.
In order to assess whether genes ranked by Sp formed a significantly connected gene module, we applied the NR approach (Bersanelli et al., 2016). We observed a significantly connected gene module (MSFARI) resulting from the top 244 genes (Figures 1B–D). This module includes 142 (out of 154) SFARIhn0 genes, 9 SFARIln0 genes and 93 genes not in SFARI.
These 93 genes include regulators of synaptic development and plasticity, are involved in syndromic conditions in comorbidity with ASD, regulate epigenetic mechanisms and a few are associated to cancer (Supplementary Table 2). For example, among the 93 genes that have a relevant position within the module (Figure 1C) we found cancer genes that control cell proliferation, [e.g., Tumor Protein P53 (TP53), AKT Serine/Threonine Kinase 1 (AKT1), Mechanistic Target Of Rapamycin (MTOR), C-Terminal Binding Protein 1 (CTBP1)], a process that was recently proposed as a common denominator of cancer and ASDs (Crawley et al., 2016), and genes with relevant role for brain function e.g., histone deacetylase-1 (HDAC1), histone deacetylase-3 HDAC3 (Volmar and Wahlestedt, 2015) and contactin-2 (CNTN2) (Anderson et al., 2012). These 93 predicted genes act as a bridge between SFARIh genes that were not directly linked in STRING (Figure 1D).
Interestingly, while this manuscript was under review, 3 out of the 93 predicted genes were added to the SFARI database independently from our study. Namely, HADAC3 was added among “hypothesized” genes, while TANC2 and PPP2R1B among “minimal evidence” genes.
Genes in Network Proximity to Genes Harboring Variations Associated with ASD
In addition to the SFARIh gene list, we considered five other lists of genes found altered in ASD subjects by previous studies. These lists vary in size from 67 to 530 and from 45 to 263 genes after integration with STRING gene network. The percent overlap between lists is low (Table 1) and most of the genes occur only in one list (Figure 2). In this situation, as introduced earlier, the information on how gene products interact to regulate biological functions can be used to explain the heterogeneity of ASD risk gene lists. Firstly, we analyzed each list separately to underline the specificities and commonalities of each list. Subsequently, we used network information to define a prioritization among all ASD risk genes proposed in the considered studies (union of all gene lists).
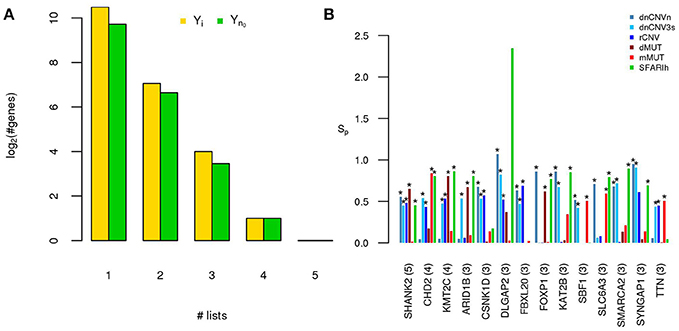
Figure 2. A small number of ASD risk genes is found in more than one large study. (A) Number of risk genes found in 1 or more of the six gene lists on ASD; i: original gene lists; n0: original gene lists wit only genes occurring in the STRING network. (B) Permutation-adjusted network smoothing index of the 14 genes occurring in 3 or more original lists (the number is reported between parenthesis); the asterisk (*) indicates genes of the corresponding original list.
We calculated the Sp of all genes in STRING network considering as input each of the six ASD gene lists (SFARIhn0, dnCNVnn0, dnCNV3sn0, rCNVn0, dMUTn0, and mMUTn0) and selected the top 2n genes ranked by decreasing values of Sp, where n is list size (Supplementary Table 3). Note that almost all these genes are in significant network proximity (pS < 0.05) to the corresponding input genes (Figure 3 and Supplementary Table 3), which are also ranked among the top 2n genes. For convenience we will refer to these network-based gene lists—which contains input and predicted genes—as SFARIh, dnCNVn, dnCNV3s, rCNV, dMUT, and mMUT.
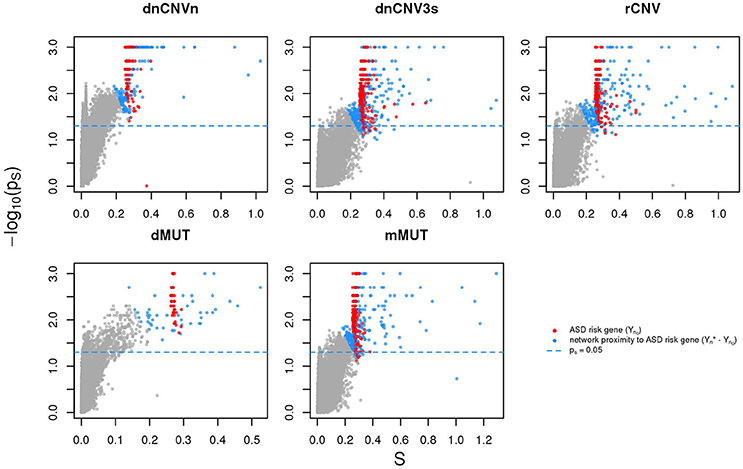
Figure 3. Genes in network proximity to ASD risk genes. The network smoothing index (S) and the corresponding p value (ps) are the two factors that make up Sp. Blue: genes belonging to the corresponding original list (sources); red: genes in network proximity to sources; gray: remaining genes.
Only 14 genes occur in three or more input gene lists (Figure 2). Among those genes, at least DLGAP2 (Discs Large Homolog Associated Protein 2) and SYNGAP1 (Synaptic Ras GTPase Activating Protein 1) are worth mentioning. In fact, DLGAP2, a post-synaptic density protein with probable implication in ASD pathogenesis (Chien et al., 2013) scored as “minimal evidence” in SFARI (SFARIl), is part of all three CNV lists and was predicted as functionally related to SFARIh genes and dMUT genes. Furthermore, DLGAP1 (Discs Large Homolog Associated Protein-1) was predicted as functionally related to genes of 3 input lists, including SFARIh (Figure 2B). Similarly, SYNGAP1, which codes an autism related brain-specific synaptic Ras GTP-activating protein (Berryer et al., 2013), occur in three input lists (dnCNVhc, dnCNV3s and SFARIh) and was predicted as functionally related to genes harboring rCNVs.
Globally, a total of 913 genes were predicted as functionally related to at least one ASD risk gene list (Table 3 and Supplementary Table 4). Interestingly, 106 of these genes were already proposed as ASD risk genes in 1 or more studies: for example, CTNNB1 (Catenin-Beta1) encoding a protein part of the adherens junctions complex, NRXN1 (Neurexin1), NLGN4X (Neuroligin4X), encoding a pre-synaptic and post-synaptic protein, respectively, and the tumor suppressor PTEN (Phosphatase And Tensin Homolog), were predicted as functionally related to 2 gene lists and included as risk genes in other 2 lists.
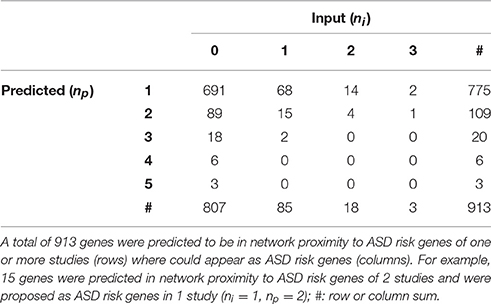
Table 3. Co-occurrence of genes in network proximity to ASD risk genes from one or more sources.
We have also found genes that were not included in any input gene list, but were predicted to be in relevant network proximity to multiple gene lists. For example, 27 were predicted as functionally related to three gene lists (Figure 4); among these, ADGRL2 (adhesion G protein-coupled receptor L2), LRTOM (leucine rich transmembrane and O-methyltransferase domain containing) and SRC (Proto-Oncogene Non-Receptor Tyrosine Kinase SRC) were predicted in functional relation to 5 lists.
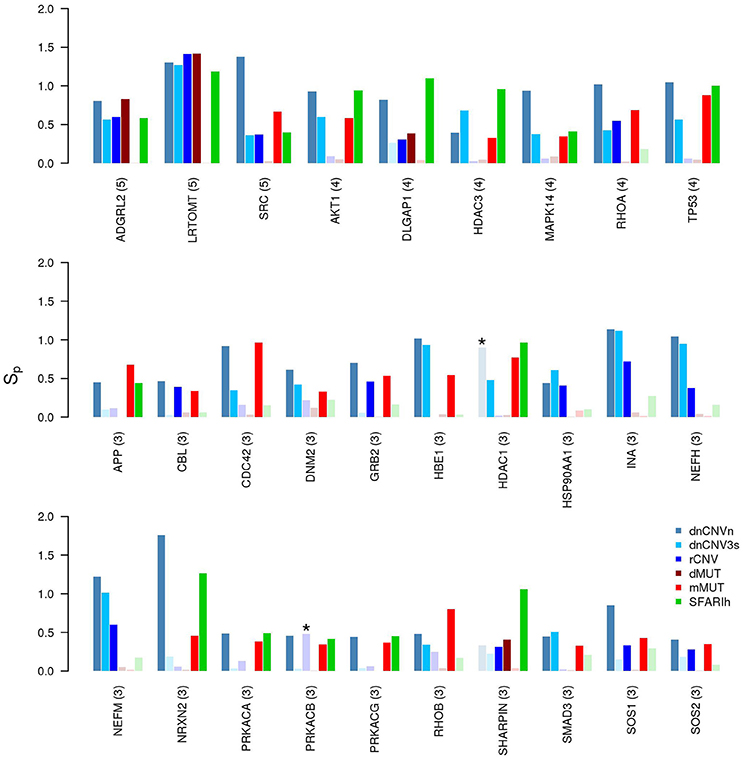
Figure 4. Genes in network proximity to ASD risk genes from 3 or more studies. Permutation-adjusted network smoothing index (Sp) of the 29 genes predicted as functionally related to 3 or more ASD risk gene lists (the number is reported between parenthesis); the asterisk (*) indicates genes of the corresponding original list; faded colors indicate input ASD risk genes or genes with no significant Sp values.
Many of the 29 genes predicted as functionally related to three or more lists—27 genes not included in any input list and 2 included in one study—take part in many PPIs, implicating they are central in the PPI network (e.g., TP53, AKT1). The significance of their Sp suggests that these genes were not only selected in relation to their centrality, but also because their network distance to ASD risk genes is lower than expected by chance (Figure 3 and Supplementary Table 3). A further observation that supports this hypothesis is that these genes establish a number of interactions with ASD risk genes that is higher than expected (p < 0.05, hypergeometric test) (Table 4). From a network point of view, these 29 genes are “surrounded” by 369 ASD risk genes (first order neighbors).
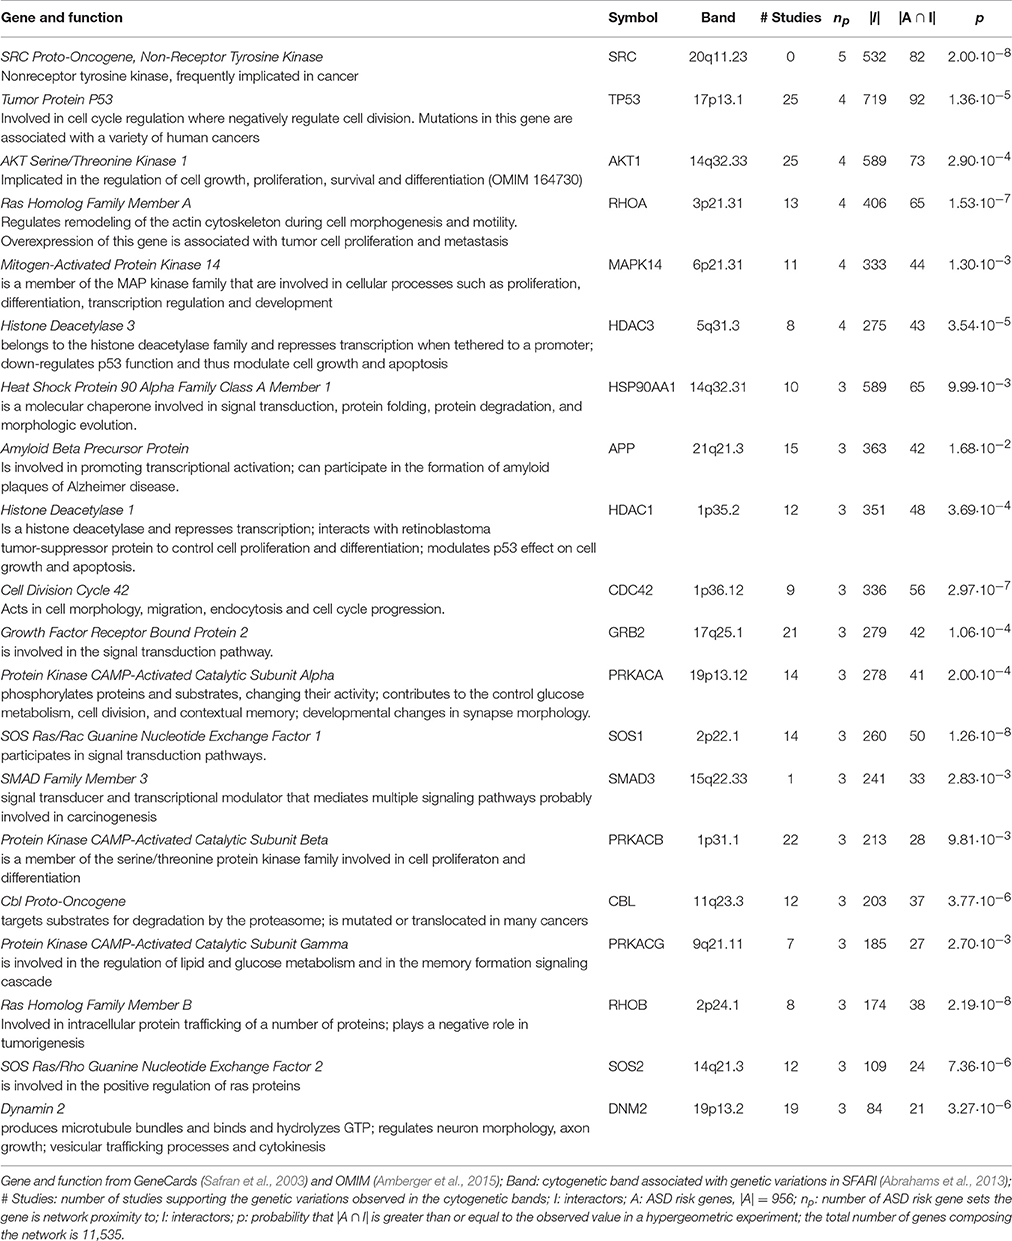
Table 4. Hub genes predicted in network proximity to ASD risk genes of three or more studies establish a significant number of interactions with ASD risk genes.
It is also worth mentioning that several genes resulting with the highest network proximity score to each list tend to be list specific (Figure 5).
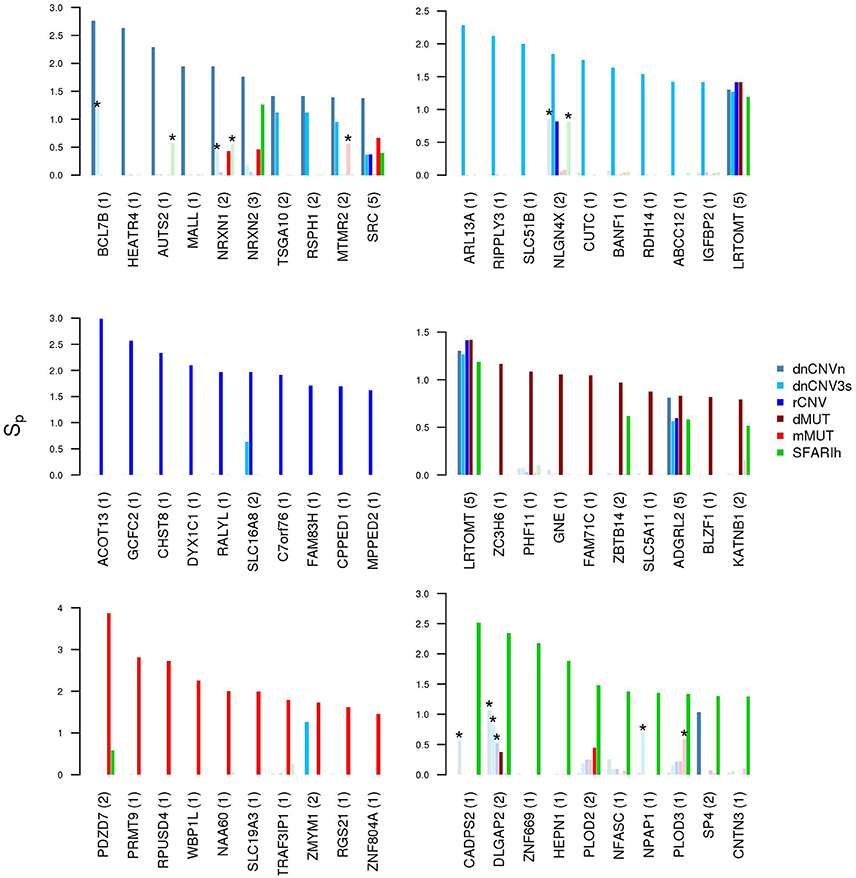
Figure 5. Genes in network proximity to ASD risk genes from each study. Top 10 genes with the highest permutation-adjusted network smoothing index (Sp) calculated in the analysis of each ASD risk gene list; the number of lists to which the gene was predicted as network proximal is reported between parenthesis; the asterisk (*) indicates genes of the corresponding original list; faded colors indicate input ASD risk genes or genes with no significant Sp values.
A total of 956 unique ASD risk genes occur in the 6 input lists. We calculated the Sp of all genes relative to these 956 genes (Figure 6A) and, by means of NR, found a significantly connected component of 561 genes (Figure 6B and Supplementary Table 5). This gene module (MASD) includes all SFARIh genes, 70% of genes occurring in dnCNV_n list, approximately 50% of the other gene lists (Figure 6C), 26 genes in SFARIl and 8 genes that do not belong to the input list. Among these 8 genes, we find the already mentioned AKT1, TP53, and SRC, which occupy a central role in the PPI network and were also predicted during the independent analysis of each input list (Figures 4, 6D).
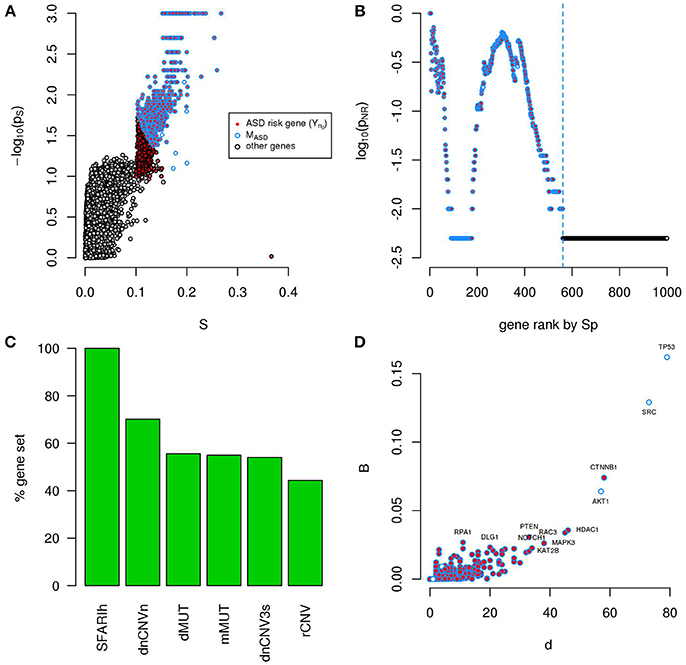
Figure 6. A significantly connected gene module based on ASD risk genes from 6 sources. The network-diffusion based analysis of 956 ASD risk genes from 6 sources (red) leads to the definition of a significantly connected gene module (MASD) of 561 genes (blue border). (A) Network smoothing index (S) and corresponding p-value (ps). (B) For each rank n (horizontal axis), the estimated p-value (pNR) that quantifies the significance of the gene network defined by the genes ranked up to the n-th rank is reported on the vertical axis. (C) Percent of ASD genes of original lists included in MASD. (D) Number of interactions (d) and betweenness (B) of genes in MASD. (A–D) G: all genes included in the PPI network.
Pathway Analysis of Gene Lists Associated with ASDs
We carried out an over-representation analysis to characterize original gene lists and network-based gene lists in terms of pathways. We observed significant pathways (at adjusted p < 0.01) in only two of the six original gene lists (SFARIhi and dnCNVni) and in five network-based lists (SFARIh, mMUT, rCNV, dnCNV3s, and dnCNVn) (Supplementary Table 6). Overall, we obtained a much higher number of pathways in network-based lists than in original ones, despite the number of tested genes was similar between the former and the latter ones. Therefore, the observed enrichment in pathways can be mainly brought back to the network-based analysis, since, by definition, it prioritizes genes functionally related to those considered in input. Further, apart from a single exception in SFARIh, pathways found only in original lists were similar, in terms of gene content, to pathways found also in network-based lists (Figures 7A–F). In other words, network-based analysis resulted in an enrichment at pathway level with a very limited loss of information. Interestingly, pathways found in original gene lists, and lost due to genes for which network-based analysis was not applicable, were recovered by network-based analysis (compare rows labeled with suffix “i”, “n0”, and “n*” in Figure 7F).
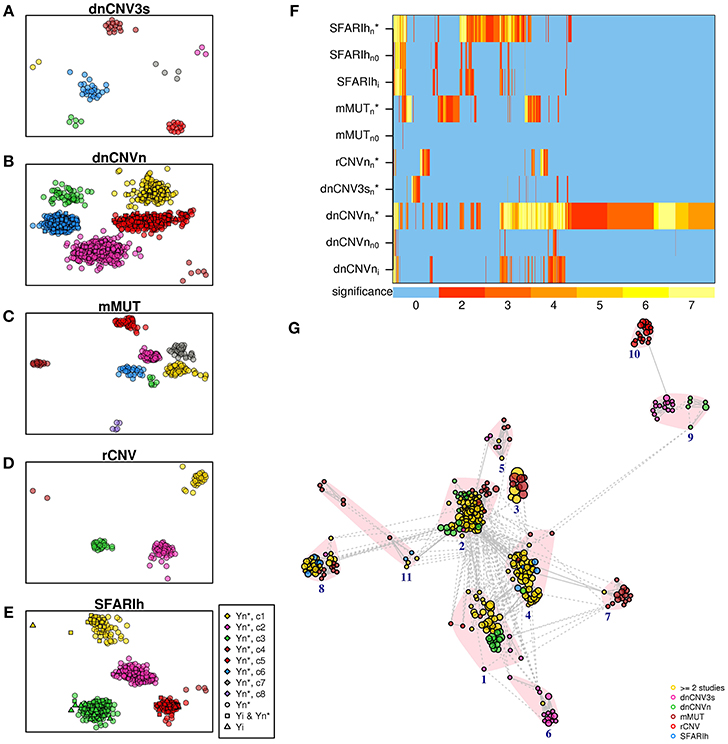
Figure 7. Significant pathways enriched in genes associated with ASD. (A–E) Pathways found in the analysis of each original list (i) and corresponding predicted genes (n*). (F) Heatmap of all the pathways found in the analysis of the lists reported on the rows; also pathways found analyzing the original lists without genes not occurring in the STRING network (n0) are represented; the color bar indicates the −log10(p) of the hypergeomtric p-value, adjusted for multiple hypothesis testing; the number 7 indicates p ≤ 10−7. (G) Enrichment map; vertex size is proportional to pathway significance (adjusted p-value); links are reported only for overlap coefficients >0.5; for each pathway, only the links with the top 5 most similar pathways are drawn. (A–G) See Supplementary Table 6.
We summarized the significant pathways found in each lists in a unique pathway network, the so-called enrichment map (Merico et al., 2010). Specifically, we took into account up to 20 of the most significant pathways as representatives of each pathway cluster found in each list. This selection resulted in a total of 366 pathways, clustered in 11 groups: transmission across synapses (clusters 1 and 4), signal transduction (2), Rho GTPase and apoptosis (3), inositol phosphate metabolism (5), ER-associated degradation process (6), ion transport (7), chromatin remodeling (8), oxygen transport (9), proteoglycan biosynthesis (10) and Wnt signaling (11). While the majority of pathways were found in more than 1 list (Figure 7G, yellow circles), some pathway clusters were composed of pathways uniquely associated with one list. For instance, proteoglycan biosynthesis was specifically associated with rCNV, ion transport with mMUT, oxygen transport with dnCNV3s and dnCNVn.
Discussion
Recently, the knowledge of molecular interactions has been used for the interpretation of genetic data on ASDs. In comparison to previous works, we analyzed multiple ASD risk gene lists proposed in large studies, for a total of approximately 1,000 genes. We observed a low overlap between ASD risk gene lists. Whether this heterogeneity reflects the biology of ASD or is the result of confounding factors, the analysis of network proximity between genes underlines the ASD risk genes that are also in functional relation and lead to the identification of modules of functionally related genes hit by genetic variations. The main limitation of a network-based analysis such as ours is the availability of a priori annotations required for the definition of the genome-scale network. In this work we considered both direct (physical) and indirect (functional) high confidence PPI from STRING, which allowed us to analyze 11,535 human genes. Note that the use of direct and indirect STRING interactions showed good performances in prioritizing candidate disease genes (Köhler et al., 2008). Moreover, unlike other network-based works on ASD genetic data, we used network diffusion to quantify network proximity between ASD risk genes and other genes. Network diffusion (a global approach) considers the whole network topology in its full complexity and, therefore, has better performances than local approaches (e.g., direct neighborhood or shortest path length; Wang et al., 2011). Lastly, we underlined ASD risk gene modules without constraining the search to topological communities. In fact, there is no guarantee that topological communities are able to capture disease modules (Ghiassian et al., 2015). Hence, we quantified the significance of the observed network proximity scores in comparison to random networks of the same degree distribution (Bersanelli et al., 2016).
Our work provides a network-based prioritization of human genes associated with ASD by previous studies. We extracted a module of 244 genes in network proximity to genes reported in SFARI as strongly associated with ASD. Interestingly, the module contains a significant number of genes proposed as possibly involved in ASD (categorized as “minimal evidence” and “hypothesized” in SFARI) and another 93 genes not scored in SFARI (Supplementary Table 2). While this manuscript was under review, 3 of these 93 genes were included in SFARI independently from our study.
From the 93 genes, 16 genes are involved in synaptogenesis and synaptic plasticity or transmission, and alterations in structure and function of neuronal synapses are well known causes of ASD. Among these, APLP2 also regulates proper progression of neuronal differentiation program during cortical development (Shariati et al., 2013), is involved in Alzheimer disease and interacts with CNTN in neurodevelopment and diseases (Osterfield et al., 2008). Then again, the 3 genes, CACNA2D1, CACNB1, CACNG1 induce the repression of the downstream regulatory element antagonist modulator (DREAM) and the expression of the neuropeptide dynorphin (DYN). DREAM plays a role in synaptic plasticity and behavioral memory (Wu et al., 2010), while DYN is involved in behavioral symptoms characteristic of human depressive disorders (Knoll and Carlezon, 2010). Also CACNG3, a calcium channel protein, regulates the function of AMPA-selective glutamate receptors and mediates synaptic transmission in CNS while FLRT3 takes part in a trans-synaptic complex (Lu et al., 2015). Eight genes are involved in neuronal differentiation, neurodevelopment and neuronal function. More specifically, AKT1 is a downstream mediator of the PI3K pathway that regulates synaptic formation and plasticity and which imbalance leads to autism and schizophrenia (Enriquez-Barreto and Morales, 2016); genetic variations in contactins (CNTN) have been described in association with neurodevelopmental disorders, including autism. Specifically, CNTN1 and CNTN2 are members of the presynaptic NRXN superfamily and 13 rare non-synonymous variants of CNTN2 have been found in ASDs patients while mice with Cntn5 mutations show an abnormal audiogenic response due to defects in the formation of synapse in auditory neurons (Cottrell et al., 2011; Chen et al., 2014).
Many of the 93 genes are involved in syndromic comorbidities, including auditory and visual senses deficit, epilepsy, mental retardation and psychiatric conditions that affect nearly three-quarters of children with ASD. For instance, CAMK2G and PDZD7 are involved in Usher Syndrome the most common condition leading to deafness and blindness, as well as DNMT1 has a role in DNMT1-Related Dementia, Deafness, and Sensory Neuropathy (Vernon and Rhodes, 2009) and LRTOMT in deafness. Again, MYL7 mutations are associated with Fechtner Syndrome which features include hearing loss and eye abnormalities. SP4 is involved in bipolar disorder and schizophrenia while ANK3, ACSL4, DLG3 are associated with mental retardation and, interestingly, recalling the high male prevalence of ASD, the latter two map on X-cromosome; NHS also maps on X-cromosome and mutations in this gene cause Nance-Horan Syndrome characterized by congenital cataract leading to vision loss; in males mild or moderate mental retardation may also occur and ASD have also been described in few patients (Toutain et al., 1997). Mutations in NAGLU and HGSNAT cause the Sanfilippo Syndrome (also called mucopolysaccharidosis Type III) often misdiagnosed with idiopathic developmental delay, attention deficit/hyperactivity disorder and/or ASD (Wijburg et al., 2013). QDPR mutations provoke hyperphenylalaninemia (Trujillano et al., 2014), (also called atypical phenylchetonuria (PKU), a genetic metabolic disease provoking postnatal cognitive deficit due to the neurotoxic effect of hyperphenylalaninemia; interestingly, PKU could be a comorbid condition of ASD, although with low prevalence (Baieli et al., 2003). MKRN3 is associated with Prader Willy Syndrome, NPAP1 both with Prader Willy Syndrome and Angelman Syndrome while DSCAML1 with Down Syndrome. These syndromes are characterized by mental retardation and can have co-occurring ASDs (Peters et al., 2004; Capone et al., 2005; Dykens et al., 2011). KMT2D and WDR5 defects are involved in Kabuki Syndrome characterized by multiple congenital abnormalities, from mild to severe developmental delay and intellectual disability. People suffering from this syndrome may also manifest seizures, hypotonia, strabism, hear infections, hearing loss and autism (Parisi et al., 2015). The very rare mutations in MANBA results in β-mannosidosis with a severe neurological disorder that can include mental retardation, cerebellar ataxia along with visual and hearing deficits (Sabourdy et al., 2009). CACNG3 is involved in Childhood Absence Epilepsy and is also associated with some cases of ASD (Danielsson et al., 2005) while mutations of KATNB1 cause complex cerebral malformations (Mishra-Gorur et al., 2014).
The remaining genes (among the 93) are mostly involved in epigenetics, cell cycle and cell adhesion and some of them are also implicated in tumor development as already reported by Crespi (2011) and Crawley et al. (2016).
The network-based analysis of genes from SFARI and other 5 previous studies resulted in the definition of a gene module that involves 561 ASD risk genes in significant functional relation. The module contains all the considered SFARI genes (strongly associated with ASD) and from 40% to 70% of genes from each of the other lists of ASD risk genes. Therefore, this module can be seen as a further screening of the genes proposed by such studies, which underlined those in significant functional relation from a network perspective.
More generally, the network-based scores that we calculated for every gene in the considered STRING network can be used to quantify the functional relation between any gene and ASD risk genes found in one or more previous studies.
Biological pathways enriched in genes in network proximity to ASD risk genes encompass several functions already proposed to be associated with ASD (see, for example, Pinto et al., 2010). Network-based analysis, through the prioritization of functionally related genes, enriched the number of significant pathways found by ORA in comparison to the analysis of original gene lists. Despite not all genes occurring in original lists underwent network-based analysis, the latter was not affected by a loss of information at pathway level.
The predicted genes in network proximity to ASD risk genes that have a central role in the PPI networks, but SRC, mapped in ASD risk loci. SFARI Gene database lists all the studies reporting CNV at the chromosome bands where predicted genes are localized (Table 4). In many reports, the CNV of interest was subsequently confirmed or validated by an independent method following its discovery. Additionally, from a functional point of view, most of the predicted genes are involved in epigenetics, cell cycle, growth-, proliferation- and differentiation-signaling and are often implicated in cancer development. This finding indicates pleotropic effects of some autism-associated genes on cancer risk and is supported by previous discussions that highlight a wide overlap in risk genes and pathways for cancer and autism (Crespi, 2011; Crawley et al., 2016). Advances in pharmacological therapies to ameliorate autism symptoms could be resulted from cancer drugs that target the same growth-signaling pathways (Crespi, 2011).
Author Contributions
EM collected the ASD data from the literature, setup and run the analyses; MB curated the physical mathematical modeling of network diffusion; MG and MM managed the high performance computing infrastructure; GC supported the physical mathematical modeling; LM coordinated the research; AM analyzed the ASD literature, interpreted the biological results, coordinated the research. All authors discussed the results, contributed to manuscript writing and revision.
Funding
The work has been supported by: the EU FP7 project “MIMOmics” (305280); the Italian Ministry of Education, University and Research (MIUR) projects “INTEROMICS” (PB05) and “PRIN 2015”; the Lombardy Region Foundation FRRB project “LYRA” (2015-0010).
Conflict of Interest Statement
The authors declare that the research was conducted in the absence of any commercial or financial relationships that could be construed as a potential conflict of interest.
Acknowledgments
We would like to thank John Hatton (CNR-ITB) for proofreading the manuscript.
Supplementary Material
The Supplementary Material for this article can be found online at: http://journal.frontiersin.org/article/10.3389/fgene.2017.00129/full#supplementary-material
References
Abrahams, B. S., Arking, D. E., Campbell, D. B., Mefford, H. C., Morrow, E. M., Weiss, L. A., et al. (2013). SFARI gene 2.0: a community-driven knowledgebase for the autism spectrum disorders (ASDs). Mol. Autism 4:36. doi: 10.1186/2040-2392-4-36
Amberger, J. S., Bocchini, C. A., Schiettecatte, F., Scott, A. F., and Hamosh, A. (2015). Omim.org: online mendelian inheritance in man (omim), an online catalog of human genes and genetic disorders. Nucleic Acids Res. 43, D789–D798. doi: 10.1093/nar/gku1205
Anderson, G. R., Galfin, T., Xu, W., Aoto, J., Malenka, R. C., and Sdhof, T. C. (2012). Candidate autism gene screen identifies critical role for cell-adhesion molecule caspr2 in dendritic arborization and spine development. Proc. Natl. Acad. Sci. U.S.A. 109, 18120–18125. doi: 10.1073/pnas.1216398109
Baieli, S., Pavone, L., Meli, C., Fiumara, A., and Coleman, M. (2003). Autism and phenylketonuria. J. Autism Dev. Disord. 33, 201–204 doi: 10.1023/A:1022999712639
Barabási, A. L., Gulbahce, N., and Loscalzo, J. (2011). Network medicine: a network-based approach to human disease. Nat. Rev. Genet. 12, 56–68. doi: 10.1038/nrg2918
Berryer, M. H., Hamdan, F. F., Klitten, L. L., Mller, R. S., Carmant, L., Schwartzentruber, J., et al. (2013). Mutations in syngap1 cause intellectual disability, autism, and a specific form of epilepsy by inducing haploinsufficiency. Hum. Mutat. 34, 385–394. doi: 10.1002/humu.22248
Bersanelli, M., Mosca, E., Remondini, D., Castellani, G., and Milanesi, L. (2016). Network diffusion-based analysis of high-throughput data for the detection of differentially enriched modules. Sci. Rep. 6:34841. doi: 10.1038/srep34841
Brown, G. R., Hem, V., Katz, K. S., Ovetsky, M., Wallin, C., Ermolaeva, O., et al. (2015). Gene: a gene-centered information resource at NCBI. Nucleic Acids Res. 43, D36–D42. doi: 10.1093/nar/gku1055
Capone, G. T., Grados, M. A., Kaufmann, W. E., Bernad-Ripoll, S., and Jewell, A. (2005). Down syndrome and comorbid autism-spectrum disorder: characterization using the aberrant behavior checklist. Am. J. Med. Genet. A 134, 373–380. doi: 10.1002/ajmg.a.30622
Chen, J., Yu, S., Fu, Y., and Li, X. (2014). Synaptic proteins and receptors defects in autism spectrum disorders. Front. Cell. Neurosci. 8:276. doi: 10.3389/fncel.2014.00276
Chien, W. H., Gau, S. S. F., Liao, H. M., Chiu, Y. N., Wu, Y. Y., Huang, Y. S., et al. (2013). Deep exon resequencing of dlgap2 as a candidate gene of autism spectrum disorders. Mol. Autism 4:26. doi: 10.1186/2040-2392-4-26
Cottrell, C. E., Bir, N., Varga, E., Alvarez, C. E., Bouyain, S., Zernzach, R., et al. (2011). Contactin 4 as an autism susceptibility locus. Autism Res. 4, 189–199. doi: 10.1002/aur.184
Crawley, J. N., Heyer, W.-D., and LaSalle, J. M. (2016). Autism and cancer share risk genes, pathways, and drug targets. Trends Genet. 32, 139–146. doi: 10.1016/j.tig.2016.01.001
Cristino, A., Williams, S., Hawi, Z., An, J., Bellgrove, M., Schwartz, C., et al. (2014). Neurodevelopmental and neuropsychiatric disorders represent an interconnected molecular system. Mol. Psychiatry 19, 294–301 doi: 10.1038/mp.2013.16
Danielsson, S., Gillberg, I. C., Billstedt, E., Gillberg, C., and Olsson, I. (2005). Epilepsy in young adults with autism: a prospective population-based follow-up study of 120 individuals diagnosed in childhood. Epilepsia 46, 918–923. doi: 10.1111/j.1528-1167.2005.57504.x
Devlin, B., and Scherer, S. W. (2012). Genetic architecture in autism spectrum disorder. Curr. Opin. Genet. Dev. 22, 229–237. doi: 10.1016/j.gde.2012.03.002
Dykens, E. M., Lee, E., and Roof, E. (2011). Prader-willi syndrome and autism spectrum disorders: an evolving story. J. Neurodev. Disord. 3, 225–237. doi: 10.1007/s11689-011-9092-5
Enriquez-Barreto, L., and Morales, M. (2016). The pi3k signaling pathway as a pharmacological target in Autism related disorders and Schizophrenia. Mol. Cell. Ther. 4, 2. doi: 10.1186/s40591-016-0047-9
Geer, L. Y., Marchler-Bauer, A., Geer, R. C., Han, L., He, J., He, S., et al. (2010). The NCBI biosystems database. Nucleic Acids Res. 38, D492–D496. doi: 10.1093/nar/gkp858
Ghiassian, S. D., Menche, J., and Barabási, A. L. (2015). A disease module detection (diamond) algorithm derived from a systematic analysis of connectivity patterns of disease proteins in the human interactome. PLoS Comput. Biol. 11:e1004120. doi: 10.1371/journal.pcbi.1004120
Gilman, S. R., Iossifov, I., Levy, D., Ronemus, M., Wigler, M., and Vitkup, D. (2011). Rare de novo variants associated with autism implicate a large functional network of genes involved in formation and function of synapses. Neuron 70, 898–907 doi: 10.1016/j.neuron.2011.05.021
Köhler, S., Bauer, S., Horn, D., and Robinson, P. N. (2008). Walking the interactome for prioritization of candidate disease genes. Am. J. Hum. Genet. 82, 949–958. doi: 10.1016/j.ajhg.2008.02.013
Knoll, A. T., and Carlezon, W. A. (2010). Dynorphin, stress, and depression. Brain Res. 1314, 56–73. doi: 10.1016/j.brainres.2009.09.074
Levy, D., Ronemus, M., Yamrom, B., Lee, Y.-,h., Leotta, A., Kendall, J., et al. (2011). Rare de novo and transmitted copy-number variation in autistic spectrum disorders. Neuron 70, 886–897. doi: 10.1016/j.neuron.2011.05.015
Li, J., Shi, M., Ma, Z., Zhao, S., Euskirchen, G., Ziskin, J., et al. (2014). Integrated systems analysis reveals a molecular network underlying autism spectrum disorders. Mol. Syst. Biol. 10:774 doi: 10.15252/msb.20145487
Lu, Y. C., Nazarko, O. V., Sando, R., Salzman, G. S., Sdhof, T. C., and Ara. (2015). Structural basis of latrophilin-flrt-unc5 interaction in cell adhesion. Structure 23, 1678–1691. doi: 10.1016/j.str.2015.06.024
Merico, D., Isserlin, R., Stueker, O., Emili, A., and Bader, G. D. (2010). Enrichment map: a network-based method for gene-set enrichment visualization and interpretation. PLoS ONE 5:e13984. doi: 10.1371/journal.pone.0013984
Miles, J. H. (2011). Autism spectrum disorders–a genetics review. Genet. Med. 13, 278–294. doi: 10.1097/GIM.0b013e3181ff67ba
Mishra-Gorur, K., Caglayan, A. O., Schaffer, A. E., Chabu, C., Henegariu, O., Vonhoff, F., et al. (2014). Mutations in KATNB1 cause complex cerebral malformations by disrupting asymmetrically dividing neural progenitors. Neuron 84, 1226–1239. doi: 10.1016/j.neuron.2014.12.014
Mitra, K., Carvunis, A. R., Ramesh, S. K., and Ideker, T. (2013). Integrative approaches for finding modular structure in biological networks. Nat. Rev. Genet. 14, 719–732. doi: 10.1038/nrg3552
Monaco, A. P., and Bailey, A. J. (2001). Autism. The search for susceptibility genes. Lancet 358(Suppl. S3). doi: 10.1016/S0140-6736(01)07016-7
National Institute of Mental Health (2013). Autism Spectrum Disorder. Available online at: https://www.nimh.nih.gov/health/topics/autism-spectrum-disorders-asd/index.shtml
Neale, B. M., Kou, Y., Liu, L., Ma'ayan, A., Samocha, K. E., Sabo, A., et al. (2012). Patterns rates of exonic de novo mutations in autism spectrum disorders. Nature 485, 242–245. doi: 10.1038/nature11011
Noh, H. J., Ponting, C. P., Boulding, H. C., Meader, S., Betancur, C., Buxbaum, J. D., et al. (2013). Network topologies and convergent aetiologies arising from deletions and duplications observed in individuals with autism. PLoS Genet. 9:e1003523 doi: 10.1371/journal.pgen.1003523
O'Roak, B. J., Vives, L., Girirajan, S., Karakoc, E., Krumm, N., Coe, B. P., et al. (2012). Sporadic autism exomes reveal a highly interconnected protein network of de novo mutations. Nature 485, 246–250. doi: 10.1038/nature10989
Osterfield, M., Egelund, R., Young, L. M., and Flanagan, J. G. (2008). Interaction of amyloid precursor protein with contactins and NgCAM in the retinotectal system. Development 135, 1189–1199. doi: 10.1242/dev.007401
Parisi, L., Di Filippo, T., and Roccella, M. (2015). Autism spectrum disorder in kabuki syndrome: clinical, diagnostic and rehabilitative aspects assessed through the presentation of three cases. Minerva Pediatr. 67, 369–375.
Peters, S. U., Beaudet, A. L., Madduri, N., and Bacino, C. A. (2004). Autism in angelman syndrome: implications for autism research. Clin. Genet. 66, 530–536. doi: 10.1111/j.1399-0004.2004.00362.x
Pinto, D., Delaby, E., Merico, D., Barbosa, M., Merikangas, A., Klei, L., et al. (2014). Convergence of genes and cellular pathways dysregulated in autism spectrum disorders. Am. J. Hum. Genet. 94, 677–694. doi: 10.1016/j.ajhg.2014.03.018
Pinto, D., Pagnamenta, A. T., Klei, L., Anney, R., Merico, D., Regan, R., et al. (2010). Functional impact of global rare copy number variation in autism spectrum disorders. Nature 466, 368–372. doi: 10.1038/nature09146
Sabourdy, F., Labauge, P., Stensland, H. M. F. R., Nieto, M., Garc, V. L., Renard, D., et al. (2009). A manba mutation resulting in residual beta-mannosidase activity associated with severe leukoencephalopathy: a possible pseudodeficiency variant. BMC Med. Genet. 10:84. doi: 10.1186/1471-2350-10-84
Safran, M., Chalifa-Caspi, V., Shmueli, O., Olender, T., Lapidot, M., Rosen, N., et al. (2003). Human gene-centric databases at the Weizmann institute of science: genecards, UDB, CroW 21 and HORDE. Nucleic Acids Res. 31, 142–146. doi: 10.1093/nar/gkg050
Sanders, S. J., Ercan-Sencicek, A. G., Hus, V., Luo, R., Murtha, M. T., Moreno-De-Luca, D., et al. (2011). Multiple recurrent de novo cnvs, including duplications of the 7q11.23 williams syndrome region, are strongly associated with Autism. Neuron 70, 863–885. doi: 10.1016/j.neuron.2011.05.002
Sanders, S. J., Murtha, M. T., Gupta, A. R., Murdoch, J. D., Raubeson, M. J., Willsey, A. J., et al. (2012). De novo mutations revealed by whole-exome sequencing are strongly associated with autism. Nature 485, 237–241. doi: 10.1038/nature10945
Shariati, S. A. M., Lau, P., Hassan, B. A., Mller, U., Dotti, C. G., De Strooper, B., et al. (2013). APLP2 regulates neuronal stem cell differentiation during cortical development. J. Cell Sci. 126, 1268–1277. doi: 10.1242/jcs.122440
Smalley, S. L. (1998). Autism and tuberous sclerosis. J. Autism Dev. Disord. 28, 407–414. doi: 10.1023/A:1026052421693
Szklarczyk, D., Franceschini, A., Wyder, S., Forslund, K., Heller, D., Huerta-Cepas, J., et al. (2015). String v10: protein-protein interaction networks, integrated over the tree of life. Nucleic Acids Res. 43, D447–D452. doi: 10.1093/nar/gku1003
Toutain, A., Ronce, N., Dessay, B., Robb, L., Francannet, C., Le Merrer, M., et al. (1997). Nance-horan syndrome: linkage analysis in 4 families refines localization in Xp22.31-p22.13 region. Hum. Genet. 99, 256–261. doi: 10.1007/s004390050349
Trujillano, D., Perez, B., Gonzz, J., Tornador, C., Navarrete, R., Escaramis, G., et al. (2014). Accurate molecular diagnosis of phenylketonuria and tetrahydrobiopterin-deficient hyperphenylalaninemias using high-throughput targeted sequencing. Eur. J. Hum. Genet. 22, 528–534. doi: 10.1038/ejhg.2013.175
Vernon, M., and Rhodes, A. (2009). Deafness and autistic spectrum disorders. Am. Ann. Deaf 154, 5–14.
Volmar, C.-H., and Wahlestedt, C. (2015). Histone deacetylases (HDACs) and brain function. Neuroepigenetics 1, 20–27. doi: 10.1016/j.nepig.2014.10.002
Wang, X., Gulbahce, N., and Yu, H. (2011). Network-based methods for human disease gene prediction. Brief. Funct. Genomics 10, 280–293. doi: 10.1093/bfgp/elr024
Wijburg, F. A., Wegrzyn, G., Burton, B. K., and Tylki-Szymanska, A. (2013). Mucopolysaccharidosis type III (Sanfilippo Syndrome) and misdiagnosis of idiopathic developmental delay, attention deficit/hyperactivity disorder or autism spectrum disorder. Acta Paediatr. 102, 462–470. doi: 10.1111/apa.12169
Wu, L.-J., Mellstrm, B., Wang, H., Ren, M., Domingo, S., Kim, S. S., et al. (2010). Dream (downstream regulatory element antagonist modulator) contributes to synaptic depression and contextual fear memory. Mol. Brain 3:3. doi: 10.1186/1756-6606-3-3
Keywords: autism spectrum disorder, biological networks, network diffusion, data integration, gene module
Citation: Mosca E, Bersanelli M, Gnocchi M, Moscatelli M, Castellani G, Milanesi L and Mezzelani A (2017) Network Diffusion-Based Prioritization of Autism Risk Genes Identifies Significantly Connected Gene Modules. Front. Genet. 8:129. doi: 10.3389/fgene.2017.00129
Received: 08 March 2017; Accepted: 04 September 2017;
Published: 25 September 2017.
Edited by:
Rosalba Giugno, University of Verona, ItalyReviewed by:
Nicola Ancona, Institute of Intelligent Systems for Automation, Consiglio Nazionale Delle Ricerche (CNR), ItalyGiovanni Ciriello, University of Lausanne, Switzerland
Copyright © 2017 Mosca, Bersanelli, Gnocchi, Moscatelli, Castellani, Milanesi and Mezzelani. This is an open-access article distributed under the terms of the Creative Commons Attribution License (CC BY). The use, distribution or reproduction in other forums is permitted, provided the original author(s) or licensor are credited and that the original publication in this journal is cited, in accordance with accepted academic practice. No use, distribution or reproduction is permitted which does not comply with these terms.
*Correspondence: Ettore Mosca, ettore.mosca@itb.cnr.it