Apparent Quantum Efficiency Spectra for Superoxide Photoproduction and Its Formation of Hydrogen Peroxide in Natural Waters
 Leanne C. Powers
 William L. Miller
- 1Department of Marine Science, Skidaway Institute of Oceanography, University of Georgia, Savannah, GA, USA
- 2Department of Marine Science, University of Georgia, Athens, GA, USA
Superoxide () is a key intermediate in the cycling of organic matter and trace metals in natural waters but production rates are difficult to determine due to low steady-state concentrations, rapid decay rates, and unstable standards. On the other hand, superoxide's dismutation product, hydrogen peroxide (H2O2), is relatively stable in filtered water. Thus, if the stoichiometry between and H2O2 is known, one can derive superoxide data from H2O2 measurements. The relationship between and H2O2 remains uncertain in seawater but work by Petasne and Zika (1987) presented a method for examining the relationship between and H2O2 during irradiations of coastal seawater using superoxide dismutase (SOD), which forces a 2:1 stoichiometry between and H2O2. Here we report the first apparent quantum yield (AQY) spectra following their approach; performing irradiations of various fresh and seawater samples and measuring H2O2 accumulation with and without added SOD. For all but a single riverine sample, H2O2 AQY spectra fell in a narrow range, but AQY spectra varied such that :H2O2 ratios were always >2 and were highest for the clear waters of the Gulf Stream (~3.4 per H2O2 generated). Because this approach eliminates the need to measure production rates directly, it represents a simple way to refine the stoichiometric relationships that would potentially allow global estimates of photoproduction rates, steady-state concentrations ([]ss), and related surface ocean redox reactions based on more manageable H2O2 photochemical studies.
Introduction
It is well-known that hydrogen peroxide (H2O2) in natural waters largely results from thermal reactions involving superoxide () (Kieber et al., 2003). Ever since Bielski and coworkers (Bielski and Allen, 1977; Bielski, 1978; Bielski et al., 1985) reported rate constants for many superoxide reactions in aqueous solutions, it has long been assumed that the H2O2 in seawater primarily results from disproportionation, giving a stoichiometry of two consumed for each H2O2 generated (Bielski et al., 1985). Zafiriou et al. (1990) subsequently published the first pH-dependent dismutation decay constant in seawater (kD; M−1 s−1), which agreed well with that reported for pure water by Bielski et al. (1985). Additionally, H2O2 photochemical production is temperature dependent (Szymczak and Waite, 1988; Kieber et al., 2014), providing further evidence for a dominant role for a thermal reaction such as dismutation in H2O2 production. In 0.2 μm filtered seawater, H2O2 is relatively stable (Cooper et al., 1989) relative to its precursor, , making H2O2 much easier to quantify. Thus, studies have often inferred formation rates by measuring H2O2 formation rates, primarily in photochemical exposures of colored dissolved organic matter (CDOM), and assuming a 2 :1 H2O2 stoichiometry between the two species (e.g., Powers and Miller, 2014).
Because acts as both an oxidant and a reductant, it is a key intermediate in the cycling of trace metals and organic matter in natural waters (Kieber et al., 2003; Rose and Waite, 2006; Wuttig et al., 2013). As more work has been done investigating superoxide dynamics over the past several decades, it is clear that dismutation is not always the dominant fate of decay in natural waters. In fact, dominant routes can include reactions with iron, manganese, copper or CDOM (e.g., Voelker et al., 2000; Heller and Croot, 2010a,b; Wuttig et al., 2013) depending on the system. However, redox cycling of trace metals or CDOM can also result in the 2:1 stoichiometry typical of dismutation, and consequently a 2:1 stoichiometry should not always be assumed to reflect the dismutation of . Petasne and Zika (1987) were the first to report that a large fraction (24–41%) of photoproduction does not lead to its dismutation product H2O2 based on irradiations of coastal seawater with and without additions of the enzyme superoxide dismutase (SOD). SOD forces a 2:1 stoichiometry between and H2O2 with a rate constant of >109 M−1 s−1 (Cudd and Fridovich, 1982), which is more than 4 orders of magnitude larger than kD at the pH of seawater. Thus, monitoring the difference between H2O2 photoproduction in the presence and absence of SOD should provide insight into the pathways for loss. Furthermore, Garg et al. (2011) found that additions of SOD increased the concentrations of photoproduced H2O2 during irradiations of Suwannee River Fulvic Acid (SRFA) solutions and more recently Zhang and Blough (2016) found that the photoproduction rates of one-electron reducing intermediates (i.e., the precursor for ; Zhang et al., 2012) were 6–13 times greater than those for H2O2 in similar solutions of SRFA and other standard materials. In natural waters, Rusak et al. (2011) observed a ratio of 0.37 H2O2 per consumed but used unfiltered samples that are not reflective of solely photochemical production and abiotic decay. Powers et al. (2015) measured photochemical production of H2O2 and together via chemiluminescent detection, resulting in a stoichiometry between and H2O2 closer to 4:1 in seawater collected in the Gulf of Alaska.
It is clear that in order to fully understand the role of in marine biogeochemical cycling its production and decay must be modeled on global scales. We presented one such method to assess the photochemical production of both superoxide and hydrogen peroxide in early 2014 (Powers and Miller, 2014) by blending UV optics derived from remotely sensed ocean color data, modeled solar irradiances and H2O2 apparent quantum yield (AQY) spectra to generate monthly climatologies for both H2O2 and in open ocean seawater. The approach was novel as presented, but had several shortcomings. These included the method for determination of hydrogen peroxide AQY spectra, which describe the efficiency of its production as moles product produced divided by the moles photons absorbed by CDOM. An assumption of all AQY calculations based on a single time point measurement is that the product is generated as a linear function of photon dose. With these experiments, as done in Powers and Miller (2014), it is unclear whether this requirement is met, especially when a lack of reciprocity for H2O2 photoproduction over irradiation time has been reported elsewhere (Kieber et al., 2014; Powers et al., 2015). Results of SOD addition experiments were also variable in this study, so a 2:1 stoichiometry between and H2O2 was assumed and photoproduction rates were predicted using this stoichiometry together with the AQY for H2O2. To date, no direct AQY spectra have been published.
As the 30th anniversary of the Petasne and Zika (1987) study approaches, we have re-evaluated the portioning between and H2O2 and determined the first AQY spectra following their approach: irradiation of seawater samples and measurements of H2O2 production with and without added SOD. Because this method eliminates the need to measure production rates directly, it may therefore be a simple way to refine estimates of photoproduction rates and steady-state concentrations ([]ss) in the ocean.
Methods
Sample Collection and Handling
Surface seawater samples (~5 m) were collected in the South Atlantic Bight (SAB) off the coast of Georgia (GA), USA onboard the R/V Savannah in June 4–6, 2016 and locally off the Skidaway River Estuary (SRE) dock (July 20, 2016) and the Altamaha River (August 5, 2016) (Table 1). All sampling equipment (tubing, filters and containers) were acid-cleaned (overnight in 0.01 M HCl), Milli-Q water (Millipore; >18 MΩ) rinsed (5 times), and dried prior to sampling. Samples were filtered either directly from Niskin bottles or pumped through 0.2 μm filters (Whatman; Polycap-75AS) into 10 or 20 L acid-cleaned polyethylene carboys (Nalgene) and stored at 4°C until use, for a period of up to 1 month. Our experience indicates that storage for seawater samples does not impact sample optics or the photochemical production rates for H2O2 (Powers et al., 2015). While all equipment in contact with seawater samples was acid cleaned as described above and nitrile gloves were used in handling samples, the R/V Savannah and the laboratory was not equipped with special trace metal processing facilities and thus, limited trace metal contamination could be present.
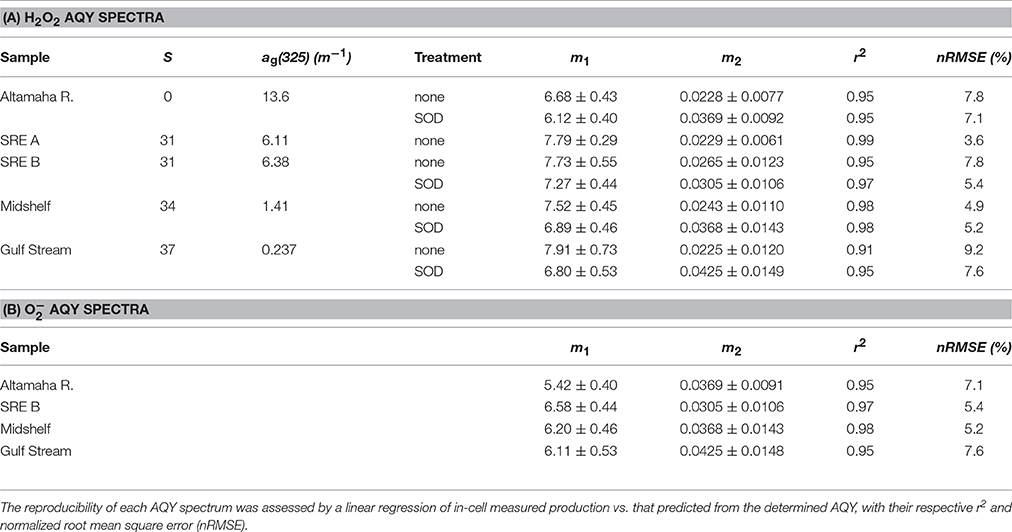
Table 1. Fitting parameters (m1 and m2 values ± their 95% confidence interval), salinity (S), and CDOM absorbance [ag(325) (m−1)] for all samples used in AQY determinations.
Hydrogen Peroxide Analysis
H2O2 was measured using a FeLume chemiluminescence (CL) system (Waterville Analytical) and modifications to the methods of King et al. (2007). Briefly, samples were mixed with 2 μM 10-methyl-9-(p-formylphenyl)-acridinium carboxylate trifluoromethanesulfonate (AE; provided by Dr. James J. Kiddle, Western Michigan University), which reacts with H2O2 to chemiluminesce at alkaline pH. A syringe was used to flush (≥1 mL) and fill a 195 μL Teflon sample loop (VICI 10-port valve) that was subsequently mixed with the AE reagent using a peristaltic pump (Rainin). The sample/carrier—AE mix was transported to a spiral flow cell (Global FIA) located in front of a photomultiplier tube (PMT; Hamamatsu HC135 PMT, 900 V, 400 ms integration) where it mixed with 0.1 M carbonate buffer to initiate CL. Decreased carbonate buffer pH (10.4) using 0.2 M HCl as the carrier prevented interference by precipitated Mg(OH)2 and helped decrease background CL. A ~2 mM H2O2 stock solution was prepared from 30% H2O2 (J. T. Baker) and measured weekly for stability using its absorbance (molar absorptivity 38.1 M−1 cm−1 at 240 nm; Miller and Kester, 1988) on a single beam UV-Vis spectrophotometer (Agilent) with Milli-Q as the absorbance blank. Standards were prepared in seawater samples matching those used in irradiations and were checked for low or undetectable H2O2 starting values against the same seawater with added catalase (20 μL of 100 units L−1 in 20 mL seawater; C100 Sigma-Aldrich). Under these conditions, the H2O2 detection limit, defined as three times the standard deviation of the blank, was 2 nM.
Photochemical Irradiations and Apparent Quantum Yield (AQY) Determination
Prior to irradiation experiments, each seawater sample was brought to room temperature and refiltered through a 0.2 μm membrane filter (described above) and portioned into two acid-clean and combusted (450°C for 5 h) 1 L borosilicate bottles (Kimax). For each sample, one bottle was left unamended and the other was treated with an addition of the enzyme superoxide dismutase (SOD; S7571-15KU, Sigma) immediately prior to irradiation. SOD was stored at −20°C when not in use, and a fresh stock solution of ~1.5 × 10⁷ U L−1 SOD (calculated from the manufacturer's reported activity) was prepared in Milli-Q and stored at 4°C for a period of up to 2 weeks. SOD activity was verified by monitoring photoproduction in the absence of SOD and subsequently observing no production in the presence of added SOD, using methods for superoxide described previously (Powers et al., 2015). 1.5 × 10⁴ Units L−1 SOD (based on the manufacturer's assay) was used for all 15-min irradiation experiments with added SOD.
All irradiations were performed using a Suntest CPS solar simulator equipped with a 1.5 kW xenon lamp (Atlas). For time series and initial rate determinations, the solar simulator was fitted with a window glass filter to simulate sunlight reaching the earth's surface (~295 nm and above). All samples were distributed into 15 matched 10 cm cylindrical quartz spectrophotometric cells, filled leaving no headspace, and sealed using gas-tight caps fitted with Teflon-faced, butyl rubber septa. Cells were placed vertically below the solar simulator into a black, water-cooled, aluminum irradiation block fitted with a one inch gray PVC lid with 1.6 cm diameter apertures directly above the cell windows to eliminate residual off-axis photons. The Al block maintained the samples at 20°C and allowed no transfer of light between cells during irradiation. For H2O2 AQY determination, wavelength dependent experiments were also performed by removing the window glass filter and aligning the block, and therefore each cell, under a variety of evenly spaced Schott long-band-pass filters (280, 295, 305, 320, 380, 425, and 480 nm 50% cutoff). One dark control was kept in the same irradiation block as other samples but with all irradiance blocked. Additional dark control sample cells were kept covered in the water bath. The spectral downwelling irradiance entering each cell, E0(λ) [mol(photons) m−2 s−1 nm−1], was quantified at 1 nm intervals with a UV-Vis portable spectroradiometer (OL756; Optronic Laboratories) fitted with a quartz fiber optic cable and 2″ diameter integrating sphere. The OL756 was calibrated with a NIST standard lamp (OL752-10 irradiance standard; Optronic Laboratories).
Accurate and precise measurements of CDOM absorbance (A) are critical in determining the photons absorbed in these irradiation experiments. Absorbance spectra from 250 to 800 nm were measured using an UltraPath liquid waveguide cell (World Precision Instruments; Miller et al., 2002) for the clear Gulf Stream sample, with a high powered UV-Vis light source (Hamamatsu) and a fiber optic assembly attached to a MAYA2000-Pro UV-Vis spectrometer (Ocean Optics). The liquid waveguide cell of the UltraPath provides a 2 m pathlength, with absorbance sensitivity 20 times greater than standard spectrophotometers holding 10 cm cuvettes. Blanks, cleaning protocols, and refractive index corrections for salinity changes were performed as in Stubbins et al. (2006). For all samples, absorbance in each 10 cm irradiation cell was also measured from 190 to 1100 nm with a single beam UV-Vis spectrophotometer (Agilent) both prior to and post irradiation at room temperature using Milli-Q water as the absorbance blank. Absorbance offsets (O) were determined by averaging raw absorbance spectra over the 700–800 nm range and were subsequently subtracted from absorbance spectra. All corrected absorbance (Acorr = A−O) were then converted to Napierian absorption coefficients [ag(λ); m−1] with the equation:
over the 250–700 nm range, where L (m) is the pathlength of the spectrophotometric or waveguide cell.
The photon dose absorbed by CDOM for each wavelength interval over the course of an experiment was calculated using the following equation (Hu et al., 2002):
where Qa is the mol photons absorbed s−1 by the sample, λ is wavelength (nm), E0 is irradiance entering the top of the cell (mols photons m−2 s−1), S is the irradiated surface area of the spectrophotometric cell (m2), ag and at are the absorption coefficients for CDOM and for the total solution respectively (m−1), and L is the pathlength of the spectrophotometric cell (m). The experimental photochemical production under each cutoff filter is defined according to the equation:
where the dP/dt is the measured production rate of the species in question (H2O2 here) per experiment. The intentional variation of Qa using multiple irradiation spectra gives production results that allow use of an in-house MATLAB® routine for iterative, non-linear fitting to solve for the single AQY spectrum that best describes the production measured under all of the cutoff filters for a single experiment with the following equation (Ziolkowski and Miller, 2007; Xie et al., 2009; White et al., 2010; Powers and Miller, 2015b):
where m1 and m2 are fitting parameters and 290 is a reference wavelength (nm). The statistical robustness of the determined AQY spectrum was analyzed using the r2 of a linear regression between measured [H2O2] in each sample cell vs. that predicted for each cell by the resulting AQY spectrum and spectral photon dose using Equation (3) (integrated from 280 to 600 nm) and by calculating the normalized root mean square error (nRMSE) between the two.
Results
Optimizing Irradiation Conditions for AQY Experiments
Using H2O2 measurements to provide production rates for use in AQY calculations requires a known :H2O2 reaction stoichiometry as discussed above. Like Petasne and Zika (1987), we used SOD to kinetically force the well-known 2:1 dismutation reaction described by Bielski et al. (1985). To ensure that all photochemically generated in our samples was catalyzed by SOD via the disproportionation reaction to H2O2, we measured photochemical H2O2 generation with a range of added SOD concentrations (Figure 1). SRE water, potentially containing higher levels of possible reactants with , was used to determine the concentration of SOD needed to kinetically out-compete all other possible reactions with and ensure the 2:1 dismutation stoichiometry during a 15-min irradiation. An asymptote for H2O2 production was noted in our SOD addition series, indicating that 3.0 × 10³ Units L−1 is all that it takes to ensure maximal H2O2 production. Consequently, we chose to add 1.5 × 10⁴ Units L−1 SOD (5 × this activity) to each sample in all subsequent irradiation experiments containing SOD.
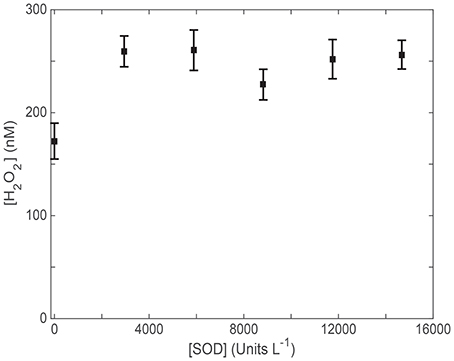
Figure 1. H2O2 (nM) generation during a 15 min irradiation of Skidaway River Estuarine (SRE) water with various concentrations of added superoxide dismutase (SOD; Units L−1 based on the manufacturer's assay).
It is also essential that SOD is not denatured, and maintains its activity for the duration of its exposure to sunlight. Previous tests performed during our work in the Gulf of Alaska (Powers et al., 2015) using SOD with direct measurements confirmed that SOD is not deactivated by extended exposure to maximum output of the Suntest CPS solar simulator, exhibiting about 3 × the photon flux used in the AQY experiments performed here. Seawater in water jacketed beakers with quartz covers containing added SOD of the activity levels shown in Figure 1 showed no measurable production throughout 60 min of constant exposure (Powers and Miller, 2014; Powers et al., 2015), indicating that SOD catalyzed dismutation continues at maximal rates in extended, full sun exposure. Consequently, results from our SOD-added experiments are assumed to represent H2O2 production exclusively via the SOD catalyzed disproportionation reaction.
One last critical issue for any accurate AQY calculation made using a single time point measurement is the assumption that photochemical production is linear to the point at which the sample is sacrificed and measured. As noted previously, H2O2 photochemical efficiency decreases with prolonged exposure (Kieber et al., 2014; Powers and Miller, 2015a). Therefore, to ensure H2O2 photoproduction was always a linear function of photon dose during our AQY experiments, we performed broadband irradiation of SRE water and plotted the resulting data against Qa(λ) integrated from 280 to 600 nm (mol photons absorbed) at each time point over the course of the irradiation (Figure 2). After ~2 h of irradiation, amounting to a photon dose of 0.15 mmol photons absorbed, H2O2 photoproduction slowed. Therefore, for all seawater irradiations used in AQY determinations in this study, we limited sample photon doses to 0.15 mmol photons absorbed or less.
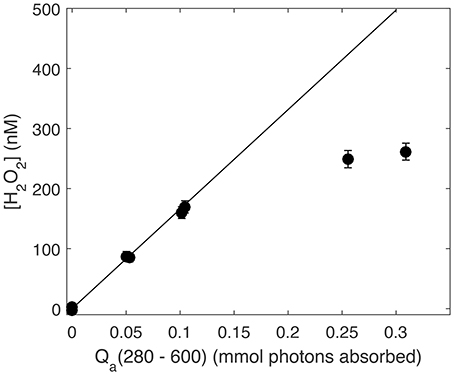
Figure 2. Photoproduced H2O2 (nM) vs. absorbed photon dose integrated from 280 to 600 nm (Qa, mmol photons absorbed). The solid line represents the linear production rate over the first hour of irradiation (absorbed photon dose of ~0.05 mmol photons) using only H2O2 at the first time point.
H2O2 Apparent Quantum Yield Spectra
Laboratory determined AQY spectra for all SAB seawater samples decreased monotonically from low UV to visible wavelengths and fell within a relatively narrow range (Figure 3; Table 1A). H2O2 AQY spectra for samples with no SOD treatment ranged from between 2.9 and 4.2 × 10⁻⁴ (mol H2O2 /mol photons absorbed) at 300 nm to between 0.24 and 0.37 × 10⁻⁴ (mol H2O2/mol photons absorbed) at 400 nm. The Altamaha River sample had the highest photochemical efficiency, with AQY values of 10 × 10−4 (mol H2O2/mol photons absorbed) and 1.0 × 10⁻⁴ (mol H2O2/mol photons absorbed) at 300 nm and 400 nm, respectively. With added SOD, the magnitude of the H2O2 AQY spectrum for all samples (riverine to Gulf Stream waters) increased in the UVB and to a lesser extent, in the UVA, resulting in higher slope coefficients (m2 values, Table 1). This increase was largest for Gulf Stream waters and lowest for the Altamaha River sample. The AQY spectrum determined for each sample was also used to predict photoproduced H2O2 in each sample cell (i.e., all light treatments). The resulting measured vs. predicted H2O2 correlations had r2 ≥ 0.95 and normalized root mean square errors (nRMSE) <8% for all but the untreated Gulf Stream sample (r2 = 0.91; nRMSE = 9.2%).
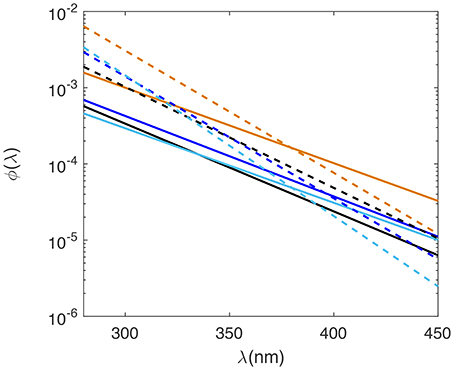
Figure 3. AQY spectra for hydrogen peroxide (solid lines) and superoxide (dashed lines) for Gulf Stream (light blue), Midshelf (dark blue), Skidaway River Estuary (black), and Altamaha River (orange) samples. Note AQY spectra are plotted on a log scale.
Superoxide:Hydrogen Peroxide Ratios
Superoxide photoproduction rates were determined by assuming that the 2:1 dispropotionation stoichiometry is valid in the presence of added SOD and the production rates are double those required to produce observed H2O2 (i.e., = 2 × H2O2). AQY spectra for were then determined by repeating the non-linear curve fitting routine using 2 × the H2O2 data for each sample cell containing added SOD and their respective Qa(λ) spectra (Table 1B). Ratios of to H2O2 photoproduction were then determined in two ways: a broadband estimate and an AQY estimate with both listed in Table 2. The broadband estimate was determined as the average ratio between 2 × H2O2 generated with added SOD to H2O2 generated with no treatment for samples under the 280 and 305 nm cutoff filters. The AQY estimate was determined from the slope of H2O2 with no SOD treatment compared to that with added SOD for all spectral treatments during the AQY experiment (Figure 4). The :H2O2 ratio was then determined as two divided by the slope of these regressions. Because the addition of SOD increased the H2O2 AQY spectra most in the UVB (i.e., <320 nm), :H2O2 ratios were always higher under 280 cutoff filters when compared to the ratio determined for samples under the 305 nm cutoff filters for all samples but the Altamaha River (Table 2). Linear regressions of H2O2 production with and without added SOD are shown in Figure 4. The slope coefficients for these regressions decrease with decreasing CDOM absorption [Table 2, ag(325) values listed in Table 1] ranging from 0.59 for the Gulf Stream sample to 1.07 for the Altamaha River sample. Results indicate that reductive and oxidative sinks are comparable for the Altamaha sample but, for the Gulf Stream sample, about ~40% of the superoxide generated does not lead to H2O2 formation.
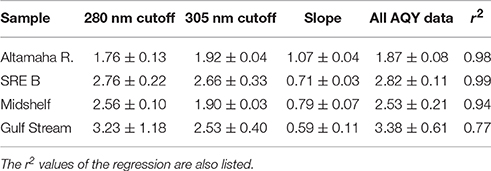
Table 2. :H2O2 ratios measured directly (under either the 280 or 305 nm cutoff filters, n = 2) or from all AQY experimental data and the slope of the regression of H2O2 generated without SOD vs. that with SOD (Ratio = 2 divided by the slope; regressions shown in Figure 4).
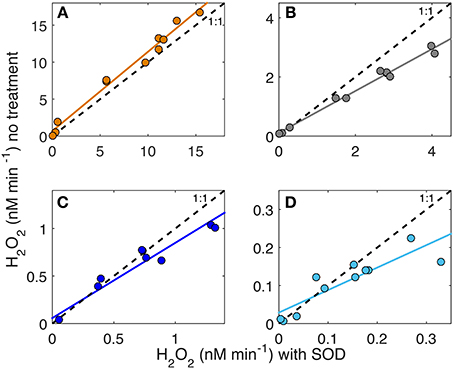
Figure 4. H2O2 (nM) generated in untreated samples vs. samples treated with added superoxide dismutase (SOD) in each AQY experiment under various light fields (cutoff filters) for the Altamaha River (A), Skidaway River Estuary (B), Midshelf (C), and the Gulf Stream (D) samples.
Discussion
Trends in H2O2 Photoproduction in Riverine to Offshore Waters
H2O2 AQY values fell in a narrow range for SAB seawater samples (i.e., from 1.7 to 2.3 × 10⁻⁴ at 325 nm) despite a much larger range in CDOM absorption coefficients (0.24 to 6.5 m−1 at 325 nm). Previous studies have found that the H2O2 AQY spectra were similar in various marine waters (Yocis et al., 2000; Kieber et al., 2014), suggesting that differences in AQY values between studies could be due to the large activation energy (Ea) for this wavelength and temperature dependent photoproduct (average Ea from 17 kJ mol−1 at 290 nm to 32 kJ mol−1 at 400 nm; Kieber et al., 2014). In contrast, Powers and Miller (2014) found lower H2O2 AQY spectra in oligotrophic waters compared to coastal waters. Because linear accumulation of H2O2 was not confirmed in this study, differences in AQY spectra could reflect differences in irradiation time and a lack of reciprocity for H2O2. However, higher H2O2 photochemical efficiency has generally been observed in freshwaters (Cooper et al., 1988; Moore et al., 1993; O'Sullivan et al., 2005) when compared to both coastal and open ocean seawater (e.g., Yocis et al., 2000; Kieber et al., 2014; Powers and Miller, 2014).
In our study, the H2O2 AQY for the Altamaha River was 5.4 ± 0.7 times larger at 325 nm than all SAB seawater samples at the same wavelength, despite having ag(325) values ranging from ~2 (SRE samples) to over 50 (Gulf stream) times larger (Table 1). The increased H2O2 AQY spectra for riverine water may reflect its terrestrial DOC source and a low exposure history. Zhang et al. (2014) demonstrated that the addition of phenol donors substantially increases the photoproduction of H2O2 from CDOM and Sharpless et al. (2014) have shown that prolonged irradiation tends to decrease CDOM electron donating capacity while having very little effect on electron accepting capacity. Perhaps the increased photoreactivity of the Altamaha River sample reflects an increased presence of phenolic compounds/electron donors, compared to seawater samples, even including the darker estuarine waters of the SRE. However, the reader is reminded that other factors in natural waters also impact H2O2 photoproduction efficiency including pH (Dalrymple et al., 2010) and metal chemistry (Shaked et al., 2010), as well as temperature (Kieber et al., 2014). Therefore, further mechanistic studies would be required to tease out the possible causes for variability in AQY spectra in various natural waters.
Relating H2O2 Measurements to Data
The best approach to evaluate superoxide photochemistry is to measure it directly. However, its instability in aqueous solutions creates a number of analytical limitations (Heller and Croot, 2010c), especially with regard to the determination of AQY spectra. Common methods to generate superoxide standards involve either UV-C generation of superoxide via a ketone/alcohol photolysis (McDowell et al., 1983; Rose et al., 2008; Powers et al., 2015) or additions of KO2 to alkaline solutions using trace metal clean techniques (Heller and Croot, 2010a,c; Diaz et al., 2013). Both methods generate μM concentrations of that allow direct monitoring via UV absorbance at 240 nm. Superoxide from standards is added to seawater in nanomolar amounts but doesn't last very long and subsequent monitoring of superoxide decay, most commonly via flow injection analysis with chemiluminescent detection (FIA-CL; Burns et al., 2012), is required for calibration of the system. Measuring photochemical superoxide production in seawater samples is subject to similar analytical difficulties arising from instability in seawater. FIA-CL requires precise and continuous pumping of the sample to a flow cell below the detector. Currently our irradiation system for AQY determinations does not facilitate direct measurement of from our individual, optically isolated, sealed spectrophotometric cells. Pumping samples would be limited to 30 ml and create an unacceptable optical condition, introducing a changing gas volume that would create undefined changes in refraction and reflection. Thus, as a practical alternative to direct measurements of for deriving AQY spectra, we calculated from the analysis of H2O2 with SOD additions. The effective use of SOD in this way is supported by reports of its stability in 0.2 μm filtered seawater (Petasne and Zika, 1987) and under solar radiation (Cooper and Zika, 1983; Draper and Crosby, 1983; Petasne and Zika, 1987) but it does lead to further consideration of both formation and decay mechanisms for superoxide in natural waters.
Previous work, using added phenol donors and borohydride reduction of CDOM prior to photochemical irradiations, has shown that the likely mechanism for superoxide photoproduction involves reaction of phenol electron donors with photo-excited triplet states of aromatic ketones within the DOM pool, generating ketyl radicals that react with O2 to form superoxide (Zhang et al., 2014, 2012). Additionally, Zhang et al. (2014) noted that the AQY for phenol loss was 2- to 10-fold higher than that observed for H2O2 production, consistent with superoxide formation rates greater than twice that for H2O2. In other words, their results are consistent with dominant superoxide decay involving oxidative pathways in the Suwannee River Fulvic and Humic Acid (SRFA and SRHA, respectively) solutions studied. A recent study by Zhang and Blough (2016) determined photoproduction rates of reducing intermediates using a nitroxyl radical probe to estimate the production rates of superoxide in SRFA and SRHA solutions. They observed production rates of reducing intermediates that were 13 times greater than those for H2O2 during polychromatic irradiations, similar to irradiation conditions in our study. Their results suggest that up to 67% of decays via oxidative pathways in these samples. Interestingly, we observed changes in the H2O2 AQY spectral shape with added SOD that may suggest additional oxidative pathways. Samples in our study showed increased efficiency in the UVB (<320 nm) and often the UVA (~340–360 nm) portion of the AQY spectrum (Figure 3). Consequently, all AQY spectra calculated using SOD additions, had steeper slopes than those observed for H2O2 without SOD. Since SOD should not alter photochemical formation mechanisms for , this apparent increase in efficiency at low wavelengths could represent a situation where SOD effectively outcompetes a natural phototransient oxidative sink generated by low UV wavelengths. This explanation is, of course, highly speculative and may simply represent natural variability in our AQY data. It does, however, suggest the presence of potential transient pathways for generated by UV solar radiation. The formation of sinks during photochemical irradiation still requires further study because direct photoproduction measurements made to date have been determined from measured steady-state concentrations during irradiation and dark decay post irradiation (e.g., Powers and Miller, 2015a; Powers et al., 2015) and raises the question “Do measurements of dark decay capture the complete story for redox pathways in sunlit surface waters?”
One potential proxy for partitioning superoxide sinks could be CDOM absorbance. The literature contains positive correlations between CDOM absorption coefficients and pseudo-first order decay constants for in coastal waters (Goldstone and Voelker, 2000) and negative correlations between H2O2 quantum yields and the E2/E3 ratio (i.e., absorbance at 254 nm divided by that at 365 nm) (Dalrymple et al., 2010). We could not verify the E2/E3 trend with our small sample size (r2 = 0.16) but did find a negative correlation between :H2O2 ratios and ag(325) (r2 = 0.69), albeit largely biased by a small sample set and high CDOM absorbance for the Altamaha sample. This approach may be of limited use even though our preliminary data suggests that the proportional oxidative sink for superoxide in blue water (:H2O2 ratio of 3.4) is far larger than coastal waters with higher CDOM. On the other hand, ratios reported for open ocean waters in the Gulf of Alaska (Powers et al., 2015) had a large range of :H2O2 ratios (2.2–9.8) in surface and mesopelagic (1000 m) waters despite low variability in CDOM absorption coefficients [ag(325) from 0.13 to 0.39 m−1]. Clearly, CDOM absorption should not be the only factor considered when estimating the relationship between and H2O2 photoproduction. Work by P. Croot's group (e.g., Heller and Croot, 2011, 2010a; Wuttig et al., 2013) has shown dominant pathways for decay to include copper (Southern Ocean), manganese, or CDOM (Tropical Atlantic). These factors and others (e.g., metal speciation, pH, temperature), that contribute to photoproduction and its subsequent decay to either O2 or H2O2 require further study.
From a practical point of view, it will require more than one stoichiometry if H2O2 AQY data is to be used to infer photoproduction data for large-scale photochemical models, even in the blue waters that dominate the world's oceans. For now, we can only say with confidence that for the majority of the world's oceans, an oxidative sink for is likely the dominant pathway for superoxide decay. Based on our limited data, instead of assuming that the 2:1 stoichiometry predicted from dismutation is the same as it ever was, a more reasonable estimate of open ocean :H2O2 stoichiometry is probably closer to 4:1. Previous calculations of photochemistry based on H2O2 measurements (or AQY data) that use a 2:1 :H2O2 stoichiometry probably are vast underestimates of true photoproduction rates in the surface ocean. Until future work allows us to understand the specific relationship (or lack thereof) between reactions and H2O2 production, global estimates of from H2O2 remain highly uncertain. Until such time, measurements of H2O2 photoproduction in the presence of sufficient SOD represent a convenient way to predict AQY spectra. Here we report only four AQY spectra from a range of natural waters, but encourage further use of this approach to amass the data required to address the variability in AQY spectra in blue waters that will support new and better global models of the photochemical redox chemistry driven by superoxide production.
Author Contributions
LP and WM both contributed to the experimental design of the work. LP carried out the experiments and data analysis. LP and WM contributed equally to interpretation of the work and drafting this manuscript.
Funding
This work was supported by NSF grant OCE-1234388 awarded to WM.
Conflict of Interest Statement
The authors declare that the research was conducted in the absence of any commercial or financial relationships that could be construed as a potential conflict of interest.
Acknowledgments
The authors would like to thank Courtney Bahrs and the captain and crew of the R/V Savannah for assistance with sample collection and in the laboratory. Some materials in this manuscript are based on work supported while WM was serving at the National Science Foundation.
References
Bielski, B. H. J. (1978). Reevaluation of the spectral and kinetic properties of HO2 and free radicals. Photochem. Photobiol. 28, 645–649. doi: 10.1111/j.1751-1097.1978.tb06986.x
Bielski, B. H. J., and Allen, A. O. (1977). Mechanism of the disproportionation of superoxide radicals. J. Phys. Chem. 81, 1048–1050. doi: 10.1021/j100526a005
Bielski, B. H. J., Cabelli, D. E., Arudi, R. L., and Ross, A. B. (1985). Reactivity of HO2/ radicals in aqueous solution. J. Phys. Chem. Ref. Data 14, 1041–1100. doi: 10.1063/1.555739
Burns, J. M., Cooper, W. J., Ferry, J. L., King, D. W., DiMento, B. P., McNeill, K., et al. (2012). Methods for reactive oxygen species (ROS) detection in aqueous environments. Aquat. Sci. 74, 683–734. doi: 10.1007/s00027-012-0251-x
Cooper, W. J., Lean, D. R. S., and Carey, J. H. (1989). Spatial and temporal patterns of hydrogen peroxide in lake waters. Can. J. Fish. Aquat. Sci. 46, 1227–1231. doi: 10.1139/f89-158
Cooper, W. J., and Zika, R. G. (1983). Photochemical formation of hydrogen peroxide in surface and ground waters exposed to sunlight. Science 220, 711–712. doi: 10.1126/science.220.4598.711
Cooper, W. J., Zlka, R., Petasne, R. G., and Plane, J. M. C. (1988). Photochemical formation of H202 in natural waters exposed to sunlight. Environ. Sci. Technol. 22, 1156–1160. doi: 10.1021/es00175a004
Cudd, A., and Fridovich, I. (1982). Electrostatic interactions in the reaction mechanism of bovine erythrocyte superoxide dismutase. J. Biol. Chem. 257, 11443–11447.
Dalrymple, R. M., Carfagno, A. K., and Sharpless, C. M. (2010). Correlations between dissolved organic matter optical properties and quantum yields of singlet oxygen and hydrogen peroxide. Environ. Sci. Technol. 44, 5824–5829. doi: 10.1021/es101005u
Diaz, J. M., Hansel, C. M., Voelker, B. M., Mendes, C. M., Andeer, P. F., and Zhang, T. (2013). Widespread production of extracellular superoxide by heterotrophic bacteria. Science 340, 1223–1226. doi: 10.1126/science.1237331
Draper, W. M., and Crosby, D. G. (1983). Photochemical generation of superoxide radical anion in water. J. Agric. Food Chem. 31, 734–737. doi: 10.1021/jf00118a014
Garg, S., Rose, A. L., and Waite, T. D. (2011). Photochemical production of superoxide and hydrogen peroxide from natural organic matter. Geochim. Cosmochim. Acta. 75, 4310–4320. doi: 10.1016/j.gca.2011.05.014
Goldstone, J. V., and Voelker, B. M. (2000). Chemistry of superoxide radical in seawater: CDOM associated sink of superoxide in coastal waters. Environ. Sci. Technol. 34, 1043–1048. doi: 10.1021/es9905445
Heller, M. I., and Croot, P. L. (2010a). Superoxide decay kinetics in the southern ocean. Environ. Sci. Technol. 44, 191–196. doi: 10.1021/es901766r
Heller, M. I., and Croot, P. L. (2010b). Kinetics of superoxide reactions with dissolved organic matter in tropical Atlantic surface waters near Cape Verde (TENATSO). J. Geophys. Res. 115, C12038. doi: 10.1029/2009JC006021
Heller, M. I., and Croot, P. L. (2010c). Application of a superoxide () thermal source (SOTS-1) for the determination and calibration of fluxes in seawater. Anal. Chim. Acta 667, 1–13. doi: 10.1016/j.aca.2010.03.054
Heller, M. I., and Croot, P. L. (2011). Superoxide decay as a probe for speciation changes during dust dissolution in Tropical Atlantic surface waters near Cape Verde. Mar. Chem. 126, 37–55. doi: 10.1016/j.marchem.2011.03.006
Hu, C., Muller-karger, F. E., and Zepp, R. G. (2002). Absorbance, absorption coefficient, and apparent quantum yield : a comment on common ambiguity in the use of these optical concepts. Limnol. Oceanogr. 47, 1261–1267. doi: 10.4319/lo.2002.47.4.1261
Kieber, D. J., Miller, G. W., Neale, P. J., and Mopper, K. (2014). Wavelength and temperature-dependent apparent quantum yields for photochemical formation of hydrogen peroxide in seawater. Environ. Sci. Process. Impacts 16, 777–791. doi: 10.1039/c4em00036f
Kieber, D. J., Peake, B. M., and Scully, N. M. (2003). “Reactive oxygen species in aquatic ecosystems,” in UV Effects in Aquatic Organisms and Ecosystems, eds E. W. Helbling and H. Zagarese (Cambridge, UK: Royal Chemistry Society), 251–288.
King, D. W., Cooper, W. J., Rusak, S. A., Peake, B. M., Kiddle, J. J., O'Sullivan, D. W., et al. (2007). Flow injection analysis of H2O2 in natural waters using acridinium ester chemiluminescence: method development and optimization using a kinetic model. Anal. Chem. 79, 4169–4176. doi: 10.1021/ac062228w
McDowell, M. S., Bakac, A., and Espenson, J. H. (1983). A convenient route to superoxide ion in aqueous solution. Inorg. Chem. 22, 847–848. doi: 10.1021/ic00147a033
Miller, R. L., Belz, M., Castillo, C., and Del Trzaska, R. (2002). Determining CDOM absorption spectra in diverse coastal environments using a multiple pathlength, liquid core waveguide system. Cont. Shelf Res. 22, 1301–1310. doi: 10.1016/S0278-4343(02)00009-2
Miller, W. L., and Kester, D. R. (1988). Hydrogen peroxide measurement in seawater by (p-Hydroxyphenyl) acetic acid dimerization. Anal. Chem. 60, 2711–2715. doi: 10.1021/ac00175a014
Moore, C., Farmer, C., and Zika, R. (1993). Influence of the Orinoco River on hydrogen peroxide distribution and production in the Eastern Caribbean. J. Geophys. Res. 98, 2289–2298. doi: 10.1029/92JC02767
O'Sullivan, D. W., Neale, P. J., Coffin, R. B., Boyd, T. J., and Osburn, C. L. (2005). Photochemical production of hydrogen peroxide and methylhydroperoxide in coastal waters. Mar. Chem. 97, 14–33. doi: 10.1016/j.marchem.2005.04.003
Petasne, R. G., and Zika, R. G. (1987). Fate of superoxide in coastal seawater. Nature 325, 516–618. doi: 10.1038/325516a0
Powers, L. C., Babcock-Adams, L. C., Enright, J. K., and Miller, W. L. (2015). Probing the photochemical reactivity of deep ocean refractory carbon (DORC): lessons from hydrogen peroxide and superoxide kinetics. Mar. Chem. 177, 306–317. doi: 10.1016/j.marchem.2015.06.005
Powers, L. C., and Miller, W. L. (2014). Blending remote sensing data products to estimate photochemical production of hydrogen peroxide and superoxide in the surface ocean. Environ. Sci. Process. Impacts 16, 792–806. doi: 10.1039/C3EM00617D
Powers, L. C., and Miller, W. L. (2015a). Hydrogen peroxide and superoxide photoproduction in diverse marine waters: a simple proxy for estimating direct CO2 photochemical fluxes. Geophys. Res. Lett. 42, 7696–7704. doi: 10.1002/2015GL065669
Powers, L. C., and Miller, W. L. (2015b). Photochemical production of CO and CO2 in the Northern Gulf of Mexico: estimates and challenges for quantifying the impact of photochemistry on carbon cycles. Mar. Chem. 171, 21–35. doi: 10.1016/j.marchem.2015.02.004
Rose, A. L., Moffett, J. W., and Waite, T. D. (2008). Determination of superoxide in seawater using 2-Methyl-6-(4-methoxyphenyl)-3,7-dihydroimidazo[1,2-a]pyrazin-3(7H)-one chemiluminescence. Anal. Chem. 80, 1215–1227. doi: 10.1021/ac7018975
Rose, A. L., and Waite, T. D. (2006). Role of superoxide in the photochemical reduction of iron in seawater. Geochim. Cosmochim. Acta 70, 3869–3882. doi: 10.1016/j.gca.2006.06.008
Rusak, S. A., Peake, B. M., Richard, L. E., Nodder, S. D., and Cooper, W. J. (2011). Distributions of hydrogen peroxide and superoxide in seawater east of New Zealand. Mar. Chem. 127, 155–169. doi: 10.1016/j.marchem.2011.08.005
Shaked, Y., Harris, R., and Klein-Kedem, N. (2010). Hydrogen peroxide photocycling in the Gulf of Aqaba, Red Sea. Environ. Sci. Technol. 44, 3238–3244. doi: 10.1021/es902343y
Sharpless, C. M., Aeschbacher, M., Page, S. E., Wenk, J., Sander, M., and McNeill, K. (2014). Photooxidation-induced changes in optical, electrochemical, and photochemical properties of humic substances. Environ. Sci. Technol. 48, 2688–2696. doi: 10.1021/es403925g
Stubbins, A., Uher, G., Law, C. S., Mopper, K., Robinson, C., and Upstill-Goddard, R. C. (2006). Open-ocean carbon monoxide photoproduction. Deep Sea Res. II Top. Stud. Oceanogr. 53, 1695–1705. doi: 10.1016/j.dsr2.2006.05.011
Szymczak, R., and Waite, T. D. (1988). Generation and decay of hydrogen peroxide in Estuarine Waters. Aust. J. Mar. Freshw. Res. 39, 289–299. doi: 10.1071/mf9880289
Voelker, B. M., Sedlak, D. L., and Zafiriou, O. C. (2000). Chemistry of Superoxide radical in seawater: reactions with organic Cu complexes. Environ. Sci. Technol. 34, 1036–1042. doi: 10.1021/es990545x
White, E. M., Kieber, D. J., Sherrard, J., Miller, W. L., and Mopper, K. (2010). Carbon dioxide and carbon monoxide photoproduction quantum yields in the Delaware Estuary. Mar. Chem. 118, 11–21. doi: 10.1016/j.marchem.2009.10.001
Wuttig, K., Heller, M. I., and Croot, P. L. (2013). Pathways of superoxide () decay in the Eastern Tropical North Atlantic. Environ. Sci. Technol. 47, 10249–10256. doi: 10.1021/es401658t
Xie, H., Bélanger, S., Demers, S., Vincent, W. F., and Papakyriakou, T. N. (2009). Photobiogeochemical cycling of carbon monoxide in the southeastern Beaufort Sea in spring and autumn. Limnol. Oceanogr. 54, 234–249. doi: 10.4319/lo.2009.54.1.0234
Yocis, B. H., Kieber, D. J., and Mopper, K. (2000). Photochemical production of hydrogen peroxide in Antarctic Waters. Deep Sea Res. I Oceanogr. Res. Pap. 47, 1077–1099. doi: 10.1016/S0967-0637(99)00095-3
Zafiriou, O. C., Blough, N. V., Micinski, E., Dister, B., Kieber, D., and Moffett, J. (1990). Molecular probe systems for reactive transients in natural waters. Mar. Chem. 30, 45–70. doi: 10.1016/0304-4203(90)90061-G
Zhang, Y., and Blough, N. V. (2016). Photoproduction of one-electron reducing intermediates by chromophoric dissolved organic matter (CDOM): Relation to O2- and H2O2 photoproduction and CDOM photooxidation. Enrivron. Sci. Technol. 50, 11008–11015. doi: 10.1021/acs.est.6b02919
Zhang, Y., Del Vecchio, R., and Blough, N. V. (2012). Investigating the mechanism of hydrogen peroxide photoproduction by humic substances. Environ. Sci. Technol. 46, 11836–11843. doi: 10.1021/es3029582
Zhang, Y., Simon, K. A., Andrew, A. A., Del Vecchio, R., and Blough, N. V. (2014). Enhanced photoproduction of hydrogen peroxide by humic substances in the presence of phenol electron donors. Environ. Sci. Technol. 48, 12679–12688. doi: 10.1021/es5035798
Keywords: photochemistry, hydrogen peroxide, superoxide, superoxide dismutase, apparent quantum yield
Citation: Powers LC and Miller WL (2016) Apparent Quantum Efficiency Spectra for Superoxide Photoproduction and Its Formation of Hydrogen Peroxide in Natural Waters. Front. Mar. Sci. 3:235. doi: 10.3389/fmars.2016.00235
Received: 20 August 2016; Accepted: 01 November 2016;
Published: 18 November 2016.
Edited by:
Gordon T. Taylor, Stony Brook University, USACopyright © 2016 Powers and Miller. This is an open-access article distributed under the terms of the Creative Commons Attribution License (CC BY). The use, distribution or reproduction in other forums is permitted, provided the original author(s) or licensor are credited and that the original publication in this journal is cited, in accordance with accepted academic practice. No use, distribution or reproduction is permitted which does not comply with these terms.
*Correspondence: Leanne C. Powers, leanne.powers@gmail.com
†Present Address: Leanne C. Powers, Chesapeake Biological Laboratory, University of Maryland Center for Environmental Science, Solomons, MD, USA