In vivo large-scale cortical mapping using channelrhodopsin-2 stimulation in transgenic mice reveals asymmetric and reciprocal relationships between cortical areas
- 1 Department of Psychiatry, University of British Columbia, Vancouver, BC, Canada
- 2 Brain Research Center, University of British Columbia, Vancouver, BC, Canada
We have mapped intracortical activity in vivo independent of sensory input using arbitrary point channelrhodopsin-2 (ChR2) stimulation and regional voltage sensitive dye imaging in B6.Cg-Tg (Thy1-COP4/EYFP)18Gfng/J transgenic mice. Photostimulation of subsets of deep layer pyramidal neurons within forelimb, barrel, or visual primary sensory cortex led to downstream cortical maps that were dependent on synaptic transmission and were similar to peripheral sensory stimulation. ChR2-evoked maps confirmed homotopic connections between hemispheres and intracortical sensory and motor cortex connections. This ability of optogentically activated subpopulations of neurons to drive appropriate downstream maps suggests that mechanisms exist to allow prototypical cortical maps to self-assemble from the stimulation of neuronal subsets. Using this principle of map self-assembly, we employed ChR2 point stimulation to map connections between cortical areas that are not selectively activated by peripheral sensory stimulation or behavior. Representing the functional cortical regions as network nodes, we identified asymmetrical connection weights in individual nodes and identified the parietal association area as a network hub. Furthermore, we found that the strength of reciprocal intracortical connections between primary and secondary sensory areas are unequal, with connections from primary to secondary sensory areas being stronger than the reciprocal.
Introduction
Functional relationships between brain areas have been deduced through an elegant combination of structural, electrophysiological, and lesion/inactivation studies (Shepherd et al., 2005; Douglas and Martin, 2007). Recently, efforts have begun to exhaustively sample cortical structure at the synaptic, cellular, and regional level to derive maps of cortical wiring (Bohland et al., 2009). In contrast to structural analysis, functional connectivity studies in vivo are often restricted to evaluating areas with well-documented sensory input or behavioral links, and have not necessarily sampled connections between multiple arbitrary locations. In brain slices, arbitrary point microstimulation mapping techniques involving glutamate uncaging (Callaway and Katz, 1993; Fino and Yuste, 2011), or channelrhodopsin-2 (ChR2), have been employed to elucidate laminar (Weiler et al., 2008), and transcallosal (Petreanu et al., 2007) relationships in neocortex. Functional mapping between specific sites has been performed in vivo through electrical microstimulation (Ferezou et al., 2007; Histed et al., 2009), and combining optogenetic stimulation with functional magnetic resonance imaging (fMRI; Lee et al., 2010; Logothetis et al., 2010; Desai et al., 2011; Kahn et al., 2011), yet electrical microstimulation is limited in the number of regions that can be sampled quickly, and fMRI has limited temporal resolution. With these limitations in mind, our goal was to develop an approach that would allow for arbitrary point functional mapping in vivo while maintaining relatively high spatiotemporal resolution.
Here we describe an automated approach to assess intrahemispheric and interhemispheric functional relationships by the activation of a subset of ChR2-expressing deep layer cortical neurons in transgenic mice (Arenkiel et al., 2007; Ayling et al., 2009). These mice represent the best current model for reproducible arbitrary point cortical activation over wide spatial scales. Previous work by our lab (Ayling et al., 2009) using comparisons to other well known mouse strains such as the YFP-H line (Feng et al., 2000), and work from the original developers (Wang et al., 2007) has shown that these transgenic animals robustly express ChR2 within layer 5 pyramidal neurons, as well as other minority cell populations throughout the neocortex. Although ChR2 is expressed in axons of passage and exhibits some variability in expression levels across the cortex (Wang et al., 2007; Ayling et al., 2009), these transgenic mice may have advantages over multiple viral injections due to incomplete sampling and potential for tissue damage at each injection site.
To monitor intracortical activity, fluorescent calcium indicator proteins (Mank et al., 2008; Tian et al., 2009; Lutcke et al., 2010), or recombinant voltage sensors (Perron et al., 2009; Akemann et al., 2010; Borghuis et al., 2011; Minderer et al., 2012) provide the potential to record cell-specific signals. However, these recombinant sensors do not currently offer the ability to monitor activity over large spatial scales (up to 50 mm2) and with high time resolution without regional variation being introduced due to differences in virus-injection dependent sensor expression. Small molecule calcium indicators have provided much insight into developmental and local synchronized activity (Golshani et al., 2009), but due to the need to apply bolus loading techniques have been restricted to smaller fields of view (0.3 mm2). Therefore, we have chosen to monitor regional cortical activity using organic voltage sensitive dyes (VSD; London et al., 1989; Kleinfeld and Delaney, 1996; Shoham et al., 1999; Petersen et al., 2003a). Using this approach, we show that point photostimulation of deep layer pyramidal neuronal subsets in functionally identified primary sensory cortices reveals cortical maps which are archetypal of the maps obtained via sensory stimulation. We extend the point stimulation to arbitrary areas targeting association cortices and secondary somatosensory regions that are inaccessible to direct stimulation via the senses. We apply graph theory and complex network analysis to connection matrices derived from these self-assembled, functional maps to elucidate reciprocal connections between primary and secondary sensory areas, identify network hubs, and determine asymmetries in intracortical connectivity.
Materials and Methods
Animals
Channelrhodopsin-2 transgenic mice were obtained from the Jackson Laboratory [line 18, stock 007612, strain B6.Cg-Tg (Thy1-COP4/EYFP) 18Gfng/J]. Mice were ∼16 weeks old and weighed ∼30 g and were housed in clear plastic cages in groups of two to five, under a 12:12 h light/dark cycle. Mice were given ad libitum access to water and standard laboratory mouse diet at all times. All experiments were conducted with approval from the University of British Columbia Animal Care Committee and in accordance with guidelines set forth by the Canadian Council for Animal Care.
Surgery
At ∼16 weeks of age, mice were given a craniotomy. During craniotomy surgery, mice were anesthetized with isoflurane (1.0%), for induction, and urethane (15% w/v, dissolved in distilled water; 1.25 g/kg), for the bilateral craniotomy, or were anesthetized with isoflurane (1.0%), for the duration of the experiment for the unilateral craniotomy. Mice were placed on a metal plate that could be mounted onto the stage of the upright microscope and the skull was fastened to a steel plate. A 7 mm × 8-mm bilateral craniotomy (Bregma 2.5–4.5 mm, lateral 0–4 mm), or 7 mm × 6 mm unilateral craniotomy (Bregma 2.5 to −4.5 mm, lateral 0–6 mm), was made and the underlying dura was removed, as described previously (Mohajerani et al., 2010). Throughout surgery and imaging, body temperature was maintained at 37°C using a heating pad with a feedback thermistor. In some cases, mice were also given a tracheotomy to assist with breathing.
Cortical Electroencephalogram Recording
In order to monitor electroencephalogram (EEG) activity throughout the experiment, two Teflon coated chlorided silver wires (0.125 mm), were placed on the left and right edge of the craniotomy. A reference electrode was placed on the nasal bone. The cortical signal was amplified and filtered (0.1–1000 Hz), using an A-M Systems (Sequim, WA, USA) Model 1700 AC amplifier.
VSD Imaging
For in vivo VSD imaging, the dye RH1692 (Optical Imaging, New York, NY; Shoham et al., 1999), was dissolved in HEPES-buffered saline solution (to a final optical density of 5–7, measured at 550 nm) and applied to the exposed cortex for 60–90 min, staining all neocortical layers, as reported previously (Mohajerani et al., 2010). To minimize movement artifacts due to respiration, the brain was covered with 1.5% agarose made in HEPES-buffered saline and sealed with a glass coverslip. For VSD data collection, 12-bit images were captured with 6.67 ms resolution with a CCD camera (1M60 Pantera, Dalsa, Waterloo, ON, USA), and EPIX E4DB frame grabber with XCAP 2.2 imaging software (EPIX, Inc., Buffalo Grove, IL, USA). VSD was excited with a red LED (Luxeon K2, 627 nm center), and fluorescence filters as described (Mohajerani et al., 2010). An Olympus BX51WI microscope and XLFluor 2X/340 (0.14 NA), objective provided a 6.4 mm × 6.4 mm field of view. The depth of field was 1.20 mm and was defined by the distance along the optical axis where the resolution was better than 10 lines per mm, corresponding to a maximum blur of 2 pixels. VSD fluorescence was filtered using a 673- to 703-nm bandpass (Semrock, New York, NY), after reflection by a dichroic mirror (510 dcspxr; 400–495 transmission reflection 550–725 nm, Chroma, Bellows Falls, VT, USA), that separated the ChR2 stimulation and VSD imaging light paths (Figure 1A). For each trial, 108 frames were collected at 150 Hz (6.67 ms/frame). Since animals under anesthesia typically exhibit spontaneous cortical activity (Mohajerani et al., 2010), we averaged 4–10 trials of stimulus presentation to reduce these effects. To correct for time-dependent changes in VSD signals that accompany all imaging, we also collected a number of non-stimulation trials that were used for normalization of stimulated data. To reduce potential VSD signal distortion caused by the presence of large cortical blood vessels, we focused into the cortex to a depth of ∼700 μm. Previous work from our lab has measured VSD fluorescence across the cortex using histology and demonstrated relatively high labeling at even ∼750 μm in depth (Mohajerani et al., 2010). Nonetheless, to reduce regional bias in VSD signal caused by uneven dye loading or due to brain curvature, all VSD responses were expressed as a percent change relative to baseline VSD fluorescence (ΔF/F0*100%).
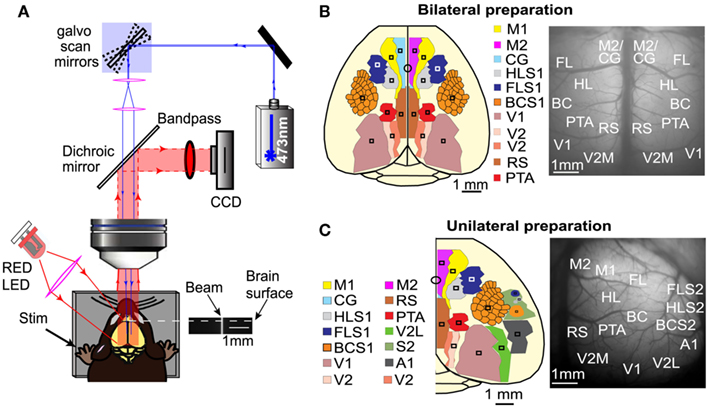
Figure 1. Mapping interhemispheric and intrahemispheric connectivity using ChR2 stimulation and VSD imaging. (A) Experimental set up for simultaneous ChR2-photoactivation and VSD imaging. Galvanometer scan mirrors position a 473 nm laser at specific cortical locations while VSD fluorescence is monitored in epi-fluorescence mode. An image of the laser beam demonstrates that it is relatively collimated. (B) Schematic of the bilateral craniotomy preparation showing the 16 different ROIs that were used for photostimulation and simultaneous monitoring of VSD fluorescence. (C) Schematic of the unilateral craniotomy preparation showing the 14 different areas that were stimulated and assayed to examine intrahemispheric connectivity.
Sensory Stimulation
Sensory stimuli were used to generate maps of the primary sensory cortical areas – forelimb (FLS1), hindlimb (HLS1), and barrel cortex area (BCS1) of the primary somatosensory cortex, primary visual cortex (V1), and auditory cortex (A1) – in order to compare these responses to ChR2-evoked responses. To map FLS1 and HLS1, probes were inserted into the paws and a 1 mA, 1 ms electrical pulse was delivered. To map BCS1, a single whisker (C2), was attached to a piezoelectric device (Q220-A4-203YB, Piezo Systems, Inc., Woburn, MA, USA), and given a single 1 ms tap using a square pulse. The piezoelectric device was attached ∼2 mm from the base of the C2 whisker. The whisker was moved at most 90 μm in an anterior to posterior direction, which corresponds to a 2.6° angle of deflection. A 1 ms pulse of combined green and blue light was delivered in order to map V1. A single 5 ms tone was used to map A1. Visual and auditory stimuli were only used in the unilateral craniotomy, as these areas are difficult to examine in the bilateral craniotomy given the relatively smaller lateral field of view.
Photostimulation
A 473 nm diode pumped solid state laser (CNI Optoelectronics, Changchun, China), was used to stimulate ChR2-expressing neurons. The beam was positioned on the cortex using custom software written in IGOR PRO (Portland, OR, USA), which controlled galvanometer scan mirrors (Cambridge Tech, Lexington, MA, USA), via analog output voltage from PCI-6115 DAQ (National Instruments, Austin, TX, USA). The beam diameter measured through the objective was 85 μm and was nearly collimated (f-number = 34) due to the relatively small size of the laser beam compared to the back aperture of the objective. This degree of collimation reduced the potential effect of differences in path length due to brain curvature and ensured that the area of photostimulation was limited by light scattering in the tissue (Ayling et al., 2009) rather than the geometry of the laser beam. In the present study, the photostimulation area is comparable to the size of the pixels used for regional VSD imaging (Grinvald and Hildesheim, 2004). The IGOR program controlled the overall timing of individual stimulation trials with TTL triggers to XCAP from a second DAQ (PCI-6036E). Stimuli were delayed relative to the onset of image acquisition by an A-M Systems (Sequim, WA, USA) Isolated Pulse Stimulator (Model 2100).
The intensity and duration of the photostimulation was based on its ability to evoke EEG responses in a ChR2 mouse. We found that relatively low amplitude and short duration single laser pulses were optimal to ensure sufficient activation and a low laser stimulus artifact (typically a 5-mW, 1 ms pulse). Consistent with previous data, this brief activation led to depolarization of the cortex as measured by EEG (Ayling et al., 2009). Further analysis of neuronal activity using optrode recordings after layer 5 ChR2 photostimulation demonstrated that a 1 ms 5 mW laser pulse was able to elicit robust intracortical spiking, and the highest firing rate occurred within 20 ms of photostimulation (see Figure A1 in Appendix).
During data acquisition for both preparations, stimulation of the photostimulation points was given in an interleaved manner to reduce the effect of time-dependent changes in cortical excitability or depth of anesthesia. Stimuli were given in a semi-random order designed to reduce sequential stimulation at neighboring cortical sites. The site of optical stimulation was not used for regions of interest (ROI) quantification due to a transient optical artifact; the VSD was bleached at the site of stimulation, but recovered within 500 ms. A 10 s interval between each photostimulation ensured full recovery of VSD fluorescence before the next trial was collected. Analysis of EEG recordings showed significant EEG depolarizations at all photostimulation sites (data not shown). To reduce the possible effect of unequal ChR2 activation between stimulation sites due to possible variability in regional ChR2 expression, VSD responses were normalized to the maximum VSD response per stimulation site.
To quantify the spread of evoked signal over the cortex, ROIs for both stimulation and analysis were determined per animal and located based on relative stereotaxic location (Paxinos and Franklin, 2001) from functionally defined HLS1 and FLS1 areas. For the bilateral craniotomy, both cortical hemispheres were divided into nine distinct ROIs (square regions, 0.0625 mm2). The ROIs for photostimulation and VSD response in the bilateral craniotomy included: (1) secondary motor cortex (M2) and anterior segment of cingulate cortex (CG), (2) primary motor cortex (M1), (3) forelimb area of the primary somatosensory cortex (FLS1), (4) hindlimb area of the primary somatosensory cortex (HLS1), (5) barrel cortex area of the primary somatosensory cortex (BCS1), (6) parietal association area (PTA), (7) retrosplenial cortex (RS), (8) primary visual cortex (V1), and (9) medial secondary visual cortex (V2M; Figure 1B). VSD responses were measured from all regions for a total of 18 response sites across both hemispheres. All regions were targeted for photostimulation, excluding M1, for a total of 16 photostimulation sites across both hemispheres. For each photostimulation site, VSD responses were collected from all other ROIs. Each site was stimulated 10 times and replicate responses were averaged together.
For the unilateral craniotomy, 14 ROIs were selected for photostimulation. Sensory stimulation was used to determine the coordinates for the primary sensory areas (HLS1, FLS1, BCS1, V1, and A1) and secondary somatosensory areas (HLS2, FLS2, and BCS2). From these primary sensory coordinates, the relative locations of additional associational areas were estimated. The ROIs for the unilateral craniotomy include: (1) secondary motor cortex (M2) and anterior segment of cingulate cortex (CG), (2) primary motor cortex (M1), (3) forelimb area of the primary somatosensory cortex (FLS1), (4) hindlimb area of the primary somatosensory cortex (HLS1), (5) secondary forelimb cortex (FLS2), (6) secondary hindlimb cortex (HLS2), (7) barrel cortex area of the primary somatosensory cortex (BCS1), (8) auditory cortex (A1), (9) secondary barrel cortex (BCS2), (10) parietal association cortex (PTA), (11) retrosplenial cortex (RS), (12) medial secondary visual cortex (V2M), (13) primary visual cortex (V1), and (14) lateral secondary visual cortex (V2L; Figure 1C). VSD responses were measured from all regions for a total of 14 intrahemispheric response sites. All regions were targeted for semi-random photostimulation for a total of 14 stimulation sites in one hemisphere. Each site was stimulated 2–4 times and replicate responses were averaged together.
Data Analysis
Voltage sensitive dyes responses to stimulation were calculated in MatLab (Mathworks, Natick, MA) as the normalized difference to the average baseline recorded before stimulation (ΔF/F0*100%). VSD data occurring at a frame rate of 150 Hz were interpolated in MatLab (1000 Hz for analysis or 200 Hz for movies) for ROI analysis to better match sampling rates of other signals (i.e., EEG). Responses were quantified at all ROIs listed above (square regions 0.0625 mm2) at 6, 12, and 20 ms after stimulation. In order to create the connectivity matrices for network analysis and average data from multiple animals, VSD responses from each animal were normalized to the maximum response per stimulation site, reducing the effect of between animal differences in absolute response that could arise from VSD labeling, variable ChR2 expression between animals, or other factors. In order to assess spatial bias in VSD response due to brain curvature, we calculated the distance from the edge of the craniotomy for each ROI and then compared this to the mean VSD response at 20 ms after stimulation using a Pearson’s correlation coefficient.
Pharmacology
In cases where antagonists of synaptic transmission were used, the cortex was covered with HEPES-buffered saline solution to allow for later topical application of AMPA/NMDA glutamate receptor antagonists: 200 μM 6,7-dinitroquinoxaline-2,3-dione (DNQX), and 500 μM (2R)-amino-5-phosphonovaleric acid (AP5). The cortex was incubated with antagonists for 30 min prior to further imaging.
Network Analysis
We used custom-written MatLab programs to create a connectivity matrix using ChR2-evoked VSD responses from each ROI. We chose to represent the data as a weighted, directed network (as opposed to the more common binary, undirected network) in order to preserve the information regarding reciprocal connections and their relative importance. Each node in our network corresponds to one ROI in the unilateral preparation and they are connected by edges with weights proportional to the VSD signal observed in the remaining ROIs when each ROI is stimulated in turn. We used functions from the MatLab Bioinformatics toolbox to draw the network diagram and functions from the Brain Connectivity Toolbox [http://www.brain-connectivity-toolbox.net (Rubinov and Sporns, 2010)] to calculate network properties. These properties include strength per node (both in-strength and out-strength), betweenness centrality (BC), characteristic path length (L), and the mean clustering coefficient (C).
Both BC and node strength were calculated per animal and averaged. Node strength is the sum of the edge weights of a given node (i.e., row and column sum of the connectivity matrix). It quantifies how strongly connected a particular node is to the other nodes (if at all). In a weighted, directed network, out-strength and in-strength separately quantify the strength of out-going and in-coming connections of a particular node. Here, out-strength is determined by the VSD response recorded at the other ROIs following the stimulation of a given node (a column sum in our connectivity matrix) and in-strength is determined by the VSD response at a given node following photostimulation at the other ROIs (a row sum in our connectivity matrix). Node out-strength was calculated on the sub-network of primary (S1) and secondary sensory (S2) nodes to investigate reciprocal connections between them. To determine which nodes were highly connected we calculated BC for each node. A high BC indicates that, given the random selection of two other nodes within the network selection, there is a high probability that the shortest path between these two nodes passes through the node of interest. BC is a common metric in network analysis, indicating hub regions within the network. In order to assess spatial bias in network measures due to possible edge effects, we calculated the distance from the edge of the craniotomy for each node and then compared this to the node strength and the BC using a Pearson’s correlation coefficient. Distance from the edge of the craniotomy was calculated per animal by creating a mask of the craniotomy and calculating the minimum distance from the mask edge to each ROI.
Using the connectivity matrix, where VSD responses were normalized per stimulation site, per animal, before averaging (see Data Analysis), we applied a threshold to highlight the strongest connections within the network. This threshold was applied for display only (in Figures 7 and 8) as it is difficult to visually assess trends within the diagram due to the large number of connections present. In order to test the effects of isolating the strongest connections within the network on the overall network properties, we computed global network properties, L and C, as a function of variable threshold levels. L measures compactness of the network by calculating the average shortest path between pairs of nodes, while C gives a measure of the local connectivity by quantifying groups of interconnected nodes. We chose a threshold level which removed a large number of connections while having a negligible influence on L and C. Connectivity matrices and network diagrams were then constructed for ROI data at 6, 12, and 20 ms to illustrate the integrated response of the network over time.
Histology
To investigate ChR2 expression in the cortex (expressed as a YFP fusion protein; Wang et al., 2007), mice were deeply anesthetized and perfused transcardially with 10 ml of PBS followed by 10 ml of 4% paraformaldehyde in PBS. The brain was removed and immersed in 4% paraformaldehyde overnight before being transferred to a 30% sucrose solution in PBS for cryoprotection. Sagittal sections (50 μm) were cut on a frozen microtome and imaged using a Zeiss LSM 510 Meta confocal microscope with a multi-line argon laser and a Plan-Neofluar 5X (0.15 NA) or Plan-Neofluar 20X (0.50 NA) objective. Fluorescence was excited using the 488-nm line of the argon laser and was filtered using a 505- to 530-nm bandpass. Tiled scans (12-bit; 512 × 512 pixels per tile for 5X images; 460 × 460 pixels per tile for 20X images) were collected using LSM 510 software (Version 3.2 SP2). To determine ChR2 expression from anterior to posterior across the section a Gaussian filter was applied (6.0 pixel radius) and a freehand line (100 pixel thickness) was drawn to plot the fluorescence profile of the layer 5 region using NIH ImageJ software (Version 1.42q). This was done in three animals from sections ranging from 2.28 to 2.32 mm lateral from Bregma, each being normalized relative to its mean fluorescence.
Statistical Analyses
Statistical analyses were completed using GraphPad Prism version 4.03 (GraphPad Software, San Diego, CA, USA) or custom codes written in MatLab. In order to determine the relationship between sensory-evoked responses and ChR2-evoked responses, a repeated measures two-way ANOVA was conducted, followed by Bonferroni post-tests, for each type of stimulation. All p values ≤ 0.05 were considered statistically significant, and all data are expressed as the mean ± SEM. Sensory and ChR2-evoked stimuli were paired together (ex. FL sensory stimulation was paired with FLS1 photostimulation) in order to determine differences in responses between these stimulation types. Permutation tests (van den Heuvel and Sporns, 2011) were used to evaluate the mean strengths of connections between primary and secondary sensory nodes as well as to test for asymmetry in the out-going and in-coming connection weights on a node by node basis. Pearson’s correlation coefficients were calculated to assess potential spatial bias within the craniotomy window on VSD responses and/or on network properties (strength per node, and BC per node).
Results
Assessment of Channelrhodopsin-Evoked Cortical Activity through Qualitative Comparison to Sensory-Evoked Cortical Activity
Using a ChR2-based intracortical mapping approach (Ayling et al., 2009) with transgenic mice [B6.Cg-Tg(Thy1-COP4/EYFP)18Gfng/J; Wang et al., 2007] we were able to activate specific cortical areas while imaging local and regional activity using VSD (RH1692; Shoham et al., 1999) under urethane or isoflurane anesthesia (Figure 1A). Anesthesia was used to depress the motor system, making muscle twitches and indirect sensory responses less likely (Antognini et al., 1999), and to create a relatively uniform level of background activity for circuit analysis allowing functional relationships between primary sensory areas (including forelimb, hindlimb, barrel, auditory, and visual cortex), and other cortical regions (including secondary sensory, motor, and association areas) to be mapped. For all experiments the cortical locations of ChR2 stimulation sites were based on relative position to functional coordinates (defined by sensory stimulation) derived from VSD imaging prior to photostimulation. By using a bilateral (Figure 1B), or a wide unilateral craniotomy preparation (Figure 1C), we have monitored activation of the contralateral hemisphere, indicating interhemispheric relationships, as well as activation of the ipsilateral hemisphere, indicating intrahemispheric connectivity. Given the presence of a transient optical artifact at the stimulation site, we did not use the data from the location or timepoint of photostimulation. For example, if photostimulation was targeted to the left hemisphere HLS1, the data from the center of the left hemisphere HLS1 was not used for ROI quantification (due to reversible photobleaching), but the spread of activity within the photostimulated hemisphere and transcallosal responses in the opposite hemisphere were measured. Using the average of photostimulation trials that were normalized to unstimulated trials, we found that a 1 ms electrical stimulation to the right hindlimb led to a localized VSD response at the left hemisphere HLS1 and a discrete activation at the homotopic HLS1 in the right hemisphere (Figure 2A, i). Similarly, a 1 ms 473 nm light pulse delivered to a point centered within the HLS1 led to a ChR2-dependent local spread of activity around the excitation site and a discrete activation of the homotopic HLS1 in the right hemisphere (Figure 2A, ii). Similar activation patterns were observed when forelimb (FL), C2 whisker (WK), vision, and auditory sensory stimulation were compared to photostimulation of FLS1, BCS1, V1, or A1, respectively (Figures 2B–E; Movie S1 and S2 in Supplementary Material). Analysis of correlation over time indicated that the relationship between the forelimb sensory-evoked response (Figure 3A) and the FLS1 (cortex) ChR2-evoked response (Figure 3B) had the highest correlation within 25 ms of stimulation onset (Figure 3C).
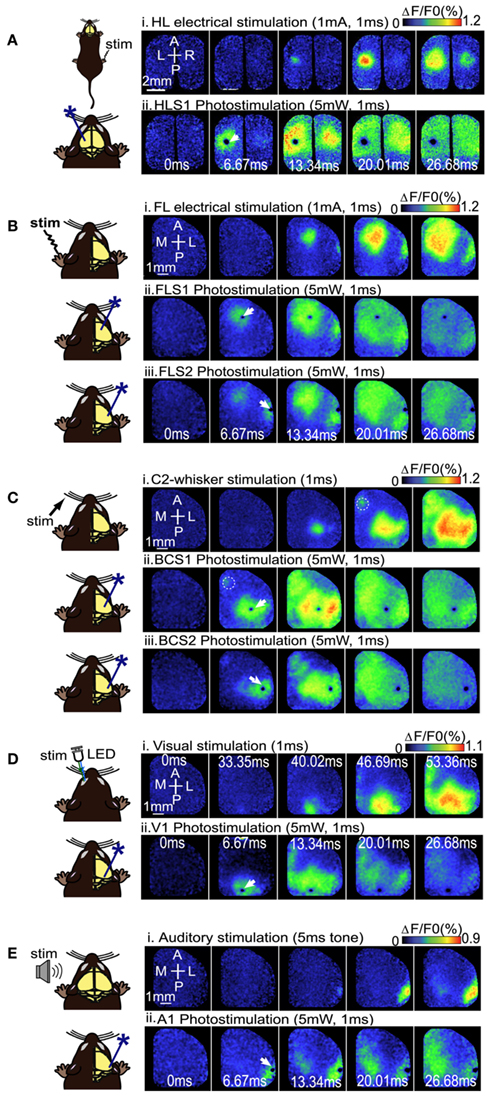
Figure 2. Voltage sensitive dye imaging maps to compare sensory stimulation to local photostimulation. (A) Example of VSD response in a bilateral craniotomy preparation after electrical stimulation of the right hindlimb (i), or direct photostimulation of the left HLS1 (ii). (B) Example of VSD responses in a unilateral craniotomy preparation during electrical stimulation of the contralateral (left), FL (i), direct photostimulation of FLS1 (ii), and direct photostimulation of FLS2 (iii). (C) Example of VSD responses in a unilateral craniotomy preparation during piezoelectric stimulation of a single whisker [C2; (i)], direct photostimulation of BCS1 (ii), and direct photostimulation of BCS2 (iii). Dashed circles indicate the location of M1. (D) Example of VSD responses in a unilateral craniotomy preparation during visual stimulation of the contralateral (left), eye (i), or direct photostimulation of the right V1 (ii). (E) VSD responses after auditory stimulation using a tone (i), and photostimulation of A1 (ii). White arrows indicate the site of photostimulation.
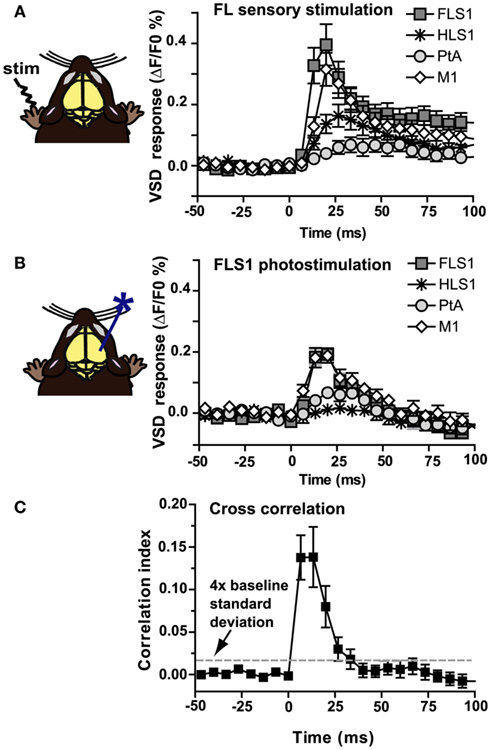
Figure 3. Temporal correlation between sensory-evoked VSD responses and ChR2-evoked VSD responses. (A) VSD responses from selected regions in the contralateral hemisphere after electrical stimulation to the forelimb (n = 10 mice). (B) VSD responses from selected regions in the contralateral hemisphere after photostimulation of FLS1 (n = 10 mice). (C) A Pearson correlation coefficient between sensory and ChR2-evoked responses was computed (n = 10 mice) for all pixels and plotted in a frame by frame manner to determine correlation. Note the high correlation index during the first 25 ms after stimulation, where the correlation index is greater than four times the SD of baseline (dashed line).
Quantitative Comparison between Sensory and Channelrhodopsin-2-Evoked VSD Responses
In order to quantify similarities between sensory-evoked responses and photostimulation-evoked responses in both bilateral and unilateral preparations, the VSD responses were compared at each ROI. It is possible that our ability to measure the VSD response of the ROI may be influenced by the curvature of the brain surface and the location of the ROI within the craniotomy window. To determine whether this was a major factor we calculated the minimum distance to the edge of the unilateral craniotomy for each ROI and compared this to the mean VSD response from that ROI (across all photostimulation sites). Pearson’s correlation coefficient showed no significant correlation between distance from the edge of the craniotomy and mean VSD response for the ROI (r = 0.30, p = 0.29), suggesting that the location of the ROI within the craniotomy window does not have a significant effect on the VSD response (data not shown). Nonetheless, VSD responses were calculated as a percent change from baseline VSD response (ΔF/F0*100%) in order to reduce any effects of variable VSD signal strength across the craniotomy window caused by brain curvature. To reduce the possible effect of regional differences in ChR2 expression, the ChR2-evoked responses were normalized to the maximum response for each stimulus site (see Materials and Methods). Sensory responses were normalized to the maximum response obtained for that stimulus.
In the bilateral preparation (n = 10 animals), a two-way repeated measures ANOVA revealed no significant difference when comparing forelimb and whisker sensory-evoked VSD responses to ChR2-evoked VSD responses following photostimulation of FLS1 or BCS1 (p = 0.50 and p = 0.17, respectively) but did show a significant difference when comparing hindlimb sensory-evoked VSD responses to ChR2-evoked responses after HLS1 photostimulation (p < 0.01; Figure 4A). For light or sensory stimulation there was a main effect of ROI (p < 0.01 for all pairs), indicating differences in the VSD response levels at certain ROIs rather than an equal and diffuse VSD response at all ROIs. Bonferronni post-tests comparing sensory-evoked versus ChR2-evoked responses at each ROI were also conducted (significant differences indicated in Figure 4A; *p < 0.05). There were very few pairs that were significantly different between the sensory and ChR2-evoked responses indicating a high degree of similarity in activation at each ROI.
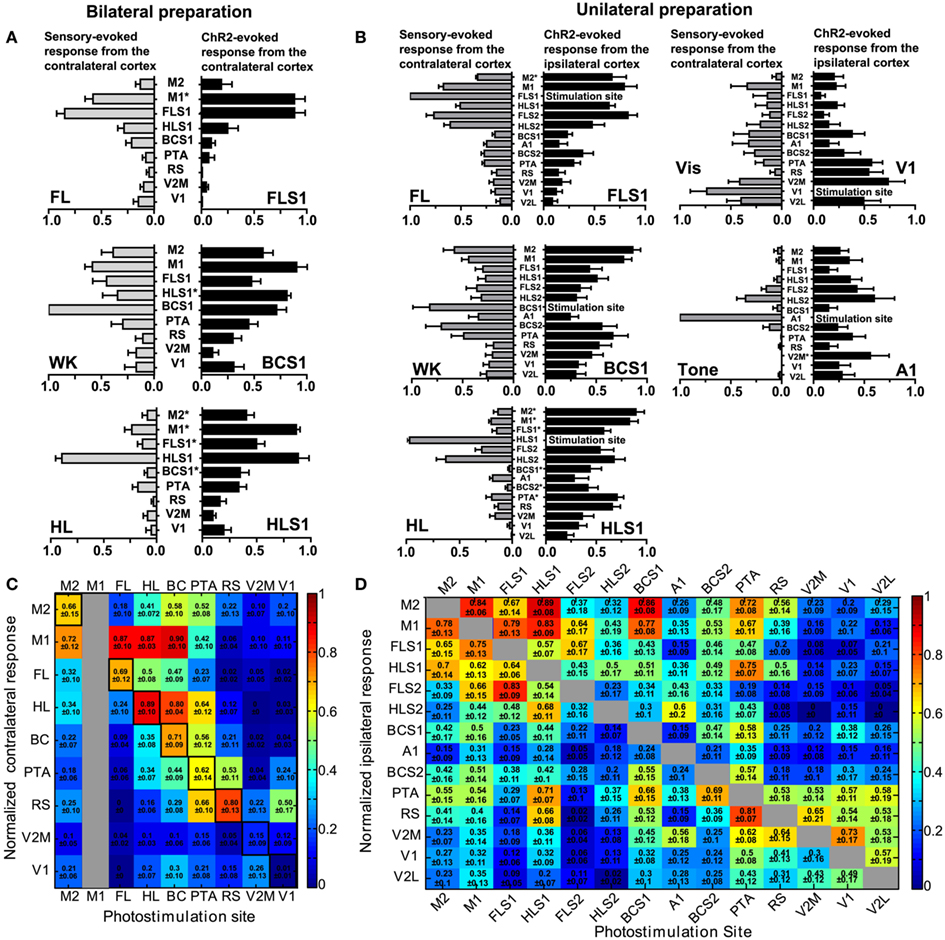
Figure 4. Interhemispheric and intrahemispheric connectivity: comparison of sensory-evoked cortical maps with ChR2-evoked cortical maps. (A) Comparison of contralateral sensory-evoked responses (gray bars), to contralateral ChR2-evoked responses (black bars), at nine ROIs in the bilateral preparation. FL sensory stimulation was compared to direct photostimulation of FLS1 (top), whisker sensory stimulation was compared to direct photostimulation of BCS1 (middle), and HL sensory stimulation was compared to direct photostimulation of HLS1 (bottom; *p < 0.05, two-way ANOVA post test). (B) Comparison of contralateral sensory-evoked responses (gray bars), to ipsilateral ChR2-evoked responses (black bars), at 14 ROIs in the unilateral preparation. FL sensory stimulation was compared to FLS1 photostimulation(top, left), whisker sensory stimulation was compared to BCS1 photostimulation (middle, left), HL sensory stimulation was compared to direct photostimulation of HLS1 (bottom, left), visual stimulation was compared to V1 photostimulation (top, right), and auditory stimulation (tone), was compared to A1 photostimulation (middle, right). (*p < 0.05, two-way ANOVA post test). (C) Connectivity matrix derived from the bilateral preparation. Nine sites of photostimulation are indicated along the x-axis, and nine ROIs are indicated along the y-axis. M1 was not a photostimulation site (gray column) but was used as a ROI for VSD responses. The responses represent the integrated VSD response in the hemisphere contralateral to photostimulation at 20 ms after photostimulation. Responses were normalized to the maximum response per stimulation site, per animal, and then averaged across ten animals. In cases where the response was less than four times the SD of the baseline, it was assigned a value of zero indicating no response. (D) Connectivity matrix derived from the unilateral preparation. Fourteen sites of photostimulation are indicated along the x-axis, and 14 ROIs are indicated along the y-axis. The responses represent the integrated VSD response at 20 ms after photostimulation within the hemisphere where photostimulation occurred. Responses are not shown for the site of stimulation (gray boxes). Responses were normalized to the maximum response per stimulation site, per animal, and averaged across six animals.
Within the unilateral preparation (n = 6 animals), a two-way repeated measures ANOVA revealed no main effect when comparing sensory- and ChR2-evoked VSD responses in forelimb, whisker, and visual areas (p = 0.42, p = 0.29, and p = 0.19, respectively; Figure 4B). While hindlimb sensory stimulation showed similar VSD responses to photostimulation of HLS1 at some ROIs, ChR2-evoked responses tended to be more diffuse. Although auditory stimulation showed strong similarities to photostimulation at some ROIs (particularly the secondary somatosensory regions), ChR2-evoked activation of A1 also tended to show more diffuse responses than sensory stimulation. Sensory- and ChR2-evoked responses were significantly different by a two-way ANOVA when comparing hindlimb-HLS1 (p < 0.01) and when comparing tone-A1 (p < 0.01; Figure 4B). All sensory- and ChR2-evoked pairs (forelimb-FLS1, whisker-BCS1, visual-V1, hindlimb-HLS1, auditory-A1) had a main effect of ROI (p < 0.01 for all pairs), indicating variable levels of VSD response rather than equal activation at all ROIs. Bonferroni post-tests were conducted for pairs of ChR2 and sensory stimulation (Figure 4B). There were very few significant differences (*p < 0.05 in Figures 4A,B) between sensory- and ChR2-evoked responses at individual ROIs, suggesting that ChR2 and sensory stimulation elicited similar patterns and amplitudes of responses at each ROI.
Assessment of the Inter and Intra-Hemispheric Network Trends from Connectivity Matrices
Pseudo-colored connectivity matrices were created to show relationships between photostimulation sites and VSD responses, both between (Figure 4C) and within (Figure 4D) cortical hemispheres (data sheets of the connectivity matrices shown in Figure 4C,D are available as excel files). In assessing ChR2-evoked responses that traveled to the contralateral hemisphere in the bilateral preparation (Figure 4C), strong contralateral activity was usually observed in the homotopic regions (outlined in black in Figure 4C) and neighboring regions. For example, ipsilateral photostimulation of HLS1 produced a strong response in the contralateral HLS1 (0.89 ± 0.10) and the contralateral M1 (0.87 ± 0.03; Figure 4C). One notable exception where photostimulation did not elicit a strong response at the homotopic site was V1 (0.01 ± 0.01), however photostimulation of V1 did result in excitation of the contralateral retrosplenial cortex (0.50 ± 0.17; Figure 4C). In the unilateral preparation functionally related HLS1 and FLS1 areas were reciprocally connected and able to excite M1 (Figure 4D). Photostimulation of BCS1 led to secondary activation of M1 (0.86 ± 0.08), consistent with our sensory stimulation data and previous reports (Ferezou et al., 2007). BCS1 photostimulation was able to excite limb sensory areas and M1, yet limb cortical areas were less able to activate BCS1, V1, and A1. Stimulation within posterior cortical areas tended to produce lower levels of both local and regional depolarization as assessed using VSD imaging. It is possible that regional differences in ChR2 expression may have contributed to this pattern (Wang et al., 2007). However, examination of sagittal sections from the transgenic mice indicated that ChR2 expression within the layer 5 region did not vary by more than 50% across the anterior-posterior axis (Figures 5A–E) and EEG recordings showed that ChR2-evoked depolarization following photostimulation correlated with increases in VSD fluorescence that were still readily detectable, even within posterior regions with relatively lower ChR2 expression (Figure 5F). Region-specific differences in excitability can in part be compensated by examining patterns of relative responsiveness (normalized to the maximum response observed over the ROIs that were assessed) as we have done.
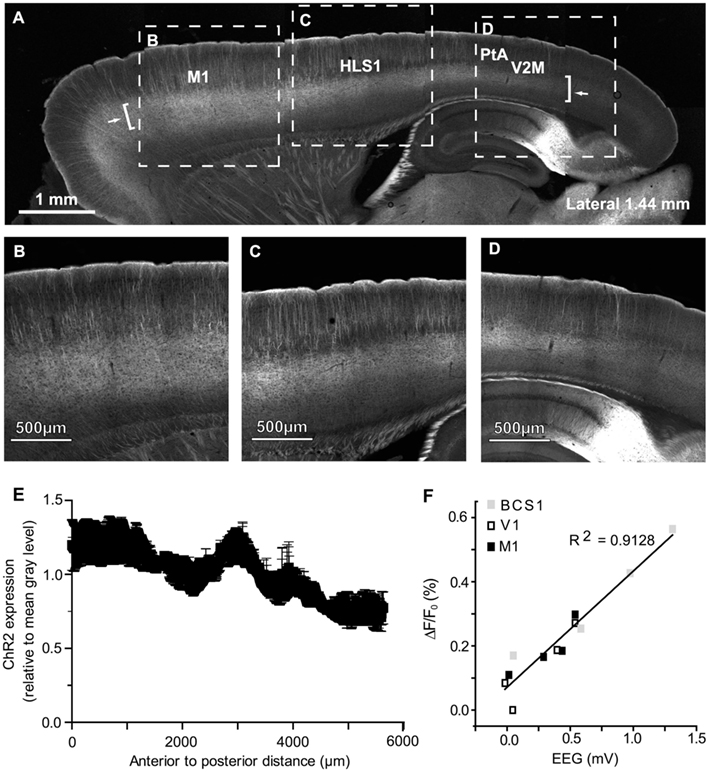
Figure 5. Channelrhodopsin-2 expression and ChR2-evoked EEG responses across the anterior-posterior axis of cortex. (A) Confocal image of a 50-μm sagittal section (1.44 mm lateral from Bregma) from a ChR2 transgenic mouse (line 18, stock 007612, strain B6.Cg-Tg (Thy1-COP4/EYFP) 18Gfng/J from the Jackson Laboratory); high magnification shown in (B–D). Arrows indicate the start and end points of the fluorescence profile in (E). Brackets indicate the approximate location of layer 5 sampled for the profile in (E). (B) High magnification image from the anterior area of the section shown in (A). (C) High magnification image from the section shown in (A). (D) High magnification image from the posterior end of the section shown in (A). (E) Anterior to posterior fluorescence profile of average ChR2 expression, quantified relative to mean gray value per animal. Data shown as mean gray value ± SEM (n = 3 animals). (F) Relationship between VSD signal strength and EEG depolarization following photostimulation at different ROIs within a single representative animal. Peak VSD responses are plotted against peak EEG depolarizations following photostimulation at different sties.
Channelrhodopsin-2 photostimulation allowed us to determine relationships between primary and secondary sensory areas as well as association cortices (RS, PTA, and M2/CG). Stimulation of secondary sensory areas revealed strong reciprocal connections with primary sensory areas (Figure 4D). Some areas, in particular the PTA, appeared to be connected to most cortical areas (Figure 4D). Reciprocal connections can be seen in the connectivity matrix, especially in neighboring areas such as M1 and M2/CG; the M1 to M2/CG connection weight is 0.84 ± 0.06 while the M2/CG to M1 weight is 0.78 ± 0.13 indicating a nearly symmetric connection between these regions. Conversely, dissimilar connection weights can also be seen between visual cortex stimulation sites. For example, the V2M to V1 weight is 0.30 ± 0.16 while the V1 to V2M weight is 0.73 ± 0.17, indicating an asymmetric reciprocal connection. This implies a weighted directed (i.e., asymmetric) network (Rubinov and Sporns, 2010).
We used a permutation test to compare mean node strength from primary sensory (S1) areas (FLS1, HLS1, BCS1, A1, and V1) to secondary sensory (S2) areas (FLS2, HLS2, BCS2, V2M, and V2L) with the mean node strength from S2 areas to S1 areas (i.e., reciprocal node strengths). The mean strength from S1 to S2 areas was 1.99, while the mean strength from S2 to S1 was 1.36 (p = 0.03). This suggests that reciprocal connections between S1 and S2 are not of equivalent strength but are instead biased for network flow from S1 to S2.
Analysis of VSD Responses after Channelrhodopsin-2 Stimulation in Control Animals
Controls performed using glutamate receptor antagonists (n = 3 mice; Figures 6A–C) or wild type mice (n = 3; Figure 6D), indicated that the ChR2-evoked VSD responses were dependent on both the presence of ChR2 and intracortical synaptic transmission. A two-way repeated measures ANOVA was completed to compare responses before and after application of glutamate antagonists at HLS1 and BCS1 using connectivity matrices. There was a significant difference in responses before and after antagonist application (p < 0.01), indicating that intracortical synaptic transmission is required for the observed spread of activity. In wild type animals that lacked ChR2 expression no consistent photostimulation-evoked responses were observed.
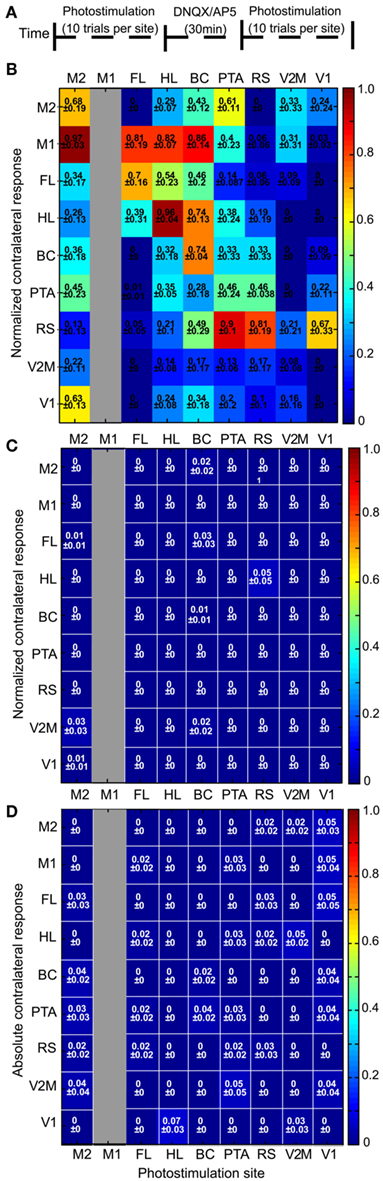
Figure 6. Channelrhodopsin-2 -evoked VSD responses are dependent on intracortical synaptic transmission and ChR2. (A) Schematic showing the experimental timeline for pharmacological blockade of intracortical transmission. (B) Connectivity matrix showing normalized VSD responses before antagonist application. (C) Connectivity matrix showing VSD responses after application of 200 μM DNQX and 200 μM AP5 to the cortical surface (n = 3 mice). VSD responses were normalized to the VSD response before antagonist application. (D) Connectivity matrix showing contralateral responses to photostimulation in the bilateral preparation in wild type mice (n = 3). In ChR2-negative animals we failed to evoke significant regional VSD responses using photostimulation. Responses were assigned a value of zero (0 ± 0), when the response failed to be four times greater than the SD of the baseline. Note for (B–D) M1 was not a photostimulation site (gray column) but was used as a ROI for VSD responses.
Intrahemispheric Network Analysis of Regional Activity Evoked by Channelrhodopsin-2 Stimulation
In order to better understand intrahemispheric relationships between cortical areas we derived an intracortical network diagram (Figure 7A) using the VSD response at 20 ms after stimulation (from our unilateral connectivity matrix; Figure 4D). For clarity in displaying the network in Figures 7 and 8, we applied a threshold to highlight the strongest connections which determine the global network properties. We tested variable threshold levels against two network metrics: characteristic path length (L; Figure 7B) and mean clustering coefficient (C; Figure 7C; see Materials and Methods). An absolute threshold of 0.5 was applied to the connectivity matrix (normalized VSD responses of 0.5 and higher were maintained) and had minimal effects on L and C; this threshold changed L by 6% and C by 0.13%. The number of connections in the network after thresholding was reduced from 182 to 55, leaving 30% of the original connections. We used these connections to create the network diagram, but performed all calculations and statistical testing on the full (unthresholded) connection matrix.
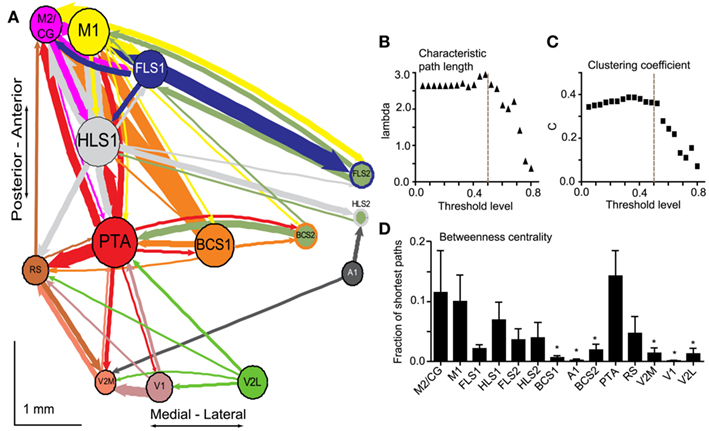
Figure 7. Network analysis of connectivity matrices reveals cortical hubs. (A) A weighted, directed network diagram was derived from the unilateral connectivity matrix (n = 6 mice) shown in Figure 4D by thresholding the elements (weights) at a relative response of 0.5. Nodes were placed according to the site of photostimulation with size proportional to the strength of connections per node (sum of weights). Arrow thickness is related to weight of an individual connection. (B) Average characteristic path length as a function of varying thresholds. A threshold of 0.5 (dashed line) results in a 6% decrease in characteristic path length within the network. (C) Average clustering coefficient as a function of varying thresholds. A threshold of 0.5 (dashed line) results in a negligible change (0.13%) to clustering coefficient within the network. (D) Betweenness centrality calculated for each node (stimulation site; n = 6 mice) to determine the fraction of shortest paths that pass through a given node and define network hubs. Post-tests were calculated between PTA and all other nodes (*p < 0.05).
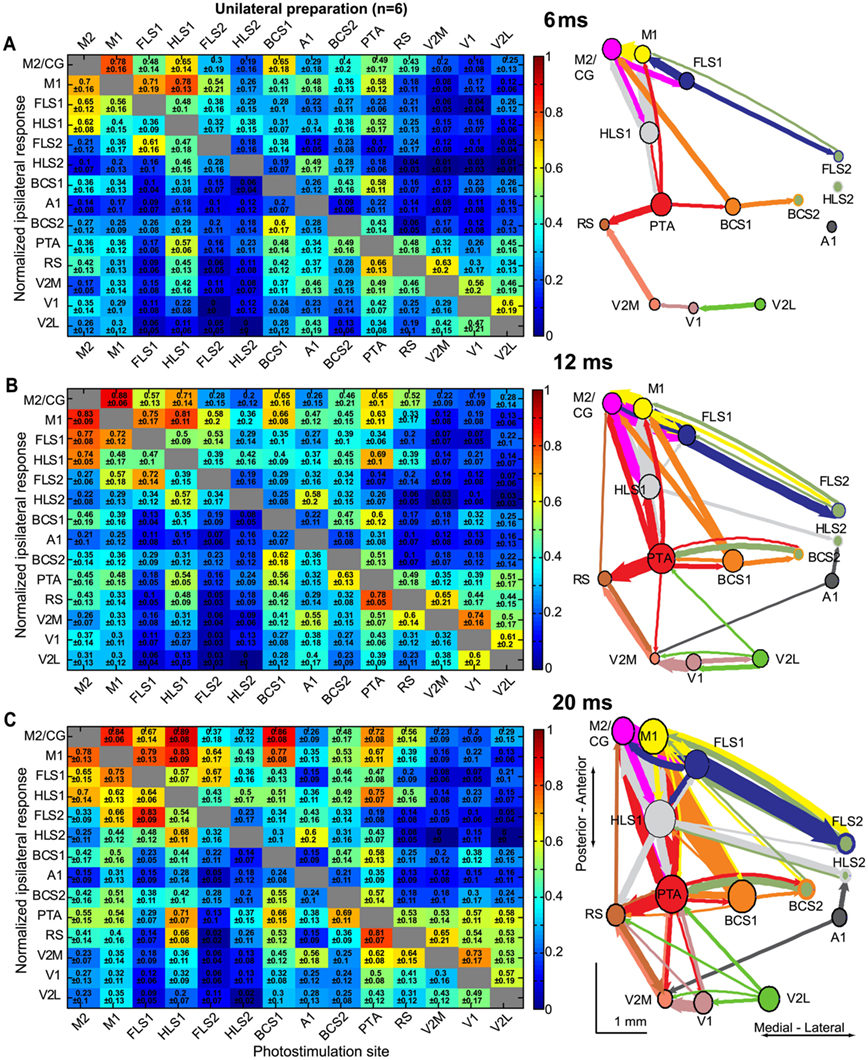
Figure 8. Intrahemispheric connectivity changes over millisecond timescales after direct cortical photostimulation. Connectivity matrices and network diagrams derived from the unilateral preparation at 6 ms (A), 12 ms (B), and 20 ms (C) after stimulation. For each timepoint, VSD responses were normalized to the maximum response per stimulation site, per animal, and averaged across animals (n = 6 mice). VSD responses were integrated to represent the sum of the VSD response from response onset. In each case, a 0.5 threshold was applied for display purposes so only the strongest connections were used to create the network diagrams. Nodes were placed according to the site of photostimulation. The size of node is proportional to the strength of connections per node (sum of weights) and arrow thickness between nodes is proportional to the weight of the connection.
The diagram represents the data as a network of the strongest connections observed in our study, with each stimulation site (ROI) corresponding to a node and average VSD responses corresponding to the weight of the connections between nodes (Figure 7A). The network was drawn such that the node size is proportional to the node strength and the thickness of the connecting lines is proportional to the edge weight of the particular connection. The nodes were positioned based on the average brain coordinates for six animals. The diagram allows the reciprocal connections between brain regions to be visualized. For example, the connection from BCS1 to M1 was considerably stronger than the reciprocal direction (compare arrow thickness between these two nodes). Using unthresholded VSD responses from the connectivity matrix, permutation testing was used to test the hypothesis that individual nodes were symmetric in the mean input and output weight of their edges (data not shown). We anticipated that primary sensory nodes would have greater output weights (that is, stronger connections going toward other regions such as S2) compared to input weight (that is, connections coming into the node from other regions), while secondary sensory nodes would have greater input weight compared to output weight. Indeed, for most primary sensory nodes, output weight was significantly greater than input weight (HLS1 p = 0.03, BCS1 p < 0.01, and A1 p < 0.01). Contrary to our hypothesis only some secondary sensory nodes showed a significant difference between input and output weight. FLS2 and V2M had significantly stronger input weight compared to output weight (FLS2 p = 0.02, V2M p < 0.01), while BCS2 had significantly higher output weight compared to input weight (BCS2 p = 0.02). M2/CG and retrosplenial cortex showed significantly greater input weight (p < 0.01 and p = 0.02, respectively). The other nodes showed no statistical difference in their mean output and input weights.
To further assess the relative importance of individual nodes within the network we calculated the BC for each node (Figure 7D). The BC is the fraction of shortest paths between pairs of nodes in the network that pass through the node of interest. This metric is used to highlight network hubs (Rubinov and Sporns, 2010). We found that PTA had the highest BC and a one-way ANOVA of the BC per node revealed a significant main effect of node (p < 0.05, n = 6 animals) and Bonferronni post-tests were calculated between PTA and the remaining nodes (Figure 7D).
It is possible that differences in node location may influence our ability to measure the strength of the node within the network; a bias may exist in defining hubs for nodes that are near to the edge of the craniotomy because we are unable to measure all connections to and from these nodes. To determine whether this was a major factor we calculated the minimum distance to the edge of the craniotomy for each node and compared this to node strength and BC. Pearson’s correlation coefficient showed a significant but modest correlation between node strength and distance to the edge of the craniotomy (r = 0.66, p = 0.01), with nodes at a greater distance from the edge showing a higher node strength (data not shown). However, there was no significant correlation between distance from the edge of the craniotomy and BC (r = 0.15, p = 0.62), suggesting that nodes can be defined as hubs irrespective of their spatial location within the craniotomy window (data not shown).
In order to assess the spread of the observed VSD signal over time, we analyzed the integrated VSD responses at several timepoints after stimulation. We created connectivity matrices and network diagrams at 6, 12, and 20 ms after photostimulation (Figures 8A–C). At 6 ms after stimulation the areas of activation were localized to the homotopic region (for the bilateral preparation), and areas that are presumably more directly linked to the photostimulation site (for the unilateral preparation; Figure 8A). For example, previous work indicates that excitation can spread through projections from BCS1 to M1 (a distance of ∼4 mm) within ∼8 ms (Ferezou et al., 2007). At early timepoints (6–12 ms), relatively strong connections were found between primary and secondary somatosensory nodes, as well as between areas such as BCS1 and M1 that may have a direct connection, but were less likely to occur between less-related nodes such as A1 and RS (Figure 8B). At 20 ms after photostimulation the number of highly connected nodes increased and relatively strong connections were observed for most nodes, including between V1 and RS or PTA cortex (Figure 8C). This early localization and subsequent spreading of VSD signal to related and more distant nodes is similar to the VSD signal spread that we observed following sensory stimulation (Figure 2), and as reported previously (Ferezou et al., 2007; Brown et al., 2009).
A network diagram derived from sensory stimulation was completed to further compare similarities between photostimulation and sensory stimulation (Figure A2 in Appendix). The sensory diagram is limited in the number of projections it can show because only five of the 14 ROIs in our unilateral preparation are primary sensory areas that can be activated reliably through peripheral sensory stimulation. For this reason, the sensory network diagram cannot include information about back projections from secondary or associational areas, and will likely contain unknown contribution from subcortical sources.
Discussion
Self-Assembly of Functional Cortical Circuits through Stimulation of Neuronal Subsets
Rather than an isotropic spread of activity from the site of photostimulation, single point ChR2 activation of predominantly deep layer cortical pyramidal neurons (Wang et al., 2007) reconstitutes much of the activity patterns observed with normal sensory activation, thus the map can be said to “self-assemble” after stimulation. This self-assembly was evident in a number of different sensory circuits. For example, photostimulation of the BCS1 produced a characteristic secondary activation of M1 which has been previously reported using electrode stimulation (Ferezou et al., 2007). ChR2 point stimulation can be targeted to arbitrary locations, including secondary sensory and association areas, to generate maps via self-assembly which are inaccessible by normal sensory stimulation. We have used this feature to reveal novel findings regarding reciprocal connections between primary and secondary sensory or association areas, extending previous anatomical work (Aronoff et al., 2010) to function.
Data analysis indicates consensus patterns between sensory-evoked and ChR2-evoked VSD responses for intra-and interhemispheric connectivity, such as expected homotopic connections to the opposite hemisphere. Layer 5B neurons primarily have subcortical connections, such as to the striatum and the posteromedial thalamic nucleus (Hattox and Nelson, 2007). Activity present in the opposite hemisphere following photostimulation of ChR2-expressing layer 5 neurons suggests subsequent activation of cortical neurons with transcallosal homotopic projections (Koralek et al., 1990; Hattox and Nelson, 2007), or may suggest indirect activation of contralateral layer 2/3 by ipsilateral layer 2/3 neurons (Petreanu et al., 2007; Weiler et al., 2008). This suggests a multisynaptic response, which is consistent with our finding that glutamate blockers abolished the ChR2-evoked response. It is possible that axons of passage may be activated by photostimulation (Petreanu et al., 2007), but given the correspondence between ChR2 and sensory-evoked maps these potentially off-target contributions are likely small. The ability of direct cortical stimulation to recapitulate much of sensory map structure was surprising since specific thalamo-cortical or brainstem circuits may be required to ensure the proper topographic mapping of inputs (Kaas, 1999; Kleinfeld et al., 2006; Matyas et al., 2010). Therefore, cortical maps may be both the product of activity-dependent sensory inputs (Fox, 1992), as well as intrinsic cortical circuits (Kenet et al., 2003; Wiemer, 2003; Vincent et al., 2007; Ringach, 2009; Mohajerani et al., 2010). The role of thalamic feedback loops and the subcortical contribution to the signal remain unclear. Our analysis does not account for subcortical contributions, or propagation of signal in subcortical regions; thus, the network diagrams should be considered a representation of the functional connectivity of mouse dorsal neocortex evoked by a subset of neurons, and should not be considered a comprehensive connectivity map. The self-assembly of map-like representations from single point stimulation has implications for other fields of neuroscience including prosthetic brain stimulation (Nicolelis and Lebedev, 2009). Although there has been clinical success using brain stimulation (Perlmutter and Mink, 2006), or within animal models (Gradinaru et al., 2009), the effect of direct cortical stimulation on brain circuitry remains unclear. Based on our observations of self-organizing maps, optogenetic, or electrode-based stimulation could be used to activate relevant intracortical circuitry.
Recently, optogenetic stimulation has been paired with functional magnetic resonance imaging (opto-fMRI; Lee et al., 2010; Desai et al., 2011; Kahn et al., 2011) and similar blood oxygenation level-dependent (BOLD) signals between photostimulation of BCS1 and sensory stimulation of the whisker have been reported (Kahn et al., 2011). Here, we expand on the suggestion that optogenetic stimulation elicits neuronal activity that is closely matched to sensory stimulation by comparing optogenetic stimulation of cortical sites with a number of different sensory stimuli, while employing an imaging approach that allows us to dynamically follow cortical activity with high spatiotemporal resolution to derive maps of cortical activity.
Possible Limitations of Simultaneous Voltage Sensitive Dye Imaging and Channelrhodopsin-2 Stimulation in vivo
We used a nearly collimated beam to photostimulate a number of ROIs across the cortical surface. Despite the fact that our beam diameter was 85 μm, we would expect considerable scattering of excitation light at the depth of ChR2-expressing neurons. Previous work in our lab using these ChR2 mice for motor mapping has reported increased beam width at a depth of 250 μm (Ayling et al., 2009). While local insertion of light fibers into the cortex would result in a lesser degree of light scattering and could potentially target smaller populations of neurons, we believe our approach has advantages because repeated placement of light fibers could lead to cortical damage that may result in an immediate redistribution of cortical response (Mohajerani et al., 2011).
We used in vivo VSD imaging in anesthetized animals to map large-scale cortical activity patterns. The behavioral state could impact the VSD responses we observe (Ferezou et al., 2007), however previous studies have shown that anesthesia does not prevent cortical responses to sensory stimulation (Hudetz and Imas, 2007). Although ChR2 stimulation revealed the expected intracortical activation patterns, the responses may also reflect activity within more complex pathways through the thalamus (Theyel et al., 2010) or brainstem (Nguyen and Kleinfeld, 2005; Matyas et al., 2010). It is also possible that photostimulation of primary sensory areas may evoke movements, and hence indirectly activate sensory pathways, affecting the VSD responses at motor and sensory ROIs. However, since isoflurane or urethane anesthesia were employed muscle movements are not likely and the VSD signal responses are unlikely to reflect secondary sensory responses triggered by muscle twitches (Altura and Weinberg, 1979; Antognini et al., 1999). We cannot directly address whether activation of target neurons occurs within apical dendrites that reach toward the cortical surface, or within deeper structures. Select expression of ChR2 via local injection or electroporation would not address this problem, as projections from cortical layers to subcortical structures could still cause indirect activation of deeper structures such as the thalamus.
Topical application of VSD causes staining of the cortical surface, which corresponds mainly to the superficial layers (Petersen et al., 2003a; Grinvald and Hildesheim, 2004; Mohajerani et al., 2010). While the optical signals originate mostly from the superficial layers (Ferezou et al., 2007), it is possible that activity in these layers could be driven by deeper layers or even contain optical contributions from them (Chemla and Chavane, 2010). Furthermore, it is possible that ChR2 stimulation could evoke downstream activity that remains in deeper layers (Hooks et al., 2011), and is therefore largely undetectable in the VSD signal. Due to these limitations in VSD imaging, it should be acknowledged that the networks we have shown here are specific to activity from the superficial cortical layers that is evoked following stimulation of a subset of neurons.
Voltage sensitive dyes imaging reports changes in both supra- and sub-threshold membrane potential (Grinvald and Hildesheim, 2004; Ferezou et al., 2007). Although the propagation of the subthreshold VSD signal has been described (Wu et al., 2008) and confirmed with intracellular recordings (Petersen et al., 2003a), and ChR2-evoked VSD responses correlate with EEG depolarizations, the observed response may not necessarily be indicative of action potential propagation. Nonetheless, subthreshold changes (indicating VSD responses) have been shown to influence interspike interval variance (Stern et al., 1997) and affect subsequent sensory input (Grinvald and Hildesheim, 2004). Ongoing subthreshold activity has been shown to be important in processing sensory information in the network and is correlated to behavioral state and cognitive processes (Arieli et al., 1996; Petersen et al., 2003b). Furthermore, subthreshold activation spread has been described in rat sensorimotor cortex using an electrode array (Frostig et al., 2008), indicating that subthreshold signal spread is not unique to VSD.
Finally, although we can image much of the neocortex using VSDs, we cannot resolve connections to cortical areas outside of the craniotomy and large-scale in vivo VSD imaging is not an appropriate method to study deeper cortical structures. For this reason, and due to the limited number of regions sampled, our network diagram should be considered a local connectivity map of mouse dorsal neocortex rather than a comprehensive connectome. Other cortical hub regions could exist outside of our sampling window at more lateral sites, or even in subcortical regions. Hence the network properties reported must be considered relative to the area imaged and ROIs used.
Network Analysis of Reciprocal Connections and Identification of Hub Regions Reveals Asymmetry in Large-Scale Cortical Organization
Although ChR2 stimulation was used to recapitulate cortical sensory maps, its greatest utility may be in probing of non-sensory areas. These areas are usually difficult to selectively activate through sensation or behavioral paradigms and tend to be understudied. Traditionally, they have been studied through anatomical methods, such as tracing of axonal projections (Veenman et al., 1992, 1995; Reiner et al., 2000; Brown and Dyck, 2005). These methods are informative regarding the structural organization, but they cannot answer functional questions. As our approach allows stimulation and recording from arbitrary cortical areas, we can use our functional VSD data, represented as a weighted, directed network, to investigate reciprocal connections between regions of cortex and examine the connectivity of non-sensory and associational areas in detail. This information will add to our understanding of large-scale cortical organization.
In assessing the organization of our network we examined reciprocal connections between nodes using the connection weights from our connectivity matrix. Although reciprocal connections between cortical areas in the rodent have been previously described in tracing studies (Fabri and Burton, 1991; Ferezou et al., 2007) and interhemispheric asymmetry between homotopic regions has been described (Chen-Bee and Frostig, 1996), less is known about intrahemispheric reciprocal connections. The strength of the reciprocal connections between M1 and BC has been described using a combination of structural analysis (anterograde and retrograde tracing) and ChR2-assisted circuit mapping (Petreanu et al., 2007; Mao et al., 2011), yet few studies describe intrahemispheric reciprocal connections in vivo. We found that intrahemispheric connections tended to be reciprocal, yet analysis of mean out-strength for primary and secondary sensory nodes revealed that the connection strengths between S1 and S2 were unequal; out-strength was biased in the S1 to S2 direction (S1 to S2 connections had stronger out-strength compared to S2 to S1 out-strength). The higher out-strength from S1 to S2 may suggest that S1 nodes tend to stimulate further responses in other nodes or even in sensory feedback loops, including corticothalamic circuits (Kleinfeld et al., 2006). Further analysis of connection bias at individual nodes revealed asymmetry in the out-going and in-coming weights per node (8 out of 14 nodes had asymmetric in and out connection weights), perhaps suggesting different roles in information processing, or even specialization, between nodes. Determining circuit organization at a systems level will be fundamental for our understanding of large-scale cortical processing and will build on previous work at the local cortical level using laser scanning photostimulation and glutamate uncaging in slice to map laminar connectivity (Weiler et al., 2008) and connectivity between cortical areas (Hooks et al., 2011). Both of these studies describe uneven connection strength, suggesting that asymmetrical strength in connectivity exists at multiple levels of cortical organization.
In probing the connectivity of the associational areas within the network, we found that some nodes had relatively few strong connections to or from other nodes, while other nodes had many strong connections. Specifically, we identified PTA as a hub node based on its high BC (Figure 7C). The high BC of PTA indicates that a large number of potentially important connections within the network pass through this region. The PTA has been previously described as an important multisensory association area in the rat (Kolb and Walkey, 1987), monkey (Lynch, 1980), and human (Kertzman et al., 1997; Culham and Kanwisher, 2001). In the rodent, it has been suggested that the PTA is involved in sensory functions, especially due to its proximity to the visual cortices, and in movements in space (Kolb and Walkey, 1987). Lesions to PTA result in spatial navigation deficits in a landmark task in the rat (Kolb and Walkey, 1987), and a spatial novelty task in the mouse (Thinus-Blanc et al., 1996). Thus, the multimodal nature of the PTA (Andersen, 1997) is consistent with it being defined as a network hub. Unequal connection weights between nodes and the presence of hub areas within our network indicates asymmetry within the network, and implies a scale-free or small-world network, rather than a regular or random network (Feldt et al., 2011).
Outlook for Large-Scale Functional Mapping in vivo
Thus far, VSD imaging using RH1692 (Shoham et al., 1999), combined with ChR2 stimulation proves to be a workable solution for in vivo imaging of the local and long range activity patterns within the mouse dorsal neocortex, and could be used in the future to reconstitute multisynaptic response patterns through stimulation of putative downstream areas or sequenced co-stimulation of functionally related areas. While we anticipate that there will be future advances in protein-based voltage sensors (Akemann et al., 2010), these studies will need to involve new red-shifted opsins (Zhang et al., 2008), or voltage sensors to prevent simultaneous activation of ChR2. Our results indicate that cortical functional maps can be evoked from the stimulation of neuronal subsets, even though these neurons may receive only part of the afferent sensory input (Meyer et al., 2010). The ability of subpopulations of neurons to drive relevant downstream connectivity suggests that mechanisms must exist to self-assemble functional maps from off-target connections (Theyel et al., 2010). While we recognize that we have sampled a limited number of areas in this study, this method can be easily applied using alternate ROI to investigate specific circuits, or can be expanded to include many more cortical areas or the use of patterned non-point stimulation (Fino and Yuste, 2011). Here, we assume limited lateralization (asymmetry between hemispheres) within the mouse cortex, however, this method could also be used to investigate the lateralization of functional areas in the mouse (Kolb et al., 1982; Lipp et al., 1984; Chen-Bee and Frostig, 1996), expanding recent optogenetic work reporting asymmetry in the mouse hippocampus (Kohl et al., 2011). Circuit connectivity studies have been used to investigate models of disease, such as autism, where the underlying mechanism is poorly understood (Qiu et al., 2011). We anticipate that our in vivo approach could be used to deduce functional relationships between cortical areas and large-scale circuit organization in various mouse models of human disease, or to study the recovery after injury such as stroke (Nudo et al., 2001; Murphy and Corbett, 2009). A particular advantage of arbitrary point optogenetic stimulation is that cortical areas disconnected from their normal functional counterparts by damage from stroke (Feeney and Baron, 1986; Dancause and Nudo, 2011) may be assessed using photostimulation and perhaps conditioned in a manner to participate in sensory or motor processing.
Conflict of Interest Statement
The authors declare that the research was conducted in the absence of any commercial or financial relationships that could be construed as a potential conflict of interest.
Acknowledgments
This work was supported by a Canadian Institutes of Health Research (CIHR) Operating Grant MOP-12675 and a Human Frontier Science Program grant to Timothy H. Murphy, a Natural Sciences and Engineering Research Council of Canada (NSERC) Canada Graduate Scholarship and an Izaak Walton Killam Memorial Pre-Doctoral Fellowship to Diana H. Lim, a Michael Smith Foundation for Health Research postdoctoral fellowship and a Heart and Stroke Foundation of Canada and CIHR Focus on Stroke postdoctoral fellowship to Majid H. Mohajerani. We thank Jie Chen, Cindy Jiang, and Pumin Wang for assistance with data analysis and surgeries. We also thank David Jones and Kathryn Murphy of McMaster University for suggestions on network analysis tools.
Supplementary Material
The Supplementary Material for this article can be found online at http://www.frontiersin.org/neural_circuits/10.3389/fncir.2012.00011/abstract
Movie S1. Voltage sensitive dyes responses after forelimb sensory stimulation show similar response patterns to VSD responses following photostimulation of forelimb somatosensory cortical areas. Voltage sensitive dyes response following sensory stimulation of the forelimb (left), direct photostimulation of FLS1 (middle), or direct photostimulation of FLS2 (right). Data were interpolated to 200 Hz and presented as ΔF/F0 (%) and generated from the average of four trials of stimulation from a single representative mouse.
Movie S2. Voltage sensitive dyes responses after visual sensory stimulation show similar response patterns to VSD responses following photostimulation of primary visual cortex. Similar to Movie 1 comparing sensory-evoked responses (visual stimulation; left) to photostimulation-evoked responses (V1 photostimulation; right). Note the similar VSD response pattern despite differences in signal onset times. Data were interpolated to 200 Hz and presented as ΔF/F0 (%) and generated from the average of four trials of stimulation from a single representative mouse.
References
Akemann, W., Mutoh, H., Perron, A., Rossier, J., and Knopfel, T. (2010). Imaging brain electric signals with genetically targeted voltage-sensitive fluorescent proteins. Nat. Methods 7, 643–649.
Altura, B. M., and Weinberg, J. (1979). Urethane and contraction of vascular smooth muscle. Br. J. Pharmacol. 67, 255–263.
Andersen, R. A. (1997). Multimodal integration for the representation of space in the posterior parietal cortex. Philos. Trans. R. Soc. Lond. B Biol. Sci. 352, 1421–1428.
Antognini, J. F., Wang, X. W., and Carstens, E. (1999). Quantitative and qualitative effects of isoflurane on movement occurring after noxious stimulation. Anesthesiology 91, 1064–1071.
Arenkiel, B. R., Peca, J., Davison, I. G., Feliciano, C., Deisseroth, K., Augustine, G. J., Ehlers, M. D., and Feng, G. (2007). In vivo light-induced activation of neural circuitry in transgenic mice expressing channelrhodopsin-2. Neuron 54, 205–218.
Arieli, A., Sterkin, A., Grinvald, A., and Aertsen, A. (1996). Dynamics of ongoing activity: explanation of the large variability in evoked cortical responses. Science 273, 1868–1871.
Aronoff, R., Matyas, F., Mateo, C., Ciron, C., Schneider, B., and Petersen, C. C. (2010). Long-range connectivity of mouse primary somatosensory barrel cortex. Eur. J. Neurosci. 31, 2221–2233.
Ayling, O. G., Harrison, T. C., Boyd, J. D., Goroshkov, A., and Murphy, T. H. (2009). Automated light-based mapping of motor cortex by photoactivation of channelrhodopsin-2 transgenic mice. Nat. Methods 6, 219–224.
Bohland, J. W., Wu, C., Barbas, H., Bokil, H., Bota, M., Breiter, H. C., Cline, H. T., Doyle, J. C., Freed, P. J., Greenspan, R. J., Haber, S. N., Hawrylycz, M., Herrera, D. G., Hilgetag, C. C., Huang, Z. J., Jones, A., Jones, E. G., Karten, H. J., Kleinfeld, D., Kotter, R., Lester, H. A., Lin, J. M., Mensh, B. D., Mikula, S., Panksepp, J., Price, J. L., Safdieh, J., Saper, C. B., Schiff, N. D., Schmahmann, J. D., Stillman, B. W., Svoboda, K., Swanson, L. W., Toga, A. W., Van Essen, D. C., Watson, J. D., and Mitra, P. P. (2009). A proposal for a coordinated effort for the determination of brainwide neuroanatomical connectivity in model organisms at a mesoscopic scale. PLoS Comput. Biol. 5, e1000334. doi:10.1371/journal.pcbi.1000334
Borghuis, B. G., Tian, L., Xu, Y., Nikonov, S. S., Vardi, N., Zemelman, B. V., and Looger, L. L. (2011). Imaging light responses of targeted neuron populations in the rodent retina. J. Neurosci. 31, 2855–2867.
Brown, C. E., Aminoltejari, K., Erb, H., Winship, I. R., and Murphy, T. H. (2009). In vivo voltage-sensitive dye imaging in adult mice reveals that somatosensory maps lost to stroke are replaced over weeks by new structural and functional circuits with prolonged modes of activation within both the peri-infarct zone and distant sites. J. Neurosci. 29, 1719–1734.
Brown, C. E., and Dyck, R. H. (2005). Retrograde tracing of the subset of afferent connections in mouse barrel cortex provided by zincergic neurons. J. Comp. Neurol. 486, 48–60.
Callaway, E. M., and Katz, L. C. (1993). Photostimulation using caged glutamate reveals functional circuitry in living brain slices. Proc. Natl. Acad. Sci. U.S.A. 90, 7661–7665.
Chemla, S., and Chavane, F. (2010). Voltage-sensitive dye imaging: technique review and models. J. Physiol. Paris 104, 40–50.
Chen-Bee, C. H., and Frostig, R. D. (1996). Variability and interhemispheric asymmetry of single-whisker functional representations in rat barrel cortex. J. Neurophysiol. 76, 884–894.
Culham, J. C., and Kanwisher, N. G. (2001). Neuroimaging of cognitive functions in human parietal cortex. Curr. Opin. Neurobiol. 11, 157–163.
Dancause, N., and Nudo, R. J. (2011). Shaping plasticity to enhance recovery after injury. Prog. Brain Res. 192, 273–295.
Desai, M., Kahn, I., Knoblich, U., Bernstein, J., Atallah, H., Yang, A., Kopell, N., Buckner, R. L., Graybiel, A. M., Moore, C. I., and Boyden, E. S. (2011). Mapping brain networks in awake mice using combined optical neural control and fMRI. J. Neurophysiol. 105, 1393–1405.
Douglas, R. J., and Martin, K. A. (2007). Mapping the matrix: the ways of neocortex. Neuron 56, 226–238.
Fabri, M., and Burton, H. (1991). Ipsilateral cortical connections of primary somatic sensory cortex in rats. J. Comp. Neurol. 311, 405–424.
Feldt, S., Bonifazi, P., and Cossart, R. (2011). Dissecting functional connectivity of neuronal microcircuits: experimental and theoretical insights. Trends Neurosci. 34, 225–236.
Feng, G., Mellor, R. H., Bernstein, M., Keller-Peck, C., Nguyen, Q. T., Wallace, M., Nerbonne, J. M., Lichtman, J. W., and Sanes, J. R. (2000). Imaging neuronal subsets in transgenic mice expressing multiple spectral variants of GFP. Neuron 28, 41–51.
Ferezou, I., Haiss, F., Gentet, L. J., Aronoff, R., Weber, B., and Petersen, C. C. (2007). Spatiotemporal dynamics of cortical sensorimotor integration in behaving mice. Neuron 56, 907–923.
Fox, K. (1992). A critical period for experience-dependent synaptic plasticity in rat barrel cortex. J. Neurosci. 12, 1826–1838.
Frostig, R. D., Xiong, Y., Chen-Bee, C. H., Kvasnak, E., and Stehberg, J. (2008). Large-scale organization of rat sensorimotor cortex based on a motif of large activation spreads. J. Neurosci. 28, 13274–13284.
Golshani, P., Goncalves, J. T., Khoshkhoo, S., Mostany, R., Smirnakis, S., and Portera-Cailliau, C. (2009). Internally mediated developmental desynchronization of neocortical network activity. J. Neurosci. 29, 10890–10899.
Gradinaru, V., Mogri, M., Thompson, K. R., Henderson, J. M., and Deisseroth, K. (2009). Optical deconstruction of parkinsonian neural circuitry. Science 324, 354–359.
Grinvald, A., and Hildesheim, R. (2004). VSDI: a new era in functional imaging of cortical dynamics. Nat. Rev. Neurosci. 5, 874–885.
Hattox, A. M., and Nelson, S. B. (2007). Layer V neurons in mouse cortex projecting to different targets have distinct physiological properties. J. Neurophysiol. 98, 3330–3340.
Histed, M. H., Bonin, V., and Reid, R. C. (2009). Direct activation of sparse, distributed populations of cortical neurons by electrical microstimulation. Neuron 63, 508–522.
Hooks, B. M., Hires, S. A., Zhang, Y. X., Huber, D., Petreanu, L., Svoboda, K., and Shepherd, G. M. (2011). Laminar analysis of excitatory local circuits in vibrissal motor and sensory cortical areas. PLoS Biol. 9, e1000572. doi:10.1371/journal.pbio.1000572
Hudetz, A. G., and Imas, O. A. (2007). Burst activation of the cerebral cortex by flash stimuli during isoflurane anesthesia in rats. Anesthesiology 107, 983–991.
Kaas, J. H. (1999). Is most of neural plasticity in the thalamus cortical? Proc. Natl. Acad. Sci. U.S.A. 96, 7622–7623.
Kahn, I., Desai, M., Knoblich, U., Bernstein, J., Henninger, M., Graybiel, A. M., Boyden, E. S., Buckner, R. L., and Moore, C. I. (2011). Characterization of the functional MRI response temporal linearity via optical control of neocortical pyramidal neurons. J. Neurosci. 31, 15086–15091.
Kenet, T., Bibitchkov, D., Tsodyks, M., Grinvald, A., and Arieli, A. (2003). Spontaneously emerging cortical representations of visual attributes. Nature 425, 954–956.
Kertzman, C., Schwarz, U., Zeffiro, T. A., and Hallett, M. (1997). The role of posterior parietal cortex in visually guided reaching movements in humans. Exp. Brain Res. 114, 170–183.
Kleinfeld, D., Ahissar, E., and Diamond, M. E. (2006). Active sensation: insights from the rodent vibrissa sensorimotor system. Curr. Opin. Neurobiol. 16, 435–444.
Kleinfeld, D., and Delaney, K. R. (1996). Distributed representation of vibrissa movement in the upper layers of somatosensory cortex revealed with voltage-sensitive dyes. J. Comp. Neurol. 375, 89–108.
Kohl, M. M., Shipton, O. A., Deacon, R. M., Rawlins, J. N., Deisseroth, K., and Paulsen, O. (2011). Hemisphere-specific optogenetic stimulation reveals left-right asymmetry of hippocampal plasticity. Nat. Neurosci. 14, 1413–1415.
Kolb, B., Sutherland, R. J., Nonneman, A. J., and Whishaw, I. Q. (1982). Asymmetry in the cerebral hemispheres of the rat, mouse, rabbit, and cat: the right hemisphere is larger. Exp. Neurol. 78, 348–359.
Kolb, B., and Walkey, J. (1987). Behavioural and anatomical studies of the posterior parietal cortex in the rat. Behav. Brain Res. 23, 127–145.
Koralek, K. A., Olavarria, J., and Killackey, H. P. (1990). Areal and laminar organization of corticocortical projections in the rat somatosensory cortex. J. Comp. Neurol. 299, 133–150.
Kravitz, A. V., Freeze, B. S., Parker, P. R., Kay, K., Thwin, M. T., Deisseroth, K., and Kreitzer, A. C. (2010). Regulation of parkinsonian motor behaviours by optogenetic control of basal ganglia circuitry. Nature 466, 622–626.
Lee, J. H., Durand, R., Gradinaru, V., Zhang, F., Goshen, I., Kim, D. S., Fenno, L. E., Ramakrishnan, C., and Deisseroth, K. (2010). Global and local fMRI signals driven by neurons defined optogenetically by type and wiring. Nature 465, 788–792.
Lipp, H. P., Collins, R. L., and Nauta, W. J. (1984). Structural asymmetries in brains of mice selected for strong lateralization. Brain Res. 310, 393–396.
Logothetis, N. K., Augath, M., Murayama, Y., Rauch, A., Sultan, F., Goense, J., Oeltermann, A., and Merkle, H. (2010). The effects of electrical microstimulation on cortical signal propagation. Nat. Neurosci. 13, 1283–1291.
London, J. A., Cohen, L. B., and Wu, J. Y. (1989). Optical recordings of the cortical response to whisker stimulation before and after the addition of an epileptogenic agent. J. Neurosci. 9, 2182–2190.
Lutcke, H., Murayama, M., Hahn, T., Margolis, D. J., Astori, S., Zum Alten Borgloh, S. M., Gobel, W., Yang, Y., Tang, W., Kugler, S., Sprengel, R., Nagai, T., Miyawaki, A., Larkum, M. E., Helmchen, F., and Hasan, M. T. (2010). Optical recording of neuronal activity with a genetically-encoded calcium indicator in anesthetized and freely moving mice. Front. Neural Circuits 4:9. doi:10.3389/fncir.2010.00009
Lynch, J. C. (1980). The functional organization of posterior parietal association cortex. Behav. Brain Sci. 3, 485–199.
Mank, M., Santos, A. F., Direnberger, S., Mrsic-Flogel, T. D., Hofer, S. B., Stein, V., Hendel, T., Reiff, D. F., Levelt, C., Borst, A., Bonhoeffer, T., Hubener, M., and Griesbeck, O. (2008). A genetically encoded calcium indicator for chronic in vivo two-photon imaging. Nat. Methods 5, 805–811.
Mao, T., Kusefoglu, D., Hooks, B. M., Huber, D., Petreanu, L., and Svoboda, K. (2011). Long-range neuronal circuits underlying the interaction between sensory and motor cortex. Neuron 72, 111–123.
Matyas, F., Sreenivasan, V., Marbach, F., Wacongne, C., Barsy, B., Mateo, C., Aronoff, R., and Petersen, C. C. (2010). Motor control by sensory cortex. Science 330, 1240–1243.
Meyer, H. S., Wimmer, V. C., Hemberger, M., Bruno, R. M., De Kock, C. P., Frick, A., Sakmann, B., and Helmstaedter, M. (2010). Cell type-specific thalamic innervation in a column of rat vibrissal cortex. Cereb. Cortex 20, 2287–2303.
Minderer, M., Liu, W., Sumanovski, L. T., Kugler, S., Helmchen, F., and Margolis, D. J. (2012). Chronic imaging of cortical sensory map dynamics using a genetically encoded calcium indicator. J. Physiol. (Lond.) 590, 99–107.
Mohajerani, M. H., Aminoltejari, K., and Murphy, T. H. (2011). Targeted mini-strokes produce changes in interhemispheric sensory signal processing that are indicative of disinhibition within minutes. Proc. Natl. Acad. Sci. U.S.A. 108, E183–E191.
Mohajerani, M. H., Mcvea, D. A., Fingas, M., and Murphy, T. H. (2010). Mirrored bilateral slow-wave cortical activity within local circuits revealed by fast bihemispheric voltage-sensitive dye imaging in anesthetized and awake mice. J. Neurosci. 30, 3745–3751.
Murphy, T. H., and Corbett, D. (2009). Plasticity during stroke recovery: from synapse to behaviour. Nat. Rev. Neurosci. 10, 861–872.
Nguyen, Q. T., and Kleinfeld, D. (2005). Positive feedback in a brainstem tactile sensorimotor loop. Neuron 45, 447–457.
Nicolelis, M. A., and Lebedev, M. A. (2009). Principles of neural ensemble physiology underlying the operation of brain-machine interfaces. Nat. Rev. Neurosci. 10, 530–540.
Nudo, R. J., Plautz, E. J., and Frost, S. B. (2001). Role of adaptive plasticity in recovery of function after damage to motor cortex. Muscle Nerve 24, 1000–1019.
Paxinos, G., and Franklin, K. B. J. (2001). The Mouse Brain in Stereotaxic Coordinates. San Diego: Academic Press.
Perlmutter, J. S., and Mink, J. W. (2006). Deep brain stimulation. Annu. Rev. Neurosci. 29, 229–257.
Perron, A., Mutoh, H., Launey, T., and Knopfel, T. (2009). Red-shifted voltage-sensitive fluorescent proteins. Chem. Biol. 16, 1268–1277.
Petersen, C. C., Grinvald, A., and Sakmann, B. (2003a). Spatiotemporal dynamics of sensory responses in layer 2/3 of rat barrel cortex measured in vivo by voltage-sensitive dye imaging combined with whole-cell voltage recordings and neuron reconstructions. J. Neurosci. 23, 1298–1309.
Petersen, C. C., Hahn, T. T., Mehta, M., Grinvald, A., and Sakmann, B. (2003b). Interaction of sensory responses with spontaneous depolarization in layer 2/3 barrel cortex. Proc. Natl. Acad. Sci. U.S.A. 100, 13638–13643.
Petreanu, L., Huber, D., Sobczyk, A., and Svoboda, K. (2007). Channelrhodopsin-2-assisted circuit mapping of long-range callosal projections. Nat. Neurosci. 10, 663–668.
Qiu, S., Anderson, C. T., Levitt, P., and Shepherd, G. M. (2011). Circuit-specific intracortical hyperconnectivity in mice with deletion of the autism-associated met receptor tyrosine kinase. J. Neurosci. 31, 5855–5864.
Reiner, A., Veenman, C. L., Medina, L., Jiao, Y., Del Mar, N., and Honig, M. G. (2000). Pathway tracing using biotinylated dextran amines. J. Neurosci. Methods 103, 23–37.
Ringach, D. L. (2009). Spontaneous and driven cortical activity: implications for computation. Curr. Opin. Neurobiol. 19, 439–444.
Rubinov, M., and Sporns, O. (2010). Complex network measures of brain connectivity: uses and interpretations. Neuroimage 52, 1059–1069.
Shepherd, G. M., Stepanyants, A., Bureau, I., Chklovskii, D., and Svoboda, K. (2005). Geometric and functional organization of cortical circuits. Nat. Neurosci. 8, 782–790.
Shoham, D., Glaser, D. E., Arieli, A., Kenet, T., Wijnbergen, C., Toledo, Y., Hildesheim, R., and Grinvald, A. (1999). Imaging cortical dynamics at high spatial and temporal resolution with novel blue voltage-sensitive dyes. Neuron 24, 791–802.
Stern, E. A., Kincaid, A. E., and Wilson, C. J. (1997). Spontaneous subthreshold membrane potential fluctuations and action potential variability of rat corticostriatal and striatal neurons in vivo. J. Neurophysiol. 77, 1697–1715.
Theyel, B. B., Llano, D. A., and Sherman, S. M. (2010). The corticothalamocortical circuit drives higher-order cortex in the mouse. Nat. Neurosci. 13, 84–88.
Thinus-Blanc, C., Save, E., Rossi-Arnaud, C., Tozzi, A., and Ammassari-Teule, M. (1996). The differences shown by C57BL/6 and DBA/2 inbred mice in detecting spatial novelty are subserved by a different hippocampal and parietal cortex interplay. Behav. Brain Res. 80, 33–40.
Tian, L., Hires, S. A., Mao, T., Huber, D., Chiappe, M. E., Chalasani, S. H., Petreanu, L., Akerboom, J., Mckinney, S. A., Schreiter, E. R., Bargmann, C. I., Jayaraman, V., Svoboda, K., and Looger, L. L. (2009). Imaging neural activity in worms, flies and mice with improved GCaMP calcium indicators. Nat. Methods 6, 875–881.
van den Heuvel, M. P., and Sporns, O. (2011). Rich-club organization of the human connectome. J. Neurosci. 31, 15775–15786.
Veenman, C. L., Reiner, A., and Honig, M. G. (1992). Biotinylated dextran amine as an anterograde tracer for single- and double-labeling studies. J. Neurosci. Methods 41, 239–254.
Veenman, C. L., Wild, J. M., and Reiner, A. (1995). Organization of the avian “corticostriatal” projection system: a retrograde and anterograde pathway tracing study in pigeons. J. Comp. Neurol. 354, 87–126.
Vincent, J. L., Patel, G. H., Fox, M. D., Snyder, A. Z., Baker, J. T., Van Essen, D. C., Zempel, J. M., Snyder, L. H., Corbetta, M., and Raichle, M. E. (2007). Intrinsic functional architecture in the anaesthetized monkey brain. Nature 447, 83–86.
Wang, H., Peca, J., Matsuzaki, M., Matsuzaki, K., Noguchi, J., Qiu, L., Wang, D., Zhang, F., Boyden, E., Deisseroth, K., Kasai, H., Hall, W. C., Feng, G., and Augustine, G. J. (2007). High-speed mapping of synaptic connectivity using photostimulation in Channelrhodopsin-2 transgenic mice. Proc. Natl. Acad. Sci. U.S.A. 104, 8143–8148.
Weiler, N., Wood, L., Yu, J., Solla, S. A., and Shepherd, G. M. (2008). Top-down laminar organization of the excitatory network in motor cortex. Nat. Neurosci. 11, 360–366.
Wiemer, J. C. (2003). The time-organized map algorithm: extending the self-organizing map to spatiotemporal signals. Neural. Comput. 15, 1143–1171.
Wu, J. Y., Xiaoying, H., and Chuan, Z. (2008). Propagating waves of activity in the neocortex: what they are, what they do. Neuroscientist 14, 487–502.
Zhang, F., Prigge, M., Beyriere, F., Tsunoda, S. P., Mattis, J., Yizhar, O., Hegemann, P., and Deisseroth, K. (2008). Red-shifted optogenetic excitation: a tool for fast neural control derived from Volvox carteri. Nat. Neurosci. 11, 631–633.
Appendix
Optrode Recording
A silicon optrode with 16 recording sites (Alxl6-3 mm-50-413-Opl6, NeuroNexus Technologies) was used for recording of neuronal activity following ChR2 stimulation (Kravitz et al., 2010). The optrode contained sixteen 413 μm2 recording sites, arranged linearly with 50 μm spacing between each site. The probe was inserted into the forelimb area of the primary sensory cortex (FLS1) in Thyl-ChR2 transgenic mice under urethane anesthesia. A 473 nm diode pumped solid state laser (IKE-473-100-OP, IkeCool) was coupled to the optrode using a fiber-optic patch cord (FC-x.x-NNC, NeuroNexus Technologies). Laser power was adjusted to yield 5 mW at the fiber tip. Broadband signals (1–5000 Hz) from the probe were amplified (1000×), digitized (25 kHz), and stored for offline data analysis. For spike train analysis, the data were first high pass filtered (>600 Hz). All spike detection and sorting took place offline using open source code in Matlab (Wave_Clus, http://www2.le.ac.uk/departments/engineering/research/bioengineering/neuroengineering -lab/spike-sorting).
Network Analysis of Sensory Stimulation
As in the network analysis for ChR2 stimulation, we used custom-written MatLab programs to create a connectivity matrix using sensory-evoked VSD responses from each ROI in the unilateral preparation. Here, each node corresponds to one ROI in the unilateral preparation connected by edges with weights proportional to the integrated VSD signal observed at that ROI at 20 ms after sensory stimulation. Sensory stimulation included forelimb, hindlimb, whisker, visual, and auditory stimulation, thus projections were only measured from the corresponding primary sensory areas (FLS1, HLS1, BCS1, VI, and Al). VSD responses were normalized per stimulation site, per animal, before averaging. In this case, we display all of the connections in the network (no threshold was applied).
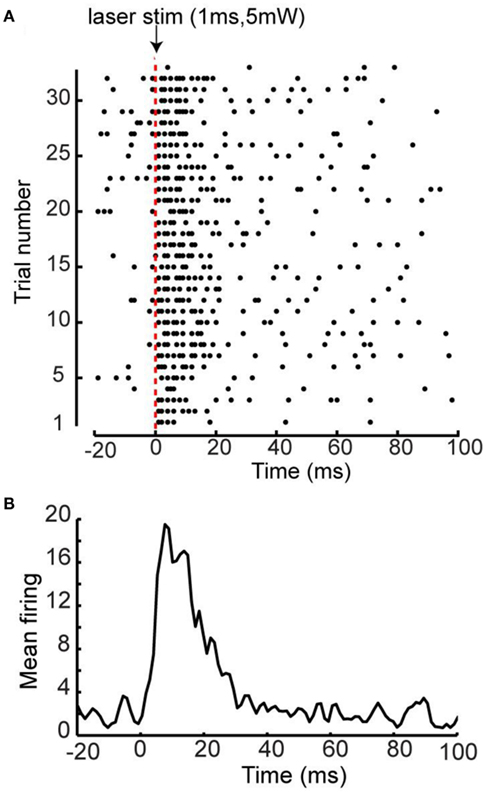
Figure A1. Optrode recordings from FLS1 of Thy1-ChR2 transgenic mice following photostimulation. (A) Raster plot of neuronal spikes following a 1-ms 5 mW laser pulse. (B) Mean firing rate of spikes in response to laser stimulation.
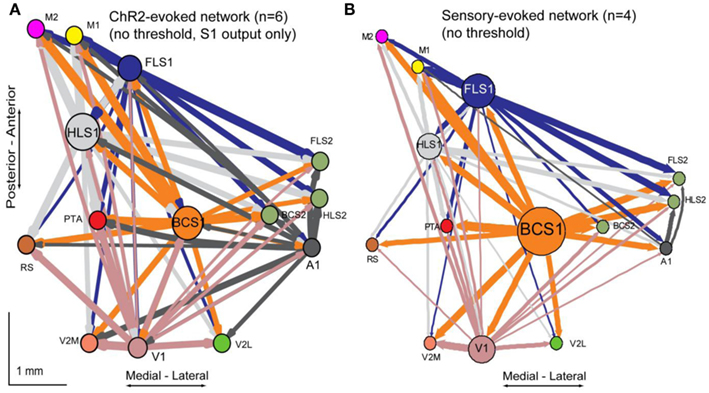
Figure A2. Comparison of the ChR2-evoked network with the sensory-evoked network. (A) A weighted, directed network diagram was derived following photostimulation of each ROI in the unilateral preparation by using the unilateral connectivity matrix (n = 6 mice) shown in Figure 4D. Nodes were placed according to the site of photostimulation with size proportional to the strength of connections per node (sum of weights). Arrow thickness is related to weight of an individual connection. Only output from the primary sensory areas (FLS1, HLS1, BCS1, V1, and Al) was used here. The elements (weights) were not thresholded. (B) A weighted, directed network diagram was derived following sensory stimulation of the forelimb, hindlimb, whisker, visual system, and auditory system in the unilateral preparation. Node size is proportional to the strength of connections per node (sum of weights). Arrow thickness is proportional to the weight of an individual connection.
Keywords: channelrhodopsin, optogenetics, in vivo imaging, network analysis, reciprocal connections, connectivity, cortical mapping, voltage sensitive dye
Citation: Lim DH, Mohajerani MH, LeDue J, Boyd J, Chen S and Murphy TH (2012) In vivo large-scale cortical mapping using channelrhodopsin-2 stimulation in transgenic mice reveals asymmetric and reciprocal relationships between cortical areas. Front. Neural Circuits 6:11. doi: 10.3389/fncir.2012.00011
Received: 20 January 2012; Accepted: 24 February 2012;
Published online: 15 March 2012.
Edited by:
Timothy A. Ryan, Weill Medical College of Cornell University, USAReviewed by:
Carlos Portera-Cailliau, University of California Los Angeles, USAGordon M. G. Shepherd, Northwestern University, USA
Copyright: © 2012 Lim, Mohajerani, LeDue, Boyd, Chen and Murphy. This is an open-access article distributed under the terms of the Creative Commons Attribution Non Commercial License, which permits non-commercial use, distribution, and reproduction in other forums, provided the original authors and source are credited.
*Correspondence: Timothy H. Murphy, Kinsmen Laboratory of Neurological Research, University of British Columbia, Detwiller Pavilion Room 4N1, 2255 Wesbrook Mall, Vancouver, BC, Canada V6T 1Z3. e-mail: thmurphy@mail.ubc.ca
†Diana H. Lim and Majid H. Mohajerani have contributed equally to this work.