 Jürgen Kornmeier1,2* and Michael Bach2
- 1 Institute for Frontier Areas of Psychology and Mental Health, Freiburg, Germany
- 2 University Eye-Hospital, Freiburg, Germany
During observation of ambiguous figures our perception reverses spontaneously although the visual information stays unchanged. Research on this phenomenon so far suffered from the difficulty to determine the instant of the endogenous reversals with sufficient temporal precision. A novel experimental paradigm with discontinuous stimulus presentation improved on previous temporal estimates of the reversal event by a factor of three. It revealed that disambiguation of ambiguous visual information takes roughly 50 ms or two loops of recurrent neural activity. Further, the decision about the perceptual outcome has taken place at least 340 ms before the observer is able to indicate the consciously perceived reversal manually. We provide a short review about physiological studies on multistable perception with a focus on electrophysiological data. We further present a new perspective on multistable perception that can easily integrate previous apparently contradicting explanatory approaches. Finally we propose possible extensions toward other research fields where ambiguous figure perception may be useful as an investigative tool.
Introduction
Normally we experience our visual world as stable and unambiguous – it seems to be as we see it. Numerous optical illusions (Bach, 1997), however, demonstrate that the information provided via our eyes is restricted, thus incomplete and often ambiguous. Our perceptual system needs to disambiguate and interpret it in order to construct stable unambiguous percepts that allow us to successfully act in our environment. Extreme cases are ambiguous figures, like the classical Necker cube (Figure 1A, Necker, 1832) or Borings Old/Young woman (Figure 1C, Boring, 1930), designed to render two (or even more) perceptual interpretations about equally probable (indicated in Figures 1B,D). Another example is binocular rivalry, where the observer’s two eyes see different images (Blake, 1989, 2001). In all of these cases the brain states corresponding to the two interpretations become unstable and spontaneous perceptual reversals can occur although the external stimulus stays unchanged.
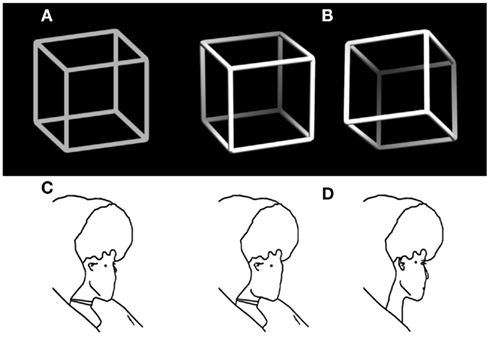
Figure 1. Examples of ambiguous figures and their disambiguated variants. (A) The Necker cube (Necker, 1832) and (B) disambiguated versions with depth cues and a lightning model. (C) Outline version of Borings Old/Young woman figure (Boring, 1930) adapted from Gale and Findlay (1983) and (D) disambiguated old (left) and young woman figure (right).
Ambiguous figures can be found in any textbook about cognitive sciences and neuroscience. The perspective to experimentally separate perceptual interpretation – which changes periodically – from the earliest steps of visual processing – which should stay unchanged, like the visual input – has attracted scientists from various disciplines in the field. It is believed that understanding the mechanisms underlying the perceptual reversal or finding the location(s) of the switch between sensory and perceptual processing may help to understand how the activity pattern of sensory receptors is translated into a complex representation of the perceptual world (perceptual organization, e.g., Pomerantz and Kubovy, 1981), how this representation is realized neurally (object representation) and how it gets conscious (e.g., Crick and Koch, 1998; Blake and Logothetis, 2002; Dehaene and Changeux, 2011).
We will here review the findings from physiological studies on ambiguous figures with a specific focus on EEG studies. Based on the results available so far we will propose a new perspective on the phenomenon, which easily integrates approaches that appeared to be contradictory so far.
Scientific studies of perceptual instability phenomena have been carried out for nearly 200 years and explanations so far followed two main traditions, namely the bottom-up (or sensory) and the top-down (or cognitive) explanatory approaches.
The bottom-up approach assumes that perceptual reversals result from cycles of passive adaptation, recovery, and mutual inhibition of competing neural units or channels in early visual areas (e.g., Köhler, 1940; Toppino and Long, 1987). There is plenty of experimental evidence for this approach and some key findings are listed below:
Several studies demonstrated local (retinotopic) adaptation effects (e.g., Howard and Durham, 1961; Long et al., 1992; Long and Olszweski, 1999), effects of stimulus features (e.g., Washburn et al., 1931; Ammons and Ammons, 1963), and of presentation mode (e.g., Orbach et al., 1963; Kornmeier et al., 2007) on the initial percept and the reversal dynamics of ambiguous figures.
The top-down approach, in apparent contrast, assumes perceptual reversals as the result from active high-level/cognitive processes like attention, expectation, decision-making, and learning (Gregory, 1974; Rock et al., 1994b; Leopold and Logothetis, 1999). Some key findings supporting this approach are: (1) Although the bottom-up approach implies regular oscillations between the two interpretations, the durations of successive intervals of transiently stable percepts (“dwell times”) are unpredictable and show characteristics of a stochastic process (e.g., fit to gamma distribution, Borsellino et al., 1972; Murata et al., 2003; Brascamp et al., 2005). According to Leopold and Logothetis (1999) this is a signature of high-level exploratory behavior. (2) Perceptual reversals are very rare or even absent, when observers do not know that alternative interpretational possibilities exist (e.g., Girgus et al., 1977; Rock et al., 1994a), a finding hard to reconcile with fully automatic adaptation processes. Further, the rate of reversals can be modulated volitionally, although they cannot be prevented totally (e.g., Liebert and Burk, 1985; Strüber and Stadler, 1999).
While most of the authors so far exclusively favored either a bottom-up or a top-down explanation, more and more studies indicate that both classes of factors play important roles and must be integrated in an explanation of the phenomenon (e.g., Hochberg and Peterson, 1987; Blake and Logothetis, 2002; Tong et al., 2006; Kornmeier et al., 2009; Bartels and Logothetis, 2010).
EEG Studies and the Time Reference Problem
The EEG allows millisecond resolution of neural processes underlying perceptual reversals and thus may provide the necessary temporal precision to resolve the debate about whether low-level bottom-up or high-level/cognitive processes are at work. However a precise time reference is necessary for EEG analysis but difficult to establish because of the endogenous character of the reversal event. Two major strategies have evolved to circumvent this problem, both with advantages and disadvantages. In the following we will discuss the relevant studies and relate their results to each other.
The “Manual Response Paradigm” – Using Manual Response as Time Reference
The principal idea is to present an ambiguous stimulus continuously and use participants’ manual indications of perceptual reversals as time reference to analyze the data in a certain interval backward in time. Typical control intervals in manual response studies were periods of stable percept (e.g., Basar-Eroglu et al., 1996) and spontaneous EEG intervals during fixation of a fixation target (e.g., Strüber et al., 2001). Spontaneous key presses not related to perceptual reversals were considered as control for EEG components related to motor preparation and execution (Basar-Eroglu et al., 1993). This paradigm has been applied in a number of studies and the results are summarized in the following:
P300-like parietal positivity
A positive event-related potential (ERP) with a right parietal maximum (P4 electrode, “parietal positivity”) occurred ≈250 ms before key press with reversals of motion direction of the stroboscopic alternative motion (SAM) stimulus (Schiller, 1933; Basar-Eroglu et al., 1993; Strüber and Herrmann, 2002) and with orientation reversals of the Necker cube (Strüber et al., 2001; Mathes et al., 2006). This parietal positivity was interpreted as a variant of the well-known cognitive P300 ERP component (e.g., Pritchard, 1981; Verleger et al., 2005) and thus taken as evidence for top-down processes. Strüber and Herrmann (2002) compared MEG activity during endogenous motion reversals of the SAM with exogenously induced motion reversals of disambiguated SAM variants (the two dots moved concurrently either horizontally or vertically in the same direction). They found a reversal-related parietal positivity both for endogenous as well as for exogenously induced motion reversals. Given reaction times from their unambiguous stimulus conditions of about 550 ms, the authors assumed that their parietal positivity occurs subsequent to the motion reversal and reflects its conscious recognition.
Alpha-band power decrease
İşoğlu-Alkaç (2000) used the Necker cube in their study and reported a decrease of alpha-band power in the time range of the parietal positivity compared to alpha activity during a time range immediately before. The authors argue that because alpha-power decrease occurs with active brain states while alpha-power increase with passive states of decreased cortical excitability, alpha power (8–16 Hz) decrease together with the P300-like positivity indicate active cognitive processes during perceptual reversals (İşoğlu-Alkaç et al., 2000). Strüber and Herrmann (2002) found a relatively constant value of alpha oscillation (10 Hz) until it suddenly drops between 300 and 200 ms before button press for exogenously induced SAM-motion reversal, and a continuous decrease in alpha activity within 1000 ms before key press for endogenous reversals. They interpreted the latter as evidence for a slow bottom-up destabilization of the active perceptual interpretation compared to a sudden exogenously driven destabilization. İşoğlu-Alkaç and Strüber (2006) recently found that alpha-power decrease is restricted to the lower alpha bands (6–10 Hz) whereas the upper alpha band (10–12 Hz) was unaffected.
Gamma-band power increase
Basar-Eroglu et al. (1996) found (non-phase-locked) EEG gamma band (30–50 Hz) enhancement within 1000 ms before key press related to SAM reversals compared to perceptual stability (during a time interval after key press) most prominent at the right frontal electrode position (F4). The results were interpreted as evidence for cognitive destabilization processes underlying perceptual reversals. Strüber et al. (2000) found higher SAM reversal-related gamma activity (28–48 Hz) for participants with high reversal rates (reversals per time unit) compared to participants with low reversal rates. The authors interpret their results as further support for the involvement of attentional top-down processing during endogenous motion reversals. Strüber et al. (2001) confirmed these results for the Necker cube.
In Mathes et al.’s (2006) study participants had to volitionally either speed up or slow down the reversal rate or keep a passive attitude toward a Necker cube stimulus. The authors reported higher amplitude of the P300-like positivity and higher gamma activity (28–48 Hz) during the slow down condition than during the speed up condition.
Summary
Taking the above studies together, gamma power increases and alpha-power decreases in a time interval 1000 ms before participants’ manual indication of perceptual reversals of an ambiguous figure. Between 500 and 250 ms before key press a parietal positivity occurs which is interpreted as indicating conscious recognition of a perceptual reversal. The reversal event itself then must have occurred earlier.
Problems of the Manual Response Paradigm
EEG results from the manual response paradigm suggest that endogenous perceptual reversals take place between 1000 and 550 ms before observers’ manual response. However, the available data can easily be interpreted either in bottom-up or top-down direction.
Further, as the authors emphasize, manual reaction times strongly vary both intra-individually and inter-individually (Strüber et al., 2000; Strüber and Herrmann, 2002). Recently we estimated the amount of reaction time variance related to orientation reversals of a Necker cube (Kornmeier and Bach, 2004b) in the following way: using depth cues, we created two unambiguous and thus perceptually stable variants of the Necker cube (Figure 1B). These appeared in random order, and participants indicated perceived orientation reversals with a key press. Median reaction time from five subjects was 616 ms with an interquartile range from 530 to 733 ms. ERP example traces (±SEM) from the occipital location (Oz) of one participant are seen in Figure 2A: When the EEG is averaged with respect to the exogenous stimulus reversal (continuous vertical line), sharply defined ERP components result (dashed vertical line indicates the median reaction time). Figure 2B: When the same EEG is “backward averaged” with respect to the participant’s response, the early visual ERP components are largely obliterated. It is thus likely, and indeed we will show that endogenous reversals are accompanied by ERP structures earlier than the parietal positivity that can be indentified only with a more precise time reference.
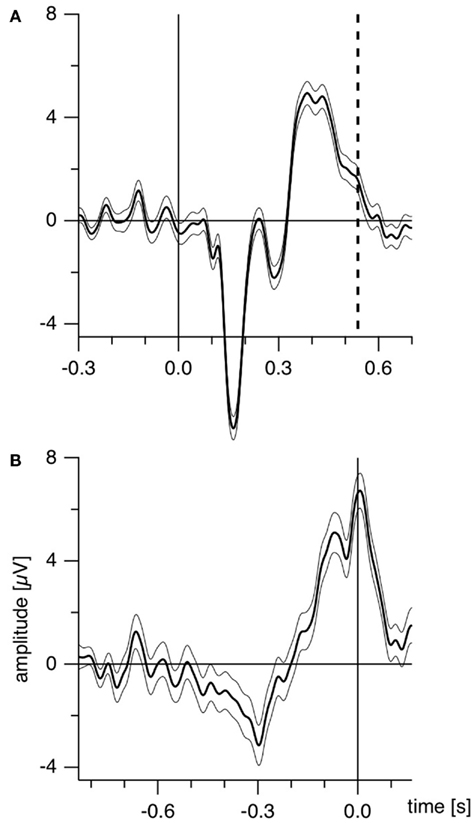
Figure 2. Estimating manual reaction time variance. Participants observed unambiguous cubes (similar to Figure 1B) that randomly reversed (16 times per minute on the average) and indicated manually each perceived orientation reversal. (A) ERP traces (±SEM) from the occipital location of one participant with the exogenous reversal instance as time reference for averaging (vertical line) are seen. Sharply defined early ERP components result; the reaction time is widely scattered (200 ms interquartile range; dashed line indicates median reaction time). (B) The same EEG data averaged backward with reaction times as time references (vertical line). The early visual ERP components are largely obliterated. Only the late positivity is roughly similar to (A). The Onset Paradigm (Figure 4) avoided this problem.
The Onset Paradigm: Stimulus Onset as Time Reference
The onset paradigm goes back to the work of the Orbach group (e.g., Orbach et al., 1963; Orbach et al., 1966). They presented a Necker cube discontinuously, varied presentation time and inter-stimulus interval (ISI) and found that reversal rates are modulated in a non-monotonic manner mainly as a function of ISI. Figure 3 depicts their data together with data from our own lab (Kornmeier et al., 2002).
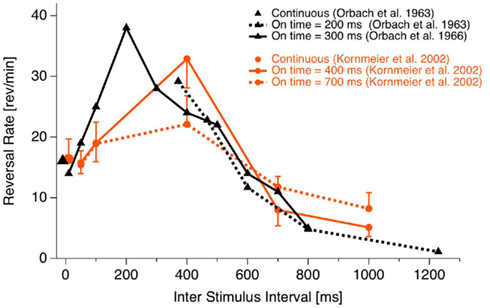
Figure 3. Reversal rate as a function of ISI. Reversal rates with continuous and discontinuous presentations of ambiguous Necker stimuli from different studies. Reversal rates behave non-monotonically, increasing with ISI up to 400 ms. Thereafter they decrease with further increasing ISIs. (Fig from Kornmeier et al., 2007, modified).
As can be seen, for ISIs shorter than about 400 ms reversal rates increase monotonically up to more than twice the rate during continuous observation. After 400 ms a monotonic decrease of reversal rates can be observed. Reversals can even be brought to stand still with ISIs in the range of seconds (Leopold et al., 2002; Maier et al., 2003). Most relevant for EEG studies is that reversals occurred typically near stimulus onset if the presentation time was short enough (Orbach et al., 1966). Stimulus onset thus promised to be a more precise time reference of the reversal event than reaction times.
O’Donnell et al. (1988) were the first study to use stimulus onset as time reference for averaging EEG data. In two conditions participants viewed the ambiguous Necker cube and (apparently) unambiguous cube variants for 700 ms followed by ISIs of 3300 ms. After each stimulus offset they indicated their previous percept by pressing one of two possible keys. In the case of the ambiguous Necker cube, perceptual reversals between two successive stimulus presentations were purely endogenous, whereas in the case of the unambiguous cube variants perceptual reversals were regarded as exogenously induced by stimulus alternations. The authors compared reversal trials with non-reversal trials and found a late parietal/frontal positivity for both exogenously induced and endogenous perceptual reversals. In the case of exogenously induced reversals this positivity was larger and occurred earlier (around 550 ms after stimulus onset) compared to endogenous reversals (around 650 ms after onset).
Identifying O’Donnell et al.’s (1988) positivity with the positivity found with the Manual Response Paradigm and accepting Strüber and Herrmann’s (2002) hypothesis about the positivity as an index of conscious realization of the reversal, O’Donnell et al.’s data restrict the reversal event to a time window of 650 ms between stimulus onset and the late positivity. Further, the similar results of O’Donnell et al.’s (1988) illusory and physical reversal conditions suggest similar processes underlying endogenous and exogenously induced perceptual reversals.
O’Donnell et al.’s (1988) data provide a sizable improvement on temporal precision, but some limitations have to be faced: (1) Their “unambiguous” cube variants are not really unambiguous. They can easily be perceived in two different orientations as either inside or outside corners of a box. (2) The non-monotonic character of the reversal rate as a function of ISI (Figure 3) suggests two separate processes, one responsible for the increasing part of the function (reversals during continuous observation and with short interruptions, Figure 3, left part), and another responsible for the decreasing part (perceptual reversals with long ISIs, Figure 3 right part). O’Donnell et al.’s choice of 3300 ms ISI places their reversals to the second type and thus raises doubts about whether they are a good model for the continuous case (see also below).
(3) A perceptual reversal during continuous observation of an ambiguous figure involves an implicit comparison of the current with the previous (different) percept, thus working memory may play a role (e.g., Pearson and Brascamp, 2008). In O’Donnell et al.’s (1988) study participants were instructed to report their percept of each presentation. Comparisons across presentations were not necessary. This task together with the relatively long ISIs may have allowed separate percepts of cube stimuli at each stimulus presentation instead of perceptual reversal experiences.
We adopted O’Donnell et al. (1988)’s paradigm but modified it in the following ways (Figure 4):
(a) Optimizing presentation time and ISI: We shortened our ISI to 400 ms to be as close to the continuous viewing condition as possible while concurrently enabling manual responses within the ISI. Presentation time was set to 800 ms, long enough to allow the full development of a P300-like positivity and short enough to keep the probability of additional perceptual reversals later during the presentation interval low.
(b) Comparison task across presentations: Our participants compared in a go/nogo task the perceived front-back orientation of the current Necker lattice (a combination of nine Necker cubes, Figure 4) with that of the preceding one in two experimental conditions. In one condition they pressed a key whenever the currently perceived orientation differed from the preceding one (“reversal condition”). The second, control condition was identical except that the task was the opposite: participants indicated when they perceived orientation of the stimulus as remaining the same (“stability condition”). All manual responses were executed in the ISI after the relevant percept in order to keep neural activity related to motor-preparation and -execution as far away as possible from the critical time interval of the reversal. Any ERP signature related to lower-level stimulus processing, afterimages, or motor preparation should be identical in the two conditions and should disappear after subtraction of the related ERP traces from each other.
(c) Like O’Donnell et al. (1988) we exogenously induced orientation reversals of unambiguous stimulus variants in a second experiment. Our unambiguous cube variants contained depth cues, like shading, central perspective, and a lighting model (Figure 1B, Woo et al., 1998).
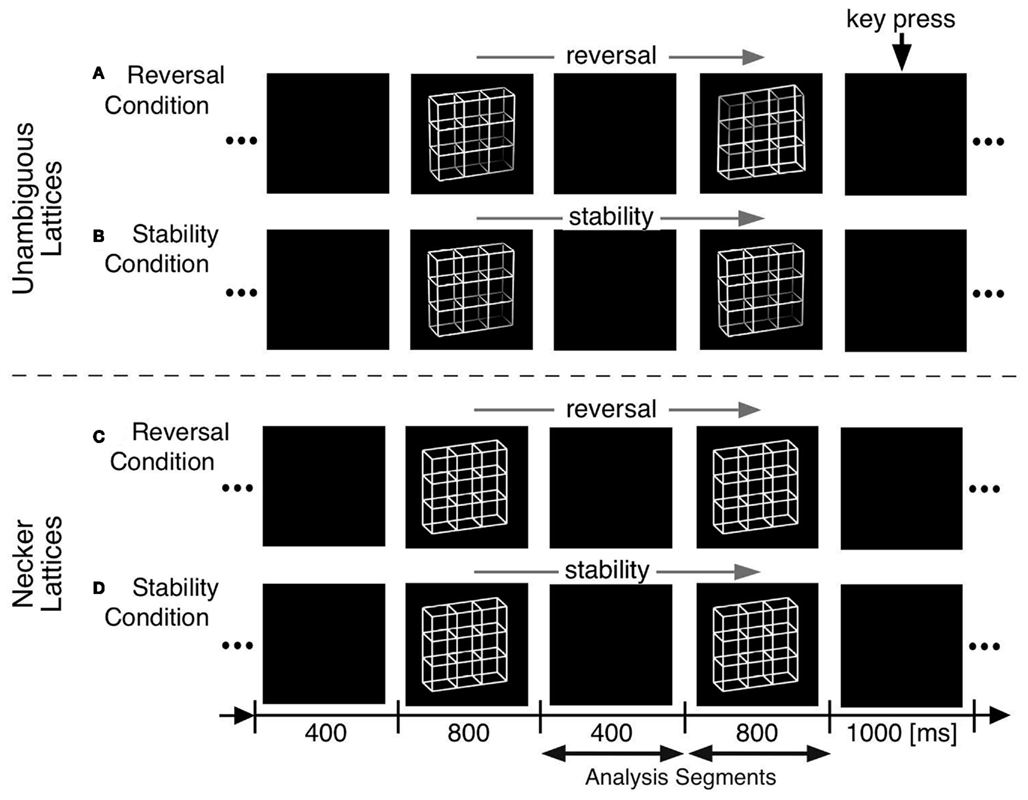
Figure 4. Onset paradigm. Participants viewed in different experiments either unambiguous lattices (A,B) or ambiguous Necker lattices (C,D) and compared the 3D perspective of successively presented stimuli. In separate experimental conditions they indicated in a go/nogo task either a perceived perspective reversal [reversal conditions in (A,C)] or perceived stability [stability conditions in (B,D)] across two successive stimulus presentations by a key press in the ISI following the respective perceptual event. Each key press extended the current ISI from 400 to 1000 ms.
Four types of ERP traces were calculated, related to (1) endogenous perceptual reversals and (2) endogenous perceptual stability of ambiguous Necker stimuli, (3) exogenously induced perceptual reversals, and (4) exogenously induced perceptual stability of disambiguated stimulus variants.
The Processing Chain of Perceptual Reversals
According to our null hypothesis, the EEG traces from the reversal and stability conditions should not differ, because both conditions contain identical stimuli, a comparison task, a mental decision, and aspects of response preparation. Further, the amount of required attention to execute the task should be equal in the two conditions.
The difference traces (“dERP,” reversal condition minus stability condition) should thus be flat and any residuum would be related to the perceptual reversal aspect. Indeed we did find a series of reversal related modulations in lower (dERP) as well as higher frequencies. Figure 5A presents the ERP traces from perceptual reversal trials (interrupted lines) and perceptual stability trials (continuous lines) on a schematic head (data from Kornmeier and Bach, 2004b). Figure 9 presents the related (induced) modulations at higher frequencies. Like in Figure 5, for each electrode position a pair of graphs depicts data from the unambiguous lattice variants on bottom on a gray background and data from the ambiguous lattices on top on a white background. The electrode positions are indicated schematically in Figures 5B and 9B. At a first glance ERP traces (Figure 5A) are very similar across stimuli and conditions. Especially the P100 components as the earliest visual responses after stimulus onset are roughly identical (Figure 6). The subsequent components match in latency but differ in amplitude. These differences are better seen in the difference traces (dERPs, Figure 5C) and their temporal relations are schematically presented in Figure 8. Likewise modulations at higher frequency are very similar across averaged conditions and experiments, and are depicted in the time–frequency charts in Figure 9A. Most conspicuous is an initial power enhancement in the alpha to beta range immediately after onset that quickly shifts to the theta and lower alpha range where it sustains. Further, a sustained beta deactivation starts about 100 ms after stimulus onset and spreads to the whole beta and upper alpha band. Differences in higher frequency power between conditions and experiments are better seen in the difference time–frequency charts in Figure 9C and their temporal relation schematically in Figure 10.
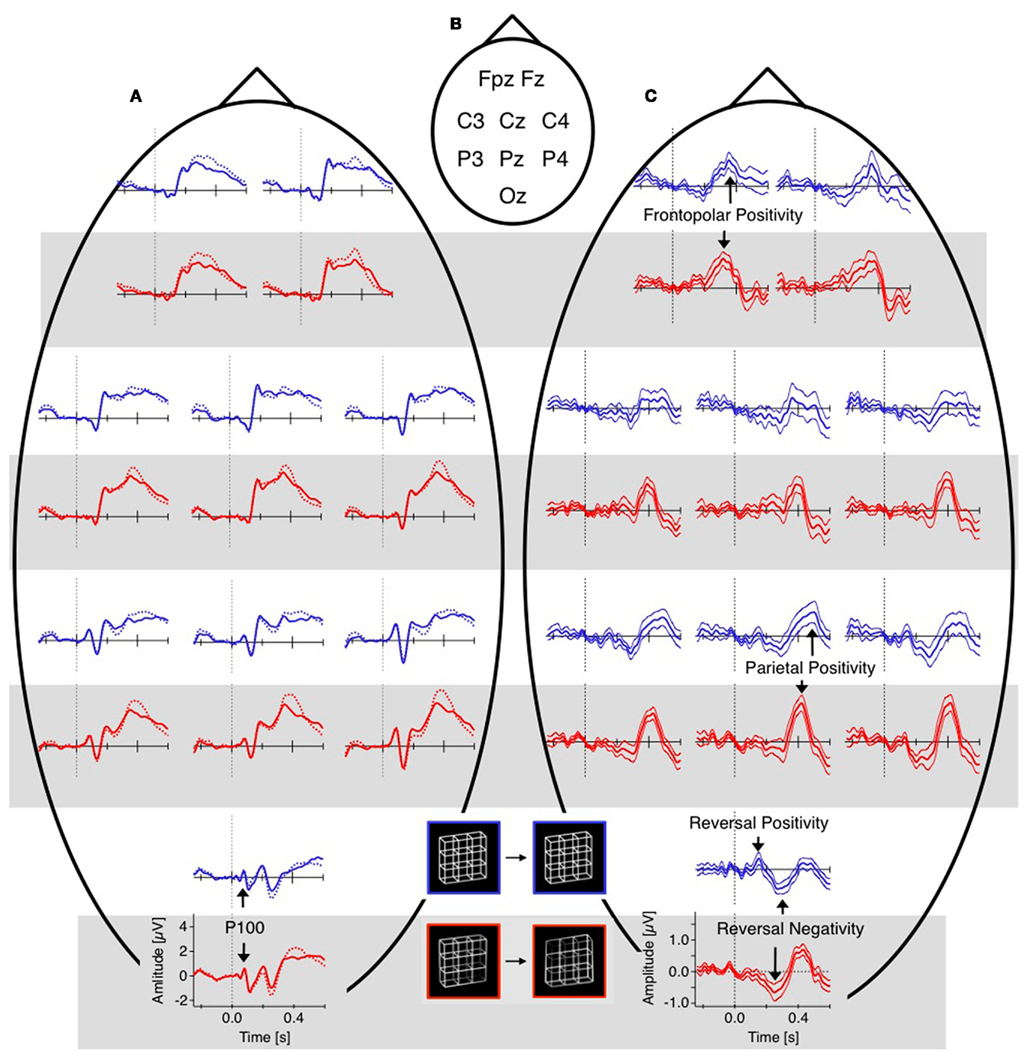
Figure 5. Grand mean ERPs (16 participants, baseline −60 to +40 ms). For each electrode position a pair of graphs contain data from the unambiguous lattice variants in red on bottom on a gray background and the data from the ambiguous lattices in blue on top on a white background. Dashed vertical lines indicate stimulus onset, electrode positions are indicated schematically in (B). (A) Raw ERPs before subtraction. The global shapes of the ERP traces at each electrode are very similar across conditions (reversal, dotted traces, and stability, continuous traces) and across experiments (ambiguous and unambiguous stimuli). This is especially true for the early visual ERP components at the occipital electrode position). (C) Difference traces (reversal minus stability). Differences ERPs (dERPs) are very similar between ambiguous and unambiguous stimuli with two exceptions: (1) All dERPs found with unambiguous stimuli occur earlier and (2) the early occipital Reversal Positivity (RP) is restricted to endogenous perceptual reversals of ambiguous Necker lattices. Data from Kornmeier and Bach (2004b).
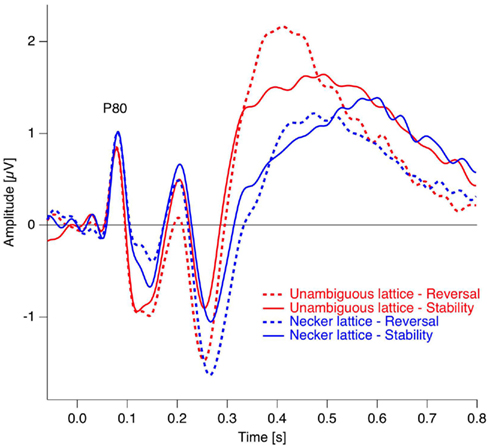
Figure 6. Grand mean ERP traces from the occipital electrode position. As can be seen, the early visual ERP components are very similar across conditions (reversal, dotted traces and stability, continuous traces) and experiments (Necker lattices, blue, and unambiguous variants, red). Data from Kornmeier and Bach (2004b).
In the following we will discuss the individual dERP components and related modulations at higher frequencies separately:
Signatures Specific for Endogenous Reversals of Ambiguous Figures
Reversal positivity
The reversal positivity (RP) occurs around 130 ms after stimulus onset, is most prominent at occipital electrode positions and restricted to endogenous reversals of the ambiguous stimuli. So far it has been reported by studies using the Onset Paradigm with Necker lattices (Kornmeier and Bach, 2005, 2006; Kornmeier et al., 2007; Britz et al., 2009), with the classical Necker cube (Kornmeier et al., 2011), with Borings (1930) Old/Young Woman (Figure 1C, Kornmeier and Bach, 2004a) and recently even with binocular rivalry stimuli (Britz and Pitts, 2011). Pitts et al. (2007) found modulations in the P1 ERP component during reversals of the Vase/Face stimulus and Schroeder’s staircase stimulus fitting with polarity and time window of the RP. Britz and Pitts recently discussed the RP as a modulation of the P1 component and localized it in “primary visual areas” (Britz and Pitts, 2011). Recent evidence from our lab suggests, however, that P1 and RP are different components (Kornmeier et al., 2011) suggesting that the P1 effect in Pitts et al. (2007) may be a superimposed RP. Pitts et al. (2008) and Intaite et al. (2010) did not find a significant RP with perceived reversals of the Necker lattice. In the latter study a strongly modified variant of the Onset Paradigm (e.g., reversals from unambiguous to ambiguous lattices) may be the reason. Pitts et al. (2009) did not analyze the data in the RP time window.
A possible explanation for the remaining inhomogeneity of results may be the following: The RP is a small component typically with amplitudes around or even below 1 μV (e.g., Kornmeier and Bach, 2005; Kornmeier and Bach, 2006; Britz et al., 2009). A critical parameter for its statistical validity is the signal-to-noise ratio and thus the number of EEG trials per subject that enter the ERP calculation. This was between 100 and 120 per condition in our studies. Britz et al. (2009) reported about 52 trials per condition and participant on average. In Pitts et al.’s (2007, 2008) studies the number of trials was down to 30 and below. Their absolute number of trials (not reported) may have been large enough to let a positive deflection appear but too low to render it significant1 (Luck, 2005; Pitts et al., 2007).
In studies using the Manual Response Paradigm the RP was probably obliterated due to reaction time variability. This would imply that reaction times are considerably less precise compared to stimulus onset as time reference. We estimated the precision of the Onset Paradigm in the following way: The earliest ERP response after stimulus onset, the P100, occurred in our data 80 ms after onset with a peak width of ±20 ms and was regarded as a low-level ERP and fully synchronized to stimulus onset. In comparison, the RP is the earliest reversal-related dERP component has a peak width of about ±35 ms. Let us now assume that it results from a convolution of the variance producing the P100-width with the variance producing the Reversal Positivity. Assuming a Gaussian peak shape, the unknown width of the temporal variance would be equal to:

(based on additivity of variances)
Thus endogenous perceptual reversals were synchronized with stimulus onset with a precision of about ±30 ms, an improvement of more than a factor of three over the manual response reference (Figure 7).
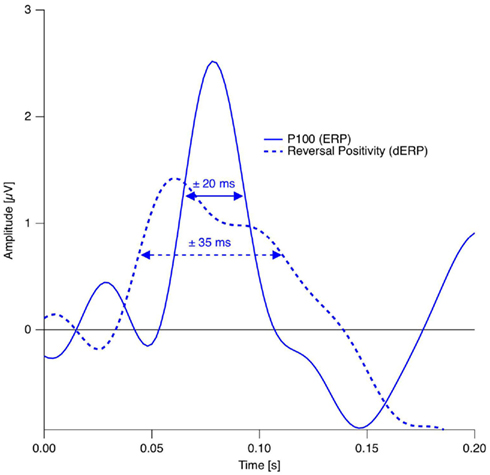
Figure 7. Estimation of the temporal precision with the Onset Paradigm. Continuous trace: Grand mean ERP trace from the occipital electrode in the reversal condition in the P100 time window. Dotted trace: Grand Mean dERP trace from the occipital electrode position in the time window of the RP. The dERP trace is shifted on the time scale in order to align the RP with the P100 and thus to simplify peak-with comparison. Data from Kornmeier and Bach (2005).
Early alpha modulations
A left-hemispheric power reduction in the alpha band (8–15 Hz) ranging from the occipital to frontopolar electrode (Component A5 in Figures 9 and 10) shows some similarities to the RP and may thus be related: Both (1) start around 130 ms, (2) are restricted to endogenous reversals, and (3) have an opposite sign as the subsequent components.
Interpretation of the RP: decision conflict during interpretation of ambiguous information. In summary, the RP shows three interesting features:
(1) It is restricted to endogenous reversals.
(2) It occurs relatively “early” during visual processing, which is reflected in its latency and its spatial distribution at occipital electrodes. For discontinuous stimulus presentation, early is well defined as occurring with short latency after stimulus onset. But what would early mean for perceptual reversals during continuous observation? Here early and late can be alternatively defined as temporal distance from reaction time. Reaction times can be estimated with ambiguous figures using the Onset Paradigm and instructing participants to respond immediately after perceived reversals. Substituting the reversal instance with stimulus onset and assuming that reversals occur only after stimulus onset, the upper limit of reaction time to endogenous reversals is in the range of 600 ms (Kornmeier and Bach, 2006). Thus the RP occurs roughly 470 ms before the manual indication of a perceived reversal (Kornmeier and Bach, 2006). In perceptual processing times 470 ms is very long and thus the RP can also be labelled as early from this point of view.
(3) The RP occurs with different types of ambiguous stimuli (Necker cube, Necker lattice, Old/Young woman stimulus and even with binocular rivalry stimuli). This indicates generality across low-level stimulus features and across stimulus types. Further, the RP differs from the spatiotemporal close P1 (Kornmeier et al., 2011).
Currently we regard the RP as an indicator of the visual system’s “detection” of ambiguity, or the related decision conflict at a certain processing level during perceptual organization (Pomerantz and Kubovy, 1981) where the ambiguity gets evident. For the Necker cube the identification of line orientations and their binding together would be low-level steps and perhaps related to the C1 and P1 ERP components (discussed in Kornmeier et al., 2011). Ambiguity occurs subsequently during the interpretation of acute and obtuse angles as orthogonal and the allocation of depth values to the different square planes. Here a perceptual decision has to be made and the RP may reflect the related conflict or its detection.
Two questions arise immediately from this speculation:
(1) In the case of the Necker cube the stimulus information is always ambiguous. Why should there be a difference in dealing with this ambiguity in reversal and stability trials (remind that the RP is a dERP, resulting from the subtraction of stability ERP traces from reversal ERP traces)? A possible answer to this question may be the following: All sensory information is incomplete and to some degree ambiguous. Our perceptual system uses (amongst other strategies) past perceptual experiences (on various time scales) to disambiguate and interpret this information. Several adaptation and priming studies support this view (e.g., Long et al., 1992; Woerner et al., 2009). The above mentioned decision conflict need not occur if the perceptual system is already strongly biased in favor of one (e.g., the previous) percept at the moment the ambiguous stimulus appears. This may be the case in our stability trials. We have estimated the disambiguation time in the case of a decision conflict with the Necker lattice as 40–70 ms (Kornmeier and Bach, 2006, see also below). If our above speculation is correct, then reaction times should be delayed by this amount in the reversal trials, where a conflict arises and disambiguation is necessary, compared to the stability trials without conflict. This is indeed what we recently found (Kornmeier et al., 2011).
(2) Disambiguation of incoming information as described above makes sense if the stimulus reappears periodically after a blank screen interval and a percept has to be created. But how can this be translated to the continuous case? There is accumulating evidence that perception is discontinuous and that our impression of perceptual continuity is an illusion (e.g., Dubois and Vanrullen, 2011). According to this view some neural instances would “perceive” a discontinuously presented stimulus similarly to a continuously presented stimulus (given a certain frequency). Some (potentially higher level) updating instance may periodically re-evaluate and re-interpret the visual input in order to notice environmental changes. Thus, periodic decisions and decision conflicts may also arise during continuous observation of an ambiguous figure. Such a concept had already been proposed in top-down explanation approaches (e.g., Vickers, 1972; Leopold and Logothetis, 1999) and also in a recent Necker-Zeno Model for Bistable Perception (Atmanspacher et al., 2004, 2008). Accordingly, the RP should not only occur with the Onset Paradigm but also with spontaneous reversals of a continuously presentated ambiguous figure. And it should be detectable if a sufficiently precise time reference were available with continuous stimulus presentation. Additional experiments with ambiguous figures from other categories (e.g., apparent motion, figure-background stimuli) need to further test the generality of the RP.
Interpretation of the alpha-power reduction: disambiguation time. The left-hemispheric reduction of alpha-power starts at the latency of the RP (130 ms), it extends from posterior to anterior sites and lasts for about 60 ms (Figures 9 and 10). Modulation of alpha activity is discussed in the contexts of change from a resting state to excitation/activation, attention and top-down modulation of perceptual processing, execution of cognitive tasks or temporal segmentation of perception and consciousness (for a review, see Palva and Palva, 2007). In the current experiment the alpha reduction may indicate recurrent activity between occipital and frontal areas to resolve the ambiguity and the related decision conflict indicated by the RP. It may thus reflect a disambiguation time of roughly 60 ms in the case of the Necker lattice. Interestingly, Foxe and Simpson (2002) indicated that in humans visual information needs only about 30 ms from striate to prefrontal cortex. Two loops of recurrent activity thus seem to be sufficient to disambiguate the Necker lattice.
Signatures Occurring with both Exogenously Induced and Endogenous Reversals
Reversal negativity
The reversal negativity (RN) is the first dERP component found with both endogenous reversals of the Necker lattices and exogenously induced reversals of the unambiguous lattice variants. It occurs roughly 220 ms after stimulus onset with exogenously induced reversals and about 40 ms later at 260 ms with endogenous reversals (Kornmeier and Bach, 2006; Intaite et al., 2010; Figure 8). This component has been reported in all studies using the onset paradigm (Kornmeier and Bach, 2004b, 2005, 2006; Kornmeier et al., 2007, 2011; Pitts et al., 2007, 2008, 2009; Britz et al., 2009; Intaite et al., 2010; Britz and Pitts, 2011). Source analysis revealed locations in the lateral occipital and inferior temporal areas (Pitts et al., 2009; Britz and Pitts, 2011).
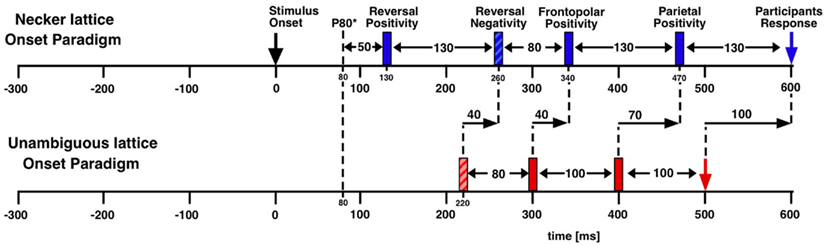
Figure 8. Schematic time scale of endogenous and exogenous dERP components. dERP components are indicated by rectangles. The vertical dashed line indicates the P100 as earliest occipital ERP component before subtraction. Negative values on the time axis reflect the time period of the ISI before stimulus onset. Data from Kornmeier and Bach(2004b, 2006).
There are, however, some differences concerning the temporal extent and the spatial distribution of the RN. These differences may be traced back to differences in the experimental paradigm concerning the time window of participants’ responses. In some studies the participants were allowed to respond immediately after a perceived reversal, i.e., already during the stimulus presentation period. In those cases the negative dERP component was both temporally and spatially extended (e.g., Pitts et al., 2008; Intaite et al., 2010; Kornmeier et al., 2011) compared to the case when responses were only allowed in the ISI following a perceived reversal. In the latter case the negative dERP component was shorter and restricted to occipital/parietal locations (e.g., Kornmeier and Bach, 2004b; Kornmeier and Bach, 2005). Kornmeier et al. (2007) demonstrated that in the cases of immediate responses (already in the stimulus presentation interval) the occipital/parietal RN is superimposed by a residual Bereitschaftspotential, which occurs later (at about 300 ms after onset) and which has a distribution from parietal to frontal positions. Elbert et al. (1985) have previously shown influence of psychological variables on the Bereitschaftspotential in the context of perceptual reversals of the Necker cube.
Interpretation of the RN. So far the functional role of the RN is unclear. It’s role as an indicator of top-down influence of the reversal process (e.g., Pitts et al., 2008) and its potential identity with the spatiotemporally very similar Selection Negativity (Anllo-Vento and Hillyard, 1996) are in discussion (Kornmeier and Bach, 2004b; Pitts et al., 2008; Intaite et al., 2010). A specific role for the RN in endogenous perceptual reversals can be ruled out by the fact that it also occurs when perceptual reversals are exogenously driven by a physical stimulus change (Kornmeier and Bach, 2006). Interestingly, the RN’s spatial location seems to be related to the stimulus type. It is most prominent at occipital/parietal locations with cube type stimuli whereas it seems to be more dominant at temporal locations in the case of Boring’s old/young woman (Kornmeier and Bach, 2004a).
Frontopolar and parietal positivities
The Frontopolar Positivity follows the RN. It is most prominent at the frontopolar electrode and occurs 300 ms after stimulus onset in the case of exogenously induced reversals, and 40 ms later at 340 ms in the case of endogenous reversals (Figures 5C and 8). No source analysis of this component has been done so far.
The Parietal Positivity follows the Frontopolar Positivity. It is maximal at parietal electrodes and occurs 400 ms after stimulus onset with exogenously induced reversals and about 70 ms later at 470 ms in the case of endogenous reversals. Most of the ERP studies using the Onset Paradigm reported a reversal-related parietal positivity with very similar spatiotemporal patterns (e.g., Kornmeier and Bach, 2004b; Pitts et al., 2008; Britz et al., 2009). It was recently localized in the bilateral superior and middle temporal as well as left inferior frontal areas (Britz and Pitts, 2011). Some studies did not discern between Frontopolar and Parietal Positivities and regarded them as one and the same component with a parietal to frontopolar extent (e.g., Britz et al., 2009; Britz and Pitts, 2011). Pitts et al. (2008) reported a frontal positive component at around 300 ms and interpreted it as a “selection positivity,” i.e., a sign-inverted frontal counterpart of the occipital/parietal Selection Negativity (Anllo-Vento and Hillyard, 1996).
Interpretation of the frontopolar positivity. Recently we found in our data strong evidence in support of two separate positive components: With our go–nogo variant of the Onset Paradigm we were able to differ between manually indicated reversal events (reversal percepts in the reversal condition, i.e., go trials) and reversal events without indication (reversal percepts in the stability conditions, i.e., nogo trials) – and with the same logic corresponding stability events. The dERPs from the go trials showed a decrease of a positivity at 400 ms and a increase of a positivity at 300 ms from parietal to frontopolar electrode positions in the case of the unambiguous lattices (Figure 11C: from bright to dark colors). This is similarly indicated but less pronounced with the ambiguous lattices with the above mentioned latency shifts (Figure 11A). In contrast, the dERPs related to the nogo trials showed a simple amplitude reduction from parietal to frontopolar electrodes without any difference in latency (Figures 11B,D). Thus, the Frontopolar Positivity is absent in the nogo trials. This observation decouples the Frontopolar Positivity both from the Parietal Positivity and the RN and may indicate a role of working memory related to the delayed response in the subsequent ISIs of the go trials – no delayed response and thus no related memory is necessary in the nogo trials. This interpretation suggests that some response-related brain instance must already know about the perceptual outcome at 300 ms (unambiguous lattices) or 340 ms (ambiguous lattices). More research is necessary to test this interpretation of the Frontopolar Positivity.
Interpretation of the parietal positivity. So far all electrophysiological studies on ambiguous figures report a slow positivity with parietal to frontal dominance. With the Onset Paradigm such a positivity occurs between 400 and 500 ms after stimulus onset and between 100 and 150 ms before the manual response (e.g., Kornmeier and Bach, 2006; Pitts et al., 2009). With the Manual Response Paradigm a slow positivity peaks roughly 250 ms before the manual response. Assuming that both paradigms identified the same component, the mismatch between latencies of about 100 ms may result from (1) different time references for averaging (stimulus onset or reaction instances) together with a temporal coupling asymmetry of this component to the two time references and (2) a merging of the Frontopolar with the Parietal Positivity in the case of backward averaging from manual responses.
Several authors identified the Parietal Positivity with the well-known P3b component, which typically occurs in oddball paradigms (Picton, 1992), and indeed Verleger et al. (2005) demonstrated the persistence of the classical P3b across onset and reaction time as time references for averaging. The interpretations of the Parietal Positivity range from (1) indication of attentional and cognitive processes during a perceptual reversal (O’Donnell et al., 1988) or (2) following it (İşoğlu-Alkac et al., 2000), (3) closure of the switching process (Strüber et al., 2001), or (4) cognitive/conscious recognition or appraisal of the reversal (Strüber and Herrmann, 2002; Kornmeier and Bach, 2006; Britz and Pitts, 2011). The following consideration supports the cognitive appraisal/visual awareness hypothesis from above: The minimal reaction time with the simplest auditory task (faster than visual) is in the range of 150 ms (Debecker and Desmedt, 1970). This gives an upper limit for a pure motor execution after the conscious response decision has taken place. It fits well with our average temporal distance between the Parietal Positivity and the manual reaction and thus may place the moment of conscious experience of the perceptual change (and the decision to indicate this) roughly at the latency of the Parietal Positivity. Further support comes from several ERP studies on ERP correlates of consciousness. There, a P3b occurs if perceptual processing of a stimulus reaches consciousness, whereas this component is absent, when the stimulus stays subliminal (Dehaene and Changeux, 2011, for a recent review).
Beta and gamma modulations common to both endogenous and exogenously induced reversals
All dERP components found with exogenously induced reversals seem to occur also with endogenous reversals, however with a temporal delay. A similar pattern of results can be observed in the beta and gamma frequency range. In the case of exogenously induced reversals a left-central increase in gamma activity at about 150 ms (40–65 Hz, Figures 9 and 10, component A6) followed by a bilateral central increase in beta activity (14–26 Hz, Figures 9 and 10, component A7) at around 260 ms can be observed. Correspondingly, in the case of endogenous reversals a left-central gamma increase starts at about 250 ms and thus 100 ms later than the exogenous counterpart (Figures 9 and 10, component U2). An increase in beta activity follows at around 320 ms (Figures 9 and 10, component U3). Significance for the latter, however, is restricted to the right-central electrode position. Although the pattern of results agrees less well than the dERP components, which might partly be due to the lower temporal resolution of time–frequency analyses compared to ERPs, component A6 might be associated with component U2 and the same may apply to components A7 and U3 (indicated by a gray shading in Figure 10) and the temporal delay between these components has the same sign as with the dERP components.
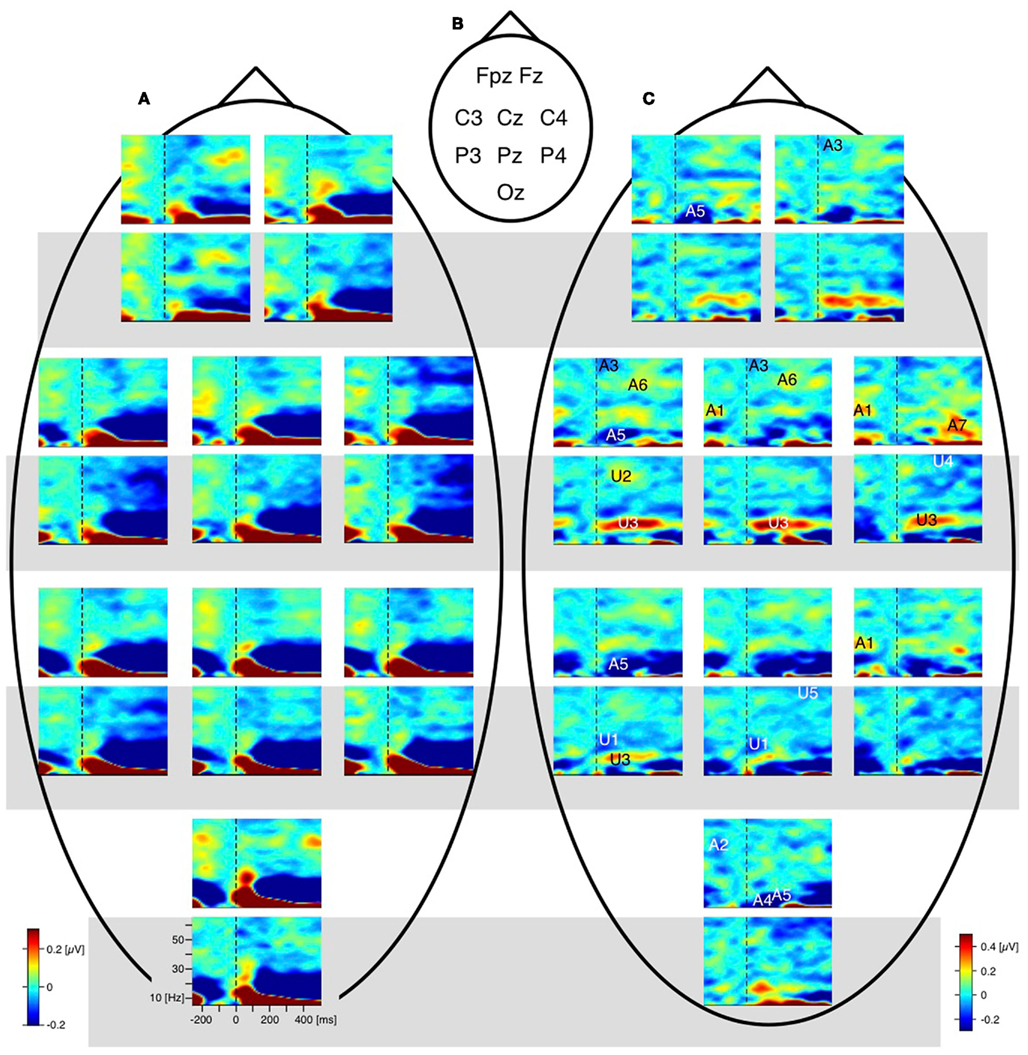
Figure 9. Grand mean EEG time–frequency charts. For each electrode position a pair of time–frequency charts contain data from the unambiguous lattice variants (bottom, grey background) and the data from the ambiguous lattices (above, white background). Dashed vertical lines mark the stimulus onset. (A) Raw time–frequency charts. Grand mean time–frequency charts were obtained by averaging data across participants and conditions. Electrode positions are indicated schematically in (B). (C) Differences of grand mean EEG time–frequency charts (reversal minus stability). Entries in (B) (e.g., A1, U2, …) indicate the position of significant deflections from zero in the time–frequency plane. A, ambiguous; U, unambiguous; numbers indicate the temporal order of effects; black/white colouring of the numbers and letters is only for saliency. Most remarkable is the gamma band modulation before onset of the ambiguous Necker stimulus (deflection A1 at electrodes P4 and C4 and Cz; and deflection A2 at electrode Oz). No such modulation occurs with the unambiguous stimulus variants. (from Ehm et al., 2011, Figure 2).
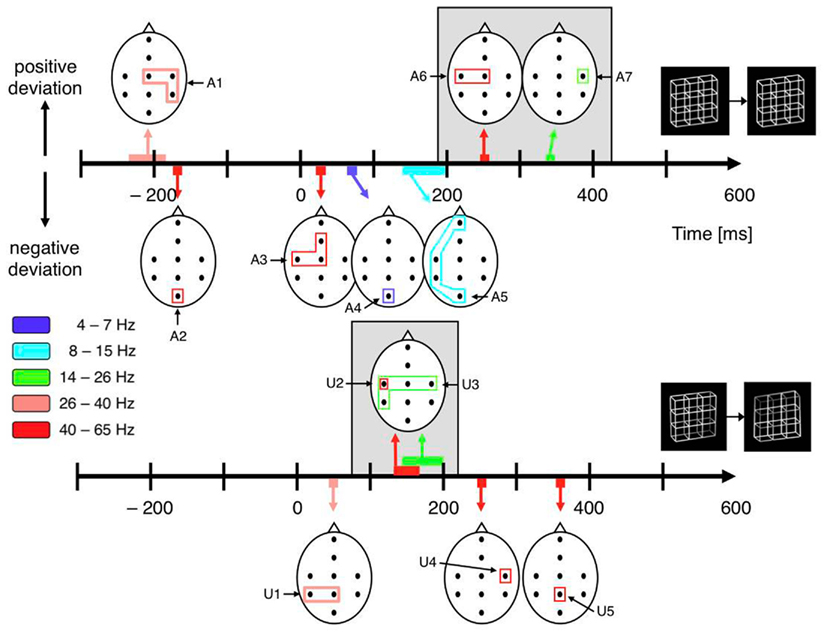
Figure 10. Schematic display of significant components from the time–frequency analyses. The black dots within the schematic heads mark electrode positions. The closed polygons surrounding electrode positions mark significant test results, their color indicates the corresponding frequency range. Head positions on the time axes indicate peak time. Positive and (negative) excursions appear above (below) the time axes. Top: Necker stimulus; bottom: unambiguous stimulus. Gray backgrounds highlight analogies between ambiguous and unambiguous stimuli. Their temporal difference is consistent with dERP results. Pre-onset gamma modulations (A1 and A2) are restricted to the Necker stimuli.
Several studies using the Manual Response Paradigm reported enhanced frontal gamma activity within 1000 ms before the manual response (e.g., Basar-Eroglu et al., 1996; Strüber et al., 2000). The gamma enhancement found with the Onset-Paradigm lies within the above 1000-ms time interval and may reflect the same neural processes. The spatial differences between gamma enhancements and the missing beta effect with the Manual Response Paradigm may be explained by different control conditions.
Interpretation of the beta and gamma modulations. The gamma-band modulation at 250 ms is the earliest signature at higher frequencies in the case of endogenous reversals with a corresponding component from exogenously induced reversals. Interestingly, its start matches well the latency of the RN, the earliest dERP component common to both types of reversal. According to Kornmeier and Bach (2006) these findings indicate that at least 250 ms after stimulus onset, the “decision” about the perceptual outcome has taken place. Thus all signatures at 250 ms and later must be of secondary order and subsequent to the reversal process, and the underlying processes must be very similar if not identical for the two types of stimuli. Their detailed functional roles have to be discovered in future experiments.
Is it Valid to Analyze Components from Difference Traces?
Amplitude modulations in an ERP difference trace can result from a modulation in strength of components before subtraction or they are simple artifacts from differential latency shifts of the underlying components in the two conditions. A combination of both is also possible. Figures 5A and 6 show roughly equal latencies of our raw ERP traces (before subtraction) across reversal and stability conditions for each of the two stimulus types. Analyzing the dERPs thus seems to be valid.
Any EEG deflection, however, is a spatial summation of an unknown number of differing generators. A component of a difference trace can thus result from a complex and differential interplay of different underlying generators in the two conditions. Britz and Pitts (2011) thus additionally compared current density maps and source images of raw ERPs and of dERPs. Further they identified clusters of brain microstates (Lehmann and Skrandies, 1980; Michel et al., 2004) with temporally stable global field power (spatial SD of the potential field) and compared them between the reversal, stability and difference traces. In summary they found converging evidence that all the reversal-related signatures reported above result from strength-based modulations of stimulus-related neural generators. This qualifies the stability condition as a valid control and further validates the analysis of the signatures from the difference traces.
Are Perceptual Reversals during Discontinuous Stimulus Presentation a Good Model for the Continuous Case?
The gain in temporal resolution of the endogenous reversal process, allowing a high temporal resolution of ERP components, comes at the cost of the periodical interruption of the stimulus presentation. Noest et al. (2007) recently discussed extensively whether the basic mechanisms of reversals induced by these interruptions resemble or differ from the reversal mechanism during continuous observation. They distinguished between “percept switch” events during continuous presentation and “percept choice” events during discontinuous presentation of an ambiguous figure and present a model for the latter. A percept choice was considered as a kind of perceptual decision about the representation of an ambiguous stimulus appearing (and then disappearing) on a blank screen. The underlying mechanisms were assumed to differ from those of percept switch mechanisms, i.e., reversals during continuous observation of an ambiguous figure.
According to Noest et al. (2007), all findings with the Onset Paradigm belong to the latter reversal type. It is not entirely clear, however, how and when exactly (at which ISI) the transition between percept choice and percept switch takes place. Based on the following theoretical and empirical arguments, including the data presented above, we argue that reversals during interrupted stimulation with short ISIs (e.g., <400 ms) may still belong to the percept switch events and that the above-presented results from the Onset Paradigm may also apply to the continuous case.
1. The empirical data show a non-monotonic modulation of reversal rates mainly as a function of ISIs with a maximum around an ISI of 300 ms (Orbach et al., 1963, 1966; Kornmeier et al., 2002), an asymptotic decrease toward zero reversals for longer ISIs (e.g., Orbach et al., 1963; Orbach et al., 1966; Kornmeier et al., 2002; Leopold et al., 2002; Maier et al., 2003), and a smooth monotonic decrease of reversal rates toward the continuous case for shorter ISIs (Orbach et al., 1963, 1966; Kornmeier et al., 2002, 2007; see also Figure 3). This non-monotonic behavior of reversal rates provides evidence for the existence of two different processes and suggests an estimate of roughly 400 ms for the transition point. For shorter ISIs the underlying processes may be similar to the continuous case to which the observed reversal rates converge (switch events). For ISIs above 400 ms, perceptual reversals may be simply separate percepts (choice events). The recently proposed Necker-Zeno model of bistable perception (Atmanspacher et al., 2004, 2008) lends additional, theoretical support to this view. It successfully models the non-monotonic behavior of reversal rates with discontinuous stimulus presentations and predicts a simple relation between three basic time scales in cognitive neuroscience. ISIs of 300 ms and longer can be identified with one of these time scales, while for ISIs smaller than 300 ms this is not the case. A most recent summary of the results obtained with the Necker-Zeno Model can be found in Atmanspacher and Filk (2010).
2. The RP, as a dERP component specifically related to endogenous reversals, has been reported so far in several studies with discontinuous presentation of ambiguous figures using small ISIs: from 14 to 390 ms in Kornmeier et al. (2007), and even 600 ms in Britz et al. (2009)2. It is invariant in amplitude and latency within an ISI-range at least up to 400 ms (Kornmeier et al., 2007). Interestingly, O’Donnell et al. (1988), presenting their Necker cubes discontinuously with ISIs as long as 3300 ms, did not find a RP. We would agree with Noest et al. (2007) that, given such long ISIs, they observed perceptual choices rather than perceptual switches.
3. A typical eye-blink roughly lasts 200 ms, occurs every 4 s on average (e.g., Caffier et al., 2003) and interrupts continuous stimulus presentation. Thus even the continuous case (perceptual switch event) is full of short perceptual interruptions.
In summary, it seems appropriate to systematically distinguish between percept choice and percept switch events. However, both empirical and theoretical arguments indicate that the mechanisms underlying perceptual reversals during discontinuous stimulus presentations with short ISIs are very similar – if not identical – as during continuous observation. We thus expect that the RP as the earliest ERP correlate of perceptual reversals during discontinuous presentation of ambiguous figures would also be identified in the continuous case if the necessary temporal resolution were available. The exact transition point between percept switch and percept choice events may depend on the type of ambiguous stimulus used.
Summary and Predictions
The Onset Paradigm successfully synchronizes endogenous perceptual reversals of ambiguous figures with stimulus onset with a precision of about ±30 ms. It provides a series of EEG signatures related to endogenous reversals which is very similar to a series of EEG signatures related to exogenously induced reversals of unambiguous stimulus variants with three exceptions:
(1) An occipital RP 130 ms after stimulus onset and (2) a left-hemispheric occipital to frontopolar decrease in alpha-band activity, starting at the same time and lasting for about 60 ms, are restricted to endogenous reversals of ambiguous figures. (3) All subsequent signatures are delayed with endogenous compared to exogenously induced reversals.
The smallest delay lasts roughly 40 ms and is visible in the earliest component occurring with both types of reversals, the occipital/parietal RN, starting at 260 ms with endogenous reversals and at 220 ms with exogenously induced reversals.
We speculate as follows: The RP is a marker of a decision conflict arising with ambiguity at a certain stimulus-specific perceptual processing step. The concurrent alpha-band decrease may reflect two loops of recurrent activity in order to resolve the ambiguity within at most 60 ms.
The similarity of the subsequent EEG components indicates that after a certain step perceptual processing of endogenous reversals and exogenously induced reversals are very similar if not identical. The earliest and shortest temporal delay between EEG components to endogenous and exogenously induced reversals is in the same time range as the duration of the alpha-band decrease and thus provides a good estimation of 40–60 ms endogenous disambiguation time (Kornmeier and Bach, 2006). Disambiguation is completed at the latest 250 ms after stimulus onset.
Table 1 provides an overview of all here discussed EEG signatures found with perceptual reversals of ambiguous and unambiguous figures, their latencies, their locations and the stimuli used to induce them. Interestingly, Lumer et al. (1998) reported frontal and parietal fMRI activation during perceptual reversals of binocular rivalry stimuli. Further, Sterzer and Kleinschmidt (2007) found overlapping parietal and frontal brain structures with higher fMRI BOLD activity during endogenous reversals of the SAM stimulus and exogenously induced reversals of a disambiguated SAM version compared to related control conditions. This is in line with several fMRI studies report about a parietal–frontal network being activated during spontaneous perceptual reversals of ambiguous figures and binocular rivalry stimuli (Sterzer et al., 2009 for a review). Due to the much coarser temporal resolution of BOLD responses it is difficult to discern between primary processes directly related to the reversal event and secondary processes after the perceptual decision has taken place. Keeping this in mind, it may well be possible that the parietal and frontal fMRI activity may be related to the RN and the Parietal and Frontopolar Positivities, discussed above. According to our reasoning at least the latter three signatures are of secondary nature. A recent review discussing correlates of conscious perception indicates that perception related neural activity after 200 ms reflects the “ignition” of a large-scale prefronto-parietal network, necessary for conscious perception and that the P3b ERP component is a relevant part of the related neural activity (Dehaene and Changeux, 2011). The Parietal and Frontopolar Positivies are broad and temporally overlapping ERP occurring in the same time range as reported for the P3b. They are thus good candidates to reflect the recurrent activity of this network.
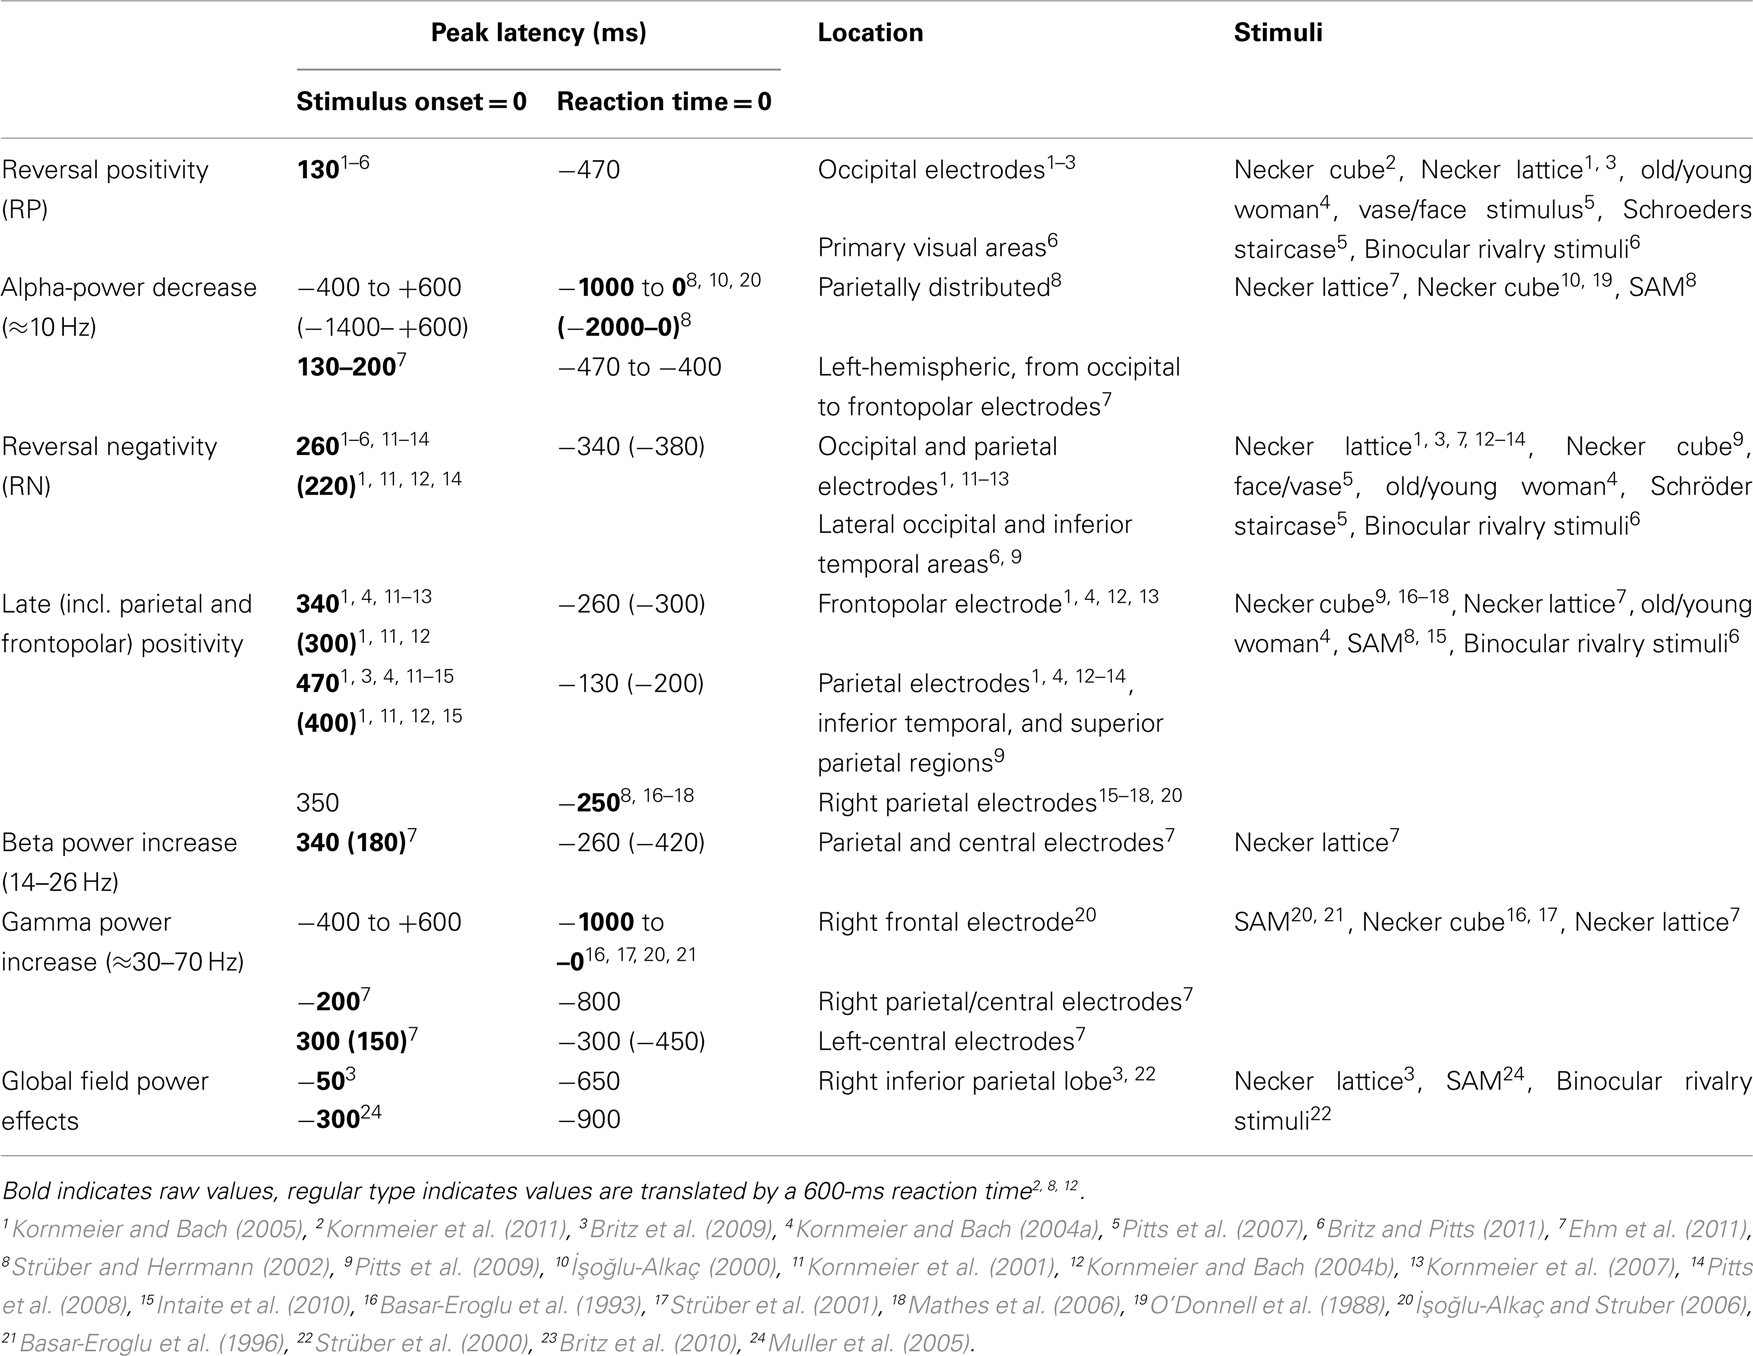
Table 1. EEG correlates of endogenous and exogenously induced (parentheses) perceptual reversals and their temporal occurrences with reference to stimulus onset (onset paradigm) or to reaction times (manual response paradigm).
Focusing the Bottom-Up vs. Top-Down Controversy with EEG
The present results suggests as optimal starting point to probe the influence of bottom-up and top-down factors on the EEG in a critical time window (temporal ROI) between stimulus onset and the RN at 250 ms.
EEG Correlates of Top-Down Influence
One of the strongest top-down factor influencing the reversal dynamics of ambiguous figures is volitional control: Although perceptual reversals cannot be totally prevented, the rate of perceptual reversals can be doubled with the instruction to alternate the percept as fast as possible, and it can be halved by the instruction to prevent reversals (e.g., Liebert and Burk, 1985; van Ee et al., 2005; Kornmeier et al., 2009). To our knowledge only three EEG studies on volitional control about ambiguous figures perception have been conducted so far, two of them already published: Mathes et al. (2006) used the Manual Response Paradigm with the Necker cube and found increase in both a slow positive component (labeled as increase in delta band activity and probably identical to our Parietal Positivity) and in gamma-band power when participants tried to volitionally prevent reversals compared to trials when they tried to volitionally induce them. While the slow positivity is clearly outside our ROI before 250 ms, it is not possible to decide this for the gamma modulation, occurring in a time window 500 ms before the late positivity peaks.
Pitts et al. (2008) used the Onset Paradigm with the Necker lattice and found an increased RN with a perceptual reversal when participants were instructed to reverse as often as possible compared to a passive viewing condition without volitional effort. No effects were found in the ROI before 250 ms.
In an EEG study from our lab with a slightly different variant of the Onset Paradigm (so far only published as diploma thesis, Hein, 2006) we found central and left temporal ERP components 370 ms after stimulus onset, which differed between an instruction to reverse condition and a passive condition as well as between the instruction to reverse condition and an instruction to prevent reversals condition. Again no effects were found in the ROI before 250 ms.
In summary, participants could successfully modulate their reversal rates if instructed to do so, but no EEG effects related to volitional control were found in the critical time window between stimulus onset and the RN at 250 ms.
EEG Correlates of Bottom-Up Influence
Presentation mode is regarded as a bottom-up factor (Long and Toppino, 2004) strongly modulating the reversal dynamics of both, ambiguous figures and binocular rivalry stimuli (e.g., Orbach et al., 1963; Kornmeier et al., 2002; Leopold et al., 2002; Maier et al., 2003; Kanai et al., 2005, Noest et al., 2007; see Figure 3). The reversal rates of different ambiguous figures and also binocular rivalry stimuli can more than double or even brought to stand still as a function of ISI with discontinuous stimulus presentation (Orbach et al., 1963; Kornmeier et al., 2002; Leopold et al., 2002; Maier et al., 2003; Klink et al., 2008). In an EEG study with the Necker lattice we looked for modulations in the first 250 ms after onset as a function of ISI. All EEG modulations we found, however, occurred at and after 250 ms, no modulation within the critical ISI could be observed (Kornmeier et al., 2007).
Summary
Neither the top-down factors nor the bottom-up factors tested so far, significantly modulated EEG data within the critical time window between stimulus onset and the occurrence of the RN at 250 ms. This raises some doubts about the expected importance of this time period for the perceptual reversal process and about our above interpretations of the EEG literature on multistable perception. However, maybe our interpretations are correct but our predictions concerning expected bottom-up and top-down modulations were wrong.
Proposal of an Integrative Theory
In the following, we present a new perspective that can nicely integrate our and previous bottom-up and top-down results. It assumes two separate processes underlying spontaneous perceptual reversals, destabilization and restabilization/disambiguation, working on different time scales (seconds and milliseconds).
The following thoughts are based on accumulating evidence from psychophysical, EEG, and fMRI studies. All the so far used methods have advantages and limitations and none of the techniques allow a complete view on the processes at work during spontaneous perceptual alternations. It may thus well be possible that highly relevant neural activity is restricted to a small number of neurons and neither detectable with EEG nor with fMRI methods. The absence of detectable signatures in a specific paradigm can thus mean that no activity is present or that such activity is not measurable with the methods at hand. Having this in mind, we regard the following as a working hypothesis, allowing us to develop predictions that may be tested in future experiments.
The terminology from non-linear dynamics provides a helpful framework to describe the mechanisms underlying spontaneous perceptual reversals of ambiguous figures (Haken, 1983; Atmanspacher, 1992; Kruse et al., 1996; Kornmeier et al., 2004; Braun and Mattia, 2010). Brain states are regarded as points in a hypothetical state space. Representations of objects, e.g., a 3D cube, are modeled as attractors and their depth as a measure of the current representation’s stability. Physiologically, the form of the attractor may depend on the connectivity matrix of neurons within a relevant assembly but also on the quality of the visual input. If the state of the perceptual system is located within an attractor, the related neural assembly is “activated” and the percept is (consciously) perceived (e.g., Kornmeier et al., 2004). Let us look at two extreme cases: If the visual stimulus is completely unambiguous we have a single unique and deep attractor and thus a stable conscious experience of the represented object. In the case of an ambiguous figure, two (or even more) representations fit with the visual information and thus two (or more) perhaps shallower attractors are in close vicinity with a relatively low barrier in between. For the ambiguous Necker cube, the two 3D interpretations would correspond to the two attractors (Figure 12). A perceptual reversal occurs if the system escapes from one attractor and jumps into the alternative one. The main question addressed by the research of the last 200 years on ambiguous figures could be translated to “what is the mechanism underlying the spontaneous state change from one attractor to the other?”
We here regard it as conceptually fruitful to subdivide the reversal event into two steps:
Destabilization
The observation of an ambiguous figure typically leads to a transiently stable percept, which destabilizes over time. This destabilization is relatively slow and takes on average 5–6 s if a Necker cube is passively observed (Orbach et al., 1963; Kornmeier et al., 2009). However, destabilization times (also known as stability durations or dwell times) are highly variable within and across participants (e.g., Borsellino et al., 1972) and also differ between different types of ambiguous figures (e.g., Strüber and Stadler, 1999); most of the bottom-up and top-down literature on ambiguous figures describes the variables that alter destabilization time. Often, passive adaptation of low-level neurons is discussed as the mechanism underlying a slow destabilization (e.g., Orbach et al., 1963; Toppino and Long, 1987). This can be modeled as a slow depth reduction of the attractor in which the state is located. Spontaneous fluctuations (e.g., synaptic fluctuations, variations in neurotransmitter concentrations, etc.) or exogenously induced neural fluctuations (e.g., by blinks and/or eye movements, visual transients, like short interruptions (Orbach et al., 1963) of stimulus presentation or light flashes (Kanai et al., 2005)) may also be relevant factors for a perceptual reversal and even more, the flatter the current attractor is. At least a part of the data from the Orbach group may thus be explained by an interaction between transients (fluctuations) and adaptation (influencing attractor depth). Moreno-Bote et al. (2007) recently provided a neurally plausible attractor model that assumes weak adaptation and noise underlying perceptual alternations. This model explains nicely several empirical findings like gamma distributed dwell times and more.
Effects of volitional control on reversal rates fit within the attractor model in the following way: The instruction to volitionally control the percept, typically given at the begin of an experimental block, may cause an a priori “top-down” change of depth of specific attractors in the sense of a global change of baseline activity or of a certain threshold, and thus prolong or shorten the destabilization time and increase or decrease the influence of fluctuations on the transition probability.
In summary a neural representation can be modeled as a brain state, located in an attractor within a state space. The depth of the attractor depends on the quality of the visual input (amongst others). The more ambiguous the input is, the shallower is the attractor, the more sensitive the representation is to spontaneous fluctuations and the more probable is a reversal between representations (attractors). It is reasonable to assume that in the case of ambiguous visual information the attractor, which is currently occupied, is initially shallow and slowly flattens over time. Different bottom-up (e.g., mode of stimulus presentation, Kanai et al., 2005) as well as top-down factors (like volitional control, Kornmeier et al., 2009) may be able to alter attractor depth and/or increase the noise level (Moreno-Bote et al., 2007) and thus influence the reversal dynamics, even simultaneously in an additive manner (Kornmeier et al., 2009). Bottom-up and top-down explanations are thus no longer mutually exclusive with this conception.
Restabilization/Disambiguation
Each reversal from one stable percept to another passes through a point of maximal instability when the perceptual state is on top of the barrier between the two related attractors (Figure 12).
The sensory information we receive is inherently incomplete and ambiguous. We have to disambiguate and interpret it in order to perceive it. Our perceptual system is optimized to disambiguate and interpret the visual information as fast as possible (e.g., we immediately perceive faces or objects in the formation of clouds in the sky or in the formation of country rocks). This indicates that due to evolutionary reasons our perceptual system tries to keep the inevitably instable brain states in between attractors as short as possible and thus to achieve a fast perceptual interpretation of whatever sensory information is available in order to be able to react immediately.
These considerations apply to ambiguous-figure perceptions in the following way: Leaving of an attractor (destabilization) and arriving at another attractor (disambiguation/restabilization) are different processes, working on different time scales (minutes and seconds vs. milliseconds): Given a brain state of maximal instability either at the onset of an ambiguous figure or as a result of the above described slow destabilization process during prolonged observation, our perceptual system tries to find as fast as possible a more stable state. The early RP dERP component and the Beta band deactivation may be related to the fast disambiguation of ambiguous visual input, taking place immediately after stimulus onset (within the Onset Paradigm) and being time-locked to it (±30 ms). Destabilization, on the other hand, may start immediately after the new percept has been established and is much slower. It can take from seconds to minutes and its dynamic can be changed in different ways and perhaps at different time points. Any EEG correlate of destabilization should thus occur before the onset of the stimulus that is perceived as reversed and it should indicate an upcoming reversal.
An EEG correlate of perceptual destabilization
Indeed, we recently found an increase in lower gamma-band activity (26–40 Hz) at the right-hemispheric central and parietal electrodes roughly 200 ms before onset of a Necker lattice that is perceived as reversed compared to a lattice that is perceived as stable (Figures 9 and 10, component U1) together with an occipital decrease of higher gamma-band activity (40–65 Hz; Figures 9 and 10, component U2). No such gamma modulations were observed with exogenously induced reversals of unambiguous lattice variants (Ehm et al., 2008, 2011). Britz et al. (2009) also used the Necker lattice with the Onset Paradigm. They compared dominant potential maps with temporally stable global field power (spatial SD of the potential field) and current source distributions for reversal and stability trials in a 50-ms pre-stimulus interval and also found significant differences in the right inferior parietal lobe. No unambiguous stimulus variants were used in their experiment.
A series of related studies underscore the importance of the above findings: Basar-Eroglu et al. (1996) reported a right anterior gamma power increase within 1000 ms before participants indicated an endogenous perceptual motion reversal of the SAM stimulus. We assume that their gamma modulation contains both, the pre-stimulus and post-stimulus gamma modulations indicated in our data (Ehm et al., 2011). Roeber et al. (2008) recently reported a right-hemispheric ERP correlate of perceptual reversals of binocular rivalrous sine wave gratings. Nakatani and van Leeuwen (2006) found EEG gamma-band synchronization between right-hemispheric parietal and right-hemispheric frontal electrode positions 800–600 ms before the manual indication of a Necker cube reversal. VanRullen et al. (2006) found higher gamma activity at right-hemispheric central locations with illusory motion direction reversals of the Wagon-Wheel Illusion compared to real motion reversals. Lumer et al. (1998) reported selective right-hemispheric BOLD (fMRI) activation during perceptual transitions of binocular rivalry stimuli, but no such activity with exogenous transitions of unambiguous stimulus variants. Sterzer and Kleinschmidt (2007) found increased fMRI response in the right inferior frontal cortex with endogenous motion reversals of the SAM stimulus compared to exogenously induced reversals of unambiguous SAM variants. Similarly, Ilg et al. (2008) found posterior right-hemispheric fMRI activity with spontaneous motion direction reversals of the spinning wheel illusion (Wertheimer, 1912), but no such activity with exogenously induced reversals. Müller et al. (2005) used the onset of the SAM stimulus immediately before a button press as the time reference for reversals of motion direction. They found changes in EEG activity about 300 ms before the reversal-related SAM flashes, i.e., temporally close to our pre-onset gamma modulation. Meenan and Miller (1994) reported about difficulties of patients with lesions in right frontal areas to recognize more than one interpretation of several ambiguous figures.
Further evidence for an important role of right-hemispheric areas comes from recent studies with transcranial magnetic stimulation (TMS). It was shown, that TMS stimulation of the parietal lobe can modulate dwell times of ambiguous structure-from-motion stimuli (Kanai et al., 2010, with bilateral stimulation) and binocular rivalrous moving gratings (Carmel et al., 2010; Kanai et al., 2011, with right-hemispheric stimulation). Stimulation of the posterior parts of the parietal lobe increased dwell times whereas stimulation of anterior parts decreased dwell times (Kanai et al., 2011). Zaretskaya et al. (2010) found during perceptual reversals of a rivalrous face/house stimulus a stronger BOLD response in the right intraparietal sulcus in nine participants and stronger BOLD response in the left intraparietal sulcus in 6 participants. TMS stimulation of the right intraparietal sulcus increased dwell times.
In summary, there is converging evidence that right-hemispheric brain areas play an important role during spontaneous perceptual reversals across stimulus types and categories (ambiguous figures and binocular rivalry stimuli) and experimental paradigms. More precisely, some studies, providing precise temporal information, indicate that this activity precedes perceptual reversals and may thus have predictive character, although this has to be demonstrated on a single trial level. Further, the reversal dynamics can be altered by right-hemispheric TMS stimulation. The spatial variability of the right-hemispheric signature across studies is so far unexplained.
So far we can only speculate about the function of this right-hemispheric pre-onset activity. A common feature across all stimulus types, stimulus categories, and paradigms is that perception changes spontaneously while the visual information stays unchanged. As a working hypothesis we suggest that the pre-onset gamma modulation indicates a transient brain state of maximal instability at the transition from one stable brain state to another or its recognition by some unconscious and so far unknown neural instance. Such an instable brain state in between two adjacent attractors is a necessary pre-condition for a perceptual reversal to occur and thus for a decision conflict preceding a reversal. Moments of instable brain states should thus be inherent in all types of perceptual reversal and related right-hemispheric modulations – perhaps in the EEG gamma band – should be observable. A sufficiently precise time reference for a reversal in the continuous case is necessary to test this
During continuous viewing of an ambiguous figure, state instability (or its recognition) and the subsequent decision conflict during (re)interpretation of the ambiguous visual information may be in close temporal vicinity. The short interruptions in the Onset Paradigm may act as a “temporal magnifier,” slowing down the reversal process and thus temporally separating the two steps. According to these considerations a second working hypothesis, may thus be that the right-hemispheric central gamma modulation, which is pre-onset with the Onset Paradigm, may occur immediately before the occipital RP during a perceptual reversal of a continuously observed Necker cube. Again, a sufficiently precise time reference for a reversal in the continuous case is necessary to test this.
Two (of Several) Major Open Questions in the Context of Multistable Perception
What Do Neural Representations Look Like – and Why are They Sometimes Unstable?
This is essentially the question about perceptual states and their destabilization over time with ambiguous visual input. One of the basic assumptions in the multistable perception literature is that each conscious interpretation of an ambiguous figure is based on the activity of a distinct neural assembly (e.g., Blake and Logothetis, 2002, for a review). Thus one central goal of the physiological studies of multistable perception was to find brain areas where neural activity fluctuates in correlation with the perceptual experience, in contrast to areas with unchanged neural activity, reflecting the unchanged visual input. Especially the border between sensory and percept-related activity was assumed to play a key role for the perceptual reversal process and consciousness in general (e.g., Blake and Logothetis, 2002).
Logothetis et al. (e.g., Logothetis, 1998; Leopold and Logothetis, 1999) recorded from primate single cells in different brain areas, while the animals reported their percepts of binocular rivalry stimuli. They found that the number of neurons with a percept-related firing pattern increased from V1 (striate cortex, 20%) over V2, V4, MT, medial superior temporal sulcus (MST, 80), the inferotemporal cortex (IT, 80%), and the superior temporal sulcus (STS, 80%; Logothetis, 1998; Leopold and Logothetis, 1999). A large number of V1 neurons remained active whether the stimulus was perceived or suppressed. Percept-related firing patterns were neither found in monocular V1 neurons (e.g., Leopold and Logothetis, 1999) nor in LGN neurons (Lehky and Maunsell, 1996). Several results from fMRI studies are in line with these single cell findings, indicating the importance of higher cortical areas for object representation. Tong et al. (1998) presented binocular rivalry stimuli containing the picture of a house and of a face and found reciprocal modulations in BOLD activity in the parahippocampal place area and the fusiform face area highly correlating with participants’ reports of seeing a face or a house. Interestingly, this level of modulation was comparable to that with binocular house and face perceptions (non-rivalrous conditions). Similarly, Andrews et al. (2002) presented Rubin’s ambiguous Face/Vase stimulus and found slightly increased BOLD activity in the fusiform face area during the perception of the faces compared to trials with house percepts. Recently Watanabe et al. (2011) found in V1 strong fMRI BOLD effects of attention but none of dominance vs. suppression intervals of binocular rivalry stimuli.
Other studies point to the importance of lower-level areas for object representations: Dodd et al. (2001) reported correlation between single cell activity in primate area MT and the perceived motion direction of an ambiguous structure-from-motion stimulus. Further, fMRI studies provided evidence for percept-related activity in V1 (e.g., Tong and Engel, 2001) and in the LGN (Haynes et al., 2005) during humans’ observation of binocular rivalry stimuli.
Today there are potential explanations for the inconsistency between single cell and fMRI findings: fMRI BOLD activity is (like EEG activity) more related to local field potentials than to neural spiking activity (Logothetis et al., 2001). Thus percept-related modulation in early visual areas, as shown with fMRI, should be reflected in local field potentials rather than in spike modulation. This has been demonstrated recently in primates (Wilke et al., 2006; Maier et al., 2008). Further, information may be coded by temporal synchronization of neural activity (i.e., temporal coding), rather than amplitude modulations. Fries et al. (1997) presented binocular rivalry stimuli to cats and found precept-related synchronization of neural gamma-band oscillations in V1. Like surface EEG, the MEG is believed to reflect synchronous spiking activity of a large number of cortical neurons. MEG studies on binocular rivalry showed correlations between activity over a wide range of sensors (from occipital to frontal lobes) and observers dominance and suppression reports, indicating the involvement of the entire cortex in conscious object representation (e.g., Tononi et al., 1998; Dehaene and Changeux, 2011).
In summary, there is no isolated cortical area selectively correlating with the participant’s current percept. The locus of the attractor and its specific neural realization is so far not understood (e.g., Moreno-Bote et al., 2007). Rather, object representations seem to result from a complex, probably reciprocal interplay between early visual and several higher brain areas across the cortex. Further, most of the physiological correlates are transient in nature and so far it is unclear how the maintenance of a stable conscious percept is neuronally realized (Ehm et al., 2011). This however, has to be understood in order to understand the destabilization of a given representation in the case of ambiguous figures and its susceptibility to bottom-up and top-down factors. There is some experimental and theoretical evidence that neural activity is somewhat weaker with ambiguous or rivalrous stimuli compared to disambiguated variants (e.g., Leopold and Logothetis, 1999; Kornmeier and Bach, 2006; Moreno-Bote et al., 2007; Pitts et al., 2010). This may indicate that the activated attractors are in general flatter and thus more susceptible to any type of fluctuation the more ambiguous the visual information is. In a recent study we analyzed this systematically with ambiguous figures from different categories: Slight low-level figural changes of an ambiguous figure disambiguate it and produce more sustained stable percepts. We found dramatic ERP differences between ambiguous figures and their disambiguated variants, independent of the reversal dynamics and across different types of figures (Necker cube, Old/Young Woman and SAM stimulus, as latest – unpublished-results from our lap indicate). This difference might (directly or indirectly) reflect the difference in depth of the respective attractors (Kornmeier and Bach, 2009).
Who Decides on the Perceptual Result if the Visual Input is Ambiguous?
This is essentially the question about perceptual transitions. A large number of psychophysical studies about ambiguous figures aimed to find or understand “the one mechanism” that underlies spontaneous perceptual reversals – they looked for the deciding instance or mechanism. The major difference between bottom-up and top-down explanations thus pertains to the question whether this process is located at lower visual or at high-level cognitive processing units (e.g., Long and Toppino, 2004).
We suggest the reversal process can be subdivided into two separate steps, which need to be understood:
(1) How the current brain state gets out of its attractor and on top of the barrier in between this one and the alternative attractor. (2) How the “decision” takes place about whether the instable brain state returns to the old or the alternative attractor or perhaps whether it approaches another, so far less probable attractor.
Both steps depend on several factors like the energy distribution of the state space at this specific moment and thus the depth of the currently activated and the alternate attractors and the amount of energy fluctuations within the system (endogenous and/or exogenously introduced neural noise or background activity). Recent empirical evidence indicates that these factors depend at least in part on the perceptual history (on different time scales; e.g., Hesselmann et al., 2008; Pastukhov and Braun, 2008). Influence may be exerted at different steps and levels of complexity during visual perception (Blake and Logothetis, 2002; Kornmeier and Bach, 2006; Sterzer and Rees, 2008; Bartels and Logothetis, 2010), which is in line with the distributed object representation account discussed above. Nakatani and van Leeuwen (2006), e.g., provided evidence for different types of reversal of a Necker cube within and between participants, reflected by different patterns of synchrony in EEG oscillations. Blake and Logothetis (2002) summarized related evidence from the binocular rivalry literature and Bartels and Logothetis (2010) found recently with binocular rivalry stimuli, that perceptual reversals can be triggered at different levels of complexity during the perceptual process.
In summary, there is probably no unique neural switch area or “unique gate to conscious perception” within the brain that governs perceptual reversals. However, the EEG findings discussed above indeed indicate some generality aspects across types of reversals, types of stimuli (e.g., Necker cube or old/young woman) and even across categories (ambiguous figures and binocular rivalry stimuli). First, each endogenous perceptual reversal comes with a transient state of instability at the barrier between the two alternative attractors (Figure 11). The generality of the pre-reversal right-hemispheric activity (e.g., Britz et al., 2009; Britz et al., 2010; Ehm et al., 2011) may classify this modulation as a good candidate reflecting this instable brain state or its detection. What this would mean in terms of neural processing, however, is so far unclear. More research has to be done in order to determine more attributes of this right-hemispheric activity modulation in detail.
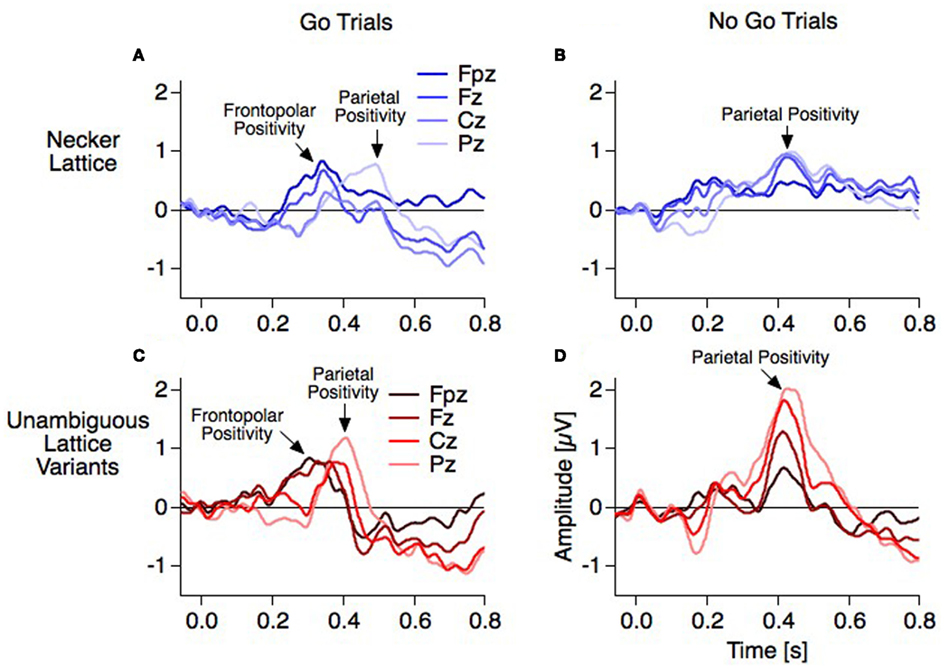
Figure 11. Parietal and frontopolar positivities (dERPs) along the midline electrodes. (A,C) Temporally and spatially separated Parietal and Frontopolar Positivities occur in the go trials. (B,D) The Frontopolar Positivity, however, is absent in the no–go trials. Instead, the amplitude of the Parietal Positivity decreases from parietal to frontopolar positions, while its latency stays unchanged (Data from Kornmeier and Bach, 2004b).
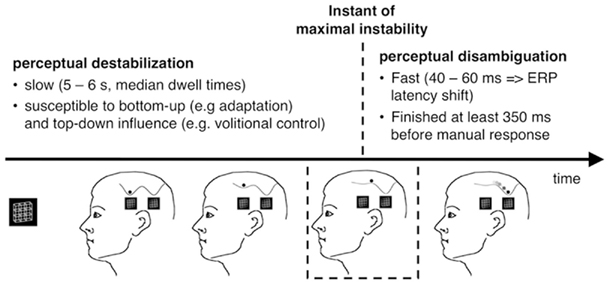
Figure 12. Destabilization and disambiguation of ambiguous visual information. With prolonged observation of the ambiguous lattice stimulus a transiently stable percept gets destabilized slowly, symbolized as a depth reduction of the brain states current attractor. Both bottom-up and top-down factors can accelerate and decelerate this process. After transition of a state of maximal instability, fast (40–60 ms) disambiguation takes place, leading to a different stable percept. The brain state is now located in the alternative, deeper attractor.
Second, a general finding across stimulus types (Necker cube, Old/Young woman) and categories (ambiguous figures and binocular rivalry stimuli) is the early occipital RP. It may be possible that after some central instance (perhaps general across types of reversals) has notified an instable perceptual brain state (reflected in the right-hemispheric activity modulation, described above), the “decision” about the perceptual outcome needs one (or two) top-down reactivation(s) of early visual areas for reinterpretation of the available visual information. It may also be possible that the surface EEG can only detect the strong activity of the “low-level receiver” (i.e., the RP) but not the potentially weaker activity of the “higher-level sender,” wherever in the brain it may be located. This is highly speculative and further experiments are necessary, e.g., to describe the attributes of the RP in more detail. A step in this direction has been done recently by demonstrating the RP’s independence of stimulus size (Kornmeier et al., 2011) and stimulus complexity (cubes or lattices Kornmeier and Bach, 2003).
Summary and Conclusion
Applying the Onset Paradigm to investigate spontaneous perceptual reversals of both ambiguous figures and binocular rivalry stimuli sizably improved the temporal resolution of the underlying processes. Since its first application several independent lines of evidence encouraged us to propose that spontaneous perceptual reversals are governed by two independent processes working on different time scales: (1) The transiently stable perceptual interpretation of the ambiguous information destabilizes over time until the perceptual system reaches a state of maximal instability. This destabilization is slow in the order of seconds to minutes and subject to multiple endogenous and exogenous influences. The result of this destabilization, a perceptual brain state of maximal instability seems to be correlated with a right-hemispheric modulation in EEG activity which occurs pre-onset in the case of discontinuous stimulus presentation. (2) Due to evolutionary pressure our brain is optimized to keep unavoidably instable brain states as brief as possible. Electrophysiological evidence indicates that the transition from maximal instability to a (potentially altered) stable brain state is very fast, in the order of 40–60 ms, and not susceptible to endogenous or exogenous manipulations. EEG data further indicates that perceptual processes within 350 ms before the manual indication of a perceptual reversal are post-decision and thus of secondary nature with respect to the reversal process. The (unconscious) decision about the perceptual outcome thus seems to be rather early.
Numerous psychophysical and physiological evidence indicates that neural representations are not restricted to circumscribed brain regions but involve almost the entire cortex. A clear border between sensory and perceptual processing is thus difficult to find and may depend on experimental and stimulus details.
The available evidence further suggests that, in contrary to previous expectations, no circumscribed neural unit exists that decides about the perceptual outcome. Rather, perceptual reversals can be induced at different locations and levels of complexity along the processing of visual information.
Recent evidence from our lab suggests the existence of a central evaluation instance that estimates the reliability of the perceptual outcome, given a certain quality of visual information. The outcome of this evaluation thus may indirectly reflect the depth of the activated attractor (e.g., Kornmeier and Bach, 2009; Hassberg, 2010). Understanding the mechanisms of such reliability estimation may be highly relevant for a better understanding of psychiatric perception disorders and ambiguous figure may be an interesting tool for this.
Ambiguous figure perception is an ideal model to investigate changes of brain states between already existing attractors in other domains. Already the Gestalt Psychologists regarded this phenomenon as interesting for the understanding of insight phenomena (Knoblich and Öllinger, 2006), where probably a transition from an existing attractor to an instantaneous newly built attractor takes place. Most interesting in this respect may be the transient states of maximal instability on top of the barrier between two attractors (“acategorial states,” Feil and Atmanspacher, 2010). Thus ambiguous figure perception may also be an interesting tool for future research in insight processes. The gain in temporal resolution attained with the Onset Paradigm provided specific electrophysiological marker of critical processing steps underlying spontaneous perceptual reversals of ambiguous figures. The speculations above about their functional role encourage precise experimental hypotheses that may be tested in future experiments.
Conflict of Interest Statement
The authors declare that the research was conducted in the absence of any commercial or financial relationships that could be construed as a potential conflict of interest.
Footnotes
- ^The multiple testing problem is inherent to the analysis of EEG data. Depending on the number of tests, corrections for alpha-error-inflation can strongly reduce test-sensitivity, especially in cases of small signals like with the Reversal Positivity.
- ^Psychophysical data collected with the Necker cube indicate a transition point between switch reversals and choice reversals at ISIs between 300 and 400 ms (Orbach et al., 1963). Kornmeier et al. (2007) presented a more complex Necker lattice, composed of nine simple cubes, and found a rising reversal rate together with a unchanged RP in a ISI-range between 10 and 400 ms. Britz et al. (2009), presenting a lattice composed of four Necker cubes, identified the RP even with an ISI of 600 ms, which indicates a discrepancy between a physiological and a psychophysical estimate of the transition point. Results from Kornmeier et al. (2002) however indicate that the transition point in the case of more complex Necker lattices are at larger ISIs compared to the simple Necker cubes.
References
Ammons, C. H., and Ammons, R. B. (1963). Perspective reversal as affected by physical characteristics of Necker cube drawings. Proc. Montana Acad. Soc. 23, 287–302.
Andrews, T. J., Schluppeck, D., Homfray, D., Matthews, P., and Blakemore, C. (2002). Activity in the fusiform gyrus predicts conscious perception of Rubin’s vase-face illusion. Neuroimage 17, 890–901.
Anllo-Vento, L., and Hillyard, S. A. (1996). Selective attention to the color and direction of moving stimuli: electrophysiological correlates of hierarchical feature selection. Percept. Psychophys. 58, 191–206.
Atmanspacher, H. (1992). Categoreal and acategoreal representation of knowledge. Cogn. Syst. 3, 259–288.
Atmanspacher, H., Bach, M., Filk, T., Kornmeier, J., and Römer, H. (2008). Cognitive time scales in a Necker-Zeno model for bistable perception. Open Cybern. Syst. J. 2, 234–251.
Atmanspacher, H., and Filk, T. (2010). A proposed test of temporal nonlocality in bistable perception. J. Math. Psychol. 54, 314–321.
Atmanspacher, H., Filk, T., and Römer, H. (2004). Quantum Zeno features of bistable perception. Biol. Cybern. 90, 33–40.
Bach, M. (1997). Some Visual Phenomena and Optical Illusions. Available at: http://www.michaelbach.de/ot/
Bartels, A., and Logothetis, N. K. (2010). Binocular rivalry: a time dependence of eye and stimulus contributions. J. Vis. 10, 3.
Basar-Eroglu, C., Struber, D., Kruse, P., Basar, E., and Stadler, M. (1996). Frontal gamma-band enhancement during multistable visual perception. Int. J. Psychophysiol. 24, 113–125.
Basar-Eroglu, C., Strüber, D., Stadler, M., and Kruse, E. (1993). Multistable visual perception induces a slow positive EEG wave. Int. J. Neurosci. 73, 139–151.
Blake, R. (2001). A primer on binocular rivalry, including current controversies. Brain Mind 2, 5–38.
Borsellino, A., De Marco, A., Allazetta, A., Rinesi, S., and Bartolini, B. (1972). Reversal time distribution in the perception of visual ambiguous stimuli. Kybernetik 10, 139–144.
Brascamp, J. W., van Ee, R., Pestman, W. R., and van den Berg, A. V. (2005). Distributions of alternation rates in various forms of bistable perception. J. Vis. 5, 287–298.
Braun, J., and Mattia, M. (2010). Attractors and noise: twin drivers of decisions and multistability. Neuroimage 52, 740–751.
Britz, J., Landis, T., and Michel, C. M. (2009). Right parietal brain activity precedes perceptual alternation of bistable stimuli. Cereb. Cortex 19, 55–65.
Britz, J., and Pitts, M. A. (2011). Perceptual reversals during binocular rivalry: ERP components and their concomitant source differences. Psychophysiology 48, 1490–1499.
Britz, J., Pitts, M. A., and Michel, C. M. (2010). Right parietal brain activity precedes perceptual alternation during binocular rivalry. Hum. Brain Mapp. 32, 1432–1442.
Caffier, P. P., Erdmann, U., and Ullsperger, P. (2003). Experimental evaluation of eye-blink parameters as a drowsiness measure. Eur. J. Appl. Physiol. 89, 319–325.
Carmel, D., Walsh, V., Lavie, N., and Rees, G. (2010). Right parietal TMS shortens dominance durations in binocular rivalry. Curr. Biol. 20, R799–R800.
Debecker, J., and Desmedt, J. E. (1970). Maximum capacity for sequential one-bit auditory decisions. J. Exp. Psychol. 83, 366–372.
Dehaene, S., and Changeux, J. P. (2011). Experimental and theoretical approaches to conscious processing. Neuron 70, 200–227.
Dodd, J. V., Krug, K., Cumming, B. G., and Parker, A. J. (2001). Perceptually bistable three-dimensional figures evoke high choice probabilities in cortical area MT. J. Neurosci. 21, 4809–4821.
Dubois, J., and Vanrullen, R. (2011). Visual trials: do the doors of perception open periodically? PLoS Biol. 9, e1001056. doi:10.1371/journal.pbio.1001056
Ehm, W., Bach, M., and Kornmeier, J. (2008). What role for gamma oscillations in the perception of ambiguous figures? Perception 37, 116.
Ehm, W., Bach, M., and Kornmeier, J. (2011). Ambiguous figures and binding: EEG frequency modulations during multistable perception. Psychophysiology 48, 547–558.
Elbert, T., Hommel, J., and Lutzenberger, W. (1985). The perception of Necker cube reversal interacts with the Bereitschaftspotential. Int. J. Psychophysiol. 3, 5–12.
Feil, D., and Atmanspacher, H. (2010). Acategorial states in a representational theory of mental processes. J. Conscious. Stud. 17, 72–101.
Foxe, J. J., and Simpson, G. V. (2002). Flow of activation from V1 to frontal cortex in humans. A framework for defining “early” visual processing. Exp. Brain Res. 142, 139–150.
Fries, P., Roelfsema, P. R., Engel, A. K., Konig, P., and Singer, W. (1997). Synchronization of oscillatory responses in visual cortex correlates with perception in interocular rivalry. Proc. Natl. Acad. Sci. U.S.A. 94, 12699–12704.
Gale, A. G., and Findlay, J. M. (1983). “Eye movement patterns in viewing ambiguous figures,” in Eye Movements and Psychological Functions: International Views, eds R. Groner, C. Menz, D. F. Fischer, and R. A. Monty (Hillsdale: Erlbaum), 145–168.
Girgus, J. J., Rock, I., and Egatz, R. (1977). The effect of knowledge of reversibility on the reversibility of ambiguous figures. Percept. Psychophys. 22, 550–556.
Gregory, R. (1974). “Choosing a paradigm for perception,” in Handbook of Perception: Vol. 1. Historical and Philosophical Roots of Perception, eds C. Carterette and M. Friedman (New York: Academic Press), 255–283.
Haken, H. (1983). Synergetics: An Introduction; Nonequilibrium Phase Transitions and Self-Organization in Physics, Chemistry, and Biology. Berlin: Springer.
Hassberg, T. (2010). Aufmerksamkeits- und Adaptationseffekte bei instabiler Wahrnehmung. Medical Dissertation, University of Freiburg, 79. Available at: http://www.freidok.uni-freiburg.de/volltexte/7875/
Haynes, J. D., Deichmann, R., and Rees, G. (2005). Eye-specific effects of binocular rivalry in the human lateral geniculate nucleus. Nature 438, 496–499.
Hein, C. (2006). Cognitive Influence on Perceptual Reversals – ERP Correlates to the Disambiguation of the Necker Cube. Diploma Thesis, 89.
Hesselmann, G., Kell, C. A., Eger, E., and Kleinschmidt, A. (2008). Spontaneous local variations in ongoing neural activity bias perceptual decisions. Proc. Natl. Acad. Sci. U.S.A. 105, 10984–10989.
Hochberg, J., and Peterson, M. (1987). Piecemeal organization and cognitive components in object perception. J. Exp. Psychol. Gen. 116, 370–380.
Howard, I. P., and Durham, U. (1961). An investigation of a satiation process in the reversible perspective of revolving skeletal shapes. Q. J. Exp. Psychol. 13, 19–33.
Ilg, R., Wohlschlager, A. M., Burazanis, S., Woller, A., Nunnemann, S., and Muhlau, M. (2008). Neural correlates of spontaneous percept switches in ambiguous stimuli: an event-related functional magnetic resonance imaging study. Eur. J. Neurosci. 28, 2325–2332.
Intaite, M., Koivisto, M., Ruksenas, O., and Revonsuo, A. (2010). Reversal negativity and bistable stimuli: attention, awareness, or something else? Brain Cogn. 74, 24–34.
İşoğlu-Alkaç, U., Basar-Eroglu, C., Ademoglu, A., Demiralp, T., Miener, M., and Stadler, M. (2000). Alpha activity decreases during the perception of Necker cube reversals: an application of wavelet transform. Biol. Cybern. 82, 313–320.
İşoğlu-Alkaç, Ü., and Strüber, D. (2006). Necker cube reversals during long-term EEG recordings: sub-bands of alpha activity. Int. J. Psychophysiol. 59, 179–189.
Kanai, R., Bahrami, B., and Rees, G. (2010). Human parietal cortex structure predicts individual differences in perceptual rivalry. Curr. Biol. 20, 1626–1630.
Kanai, R., Carmel, D., Bahrami, B., and Rees, G. (2011). Structural and functional fractionation of right superior parietal cortex in bistable perception. Curr. Biol. 21, R106–R107.
Kanai, R., Moradi, F., Shimojo, S., and Verstraten, F. A. (2005). Perceptual alternation induced by visual transients. Perception 34, 803–822.
Klink, P. C., van Ee, R., Nijs, M. M., Brouwer, G. J., Noest, A. J., and van Wezel, R. J. (2008). Early interactions between neuronal adaptation and voluntary control determine perceptual choices in bistable vision. J. Vis. 8, 11–18.
Knoblich, G., and Öllinger, M. (2006). “Einsicht und Umstrukturierung beim Problemlösen. Enzyklopädie der Psychologie,” in Enzyklopädie der Psychologie, Denken und Problemlösen, ed. J. Funke (Göttingen: Hogrefe), C/II/8, 782.
Kornmeier, J., and Bach, M. (2003). “Zwei Varianten des Necker-Würfels: Frühe, okzipitale lateral-isierte ERP-Korrelate des Wahrnehmungswechsels,” in Beiträge zur 6. Tübinger Wahrneh-mungskonferenz, 157.
Kornmeier, J., and Bach, M. (2004a). “More evidence for early visual processing in perceptual disambiguation of ambiguous figures,” in Proceeding of the 7th Tübinger Perception Conference, Tübingen, 105.
Kornmeier, J., and Bach, M. (2004b). Early neural activity in Necker-cube reversal: evidence for low-level processing of a gestalt phenomenon. Psychophysiology 41, 1–8.
Kornmeier, J., and Bach, M. (2005). The Necker cube – an ambiguous figure disambiguated in early visual processing. Vision Res. 45, 955–960.
Kornmeier, J., and Bach, M. (2006). Bistable perception – along the processing chain from ambiguous visual input to a stable percept. Int. J. Psychophysiol. 62, 345–349.
Kornmeier, J., and Bach, M. (2009). Object perception: when our brain is impressed but we do not notice it. J. Vis. 9, 1–10.
Kornmeier, J., Bach, M., and Atmanspacher, H. (2004). Correlates of perspective instabilities in visually evoked potentials. Int. J. Bifurcat. Chaos 14, 727–736.
Kornmeier, J., Ehm, W., Bigalke, H., and Bach, M. (2007). Discontinuous presentation of ambiguous figures: how interstimulus-interval durations affect reversal dynamics and ERPs. Psychophysiology 44, 552–560.
Kornmeier, J., Hein, C. M., and Bach, M. (2009). Multistable perception: when bottom-up and top-down coincide. Brain Cogn. 69, 138–147.
Kornmeier, J., Heinrich, S. P., Atmanspacher, H., and Bach, M. (2001). The reversing “Necker Wall” – a new paradigm with reversal entrainment reveals an early EEG correlate. Invest. Ophthalmol. Vis. Sci. 42, 409.
Kornmeier, J., Heinrich, S. P., and Bach, M. (2002). “Necker-Würfel: Neuronale Sättigung und “top-down” Einflüsse,” in Beiträge zur 5. Tübinger Wahrnehmungskonferenz, 69.
Kornmeier, J., Pfaffle, M., and Bach, M. (2011). Necker cube: stimulus-related (low-level) and percept-related (high-level) EEG signatures early in occipital cortex. J. Vis. 11, 1–11.
Kruse, P., Carmesin, H. O., Pahlke, L., Struber, D., and Stadler, M. (1996). Continuous phase transitions in the perception of multistable visual patterns. Biol. Cybern. 75, 321–330.
Lehky, S. R., and Maunsell, J. H. (1996). No binocular rivalry in the LGN of alert macaque monkeys. Vision Res. 36, 1225–1234.
Lehmann, D., and Skrandies, W. (1980). Reference-free identification of components of checkerboard-evoked multichannel potential fields. Electroencephalogr. Clin. Neurophysiol. 48, 609–621.
Leopold, D. A., and Logothetis, N. K. (1999). Multistable phenomena: changing views in perception. Trends Cogn. Sci. (Regul. Ed.) 3, 254–264.
Leopold, D. A., Wilke, M., Maier, A., and Logothetis, N. K. (2002). Stable perception of visually ambiguous patterns. Nat. Neurosci. 5, 605–609.
Liebert, R. M., and Burk, B. (1985). Voluntary control of reversible figures. Percept. Mot. Skills 61, 1307–1310.
Logothetis, N. K. (1998). Single units and conscious vision. Philos. Trans. R. Soc. Lond. B Biol. Sci. 353, 1801–1818.
Logothetis, N. K., Pauls, J., Augath, M., Trinath, T., and Oeltermann, A. (2001). Neurophysiological investigation of the basis of the fMRI signal. Nature 412, 150–157.
Long, G. M., and Olszweski, A. D. (1999). To reverse or not to reverse: when is an ambiguous figure not ambiguous? Am. J. Psychol. 112, 41–71.
Long, G. M., and Toppino, T. C. (2004). Enduring interest in perceptual ambiguity: alternating views of reversible figures. Psychol. Bull. 130, 748–768.
Long, G. M., Toppino, T. C., and Mondin, G. W. (1992). Prime time: fatigue and set effects in the perception of reversible figures. Percept. Psychophys. 52, 609–616.
Luck, S. (2005). An Introduction to the Event-Related Potential Technique. Cambridge, MA, USA: MIT Press.
Lumer, E. D., Friston, K. J., and Rees, G. (1998). Neural correlates of perceptual rivalry in the human brain. Science 280, 1930–1934.
Maier, A., Wilke, M., Aura, C., Zhu, C., Ye, F. Q., and Leopold, D. A. (2008). Divergence of fMRI and neural signals in V1 during perceptual suppression in the awake monkey. Nat. Neurosci. 11, 1193–1200.
Maier, A., Wilke, M., Logothetis, N. K., and Leopold, D. A. (2003). Perception of temporally interleaved ambiguous patterns. Curr. Biol. 13, 1076–1085.
Mathes, B., Struber, D., Stadler, M. A., and Basar-Eroglu, C. (2006). Voluntary control of Necker cube reversals modulates the EEG delta- and gamma-band response. Neurosci. Lett. 402, 145–149.
Meenan, J. P., and Miller, L. A. (1994). Perceptual flexibility after frontal or temporal lobectomy. Neuropsychologia 32, 1145–1149.
Michel, C. M., Murray, M. M., Lantz, G., Gonzalez, S., Spinelli, L., and Grave de Peralta, R. (2004). EEG source imaging. Clin. Neurophysiol. 115, 2195–2222.
Moreno-Bote, R., Rinzel, J., and Rubin, N. (2007). Noise-induced alternations in an attractor network model of perceptual bistability. J. Neurophysiol. 98, 1125–1139.
Müller, T. J., Koenig, T., Wackermann, J., Kalus, P., Fallgatter, A., Strik, W., and Lehmann, D. (2005). Subsecond changes of global brain state in illusory multistable motion perception. J. Neural Transm. 112, 565–576.
Murata, T., Matsui, N., Miyauchi, S., Kakita, Y., and Yanagida, T. (2003). Discrete stochastic process underlying perceptual rivalry. Neuroreport 14, 1347–1352.
Nakatani, H., and van Leeuwen, C. (2006). Transient synchrony of distant brain areas and perceptual switching in ambiguous figures. Biol. Cybern. 94, 445–457.
Necker, L. A. (1832). Observations on some remarkable optical phaenomena seen in Switzerland; and on an optical phaenomenon which occurs on viewing a Figure of a crystal or geometrical solid. Philos. Mag. J. Sci. 1, 329–337.
Noest, A. J., van Ee, R., Nijs, M. M., and van Wezel, R. J. (2007). Percept-choice sequences driven by interrupted ambiguous stimuli: a low-level neural model. J. Vis. 7, 10.
O’Donnell, B. F., Hendler, T., and Squires, N. K. (1988). Visual evoked potentials to illusory reversals of the Necker cube. Psychophysiology 25, 137–143.
Orbach, J., Ehrlich, D., and Heath, H. (1963). Reversibility of the Necker cube: I. An examination of the concept of “satiation of orientation”. Percept. Mot. Skills 17, 439–458.
Orbach, J., Zucker, E., and Olson, R. (1966). Reversibility of the Necker cube: VII: reversal rate as a function of figure-on and figure-off durations. Percept. Mot. Skills 22, 615–618.
Palva, S., and Palva, J. M. (2007). New vistas for alpha-frequency band oscillations. Trends Neurosci. 30, 150–158.
Pastukhov, A., and Braun, J. (2008). A short-term memory of multi-stable perception. J. Vis. 8, 1–14.
Pearson, J., and Brascamp, J. (2008). Sensory memory for ambiguous vision. Trends Cogn. Sci. (Regul. Ed.) 12, 334–341.
Picton, T. W. (1992). The P300 wave of the human event-related potential. J. Clin. Neurophysiol. 9, 456–479.
Pitts, M. A., Gavin, W. J., and Nerger, J. L. (2008). Early top-down influences on bistable perception revealed by event-related potentials. Brain Cogn. 67, 11–24.
Pitts, M. A., Martinez, A., and Hillyard, S. A. (2010). When and where is binocular rivalry resolved in the visual cortex? J. Vis. 10, 1–11.
Pitts, M. A., Martinez, A., Stalmaster, C., Nerger, J. L., and Hillyard, S. A. (2009). Neural generators of ERPs linked with Necker cube reversals. Psychophysiology 46, 694–702.
Pitts, M. A., Nerger, J. L., and Davis, T. J. R. (2007). Electrophysiological correlates of perceptual reversals for three different types of multistable images. J. Vis. 7, 1–14.
Pomerantz, J., and Kubovy, M. (1981). “Perceptual organization: an overview,” in Perceptual Organization, eds M. Kubovy and J. Pomerantz (Hillsdale: Erlbaum), 423–456.
Rock, I., Gopnik, A., and Hall, S. (1994a). Do young children reverse ambiguous figures? Perception 23, 635–644.
Rock, I., Hall, S., and Davis, J. (1994b). Why do ambiguous figures reverse? Acta Psychol. (Amst.) 87, 33–59.
Roeber, U., Widmann, A., Trujillo-Barreto, N. J., Herrmann, C. S., O’Shea, R. P., and Schröger, E. (2008). Early correlates of visual awareness in the human brain: time and place from event-related brain potentials. J. Vis. 8, 1–12.
Sterzer, P., and Kleinschmidt, A. (2007). A neural basis for inference in perceptual ambiguity. Proc. Natl. Acad. Sci. U.S.A. 104, 323–328.
Sterzer, P., Kleinschmidt, A., and Rees, G. (2009). The neural bases of multistable perception. Trends Cogn. Sci. (Regul. Ed.) 13, 310–318.
Sterzer, P., and Rees, G. (2008). A neural basis for percept stabilization in binocular rivalry. J. Cogn. Neurosci. 20, 389–399.
Strüber, D., Basar-Eroglu, C., Hoff, E., and Stadler, M. (2000). Reversal-rate dependent differences in the EEG gamma-band during multistable visual perception. Int. J. Psychophysiol. 38, 243–252.
Strüber, D., Basar-Eroglu, C., Miener, M., and Stadler, M. (2001). EEG gamma-band response during the perception of Necker cube reversals. Vis. Cogn. 8, 609–621.
Strüber, D., and Herrmann, C. S. (2002). MEG alpha activity decrease reflects destabilization of multistable percepts. Brain Res. Cogn. Brain Res. 14, 370–382.
Strüber, D., and Stadler, M. (1999). Differences in top-down influences on the reversal rate of different categories of reversible figures. Perception 28, 1185–1196.
Tong, F., and Engel, S. A. (2001). Interocular rivalry revealed in the human cortical blind-spot representation. Nature 411, 195–199.
Tong, F., Meng, M., and Blake, R. (2006). Neural bases of binocular rivalry. Trends Cogn. Sci. (Regul. Ed.) 10, 502–511.
Tong, F., Nakayama, K., Vaughan, J. T., and Kanwisher, N. (1998). Binocular rivalry and visual awareness in human extrastriate cortex. Neuron 21, 753–759.
Tononi, G., Srinivasan, R., Russell, D. P., and Edelman, G. M. (1998). Investigating neural correlates of conscious perception by frequency-tagged neuromagnetic responses. Proc. Natl. Acad. Sci. U.S.A. 95, 3198–3203.
Toppino, T. C., and Long, G. M. (1987). Selective adaptation with reversible figures: don’t change that channel. Percept. Psychophys. 42, 37–48.
van Ee, R., van Dam, L. C., and Brouwer, G. J. (2005). Voluntary control and the dynamics of perceptual bi-stability. Vision Res. 45, 41–55.
VanRullen, R., Reddy, L., and Koch, C. (2006). The continuous wagon wheel illusion is associated with changes in electroencephalogram power at approximately 13 Hz. J. Neurosci. 26, 502–507.
Verleger, R., Jaskowski, P., and Wascher, E. (2005). Evidence for an integrative role of P3b in linking reaction to perception. J. Psychophysiol. 19, 165–181.
Washburn, M. F., Mallat, H., and Naylor, A. (1931). The influence of the size of an outline cube on the fluctuations of its perspective. Am. J. Psychol. 43, 484–489.
Watanabe, M., Cheng, K., Murayama, Y., Ueno, K., Asamizuya, T., Tanaka, K., and Logothetis, N. (2011). Attention but not awareness modulates the BOLD signal in the human V1 during binocular suppression. Science 334, 829–831.
Wertheimer, M. (1912). Experimentelle Studien über das Sehen von Bewegungen. Z. Psychol. 61, 161–265.
Wilke, M., Logothetis, N. K., and Leopold, D. A. (2006). Local field potential reflects perceptual suppression in monkey visual cortex. Proc. Natl. Acad. Sci. U.S.A. 103, 17507–17512.
Woerner, R., Bach, M., and Kornmeier, J. (2009). Ambiguous figures: different levels of perceptual adaptation. Perception 38, 138.
Woo, M., Neider, J., and Davis, T. (1998). OpenGL Programming Guide. The Official Guide to Learning OpenGL, Version 1.1. Reading, MA: Addison-Wesley.
Keywords: ambiguous figures, multistable perception, Necker cube, old/young woman, EEG/ERP, event-related potentials, reversal positivity, reversal negativity
Citation: Kornmeier J and Bach M (2012) Ambiguous figures – what happens in the brain when perception changes but not the stimulus. Front. Hum. Neurosci. 6:51. doi: 10.3389/fnhum.2012.00051
Received: 29 October 2011; Paper pending published: 27 November 2011;
Accepted: 26 February 2012; Published online: 22 March 2012.
Edited by:
Theofanis Panagiotaropoulos, Max Planck Institute for Biological Cybernetics, GermanyReviewed by:
Theofanis Panagiotaropoulos, Max Planck Institute for Biological Cybernetics, GermanyKevin Whittingstall, Université de Sherbrooke, Canada
Copyright: © 2012 Kornmeier and Bach. This is an open-access article distributed under the terms of the Creative Commons Attribution Non Commercial License, which permits non-commercial use, distribution, and reproduction in other forums, provided the original authors and source are credited.
*Correspondence: Jürgen Kornmeier, Institute for Frontier Areas of Psychology and Mental Health, Wilhelmstraße 3a, 79098 Freiburg i. Br., Germany. e-mail:kornmeier@igpp.de