 Huihui Li1,2
 Sukhwinder Singh1*
 Sridhar Bhavani1Ravi P. Singh1
 Deepmala Sehgal1Bhoja R. Basnet1
 Prashant Vikram1
 Juan Burgueno-Ferreira1Julio Huerta-Espino3
- 1International Maize and Wheat Improvement Center (CIMMYT), Texcoco, Mexico
- 2Institute of Crop Science, Chinese Academy of Agricultural Sciences, Beijing, China
- 3Campo Experimental Valle de México, Instituto Nacional de Investigaciones Forestales, Agrícolas y Pecuarias, Universidad Autónoma Chapingo, Texcoco, Mexico
Rusts, a fungal disease as old as its host plant wheat, has caused havoc for over 8000 years. As the rust pathogens can evolve into new virulent races which quickly defeat the resistance that primarily rely on race specificity, adult plant resistance (APR) has often been found to be race non-specific and hence is considered to be a more reliable and durable strategy to combat this malady. Over decades sets of donor lines have been identified at International Maize and Wheat Improvement Center (CIMMYT) representing a wide range of APR sources in wheat. In this study, using nine donors and a common parent “PBW343,” a popular Green Revolution variety at CIMMYT, the nested association mapping (NAM) population of 1122 lines was constructed to understand the APR genetics underlying these founder lines. Thirty-four QTL were associated with APR to rusts, and 20 of 34 QTL had pleiotropic effects on SR, YR and LR resistance. Three chromosomal regions, associated with known APR genes (Sr58/Yr29/Lr46, Sr2/Yr30/Lr27, and Sr57/Yr18/Lr34), were also identified, and 13 previously reported QTL regions were validated. Of the 18 QTL first detected in this study, 7 were pleiotropic QTL, distributing on chromosomes 3A, 3B, 6B, 3D, and 6D. The present investigation revealed the genetic relationship of historical APR donor lines, the novel knowledge on APR, as well as the new analytical methodologies to facilitate the applications of NAM design in crop genetics. Results shown in this study will aid the parental selection for hybridization in wheat breeding, and envision the future rust management breeding for addressing potential threat to wheat production and food security.
Introduction
The global wheat (Triticum aestivum L.) demand is expected to increase by 60–110% to feed the population in 2050 (Tilman et al., 2011). Higher yield gains are required to meet the projected demand posed by increasing population and against the increasing production challenges from a host of biotic and abiotic stresses (Rajaram and Braun, 2008). Globally, the three wheat rusts, stem rust (SR), yellow rust (YR), and leaf rust (LR) are the most economically damaging diseases of the crop, inflicting losses of 60% or more, and are the constant threats to food security (Rajaram and Braun, 2008). This is due to their wide distribution, capacity to form new virulent races, ability to move long distances, and potential to develop rapidly under optimal environmental conditions. The UN Food and Agriculture Organization (FAO) estimates that 31 countries in East and North Africa, the Near East, Central and South Asia, accounting for more than 37% of global wheat production area, are at risk of wheat rust diseases. Furthermore, as wheat growing mega-environments shift with changing climate, there is risk of more severe rust infection in varieties suffering environmental stress emanating from hostile soil, pests and pathogens from remnant vegetation and other constraints.
The wheat SR, caused by fungus Puccinia graminis f. sp. tritici (Pgt), has historically been a menace to wheat production worldwide (Khan et al., 2013). A considerably newer Pgt race, TTKSK detected in Uganda in 1999 and commonly referred as Ug99, overcame the widely deployed resistance genes of wheat origin (Pretorius et al., 2000). Over the last decades, several variants of Ug99 were detected in Kenya (Jin et al., 2009), South Africa (Pretorius et al., 2010), and many other wheat growing countries of North- and South-Eastern African countries (Singh et al., 2015). The original race spread out into Yemen and Sudan in 2006, in Iran in 2007 and in Egypt in 2014 (Nazari et al., 2009; Singh et al., 2015). This has raised concern of a major epidemic that could cause damage in wheat growing countries on all continents as most popular varieties grown currently are susceptible to Ug99 race group. The wheat YR, caused by P. striiformis f. sp. tritici (Pst), affects up to 40% of the wheat production in countries such as Mexico, India, Pakistan, Bangladeshi, and China (Khan et al., 2013). Recent investigation by Beddow et al. (2015) has indicated that YR is one of the deadliest threats to global wheat production as the pathogen continues to rapidly evolve and spread across globe making nearly 88% of world's wheat susceptible and causing an estimated loss of 5.47 million tons of wheat grains annually. Recent YR epidemics across different continents have been mainly observed due to rapid adaptation of pathogen to newer geographical regions and relatively higher temperature, and due to rapid breakdown of widely deployed major genes (ICARDA, 2011; Basnet et al., 2014). The wheat LR, caused by Puccinia triticina (Pt), is also one of the most widely distributed diseases of wheat in the world, and can cause yield losses of up to 40% in susceptible cultivars by decreasing kernel number per spike and kernel weight (Khan et al., 2013).
In general, the rust resistance can be classified into two major types i.e., race-specific and race non-specific. Race specific resistance is often conferred by a single major gene which is inherited in simple Mendelian fashion. Such resistance is often detected at early seedling stage of plant growth and remains effective throughout whole life cycle, and hence it is also called “seedling or all-stage resistance.” In contrast, race non-specific resistance is conferred by multiple additive genes possessing quantitative inheritance and is expressed during post-seedling stage of plant growth. So, the race non-specific resistance is synonymously called as “Adult plant resistance (APR)” or “slow rusting resistance.” As APR is generally conferred by multiple additive genes, it is not subjected to regular “boom and bust cycle” of disease epidemics. Sources of quantitative resistance in crop plants, readily detected in post-seedling growth stages and associated with race non-specific resistance, have proven to be durable, making APR an important breeding target for long-term rust resistance (Knott, 1982; Parlevliet, 2002). Therefore, it is critical to deploy APR genes to rust diseases in high yielding varieties. The Global Wheat Program at International Maize and Wheat Improvement Center (CIMMYT), initiated to identify APR genes for wheat rust in early 1980's. But due to their small effects, it is difficult to follow them in breeding programs. Over decades prominent sets of donor lines have been identified as important sources of APR to wheat rusts which were more rigorously utilized after the inception of Durable Rust Resistance Wheat (DRRW) Project in 2005 under the umbrella of Borlaug Global Rust Initiative (BGRI). Series of bi-parental populations were developed by crossing these APR donor lines with the most popular Green Revolution variety, PBW343. These populations provided a solid foundation for APR resources to rusts resistance (including Ug99) wheat breeding program of CIMMYT. Although numerous rust resistant elite germplasm have been developed using these crosses, clear understanding of complex genetics underlying these APR donors still remains elusive.
Till now, almost all the genetic studies on rust resistance has relied on linkage analysis using bi-parental populations and association mapping in hundreds of wheat breeding lines (Rosewarne et al., 2013; Li et al., 2014; Yu et al., 2014). Several resistance genes have been identified and few of them (such as Sr2, Lr34, Lr46, and Lr67) are well characterized and widely used in breeding (Rosewarne et al., 2013; Li et al., 2014; Yu et al., 2014; Moore et al., 2015). Nested association mapping (NAM) design pioneered in maize (Buckler et al., 2009) combines the advantages of linkage analysis and association mapping through the development of a large number of recombinant inbred lines (RILs) from diverse founders for identifying QTL. It has been successfully used to dissect the genetic architecture of complex traits in maize including flowering time (Buckler et al., 2009), leaf traits (Tian et al., 2011), male and female inflorescence (Brown et al., 2011), and various disease resistance and quality traits (Poland et al., 2011; Cook et al., 2012). Thus, NAM is a powerful design to study the genetic architecture of complex traits. More recently, Bajgain et al. (2016) used a spring wheat NAM population, composed of 852 lines, to conduct a join linkage analysis for SR resistance QTL.
One of the goals of the wheat breeding program at CIMMYT is to develop new high yielding germplasm with durable resistance to rusts. Identification and transfer of new sources of race-specific resistance from various wheat relatives is also underway to enhance the diversity for resistance. Several sources of APR to Ug99 were identified in CIMMYT spring bread wheat germplasm and mapping studies have identified genomic regions that contribute to APR (Yu et al., 2011; Singh et al., 2013). Developing and use of molecular markers for APR can speed up selection processes and also provide opportunities to focus on other important traits simultaneously. The objectives of our study were: (1) to evaluate the genetic relatedness and phenotypic diversity of APR donor lines; (2) to map QTL associated with APR to SR, YR, and LR in the CIMMYT NAM population; (3) to identify the new resistance loci that could be useful in diversifying the current set of resistance genes by In silico analysis of QTL flanked marker sequences; and (4) to investigate the new analytical methodology for facilitating the applications of NAM design in crop genetics.
Materials and Methods
CIMMYT Wheat NAM Population
The CIMMYT wheat NAM population was composed of 1122 RILs derived from the crosses of a common parent (PBW343) with each of nine diverse founders. The nine founder lines were Diniza, Crosbill, Juchi, Kenya Swara, Kingbird, Kenya Kudu, Pavon76, Muu, and Kenya Nyangumi (Figure 1). The common parent, PBW343, was crossed to the other nine founders, and F1 plants were selfed to generate nine segregating F2 populations. Out of each F2 population, 80, 87, 90, 177, 88, 89, 178, 146, and 187 RILs were derived through single-seed descent with repeated selfing to the F5 of F6 generation for the nine families, respectively (Supplementary Table 1). To facilitate the illustration throughout the paper, the names of nine individual families are abbreviated as PB/DZ, PB/CB, PB/JC, PB/KS, PB/KB, PB/KK, PB/P76, PB/MU, PB/KN, respectively, and the nine founder lines, other than PBW343, are mentioned as “non-PBW343” in general. Moderately susceptible bread wheat (Triticum aestivum) key parent PBW343, is a selection (GID2430154) from CIMMYT line Attila with the pedigree Nord Deprez/VG9144//Kalyansona/Bluebird/3/Yaco/4/Veery#5 (Table 1). The nine non-PBW343 wheat lines carried high levels of APR to SR (Table 2) despite being susceptible to Ug99 race group in seedling growth stage.
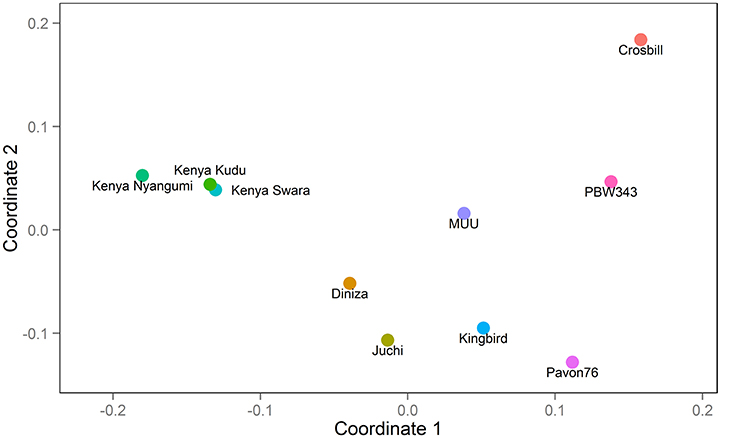
Figure 1. Genetic relatedness among 10 founders: PBW343, Diniza, Crosbill, Juchi, Kenya Swara, Kingbird, Kenya Kudu, Pavon76, MUU, and Kenya Nyangumi.
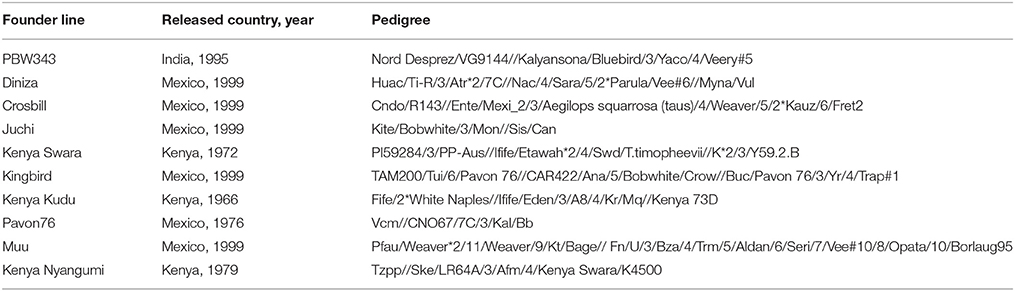
Table 1. Detailed information of released year and country, and pedigree of the ten founder lines.
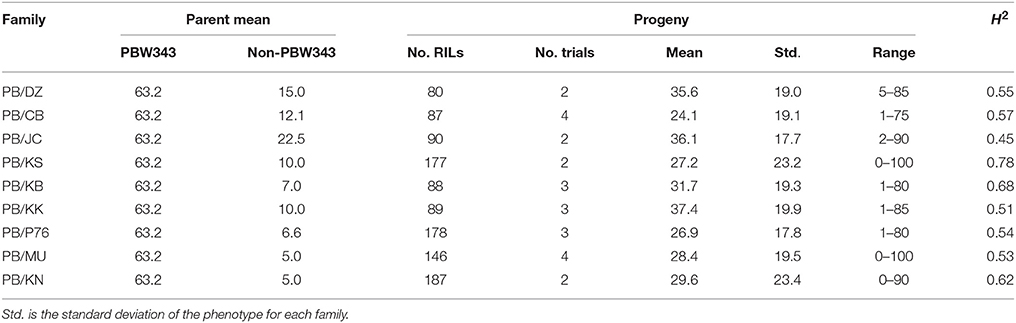
Table 2. Parents' performance, means, ranges, and the heritability in the broad sense (H2) of stem rust severity in nine families of the CIMMYT NAM.
Evaluating SR, YR, and LR Severity
The 10 founder parents, highly susceptible bread wheat check variety “Cacuke” and the CIMMYT wheat NAM population were evaluated for SR severities at the Kenya Agricultural Research Institute (KARI) in Njoro during four crop seasons: main season 2009, main and off-seasons 2010, and main season 2011, hereafter denoted as SR-MS2009, SR-MS2010, SR-OS2010, and SR-MS2011, respectively (Supplementary Table 1). The RILs and parents were sown using a randomized complete block design with two replicates. Field plots consisted of two 1-m rows spaced 20 cm apart with a 0.5-m pathway. Approximately 60–70 seeds were sown in each plot. The experimental block was surrounded by a spreader row consisting of varieties differentially susceptible to the Sr24 virulent variant race TTKST. Hill plots of spreaders were also planted in the middle of the pathway on one side of each plot to facilitate uniform disease build-up and spread. On at least two occasions just prior to booting, freshly collected urediniospores suspended in distilled water were injected into culms in the spreader plots (1–3 plants/m) using a hypodermic syringe. Disease response in the field was assessed twice. First when the susceptible check variety Cacuke displayed 50–60% SR severity and subsequently at peak disease development, when Cacuke displayed 100% SR at the mid-dough stage of plant growth. Percent disease severity was scored using the modified Cobb Scale (Peterson et al., 1948). The second rating was considered as the phenotype in this study. All the nine families were evaluated for APR to SR during two seasons of 2010 (Supplementary Table 1). Five of them (i.e., PB/CB, PB/KB, PB/KK, PB/P76, and PB/MU) were screened for APR to SR at SR-MS2009, while two of them (i.e., PB/CB and PB/MU) were screened for APR to SR at MS-2011.
Parents and population lines were evaluated for YR under field conditions in rust nurseries operated by CIMMYT near Toluca, Edo. Mexico, Mexico, and in Njoro, Kenya, in 2010 and 2011, which are denoted as YR-T2010, YR-T2011, YR-K2010, and YR-K2011, respectively (Supplementary Table 1). Two replicates of parents and RILs were assessed in each trial. YR severity in each plot was visually scored (anthesis - milk stage) using the modified Cobb Scale (Peterson et al., 1948). All the nine families were evaluated for APR to YR at YR-T2010 (Supplementary Table 1). Five of them (i.e., PB/DZ, PB/CB, PB/JC, PB/KB, and PB/MU) were screened for APR to YR at YR-K2010, while only one of them was screened for APR to YR at each of YR-T2011 (i.e., PB/KK), and YR-K2011 (i.e., PB/MU).
For LR screening, parents and RILs were evaluated in field nurseries operated by CIMMYT in Ciudad Obregon, Sonora, Mexico, in 2010, 2011, and 2012, denoted as LR-2010, LR-2011, and LR-2012, respectively (Supplementary Table 1). Replicated trials with parents and RILs were grown in Obregon. Each plot was visually scored around early-dough stage for LR severity with the percentage of leaf covered with disease infection calculated as described for YR. Five of the nine families (i.e., PB/DZ, PB/CB, PB/JC, PB/P76, and PB/KN) were evaluated for APR to LR at LR-2010 (Supplementary Table 1), four of them (i.e., PB/CB, PB/KB, PB/KK, and PB/MU) were screened for APR to LR at LR-2011, and two of them (i.e., PB/KS and PB/KK) were screened for APR to LR at LR-2012. Phenotypic distributions of rust resistance of CIMMYT NAM population are shown in Supplementary Figure 1.
Heritability in Broad Sense
An analysis of variance for phenotypic variance () of the three rust resistances were estimated by mixed linear model using PROC MIXED of SAS software (Release 9.4; SAS Institute, Cary, NC, USA). Genotype, trials, and genotype by trial interactions were all considered as random effects, their variance were denoted as , , , respectively. It is generally agreed that environmental variance should not be included in the calculation of heritability (Holland et al., 2003). Phenotypic variance per plot in multi-trials can be written as , where is the variance of residual. Heritability in broad sense on an individual plot basis was thus calculated as (Holland et al., 2003), .
Molecular Analysis
DNA was extracted from lyophilized leaf tissue following the procedure described by Singh and Bowden (2011). A Nano-Drop ND8000 spectrophotometer (Thermo Fisher Scientific Inc, USA) was used for quantification of DNA samples. For Diversity Arrays Technology (DArT) genotyping, 500–1000 ng of restriction grade DNA, suspended in TE with a final concentration of 50–100 ng/μL were sent to Triticarte Pty. Ltd., Canberra, Australia (http://www.diversityarrays.com) for genome profiling (Neumann et al., 2011). Loci were scored as present (1) or absent (0). The overall call rate for the population was approximately 95% and the Q-values (estimates of marker quality) for most markers were above 80%.
Linkage Map and Consensus Map Construction
For constructing a linkage map, there are two general steps, grouping and ordering. For marker grouping, the agglomerative hierarchical clustering algorithm (Day and Edelsbrunner, 1984) was used, with the significance of recombinant frequency between markers as the statistics to evaluate the relatedness among markers. After all markers were grouped, within each group nearest neighboring algorithm was used for map construction and two-opt was used for map improvement (Muyldermans et al., 2005). Finally, the linkage map was fine-tuned by permutation of a window of m markers (m = 5 in this study) and comparison of all m! possible maps. SARF (Sum of Adjacent Recombination Frequencies) (Falk and Chakravarti, 1992) was used as the rippling criteria.
For the consensus map construction in the CIMMYT NAM population, a similar strategy as used in the maize NAM and Arabidopsis NAM populations (McMullen et al., 2009; Li et al., 2011) was adopted by grouping and ordering algorithms described above. The PBW343 allele was designated as the “A” allele, the other nine non-PBW343 parent alleles were designated as the “B” allele, and the heterozygous loci were converted to missing data. Markers that were non-polymorphic in a particular family were converted to missing data. A total of 2193 genetic markers showed polymorphism between PBW343 and the other nine non-PBW343 parents (Supplementary Figure 2). 830 markers polymorphism in at least 3 families were used to construct the consensus map. 53 of 830 markers cannot be linked with the rest of markers, so were deleted from the dataset. Software JoinMap (Stam, 1993) and QTL IciMapping (Li et al., 2007) were used to validate the nine linkage maps and consensus map as well. Genotypic similarity was calculated by Flapjack (Milne et al., 2010; downloaded from https://ics.hutton.ac.uk/flapjack/). 272 SSR markers (Supplementary Table 2) were used to calculate the similarities among 10 founders. 777 DArT markers on the consensus map were used to calculate the similarities of CIMMYT NAM population.
QTL Mapping in Single Family
QTL were mapped in each of the single CIMMYT NAM family using inclusive composite interval mapping (ICIM), which was implemented in QTL IciMapping (Li et al., 2007). ICIM first determined a set of cofactors using stepwise regression to fit individual marker, and then scanned the entire genome at 1 cM intervals using maximum likelihood to test putative QTL at each point. In stepwise regression, the probability for marker effects entering into the model was set as 0.01, which was determined by 1000 times of permutation test and quantile-quantile (QQ) plot (Supplementary Figures 3, 4). The probability of a marker moving out of the model was set at twice the probability of a marker moving into the model. The LOD threshold to declare the existence of a QTL was calculated by 1000 times of permutation test using SR-MS2010 in nine RIL families. Permutation tests revealed LOD thresholds of 3.43, 3.46, 3.43, 5.19, 4.69, 4.31, 3.37, 3.14, and 3.35 for PB/DZ, PB/CB, PB/JC, PB/KS, PB/KB, PB/KK, PB/P76, PB/MU and PB/KN, respectively. Considering that thresholds retained from permutation tests are always conservative (Anderson and ter Braak, 2003), a LOD threshold of 2.5 was used to report QTL and determine common QTL across trials and populations. The phenotypic variance explained (PVE) by each QTL within each RIL family was calculated as described in Li et al. (2008).
Joint QTL Linkage Mapping on CIMMYT NAM Population
Joint inclusive composite interval mapping (JICIM; Li et al., 2011) was used to map QTL on CIMMYT NAM population, which was implemented in QTL IciMapping as well. The basic idea of JICIM was similar as that of ICIM, but in the first step a family main effect was fit first in the joint stepwise regression model followed by the selection of marker effects to enter or exit the model. In the joint stepwise regression, marker effects entered or exited the model based on the significance level chosen from running a permutation procedure 1000 times to control the Type I error rate at α = 0.05 (Anderson and ter Braak, 2003). The resulting 1000 P-values were sorted, and the 50th smallest P-value was selected as the empirical α = 0.05 entry threshold. Since for traits across trials the population size was different (Supplementary Table 1), permutation test was conducted per trait per trial. In this sense, the 50th smallest P-value was retained for 11 traits/trials, 8.9 × 10⁻⁵, 1.5 × 10⁻⁴, 8.6 × 10⁻⁵, 8.5 × 10⁻⁵, 6.9 × 10⁻⁵, 9.7 × 10⁻⁵, 9.7 × 10⁻⁵, 8.6 × 10⁻⁵, 8.6 × 10⁻⁵, 8.4 × 10⁻⁵, and 6.5 × 10⁻⁵ for SR-MS2009, SR-MS2010, SR-OS2010, SR-MS2011, YR-T2010, YR-K2010, YR-T2011, YR-K2011, LR-2010, LR-2011, and LR-2012 (Supplementary Table 1), respectively. Therefore, 1.0 × 10⁻⁵ was set as the probability for markers moving into the model. The probability of a marker moving out of the model was set at twice the probability of a marker moving into the model.
The LOD threshold to declare the existence of a QTL was calculated by permutation tests as well. Permutation tests revealed LOD thresholds of 4.50, 5.50, 3.50, 3.50, 3.50, 3.50, 3.50, 3.53, and 3.51 for SR-MS2009, SR-MS2010, SR-OS2010, SR-MS2011, YR-T2010, YR-K2010, YR-T2011, YR-K2011, LR-2010, LR-2011, and LR-2012 (Supplementary Table 1), respectively. An LOD threshold of 4.0 was used to report QTL and determine common QTL across trials and populations. QTL, having LOD score in the range of 3.0–4.0, and with pleiotropic effect with other QTL having LOD score higher than 4.0, were also reported. The PVE by each QTL in the NAM population was calculated as described in Li et al. (2011).
Epistasis
For epistatic QTL mapping, we tested all possible pairs of scanning positions by ICIM (Li et al., 2008). That is to say, we can detect digenic interactions regardless of whether the two interacting QTL have significant additive effects or not. Due to the large amount of variables in digenic QTL mapping, we used a much stricter probability (1.0 × 10⁻⁴) of a marker moving into the model. The probability of a marker moving out of the model was set at twice the probability of a marker moving into the model. An empirical LOD threshold of 4.0 was used to declare the existence of epistatic QTL.
Pleiotropy
A central issue in evaluating pleiotropy in linkage populations is determining whether correlated effects are the product of linked loci or the same gene. In this study, we determined pleiotropy by the co-localization of the QTL and the correlations of effects estimated at each locus to evidence that the same QTL were responsible. If two QTL were within 20 cM apart from each other, they were declared as the co-localized QTL. We correlated the effects at each locus against one another for each rust disease. Those with significantly correlated effects are likely to have the same genes and allele series that are producing the correlation. Counts of significant correlation were determined with P = 0.05, however, the significant loci were frequently much more significant.
Prediction
We used the significant NAM QTL additive effect estimates to predict the rust resistance of the non-PBW343 founder lines (Buckler et al., 2009) by equation , where is the predicted phenotype of the jth non-PBW343 founder in the jth family (j = 1, …, 9 in this study), μ is the population mean, q is the number of QTL, and aij is the additive effect estimate of ith QTL in jth family, and equals to 0 if the additive effect estimate was not significant in some families.
In silico Analysis
The sequences of the DArT markers were used as the query for BLAST in IWGSC portal (https://urgi.versailles.inra.fr/blast/blast.php) to retrieve the contigs. Top 5 hits with similarity percentage of the query were used as query in BLASTX searches in NCBI database querying wheat (Triticum aestivum L.), Brachypodium (Brachypodium distachyon (L.) P. Beauv), Hordeum vulgare L., and rice (Oryza sativa L.) databases. R genes encoding proteins that recognize pathogen effectors or their modified host targets were used to narrow down the results. For example, proteins characterized by the presence of motifs such as leucine-rich repeat (LRR), NBS-LRR (nucleotide binding site containing LRR), RLP (receptor like proteins coupled with extracellular LRR), resistance gene analogs (RGA) and RLK (receptor like kinase) were targeted.
Results
Phenotypic Variability
Across the CIMMYT NAM population, the largest phenotypic variance was observed for SR, followed by YR, and LR (Tables 2–4; Supplementary Figure 1). The ten founder lines showed a wide range of phenotypic variation, especially for resistance to SR. Each family was evaluated for SR at least twice across different growing seasons in Kenya (Table 2). The common reference parent, PBW343, was moderately susceptible to SR compared with the other nine founders. The three families with the highest mean SR severity (%) were PB/KK, PB/JC, and PB/DZ. Transgressive variation was observed in all the nine families. SR had moderately high broad sense heritability (H2) across the nine families, indicating the sufficient statistical power and precision for QTL mapping and effect estimation. The highest heritability (H2 = 0.78) was estimated for family PB/KS.
YR was evaluated for 2 years in Toluca, Mexico (YR-T2010 and YR-T2011) and in Kenya (YR-K2010 and YR-K2011) (Supplementary Table 1). PBW343 had higher YR severity compared to Pavon76 (Table 3). The highest mean YR severity (%) was recorded in PB/P76. Similar to SR (Table 2), transgressive variation was observed in all the nine families. For PB/KK, H2 for YR reached the highest, 0.89, but for the other families, H2 was fairly low and could have been due to the smaller variations for disease severity between RILs in these families. LR was evaluated in Obregon, Mexico for three consecutive years (LR-2010, LR-2011, and LR-2012). PBW343 was more resistant to LR, as compared to Kenya Kudu (Table 4). Since the CIMMYT NAM population was not originally designed to study LR, fewer QTL could be identified for LR as compared with SR.
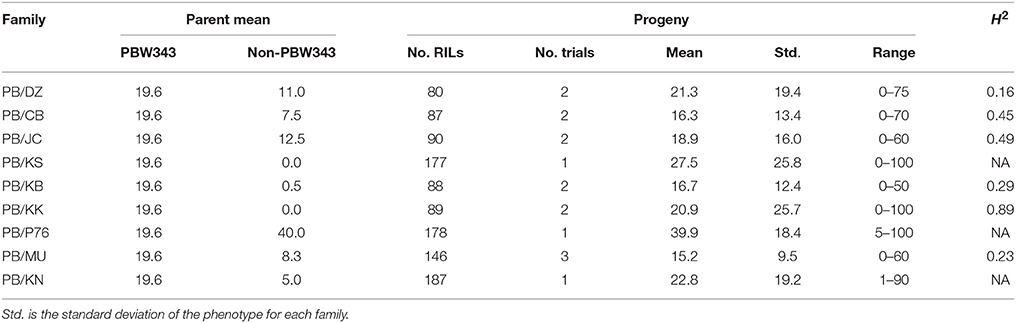
Table 3. Parents' performance, means, ranges, and the heritability in the broad sense (H2) for yellow rust severity in nine families of the CIMMYT NAM.
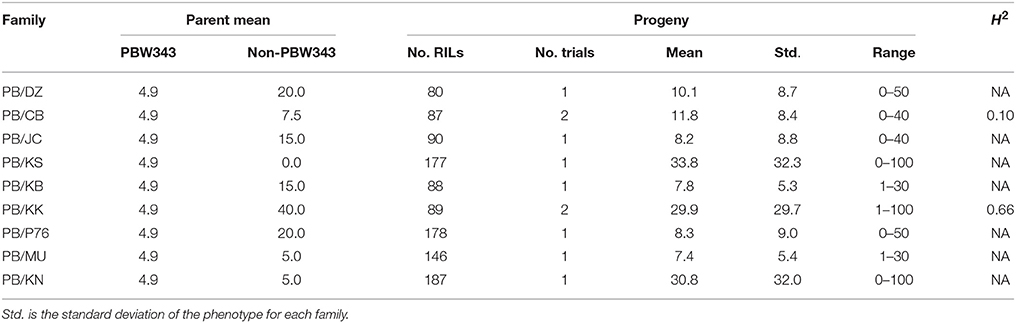
Table 4. Parents' performance, means, ranges, and the heritability in the broad sense (H2) for leaf rust severity in nine families of the CIMMYT NAM.
Marker Distribution on the Consensus Map
On the consensus map, 777 polymorphic DArT markers covered 2661.8 cM of the genetic distance of the wheat genome (Table 5; Supplementary Table 3), with an average inter-marker distance of 3.58 cM and 87.9% (683 out of 777) of unique positions (Supplementary Figures 5, 6). Due to the lack of evenly distributed polymorphic markers on wheat genome, the number of linkage groups for the consensus map was 34; there were no markers on chromosomes 1DL, 3DL, 4D, 5AL, and 5D; and less than 10 markers on each of chromosomes 1BL, 2AL, 2D, 3DL, 4AS, 4B, 5A, 6BL, and 7BS. The A, B and D genomes covered the genetic distances of 898.0 cM, 1475.0 cM, and 288.8 cM, respectively. The length of marker intervals ranged from 0 to 29.65 cM. The 489 marker intervals, corresponding to 75.4% of total marker intervals by 683 unique positions, were ranged from 0 to 5 cM in length (Supplementary Figure 6).
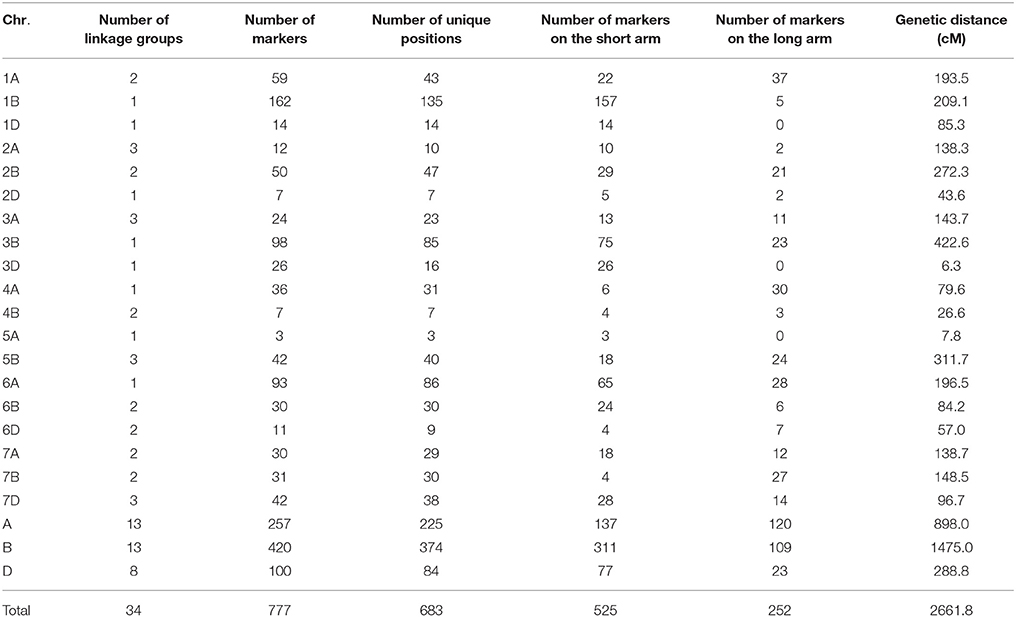
Table 5. Summary statistics of consensus linkage map for the CIMMYT NAM population.
Genetic Relatedness of Ten Founder Lines and the CIMMYT NAM Population
The 10 founder lines of CIMMYT NAM population had high genetic diversity, but with different genetic distance (Figure 1). Kenya Kudu, Kenya Swara, and Kenya Nyangumi were the three varieties released in Kenya in 1966, 1972, and 1979, respectively (Table 1). Kenya Kudu and Kenya Swara shared the same origin of Ifife landrace, and Kenya Swara is in the pedigree of Kenya Nyangumi (Table 1). Therefore, the genetic distances among Kenya Kudu, Kenya Swara, and Kenya Nyangumi were closer as compared with others (Figure 1). Juchi, Kingbird, and Pavon76 were released in 1999, 1999, and 1976 from CIMMYT, Mexico. Juchi and Kingbird shared a parent Bobwhite, and Pavon76 was one of the parental lines of Kingbird (Table 1). So these three varieties are nearby in Figure 1, and Kingbird is in the middle of Juchi and Pavon76. Diniza, Crosbill, and Muu were released in 1999 from CIMMYT, Mexico. Parula is in the pedigree of Diniza, while Crosbill and Muu shared Weaver in their pedigrees, one of whose parental lines was Parula (Table 1). However, these founders were not genetically close in the plot (Figure 1), which could be partly due to the fact that the 272 SSR markers were not enough to uncover their relatedness.
The nine bi-parental RIL families can be clearly separated, except for PB/KB, PB/JC, and PB/P76 (Figure 2). From the pedigree analysis (International Wheat Information System, IWIS version 2, CIMMYT), PBW343 (ATTILA), Kingbird, Juchi, and Pavon 76 share the common origin, and three founders released from Kenya, Kenya Swara, Kenya Kudu, and Kenya Nyangumi were genetically close (Table 1). Therefore, in Figure 1 PBW343, Kingbird, Juchi, and Pavon 76 were clustered, while Kenya Swara, Kenya Kudu, and Kenya Nyangumi were grouped together. Due to the genetic relatedness of founders, the derived RIL families from PBW343, Kingbird, Juchi, and Pavon 76 had less genetic variation than these derived from PBW343, Kenya Swara, Kenya Kudu, and Kenya Nyangumi. Thus, the genetic distances among PB/KB, PB/JC, and PB/P76 were close, while the genetic distances among PB/KS, PB/KK, and PB/KN were far away (Figure 2).
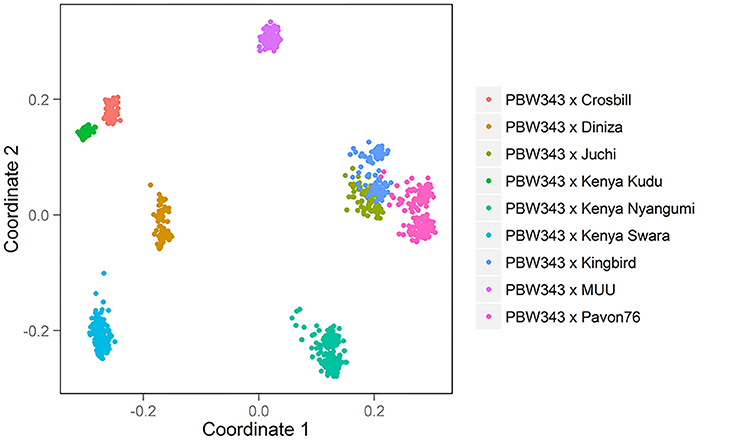
Figure 2. Genetic relatedness among 1122 individuals in CIMMYT NAM population.
Segregation Distortion Loci across the Whole CIMMYT NAM Population
In total, 182 (23.4%) of 777 DArT markers showed evidence of segregation distortion at a 0.05 significance level. The most significant (i.e., −logP) segregation distortion regions (SDRs) were observed on chromosomes 7A, where −logP reached to 20.05, and selection favored alleles were from PBW343 (Supplementary Figure 7). Another large SDR was observed on chromosome 1B, where the selection favored alleles were from non-PBW343 parents. This region corresponds to the Rye chromosome 1RS translocation to wheat in PBW343. Some of the significant SDRs were also observed on chromosomes 1A, 6A, 7B, 3D, and 7D. No significant SDRs were found around well characterized resistance genes Sr2, and Lr34. For nine RIL families, PB/KS has the highest number of markers in segregation distortion (53.50% at a 0.05 significance level), while PB/DZ has the lowest number of segregation distortion markers (11.79% at a 0.05 significance level). For the rest of seven RILs, the averaged ratio of segregation distortion markers was 27.37% (Supplementary Tables 4–13).
QTL Controlling APR to SR, YR, and LR, and In silico Analysis of QTL
Thirty-four identified QTL contributed to APR to SR, YR, and LR, with 9, 18, and 7 of them located on A, B, and D genomes, respectively (Tables 6–8; Figure 3; Supplementary Figure 8). There were 65.7, 52.2, and 57.1% of the resistance alleles were contributed by non-PBW343 parents for SR (Figure 4A), YR (Supplementary Figure 9), and LR resistance (Supplementary Figure 9), respectively. These results suggested transgressive variations for the three rust resistances in the CIMMYT NAM population (Tables 2–4; Supplementary Figure 1).
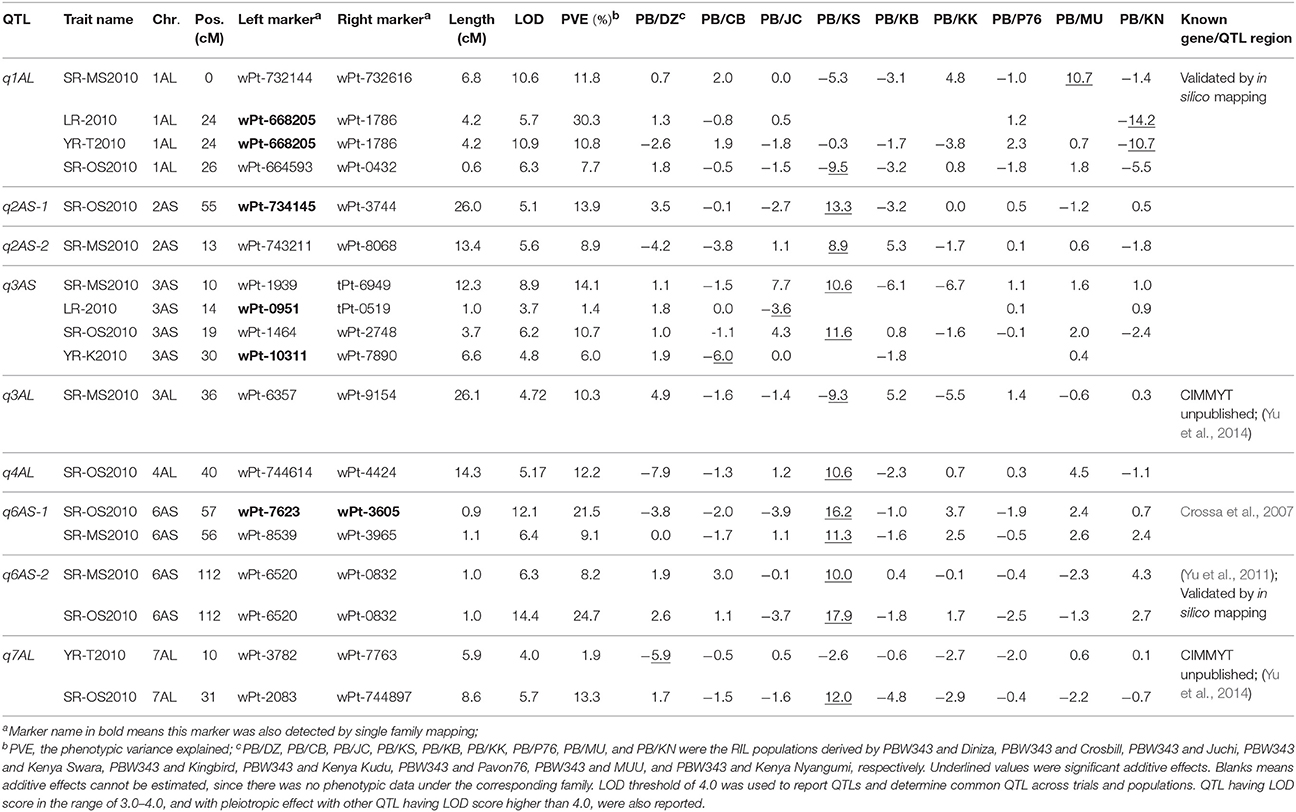
Table 6. Nine QTL identified on A genome by joint inclusive composite interval mapping (JICIM) for the CIMMYT NAM population.
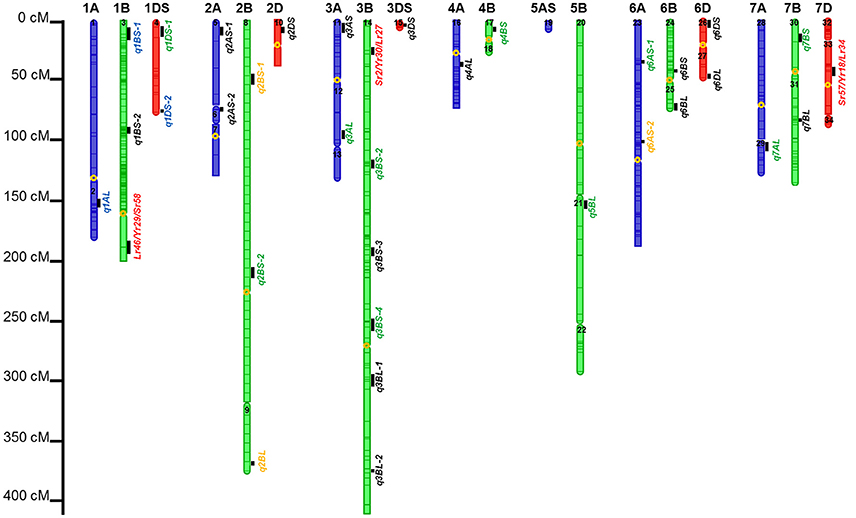
Figure 3. Identified chromosomal regions harboring APR to stem, yellow, and leaf rust resistances. Numbers in the chromosome segments were the linkage group IDs. QTL in red font were in the same regions with well characterized APR genes; in green font were the QTL regions already published but cannot be validated by in silico mapping; in orange font were QTL already published and also can be validated by in silico mapping; in blue font were novel QTL regions, and also can be validated by in silico mapping; and in blank font are the novel QTL regions which need to be further validated.
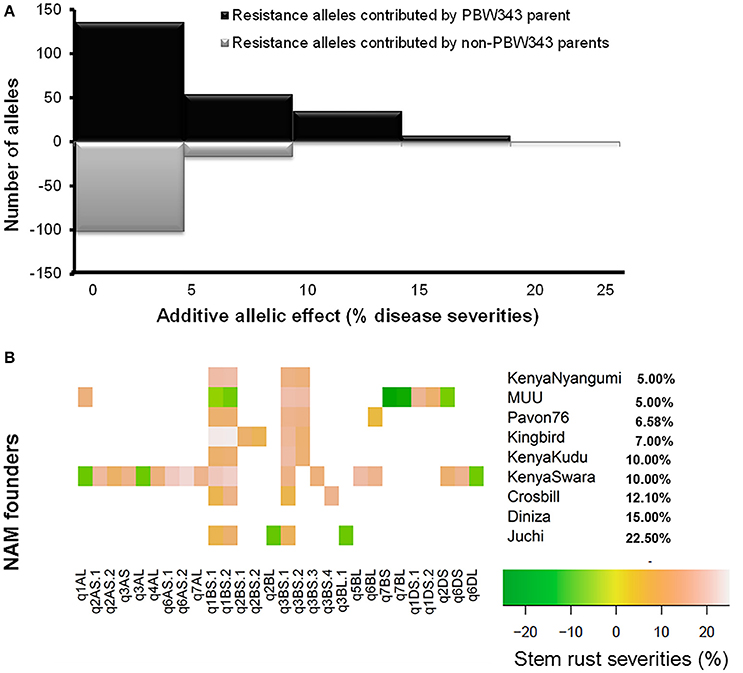
Figure 4. QTL allele effect size distributions for stem rust resistance. (A) All QTL allele effects distribution. The ratio of resistance alleles was shown above the line, and the ratio of negative alleles was shown below the line. (B) Heat map for significant alleles controlling stem rust resistance by QTL and allele donor. The nine APR donor lines were sorted by the phenotype of stem rust resistance.
Six out of the 34 QTL had pleiotropic effects on SR, YR, and LR resistances; eight QTL had pleiotropic effects on SR and YR resistances; four QTL had pleiotropic effects on SR and LR resistances; and two QTL had pleiotropic effects on YR and LR resistances. Of the 34 QTL, three QTL were identified in regions where well characterized APR genes (marked in red in Figure 3), have been reported earlier. These QTL were q1BL, q3BS-1, and q7DS in the known genomic regions of Sr58/Yr29/Lr46, Sr2/Yr30/Lr27, and Sr57/Yr18/Lr34, respectively (Tables 6–8). Among them, q3BS-1, overlaps the gene Sr2/Yr30/Lr27 region on chromosome 3BS (Table 7), was the largest one, explaining up to 43.7% of the phenotypic variance. This chromosome region had pleiotropic effects on SR, YR, and LR resistances, and the significant resistance alleles were contributed by non-PBW343 parents.
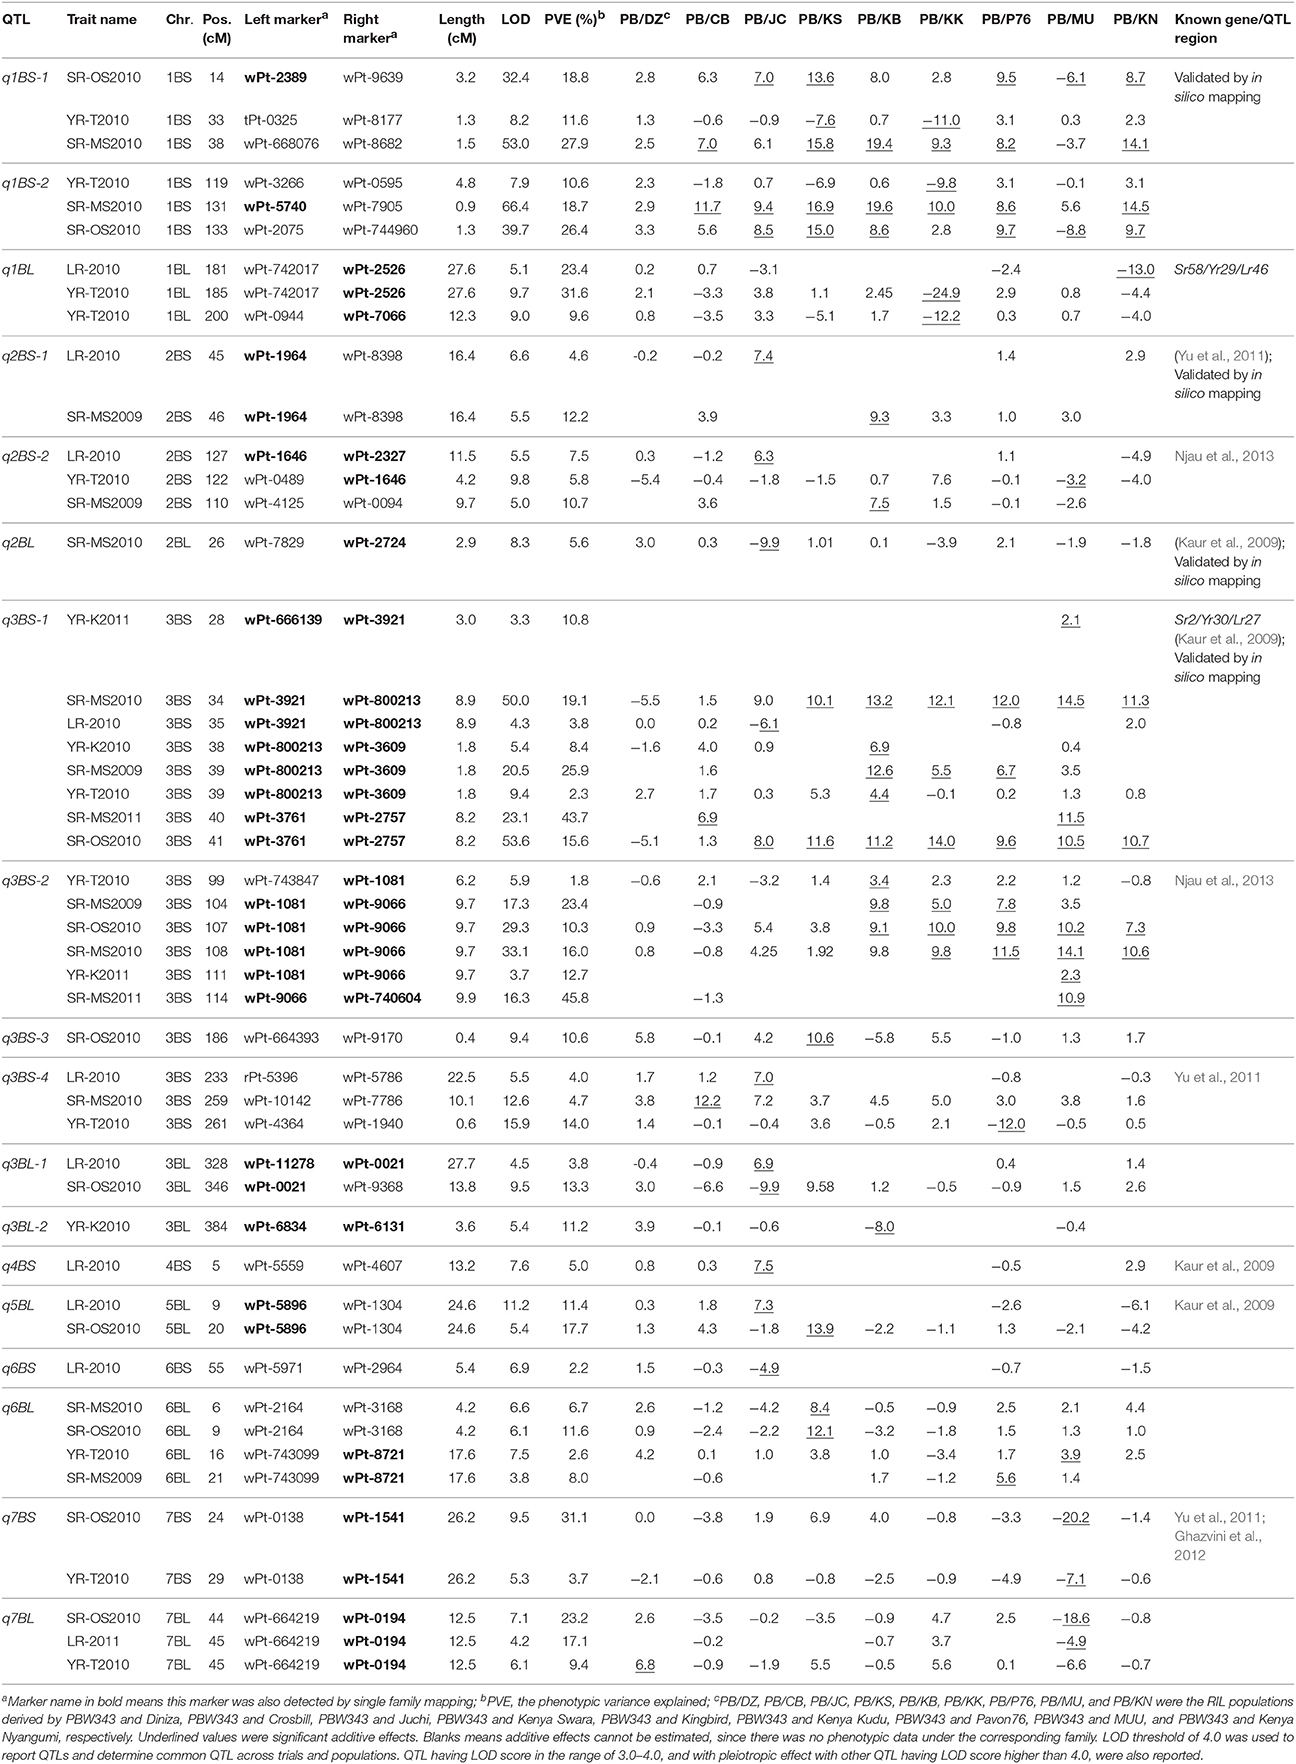
Table 7. Eighteen QTL identified on B genome by joint inclusive composite interval mapping (JICIM) for the CIMMYT NAM population.
Thirteen QTL were in the same regions with QTL published or reviewed before (Rosewarne et al., 2013; Yu et al., 2014). Three of them (i.e., q6AS-2, q2BS-1, and q2BL, marked in orange font in Figure 3) were validated by In silico analysis in this study by blasting the sequences of the QTL flanking markers against to the NCBI database querying wheat (Triticum aestivum L.), Brachypodium (Brachypodium distachyon (L.) P. Beauv), Hordeum vulgare L., and rice (Oryza sativa L.) databases. The marker wPt-730591 can be mapped to SR resistance protein (Rpg1) gene and Triticum turgidum subsp. durum defense precursor (PRPI-10) gene (Supplementary Table 14); and the marker wPt-730591 was 1.79 cM up-stream of the marker wPt-6520, which was the left flanking marker of q6AS-2 (Table 6; Supplementary Table 3). In this sense, q6AS-2 was mapped onto rust resistance gene regions. Its significant resistance alleles were contributed by Kenya Swara (Table 6). The significant resistance alleles of most of the 10 published QTL, marked in green font in Figure 3, were contributed by non-PBW343 parents.
Eighteen QTL are not published yet, which were viewed as novel QTL detected by the CIMMYT NAM population in this study. Three of them (i.e., q1AL, q1BS-1, and q1DS-2 marked in blue in Figure 3) were well confirmed by In silico mapping. q1AL had pleiotropic effects on SR, YR, and LR resistance, and explained 7.7–30.3% of the phenotypic variance. One of the salient features of NAM design is that we could order the resistance alleles by common parent's allele as reference (Buckler et al., 2009). For q1AL, its resistance alleles from strong to weak can be ordered as Muu allele, PBW343 allele and Kenya Swara allele. That is to say, compared with Kenya Swara and Muu at this locus, the resistance alleles came from Muu with size 20.2 (i.e., 10.7 + 9.5 in Table 6), which is consistent with the SR resistance phenotype of Kenya Swara and Muu (Table 2). The resistance alleles controlling YR and LR resistance of q1AL were all contributed by PBW343 in PB/KN. Fifteen out of 18 novel QTL need to be validated further (marked in black font in Figure 3). Seven of them were pleiotropic QTL (i.e., q3AS, q3BS-4, q3BL-1, q6BL, q3DS, and q6DL).
In general, single family linkage analysis has less precision and statistical power than joint linkage analysis for identifying common QTL (Li et al., 2011). In the present study, 21 QTL (61.7%) identified by joint linkage mapping (Tables 6–8) were also identified by single family mapping. The number of significant QTL identified in each family was 7, 8, 14, 23, 7, 30, 9, 17, and 13 for PB/DZ, PB/CB, PB/JC, PB/KS, PB/KB, PB/KK, PB/P76, PB/MU, and PB/KN, respectively (Supplementary Table 15). The highest number of QTL were detected in PB/KK, maybe due to the large genetic distance between PBW343 and Kenya Kudu (Figure 1), and the large phenotypic distance between PBW343 and Kenya Kudu and the large phenotypic variance in their RIL progenies for all three rust resistance traits (Tables 2–4).
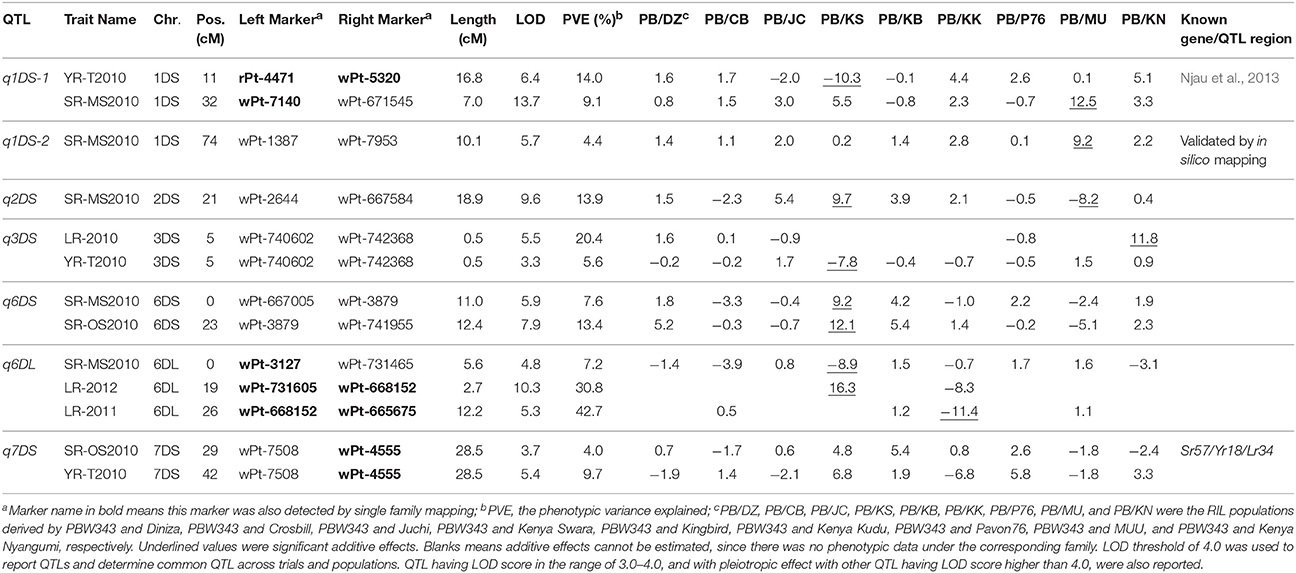
Table 8. Seven QTL identified on D genome by joint inclusive composite interval mapping (JICIM) for the CIMMYT NAM populations.
Regarding effect estimation, joint linkage analysis allowed us to estimate a separate effect at each QTL for all nine families (Tables 6–8; Figure 4). The SR resistance varied by 60% among 10 APR donors, and by 100% among the whole NAM population (Table 2); the YR resistance varied by 40% among 10 donors, and by 100% among the population (Table 3); and the LR resistance varied by 40% among 10 donors, and by 100% among the population (Table 4). All the 10 parents were found to be susceptible to YR and LR at seedling stage showing score of 8 or 9 on a 0–9 scale except Crossbill for YR which scored 6 (intermediate) on the 0–9 scale. Relative to PBW343, the largest SR resistance effect of QTL allele had an additive effect of 20.2% (Figure 4A), while the largest YR and LR resistance effects were 24.9% and 16.3%, respectively (Supplementary Figure 9). A total of 56 alleles out of 362 SR resistance alleles were significant (LOD score > 2.5). The resistance significant alleles for four QTL in chromosome 3BS were all contributed by non-PBW343 parents (Figure 4B). We searched for the presence of epistatic interaction in the CIMMYT NAM population by testing all pairwise marker combinations. No significant epistasis was identified.
Prediction
The significant additive effect estimates of SR resistance QTL were able to predict parental SR by R2 = 0.41 (Figure 5). Considering that the heritability of SR across nine RIL families were in the range of 0.45–0.78 (Table 2), the prediction power was enough to provide further evidence that epistasis is relatively unimportant in this population for SR resistance. The predicted YR and LR resistances of founders from the CIMMYT NAM QTL were low (results not shown), partly because the marker density was low, and the YR and LR resistances diversities of founders for this CIMMYT NAM population was narrow (Tables 3, 4), and then did not have vigor to detect all possible QTL related to the YR and LR resistances and to estimate their effects accurately.
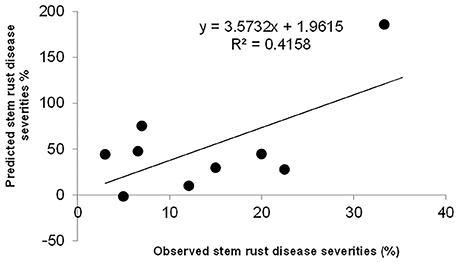
Figure 5. Predicted stem rust resistances of 10 founder lines based on additive QTL model.
Discussion
Extensive Genetic Understandings of the APR Donor Lines
Characterizing diverse APR sources are critical to maximize the genetic variability, to produce the superior recombinant genotypes, and to pyramid the resistances into improved wheat lines. Since last century, Global Wheat Program at CIMMYT has taken efforts for breeding minor, slow-rusting genes based APR, which was the field based selection in conjunction with other traits and the high returns from investments due to long-term effectiveness. During these efforts, the nine historical APR donor lines utilized in this study, were identified to cover a wide range of APR genetic diversity, and used as one of the parents to develop genetic mapping populations in wheat. However, the genetic knowledge of the APR donors was limited to further strategize the rust management in breeding programs. The genetic relationship revealed in this study (Figure 1) showed the highly genetic similarities of three founders lines released in Kenya (i.e., Kenya Swara, Kenya Kudu, and Kenya Nyangumi). Three varieties released in Mexico, 1999 (i.e., Diniza, Juchi, and Kingbird) were more genetically similar with Pavon76, which was released in Mexico, 1976, rather than Muu, which was released at the same year and same place with Diniza, Juchi, and Kingbird (Table 1). Crosbill was genetically far away from the other eight APR donor lines and PBW343. The genetic knowledge of the APR donor lines learnt from this study would aid the identification of genotypes with promising and desirable rust resistances, and agronomic traits for hybridization in wheat breeding.
The pedigree information of the nine donors was clear and available from germplasm curator, but it does not necessarily reflect the underlying genetics (Soleimani et al., 2007). In addition, genetic relatedness calculated by pedigree information does not take into account the effects of selection, mutation and genetic drift, and requires several simplifying assumptions that are generally not met. In contrast, molecular markers allow the assessment of relatedness directly at the DNA level by estimation of the proportion of alleles that are identical by state. In this sense, the extent of the information that they can provide might depend on the nature and number of markers (e.g., level of homoplasy, mutation rate), the genome coverage and distribution, and the population under investigation (Maccaferri et al., 2003). In this study, 272 SSR markers were utilized to investigate the genetic relatedness of nine APR donors, which will be further evaluated by markers explored through genotyping-by-sequencing (Li et al., 2015).
Utilizing the NAM Genetic Design to Facilitate the Gene Identification for Rust Resistance
NAM design had power to reveal QTL which otherwise was undetected in previous studies (Buckler et al., 2009; Bajgain et al., 2016). Maize NAM population has been used extensively for dissection of complex traits (Buckler et al., 2009; Brown et al., 2011; Poland et al., 2011; Tian et al., 2011; Cook et al., 2012). The CIMMYT NAM population reported in this study is the largest publicly available platform for rust resistance dissection in wheat. Most recently, Bajgain et al. (2016) use a spring wheat NAM panel composed of 10 RIL families with 852 lines to conduct joint linkage analysis for SR resistance. Fifty-nine additive QTL, explaining 1–20% of the phenotypic variance were identified, and no epistatic QTL was detected. q2AS-1, q2BL, q3AL, q4BS, and q5BL identified in this study were likely in the same regions of five QTL reported by Bajgain et al. (2016). However, as indicated by Bajgain et al. (2016), due to the de novo marker system and the lack of sequence alignment for the markers they used, it is hard for us to have a position-based definitive comparisons for QTL detected by Bajgain et al. (2016) and by this study. Further, comparisons have been made with previous studies based on linked markers as presented in Tables 6–8 (reference reports presented in the last column). To facilitate this head-to-head comparison and uncover candidate genes, it is necessary to have the functional annotation and high density genomic maps for the published wheat genome. Then, more work could be done for having both traditional marker types (like SSR and DArT) and sequenced-based markers anchored to the physical map.
In this study, the successful demonstration of the power of the CIMMYT NAM population is exemplified not only by correspondence of QTL previously identified in wheat, but also by identification of novel QTL. Chromosomal regions associated with three well characterized APR genes (i.e., Sr58/Yr29/Lr46, Sr2/Yr30/Lr27, and Sr57/Yr18/Lr34) and 13 previously reported QTL were successfully identified (Tables 6–8), and 18 QTL were first detected in this study. Through in silico mapping, we have found that the three novel QTL showed sequence similarities with R like genes in Triticum aestivum, Triticum turgidum subsp. durum, Triticum turgidum ssp. dicoccoides, Brachypodium distachyon, Hordeum vulgare, and Oryza sativa encoding proteins (Tables 6–8). Of all the 34 QTL identified, 14 were identified by high resolution with their marker-interval lengths within 5 cM; and 20 have pleiotropic effects on SR, YR, and LR resistances. Rather than inferring multiple alleles at each testing locus as in multiple-parent design, NAM reduced the testing to exact bi-allelic contrasts across the whole population. All allele effects were estimated by PBW343 allele as a reference. Therefore, phenotypes of the CIMMYT NAM founders could be predicted by the estimated QTL allele effects adding to the observed PBW343 phenotype. The prediction ability for SR resistance QTL was 41.6%, which was close to the heritability in the broad sense of SR resistance (Table 2). This indicated that the additive QTL for SR (Tables 6–8) were reliable and epistatic variance was not significant.
Marker Density and Distribution of the Consensus Map
The consensus map in this study was constructed by 777 DArT markers, which were polymorphic in at least three RIL families. Compared with A and D genomes, B genome revealed the maximum percentage of total and unique number of markers (54.1 and 55.8%, respectively; Table 5), the longest genetic length (1475.0 cM; Table 5), and the maximum number of detected QTL regions (18 out of 34 QTL; Table 7; Figure 3). These results were consistent with previous results (Li et al., 2015) and in accordance with previously reported genetic maps (Sansaloni et al., 2011; Cavanagh et al., 2013; Rosewarne et al., 2013; Li et al., 2014; Wang et al., 2014; Yu et al., 2014). The D genome contained 12.8% of total markers and 7 out of 34 QTL detected, which reinforced that genomic variation in the D genome of bread wheat is consistently low (Singh et al., 2013; Eckard et al., 2014; Wang et al., 2014). The number of linkage groups for the consensus map and each of the nine RIL family was 34, 20, 18, 28, 23, 23, 21, 25, 41, and 30, respectively (Table 5; Supplementary Table 3). These results were not surprising considering the lack of markers in some chromosome regions to cover the wheat genome. This also resulted in a lower phenotypic prediction accuracy of founder lines, particularly for YR and LR resistances.
On the consensus map, there are 162 markers located on chromosome 1B; 157 markers on its short arm (1BS) and 5 markers on its long arm (1BL). It is further noteworthy that all the markers on chromosome 1BS in this study were distributed on the satellite region of chromosome 1BS in wheat, and the polymorphism rates in the satellite region have been reported to be much higher than the average rate for the whole wheat genome (Zhang et al., 2000; Wilkinson et al., 2012). Also, the satellite region on the chromosome 1BS in wheat is known to contain many agronomical important genes (Zhang et al., 2000; Wilkinson et al., 2012). In this study, we found two novel pleiotropic QTL controlling SR and YR resistances on chromosome 1BS, one of which was confirmed to be located in the rust resistance gene region by in silico mapping (Supplementary Table 14).
Controlled Types I and II Errors
Many statistical methods (Zeng, 1994; Xu, 2003; Li et al., 2007) have been proposed to control the Type I (false-positive) and Type II (false-negative) error rates while mapping multiple QTL. The simple algorithm implemented in ICIM (Li et al., 2007) and its extension JICIM (Li et al., 2011) has become the method of choice because of its fast speed, high QTL detection power (i.e., low Type II error), and low false discovery rate (i.e., low Type I error), etc. In ICIM, the largest probability for markers moving into the model (PIN) is the only subjectivity comes into play, and may have a big effect on the QTL mapping results. Here, two ways were utilized to determine the PIN in ICIM and JICIM. One is the extensive permutation tests (Anderson and ter Braak, 2003) to determine PIN (Buckler et al., 2009; Li et al., 2011) and LOD threshold to declare the existence of QTL. The other is QQ-plot, which has been used extensively in (genome-wide) association mapping (Yu et al., 2008; Tian et al., 2011), but has virtually no application in linkage analysis. In this study, we monitored the over-fitting of genetic models and determined the PIN under the help of QQ-plot (Supplementary Figures 3, 4). This offers another vision to better utilize the statistical methods for empirical data in linkage analysis.
Conclusion
PBW343 was a popular, high-yielding modern variety, developed in the 1990s and once grown on millions of hectares in India. However, its resistance has been overcome to various rusts, including Ug99 race group of SR. Diverse sources of APR lines have been identified at CIMMYT and worked toward developing wheat varieties resistant to Ug99 by pyramiding several APR genes using molecular markers (Singh et al., 2015). In this study, we employed the analytic design NAM to unknotted APR in historical diverse parental lines with large scale of phenotyping. Thirty-four genetic loci associated with APR, 20 of them having pleiotropic effects on wheat rusts. We also identified 18 new candidate gene-regions controlling APR with large effects as compared with others. Not only the novel knowledge was gained for APR, but also the new analytical methodology for facilitating the applications of NAM design in crop genetics was suggested. Novel pleiotropic QTL found in this study enrich the genetic resources for addressing potential threat to wheat production and food security. The set of APR regions identified in this study predicted the SR resistance in wheat, will acquire a better genomic understanding of rust resistances, and will envision the future rust management strategy.
Author Contributions
Conceived and designed the experiments: SS and RS. Performed the experiments SS, SB, BB, and JH, Analyzed the data: HL, DS, JB, PV, and SS. Wrote the paper: HL, SS, DS, BB, SB, PV, and RS. All authors read and approved the final version of manuscript.
Funding
Mapping populations' development and phenotyping for wheat rusts were supported by a grant from the Bill & Melinda Gates Foundation and DFID (UK) to Cornell University for the Durable Rust Resistance Wheat (DRRW) Project funded by BMGF [Grant ID# 49767 (PI) and 60169 (PII)]. The genotyping, analysis and preparing the research article were supported by the Seeds of Discovery project funded by the Sustainable Modernization of Traditional Agriculture (MasAgro) project supported by the Government of Mexico. Also, thanks to the Natural Science Foundation of China (No. 31471174) to support one of co-authors. We thank the editor and the reviewers for their valuable suggestions.
Conflict of Interest Statement
The authors declare that the research was conducted in the absence of any commercial or financial relationships that could be construed as a potential conflict of interest.
Supplementary Material
The Supplementary Material for this article can be found online at: http://journal.frontiersin.org/article/10.3389/fpls.2016.01674/full#supplementary-material
References
Anderson, M. J., and ter Braak, C. J. F. (2003). Permutation tests for multi-factorial analysis of variance. J. Stat. Comput. Sim. 73, 85–113. doi: 10.1080/00949650215733
Bajgain, P., Rouse, M. N., Tsilo, T. J., Macharia, G. K., Bhavani, S., Jin, Y., et al. (2016). Nested association mapping of stem rust resistance in wheat using genotyping by sequencing. PLoS ONE 11:e0155760. doi: 10.1371/journal.pone.0155760
Basnet, B. R., Singh, R. P., Ibrahim, A. M. H., Herrera-Foessel, S. A., Huerta-Espino, J., Lan, C. X., et al. (2014). Characterization of Yr54 and other genes associated with adult plant resistance to yellow rust and leaf rust in common wheat Quaiu 3. Mol. Breed. 33, 385–399. doi: 10.1007/s11032-013-9957-2
Beddow, J. M., Pardey, P. G., Chai, Y., Hurley, T. M., Kriticos, D. J., Braun, H.-J., et al. (2015). Research investment implications of shifts in the global geography of wheat stripe rust. Nat. Plants 1:15132. doi: 10.1038/nplants.2015.132
Brown, P. J., Upadyayula, N., Mahone, G. S., Tian, F., Bradbury, P. J., Myles, S., et al. (2011). Distinct genetic architectures for male and female inflorescence traits of maize. PLoS Genet. 7:e1002383. doi: 10.1371/journal.pgen.1002383
Buckler, S. E., Holland, J. B., Bradbury, P. J., Acharya, C. B., Brown, P. J., Browne, C., et al. (2009). The genetic architecture of maize flowering time. Science 325, 714–718. doi: 10.1126/science.1174276
Cavanagh, C. R., Chao, S., Wang, S., Huang, B. E., Stephen, S., Kiani, S., et al. (2013). Genome-wide comparative diversity uncovers multiple targets of selection for improvement in hexaploid wheat landraces and cultivars. Proc. Natl. Acad. Sci. U.S.A. 110, 8057–8062. doi: 10.1073/pnas.1217133110
Cook, J. P., McMullen, M. D., Holland, J. B., Tian, F., Bradbury, P., Ross-Ibarra, J., et al. (2012). Genetic architecture of maize kernel composition in the nested association mapping and inbred association panels. Plant Physiol. 158, 824–834. doi: 10.1104/pp.111.185033
Crossa, J., Burgueño, J., Dreisigacker, S., Vargas, M., Herrera-Foessel, S. A., Lillemo, M., et al. (2007). Association analysis of historical bread wheat germplasm using additive genetic covariance of relatives and population structure. Genetics 177, 1889–1913. doi: 10.1534/genetics.107.078659
Day, W. H., and Edelsbrunner, H. (1984). Efficient algorithms for agglomerative hierarchical clustering methods. J. Classif. 1, 7–24. doi: 10.1007/BF01890115
Eckard, J. T., Gonzalez-Hernandez, J. L., Chao, S., St Amand, P., and Bai, G. (2014). Construction of dense linkage maps “on the fly” using early generation wheat breeding populations. Mol. Breeding 34, 1281–1300. doi: 10.1007/s11032-014-0116-1
Falk, C. T., and Chakravarti, A. (1992). Preliminary ordering of multiple linked loci using pairwise linkage data. Genet. Epidemiol. 9, 367–375. doi: 10.1002/gepi.1370090507
Ghazvini, H., Hiebert, C. W., Zegeye, T., Liu, S., Dilawari, M., Tsilo, T., et al. (2012). Inheritance of resistance to Ug99 stem rust in wheat cultivar Norin 40 and genetic mapping of Sr42. Theor. Appl. Genet. 125, 817–824. doi: 10.1007/s00122-012-1874-y
Holland, J. B., Nyquist, W. E., and Cervantes-Martínez, C. T. (2003). Estimating and interpreting heritability for plant breeding: an update. Plant Breed. Rev. 22, 9–112. doi: 10.1002/9780470650202.ch2
ICARDA (2011). “Research to action-strategies to reduce the emerging wheat stripe rust disease,” in International Wheat Stripe Rust Symposium (Aleppo: ICARDA). ISBN: 92-9127-237-X. Available online at: www.icarda.org/wheatrust
Jin, Y., Szabo, L. J., Rouse, M. N., Fetch, T. Jr., Pretorius, Z. A., Wanyera, R., et al. (2009). Detection of virulence to resistance gene Sr36 within the TTKS race lineage of Puccinia graminis f. sp. tritici. Plant Dis. 93, 367–370. doi: 10.1094/PDIS-93-4-0367
Kaur, J., Bansal, U., Khanna, R., Saini, R. G., and Bariana, H. (2009). Molecular mapping of stem rust resistance in HD2009/WL711 recombinant inbred line population. Int. J. Plant. Breed. 3, 28–33.
Khan, M. H., Bukhari, A., Dar, Z. A., and Rizvi, S. M. (2013). Status and strategies in breeding for rust resistance in wheat. Agric. Sci. 4, 292. doi: 10.4236/as.2013.46042
Knott, D. R. (1982). Multigenic inheritance of stem rust resistance in wheat. Crop Sci. 22, 393–399. doi: 10.2135/cropsci1982.0011183X002200020045x
Li, H., Bradbury, P., Ersoz, E., Buckler, E. S., and Wang, J. (2011). Joint QTL linkage mapping for multiple-cross mating design sharing one common parent. PLoS ONE 6:e17573. doi: 10.1371/journal.pone.0017573
Li, H., Ribaut, J. M., Li, Z., and Wang, J. (2008). Inclusive composite interval mapping (ICIM) for digenic epistasis of quantitative traits in biparental populations. Theor. Appl. Genet. 116, 243–260. doi: 10.1007/s00122-007-0663-5
Li, H., Vikram, P., Singh, R. P., Kilian, A., Carling, J., Song, J., et al. (2015). A high density GBS map of bread wheat and its application for dissecting complex disease resistance traits. BMC Genomics 16:216. doi: 10.1186/s12864-015-1424-5
Li, H., Ye, G., and Wang, J. (2007). A modified algorithm for the improvement of composite interval mapping. Genetics 175, 361–374. doi: 10.1534/genetics.106.066811
Li, Z., Lan, C., He, Z., Singh, R. P., Rosewarne, G. M., Chen, X., et al. (2014). Overview and application of QTL for adult plant resistance to leaf rust and powdery mildew in wheat. Crop Sci. 54, 1907–1925. doi: 10.2135/cropsci2014.02.0162
Maccaferri, M., Sanguineti, M. C., Donini, P., and Tuberosa, R. (2003). Microsatellite analysis reveals a progressive widening of the genetic basis in the elite durum wheat germplasm. Theor. Appl. Genet. 107, 783–797. doi: 10.1007/s00122-003-1319-8
McMullen, M. M., Kresovich, S., Villeda, H. S., Bradbury, P., Li, H., Sun, Q., et al. (2009). Genetic properties of the maize nested association mapping population. Science 325, 737–740. doi: 10.1126/science.1174320
Milne, I., Shaw, P., Stephen, G., Bayer, M., Cardle, L., Thomas, W. T. B., et al. (2010). Flapjack—graphical genotype visualization. Bioinformatics 26, 3133–3134. doi: 10.1093/bioinformatics/btq580
Moore, J. W., Herrera-Foessel, S., Lan, C., Schnippenkoetter, W., Ayliffe, M., Huerta-Espino, J., et al. (2015). A recently evolved hexose transporter variant confers resistance to multiple pathogens in wheat. Nat. Genet. 47, 1494–1498. doi: 10.1038/ng.3439
Muyldermans, L., Beullens, P., Cattrysse, D., and Van Oudheusden, D. (2005). Exploring variants of 2-opt and 3-opt for the general routing problem. Oper. Res. 53, 982–995. doi: 10.1287/opre.1040.0205
Nazari, K., Mafi, M., Yahyaoui, A., Singh, R. P., and Park, R. F. (2009). Detection of wheat stem rust (Puccinia graminis f. sp. tritici) race TTKSK (Ug99) in Iran. Plant Dis. 93, 317–317. doi: 10.1094/PDIS-93-3-0317B
Neumann, K., Kobiljski, B., Denčić, S., Varshney, R. K., and Börner, A. (2011). Genome-wide association mapping: a case study in bread wheat (Triticum aestivum L.). Mol. Breeding 27, 37–58. doi: 10.1007/s11032-010-9411-7
Njau, P. N., Bhavani, S., Huerta-Espino, J., Keller, B., and Singh, R. P. (2013). Identification of QTL associated with durable adult plant resistance to stem rust race Ug99 in wheat cultivar ‘Pavon 76’. Euphytica 190, 33–44. doi: 10.1007/s10681-012-0763-4
Parlevliet, J. E. (2002). Durability of resistance against fungal, bacterial and viral pathogens; present situation. Euphytica 124, 147–156. doi: 10.1023/A:1015601731446
Peterson, R. F., Campbell, A. B., and Hannah, A. E. (1948). A diagrammatic scale for estimating rust intensity on leaves and stems of cereals. Can. J. Res. 26, 496–500. doi: 10.1139/cjr48c-033
Poland, J. A., Bradbury, P. J., Buckler, E. S., and Nelson, R. J. (2011). Genome-wide nested association mapping of quantitative resistance to northern leaf blight in maize. Proc. Natl. Acad. Sci. U.S.A. 108, 6893–6898. doi: 10.1073/pnas.1010894108
Pretorius, Z. A., Bender, C. M., Visser, B., and Terefe, T. (2010). First report of a Puccinia graminis f. sp. tritici race virulent to the Sr24 and Sr31 wheat stem rust resistance genes in South Africa. Plant Dis. 94, 784–784. doi: 10.1094/PDIS-94-6-0784C
Pretorius, Z. A., Singh, R. P., Wagoire, W. W., and Payne, T. S. (2000). Detection of virulence to wheat stem rust resistance gene Sr31 in Puccinia graminis f. sp. tritici in Uganda. Plant Dis. 84:203. doi: 10.1094/PDIS.2000.84.2.203B
Rajaram, S. R., and Braun, H. J. (2008). “Wheat yield potential,” in International Symposium on Wheat Yield Potential: Challenges to International Wheat Breeding. D.F, eds M. P. Reynolds, J. Pietragalla, and H. J. Braun (Mexico: CIMMYT), 103–107.
Rosewarne, G. M., Herrera-Foessel, S. A., Singh, R. P., Huerta-Espino, J., Lan, C. X., and He, Z. (2013). Quantitative trait loci of stripe rust resistance in wheat. Theor. Appl. Genet. 126, 2427–2449. doi: 10.1007/s00122-013-2159-9
Sansaloni, C., Petroli, C., Jaccoud, D., Carling, J., Detering, F., Grattapaglia, D., et al. (2011). Diversity arrays technology (DArT) and next-generation sequencing combined: genome-wide, high-throughput, highly informative genotyping for molecular breeding of eucalyptus. BMC Proc. 5(Suppl. 7):54. doi: 10.1186/1753-6561-5-s7-p54
Singh, R. P., Hodson, D. P., Jin, Y., Lagudah, E. S., Ayliffe, M. A., Bhavani, S., et al. (2015). Emergence and spread of new races of wheat stem rust fungus: continued threat to food security and prospects of genetic control. Phytopathology 105, 872–884. doi: 10.1094/PHYTO-01-15-0030-FI
Singh, S., and Bowden, R. L. (2011). Molecular mapping of adult-plant race-specific leaf rust resistance gene Lr12 in bread wheat. Mol Breeding 28, 137–142. doi: 10.1007/s11032-010-9467-4
Singh, S., Singh, R. P., Bhavani, S., Huerta-Espino, J., and Eugenio, L. E. (2013). QTL mapping of slow-rusting, adult plant resistance to race Ug99 of stem rust fungus in PBW343 × Muu RIL population. Theor. Appl. Genet. 126, 1367–1375. doi: 10.1007/s00122-013-2058-0
Soleimani, V. D., Baum, B. R., and Johnson, D. A. (2007). Analysis of genetic diversity in barley cultivars reveals incongruence between S-SAP, SNP and pedigree data. Genet. Resour. Crop Evol. 54, 83–97. doi: 10.1007/s10722-005-1886-4
Stam, P. (1993). Construction of integrated genetic linkage maps by means of a new computer package: join Map. Plant J. 3, 739–744. doi: 10.1111/j.1365-313X.1993.00739.x
Tian, F., Bradbury, P. J., Brown, P. J., Hung, H., Sun, Q., Flint-Garcia, S., et al. (2011). Genome-wide association study of leaf architecture in the maize nested association mapping population. Nat. Genet. 43, 159–162. doi: 10.1038/ng.746
Tilman, D., Balzer, C., Hill, J., and Befort, B. L. (2011). Global food demand and the sustainable intensification of agriculture. Proc. Natl. Acad. Sci. U.S.A. 108, 20260–20264. doi: 10.1073/pnas.1116437108
Wang, S. C., Wong, D., Forrest, K., Allen, A., Chao, S., Huang, B. E., et al. (2014). Characterization of polyploid wheat genomic diversity using a high-density 90000 single nucleotide polymorphism array. Plant Biotechnol. J. 12, 787–796. doi: 10.1111/pbi.12183
Wilkinson, P. A., Winfield, M. O., Barker, G. L. A., Allen, A. M., Burridge, A., Coghill, J. A., et al. (2012). CerealsDB 2.0: an integrated resource for plant breeders and scientists. BMC Bioinformatics 13:219. doi: 10.1186/1471-2105-13-219
Xu, S. (2003). Estimating polygenic effects using markers of the entire genome. Genetics 163, 789–801.
Yu, J., Holland, J. B., McMullen, M. D., and Buckler, E. S. (2008). Genetic design and statistical power of nested association mapping in maize. Genetics 178, 539–551. doi: 10.1534/genetics.107.074245
Yu, L., Barbier, H., Rouse, M. N., Singh, S., Singh, R. P., Bhavani, S., et al. (2014). A consensus map for Ug99 stem rust resistance loci in wheat. Theor. Appl. Genet. 127, 1561–1581. doi: 10.1007/s00122-014-2326-7
Yu, L. X., Lorenz, A., Rutkoski, J., Singh, R. P., Bhavani, S., Huerta-Espino, J., et al. (2011). Association mapping and gene-gene interaction for stem rust resistance in spring wheat germplasm. Theor. Appl. Genet. 123, 1257–1268. doi: 10.1007/s00122-011-1664-y
Keywords: wheat, rust resistance, nested association mapping (NAM), genetic similarity, joint linkage analysis, quantitative traits loci (QTL)
Citation: Li H, Singh S, Bhavani S, Singh RP, Sehgal D, Basnet BR, Vikram P, Burgueno-Ferreira J and Huerta-Espino J (2016) Identification of Genomic Associations for Adult Plant Resistance in the Background of Popular South Asian Wheat Cultivar, PBW343. Front. Plant Sci. 7:1674. doi: 10.3389/fpls.2016.01674
Received: 22 August 2016; Accepted: 24 October 2016;
Published: 08 November 2016.
Edited by:
Swarup Kumar Parida, National Institute of Plant Genome Research, IndiaReviewed by:
Sambasivam Periyannan, Commonwealth Scientific and Industrial Research Organisation, AustraliaShichen Wang, Texas A&M University, USA
Copyright © 2016 Li, Singh, Bhavani, Singh, Sehgal, Basnet, Vikram, Burgueno-Ferreira and Huerta-Espino. This is an open-access article distributed under the terms of the Creative Commons Attribution License (CC BY). The use, distribution or reproduction in other forums is permitted, provided the original author(s) or licensor are credited and that the original publication in this journal is cited, in accordance with accepted academic practice. No use, distribution or reproduction is permitted which does not comply with these terms.
*Correspondence: Sukhwinder Singh, suk.singh@cgiar.org