 Karla Vilaça Martins1
 Durval Dourado-Neto1*
 Klaus Reichardt2
 Quirijn de Jong van Lier2
 José Laércio Favarin1
 Felipe Fadel Sartori1
 Guilherme Felisberto1
 Simone da Costa Mello1
- 1Crop Science Department, Escola Superior de Agricultura “Luiz de Queiroz” (ESALQ), Universidade de São Paulo, Piracicaba, Brazil
- 2Center for Nuclear Energy in Agriculture, University of São Paulo, Piracicaba, Brazil
The improvement of agronomic practices and the use of high technology in field crops contributes for significant increases in maize productivity, and may have altered the dynamics of nutrient uptake and partition by the plant. Official recommendations for fertilizer applications to the maize crop in Brazil and in many countries are based on critical soil nutrient contents and are relatively outdated. Since the factors that interact in an agricultural production system are dynamic, mathematical modeling of the growth process turns out to be an appropriate tool for these studies. Agricultural modeling can expand our knowledge about the interactions prevailing in the soil-plant-atmosphere system. The objective of this study is to propose a methodology for characterizing the micronutrient composition of different organs and their extraction, and export during maize crop development, based on modeling nutrient uptake, crop potential evapotranspiration and micronutrient partitioning in the plant, considering the production environment. This preliminary characterization study (experimental growth analysis) considers the temporal variation of the micronutrient uptake rate in the aboveground organs, which defines crop needs and the critical nutrient content of the soil solution. The methodology allowed verifying that, initially, the highest fraction of dry matter, among aboveground organs, was assigned to the leaves. After the R1 growth stage, the largest part of dry matter was partitioned to the stalk, which in this growth stage is the main storage organ of the maize plant. During the reproductive phase, the highest fraction of dry matter was conferred to the reproductive organs, due to the high demand for carbohydrates for grain filling. The micronutrient (B, Cu, Fe, Mn, and Zn) content follows a power model, with higher values for the initial growth stages of development and leveling off to minimum values at the R6 growth stage. The proposed model allows to verify that fertilizer recommendations should be related to the temporal variability of micronutrient absorption rates, in contrast to the classic recommendation based on the critical soil micronutrient content. The maximum micronutrient absorption rates occur between the reproductive R4 and R5 growth stages. These evaluations allowed to predict the maximum micronutrient requirements, considered equal to respective stalk sap concentrations.
Introduction
Maize (Zea mays L.) is the most cultivated cereal worldwide, mainly because of the different ways of consumption, as human food and animal feed, as well as many byproducts for the high technology industry (Edwards, 2009). Brazil is the world's third largest maize producer, behind the United States and China. In Brazil, maize is general grown in two cropping seasons, and covered an area of 15,627,300 ha in the 2014/2015 season. The national average yield triplicated from 1,632 kg ha−1 to 5,382 kg ha−1 over the last 40 years (CONAB, 2015). Such increases in productivity are due to the development of agriculture in relation to the breeding of plants and management practices, including the correction and fertilization of soils (Bender et al., 2013; Ciampitti et al., 2013). However, the application of micronutrients also played an important role, although the information on their absorption and partition by the maize plant rely on older literature as stated by Ciampitti et al. (2013). The most recent studies on the subject have been carried out mainly in the United States. Few studies were performed on the absorption and nutrient partitioning in modern maize hybrids used in Brazil (Von Pinho et al., 2009). The Brazilian lime and fertilizer recommendations are mainly based on 15–20-year-old studies such as van Raij et al. (1996), Ribeiro et al. (1999), Oliveira (2003), SBCS (2004) and Cantarutti et al. (2007).
In addition, agricultural production systems have also changed, with higher plant densities, reduced seed spacing, use of agrochemicals for crop protection and use of transgenic hybrids (Bender et al., 2013).
The use of increasingly growing high-tech crops may have changed the dynamics of absorption and partition of nutrients by the maize crop. Therefore, studies on the current absorption patterns and partition of micronutrients are welcome to update official fertilizer recommendations, which are still based on soil chemical analyses. This is essentially a static approach, whereas processes during crop development are dynamic. For example, using only soil chemical analyses does not allow to consider variations of the critical micronutrient content among phenological growth stages, expected productivity and soil and climatic interactions.
The proposed model will be useful for the improvement of the traditional fertilizer methodology based on soil analysis, giving emphasis to the plant as a nutrient extractor. The model considers that the fertilizer recommendation should be based on the temporal variability of the nutrient absorption rate, in comparison to the classic recommendation based on the critical soil nutrient content.
This study is based on the following hypotheses: (i) the maximum micronutrient concentration in the sap depends on productivity and transpiration, (ii) the micronutrient content in the different organs is characterized by a power function and does not depend on productivity, and (iii) the nutrient with concentration in the sap equal to the required critical concentration of the crop, limits productivity (Liebig Law).
This preliminary study aims to propose a methodology for characterizing the composition of different organs and extraction, distribution and export of the micronutrients boron (B), copper (Cu), iron (Fe), manganese (Mn), and zinc (Zn) during maize plant development. Based on modeling micronutrient uptake, crop potential evapotranspiration and micronutrient partition in the plant, taking into account the micronutrient uptake rate in a given production system, it contributes to an improvement in the recommendation of these micronutrients.
Materials and Methods
Environmental Conditions
A field experiment with maize was carried out in Piracicaba, state of São Paulo, Brazil (22° 41′ S; 47° 38′ W, 546 m above sea level) to characterize the temporal variation of above ground dry matter accumulation and micronutrient contents from sowing until physiologic maturity.
The climate is of the Köppen Cwa type (Alvares et al., 2013), with a rainy summer and dry winter, annual average air temperature 21.4°C and yearly rainfall 1,257 mm. The reference evapotranspiration (ETo, mm d−1) was calculated by the Penman-Monteith method (Allen et al., 1998), and the water balance was established according to Thornthwaite and Mather (1955).
The soil was classified as a typical Hapludox as defined by the USDA Soil Taxonomy (Soil Survey Staff, 1975). The micronutrients B (determined in hot-water-soluble method developed by Berger and Truog, 1940), Cu, Fe, Mn and Zn (determined in DTPA pH 7.3 method developed by Lindsay and Norvell, 1978) concentrations in the soil were, respectively, 0.32, 4.0, 15.0, 16.8, and 2.5 mg dm−3.
Cropping System Characterization
Maize was sown on 26 March 2013, using a population of 65,000 plants ha−1 (spacing between rows of 0.45 m). The maize simple hybrid DKB 390 VT PRO™ 2 was chosen due to its favorable features, specifically: (i) high potential productivity, (ii) YieldGard technology (tolerance to Spodoptera frugiperda, Helicoverpa zea, and Diatraea saccharalis) and (iii) RR technology (tolerance to the glyphosate herbicide).
For dry matter composition characterization, a homogeneous single plot of 5,000 m2 was sown and managed in the same way applying nitrogen (30 kg ha−1 of N), phosphorus (80 kg ha−1 of P2O5) and potassium (40 kg ha−1 of K2O). An additional of 90 kg ha−1 of N was applied at the V4 phenological stage.
The seed treatment consisted of insecticide and fungicide applications (Fipronil, Pyraclostrobin and Thiophanate-methyl at a rate of 200 mL per 100 kg of seeds).
Sampling Description
The plot was subdivided into 315 parcels used for sampling of the above ground plant parts. Each parcel of 12.6 m2 consisted of four maize lines 7 m long, the central ones used for plant sampling. With this large number of parcels, it was possible to randomly sample only two plants per parcel during the complete cycle of the crop.
Samplings consisted of plant collection at times according to the growth stages defined by Ritchie et al. (1996), as follows: V2, V4, V6, V8, and V10, which occurred at 14, 21, 28, 35, and 42 days after seeding (t, d), respectively (Table 1). Sixty plants were collected at each sampling date, two per plot, one of each central line, using 30 parcels chosen randomly over the whole plot. The 60 sampled plants were subdivided, also randomly, into six replicates (composed samples) of 10 plants each for dry matter and chemical analyses.
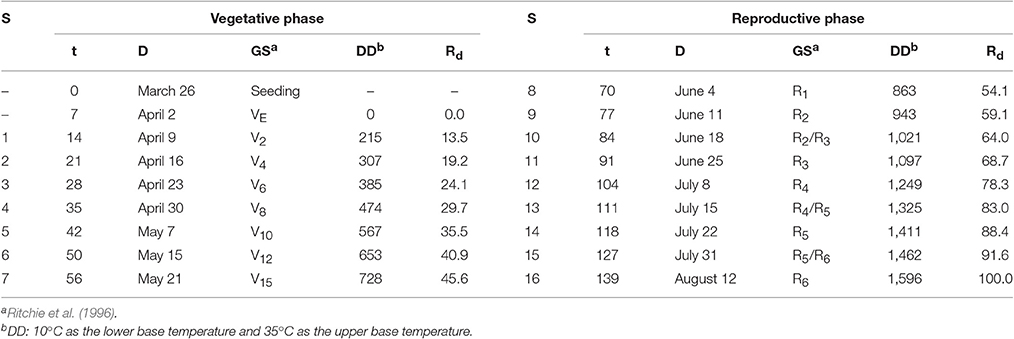
Table 1. Description of sampling (S) date (D), growth stages (GS), accumulated degree-days (DD, oCd) and relative development (Rd, %) based on DD of the maize crop (hybrid DKB 390 VT PRO 2), during vegetative and reproductive phases, as a function of time (t, d), from March 26 to August 12, 2013.
At V12, V15, R1, R2, R2, R3, R4, R4, R5, R5, and R6, which occurred at 50, 56, 70, 77, 84, 91, 104, 111, 118, 127, and 139 days, respectively (Table 1), the number of harvested plants was reduced to 30 plants per sampling. Therefore, the resulting composed samples consisted of five plants.
In this way, during the experimental period, 630 plants were sampled, corresponding to 1.93% of all plants. To determine the crop development growth stage, phenological characterization was performed every 2 days during the crop cycle, according to Ritchie et al. (1996).
Plant organ samples were dried at 65°C to characterize leaf, stalk, tassel, ear, straw, style-stigma and total dry matter. Subsamples were used for micronutrient analyses.
The leaf area was evaluated with a LI-COR® sensor (model Li-3100C, Lincoln, Nebraska, USA) allowing leaf area index (LAI, m2 m−2) estimation during crop development. LAI was determined in all growth stages, with six replicates, using the same leaves for dry matter and chemical analyses.
Harvest was performed at physiologic maturity (R6 growth stage), collecting all plants of the central two lines of 7 m, discarding 0.5 m at each border. Grain yield was estimated from the weight of 1,000 seeds at 13% water content.
Basic Hypothesis of the Micronutrient Absorption Model
Considering that at a given time t (d) within the crop cycle, plants have accumulated a mass of dry matter per area D (kg ha−1), with a nutrient content N (mg kg−1), the cumulative nutrient absorption A (kg ha−1) is given by the product of D and N.
Using observed data for parameterization, D (sigmoid function) and N (power function) were modeled as a function of time (t) using the following empirical equations:
in which k1 (kg ha−1), k2 (kg ha−1), k3 (d), k4 (d), k5 (mg kg−1 d −k6) and k6 are empirical fitting parameters calibrated from experimental data of D and N by minimizing the sum of square errors.
The development of the general model is based on the growth curve of the maize plant given by the accumulation of the total dry matter, the sigmoidal Equation (1). For the temporal changes of the micronutrient content in the plant, the power function 2 was chosen.
Based on the dry matter production curve D and micronutrient content N of the above ground plant, a model was proposed to characterize the nutrient absorption A:
The shape of the sigmoidal curve represents a positive increase in dry matter accumulation with increasing rates in the vegetative growth stages and with decreasing rates in the reproductive growth stages.
Application of the Proposed Model
To calibrate the absorption rate curve (λ, mg ha−1 d−1) (Figure 1) for each of the micronutrients, the following equation was used:
Starting from the first derivative of the absorption rate of a micronutrient λ (or the second derivative of the absorption march – A, Equation 3):
The maximum micronutrient absorption rate (λmax) can be determined according to f(t) = 0. It is assumed to be related to the critical micronutrient content in the soil solution. The maximum absorption rate λmax (maximum maize crop demand at t = tmax = ti+1) can be found at time t, in the iteration “i+1” (Figure 1), minimizing the sum of square errors, corresponding to d2A/dt2 = 0 using the iterative Newton-Raphson method:
where C1 [C1 = k1k5k6(k6 − 1)], C2 [], T1 [T1 = t − k3] and T2 [] are auxiliary variables.
If |f(ti+1)| < ε then tmax = ti+1, where ε is the maximum allowed error (10−7). The maximum absorption rate λmax corresponds to the soil supplying capacity (λs, mg ha−1 d−1) that meets the micronutrient demand during the entire crop cycle (Figure 1), so that:
To estimate the maximum concentration Cc of a micronutrient in the maize stalk sap at time t (t = ti+1) of λmax (when λ = λs), first the water flow rate absorbed by the roots is taken equal to the sum of the actual transpiration (Ta, mm d−1) and the absorbed water needed for daily plant growth (α, mm d−1).
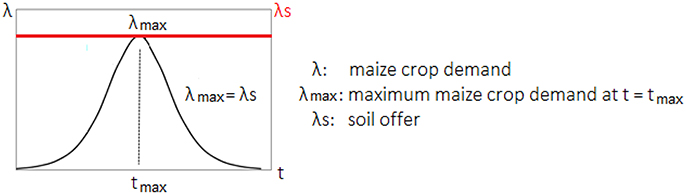
Figure 1. Micronutrient absorption rate (λ, mgha−1d−1) as a function of time (t, d), for the determination of the maximum absorption rate (λmax, mgha−1d−1) corresponding to the rate of the soil supplying capacity (λs, mgha−1d−1), considered sufficient during the crop cycle for a given productivity.
Since micronutrient flux, here considered as λmax for each micronutrient, is the product of the water flux and the maximum sap concentration (Cc, mg L−1), we have:
where α is the daily absorbed water by the plant to form dry matter and the daily water retained by the plant (kg m−2 d−1). The maximum sap concentration (Cc*) can also be expressed in mmol L−1 dividing the term λmax/[104(Ta+α)] by M, where M is the molecular mass (g mol−1) of the considered micronutrient (B, Cu, Fe, Mn, and Zn).
Statistical Analyses
All statistical analyses (regressions, model fitting) in this study were performed using the software Table Curve 2D, version 5.01 (Systat Software, 2000).
Results
Field Experiment
From March 26 to August 12, 2013, total precipitation was 409.6 mm (Figure 2). From seeding until the growth stage V4, there was no significant drought and from V4 to V15 growth stages (20–56 days) a drought period occurred. The grain productivity of the maize crop was 10,335 kg ha−1 (13% of seed water content).
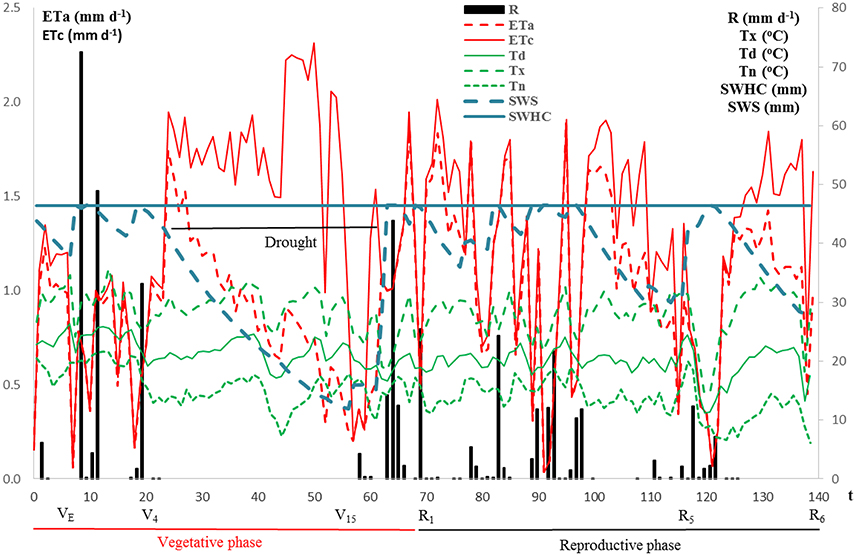
Figure 2. Minimum (Tn), average (Td) and maximum (Tx) air temperatures (°C), rainfall (R, mm d−1), potential (ETc, mm d−1), and actual (ETa, mm d−1) evapotranspiration, soil water holding capacity (SWHC, mm), and soil water storage (SWS, mm) as a function of time (t, d), from March 26 to August 12, 2013 (Time zero corresponds to sowing).
Climatic Conditions and Soil Water Storage
During the crop cycle, minimum (Tn), average (Td), and maximum (Tx) air temperatures oscillated, respectively, between 6.1 and 21.7°C (mean value: 14.6°C), 11.2 and 26.3°C (mean value: 20.7°C) and 14.6 and 35.7°C (mean value: 28.4°C). The actual evapotranspiration (ETa) varied between 0.1 and 1.9 mm d−1 most of the time (mean value: 0.96 mm d−1) (Figure 2).
During the dry spell, soil water storage reduced from 46.4 mm (soil water holding capacity—SWHC) to about 12.0 mm (Figure 2). From visual field observations, it was concluded that the crop water stress was not severe. Between 57 and 121 days, water supply by rain allowed a normal development of the crop (V15 to R5 growth stage, Figure 2). After 121 days, there was no more rain until maturity (R6 growth stage) and the harvest could be performed under excellent conditions.
Leaf Area Index and Dry Matter Accumulation
Positive increments of dry matter were observed from the onset of growth and development until the end of the vegetative phase (R1 growth stage) (Table 1), when the total dry matter reached 7.3·103 kg ha−1 (Table 2).
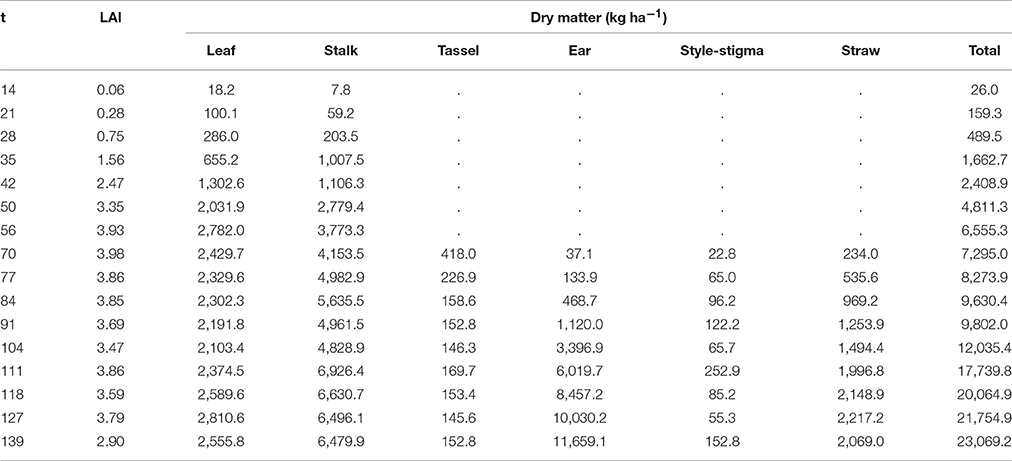
Table 2. Average values of leaf area index (LAI, m2m−2) and dry matter (kgha−1) of leaf, stalk, tassel, ear, style-stigma, straw and total of the maize crop (hybrid DKB 390 VT PRO 2) as a function of time (t, d).
In relation to leaf area index (LAI, m2 m−2), at the start of the crop cycle (day 14, V2 growth stage), its value was 0.06 m2 m−2 and at 70 days (R1 growth stage), it expanded to 3.98 m2 m−2. After this, at flowering, the leaf area index continued practically constant until 127 days (R5/R6 growth stage), with a significant drop at 139 days (R6 growth stage) presenting 2.90 m2 m−2 (Table 2).
Total dry matter D increased until the physiologic maturity (R6 growth stage), at 139 days with 23,069 kg ha−1 (354.9 g plant−1) for a population of 65,000 plants ha−1 (Table 2). The fit of total dry matter accumulation to the growth model resulted in an R2 of 0.97.
The Pearson correlation coefficient value (0.985) was larger than the critical value, at 10% of significance level, for the dry matter sigmoid model of the maize crop (hybrid DKB 390 VT PRO 2) as a function of time (t, d). The empirical parameters are k1 = −5,776.147 kg ha−1, k2 = 30,474.954 kg ha−1, k3 = 151,749 days and k4 = 68.397 days.
Micronutrient Content
Observed micronutrient contents (B, Cu, Fe, Mn, and Zn) in leaf and stalk were initially high, decreasing to a stable value near the end of the cycle (Figure 3A). In most cases, nutrient contents in the leaf were higher than in the stalk, except for Mn, which showed a higher concentration in the stalk until day 112 (between R4/R5 and R5 growth stages). The concentration of Zn was slightly lower in leaves at the very early stages, but from 60 days (between V15 and R1 growth stages), its concentration in leaf and stalk decreased continuously.
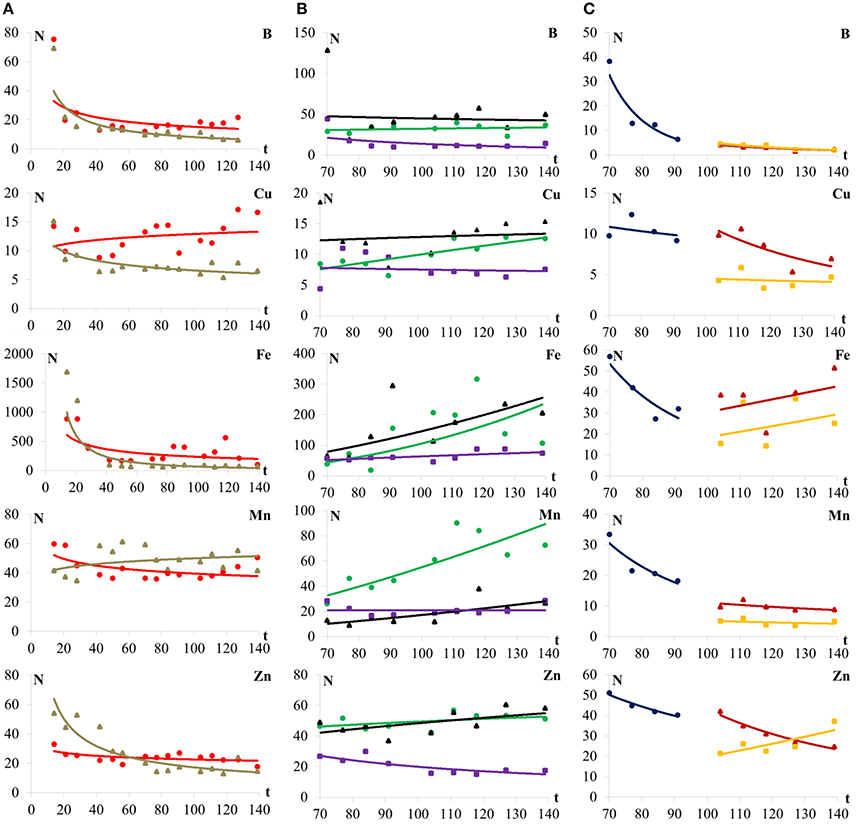
Figure 3. B, Cu, Fe, Mn, and Zn contents (N, mgkg−1) in (A) leaf ( ), stalk (
 ), (B) tassel (
 ), style-stigma (
 ), straw (
 ), (C) ear (
 ), cob (
 ), and grain (
 ) of maize plants (hybrid DKB390VTPRO2) as a function of time (t, d).
In the stalk, Mn contents practically did not vary over time. Iron was the micronutrient with highest contents in the leaf and in the stalk, being higher in leaf.
For the tassel and style-stigma, in general, all micronutrients presented a concentration increase over time, except B in the style-stigma. In the straw, B, Cu, and Zn concentrations decreased over time, and Fe and Mn increased over time (Figure 3B).
The Mn content in straw was constant. Concentrations of Cu, Fe, Mn, and Zn in the tassel were higher during the final growth stages of the crop. B followed by Cu are the nutrients that present highest contents in the style-stigma. Furthermore, when comparing the three organs, one can observe greater contents of B and Cu in the style-stigma and of Fe and Mn in the tassel (Figure 3B).
In relation to the tassel, the micronutrient contents are lower at beginning and increase with crop development, with highest levels between days 111 and 118 (between R4/R5 and R5 growth stages).
In relation to the straw, the Fe and Mn contents are constant during the time of collection and, the Zn contents are lower in the final development growth stages of maize plant (Figure 3B). When comparing the three organs, higher micronutrient contents in the style-stigma and tassel in comparison to straw are observed (Figure 3B).
From 104 days on (R4 growth stage), it was observed that the micronutrient contents are higher in the ear when compared to contents in the grain (Figure 3C).
The mineral elements in the ear (cob + grain) were analyzed from 70 (R1 growth stage) to 91 days (R3 growth stage) (Figure 3C).
At 104 days (R4 growth stage), the analysis was made in separate for the cob and the grain (Figure 3C). The content of micronutrients is higher in the early ear development and decreases until the end of the evaluation period, 91 days (R3 growth stage).
As in the case of the ear, the levels of micronutrients in the cobs and grain decrease toward the end of the crop cycle (Figure 3C). However, the Fe and Mn levels are constant in cob and the levels of Fe and Zn are also fairly constant for the grain.
After the R4 growth stage, at 104 days, the Fe contents were higher in the grain when compared to the cob (Figure 3C).
At the R1 growth stage (70 days), higher B, Fe, and Mn contents were found in the ear.
In grain, there are higher levels of B, Cu, and Mn at 104 (R4 growth stage) and Fe and Zn at 140 days (R6 growth stage) (Figure 3C).
In 31 out of 45 cases, the Pearson correlation coefficient values were larger than the critical values (69%) (leaf: 80%, stalk: 80%, tassel: 60%, style-stigma: 60%, straw: 60%, ear: 80%, cob: 60%, grain: 40%, and plant: 100%), at 10% of significance level, for micronutrient content power model (Table 3).
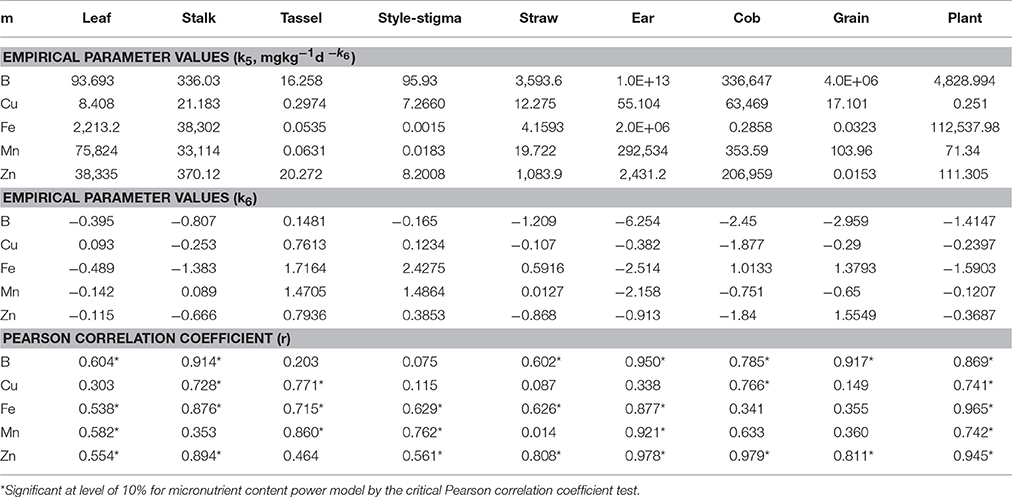
Table 3. Empirical parameter values (k5, mgkg−1d −k6 and k6) and Pearson correlation coefficient (r) for micronutrient (m) content (N, mg kg−1) power model, for B, Cu, Fe, Mn, and Zn in leaf, stalk, tassel, style-stigma, straw, ear, cob, grain, and above ground maize plant (hybrid DKB390VTPRO2).
Micronutrient Absorption A and Absorption Rate λ for the Above Ground Plant
The total micronutrient absorption increased with crop growth and development. At 14 days, the Cu, Fe, Mn, and Zn absorptions were, respectively, 3, 430, 10, and 10 g ha−1, and at the end of the cycle at 139 days, 180, 1,040, 930 and 430 g ha−1. The absorption rate was lower at the beginning of the cycle, 14 days (V2 growth stage) it was, respectively for Cu, Fe, Mn, and Zn, 1, 20, 3, and 3 g ha−1 d−1, the absorption peak was observed at 111 days (R4/R5 growth stage) with a value of 2, 90, 12, and 5 g ha−1 d−1 (Table 4).
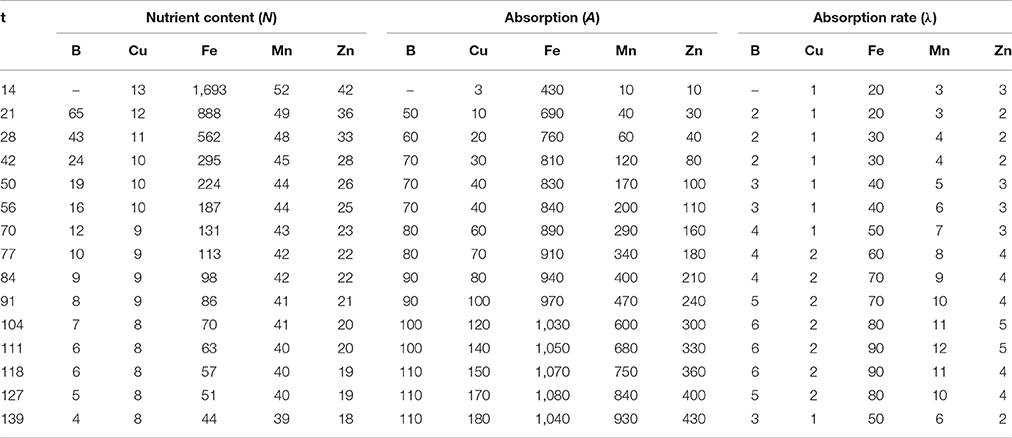
Table 4. Mean values of nutrient content (N, mgkg−1), absorption (A, gha−1) and absorption rate (λ, gha−1d−1) of B, Cu, Fe, Mn and Zn in maize crop (hybrid DKB390VTPRO2) in relation to time after sowing (t, d).
Equation (1) fitted well for all micronutrients except Cu (Figure 4A). The absorption rate increased for all nutrients from 14 to 111 days. N is described as a decreasing power function for all micronutrients, resulting in absorption rate functions whose shape differs from the sigmoid function D.
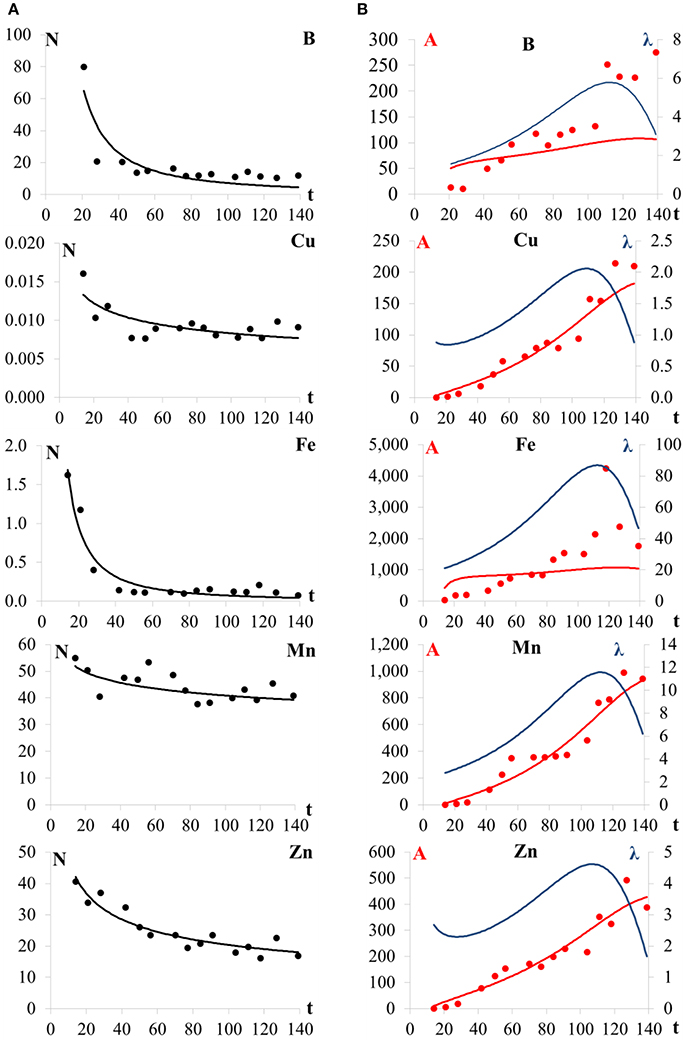
Figure 4. (A) micronutrient contents of the above ground maize plant (N, mgkg−1), and (B) total absorption (A, gha−1) and absorption rate (λ, gha−1d−1) for B, Cu, Fe, Mn, and Zn in the maize (hybrid DKB390VTPRO2) crop (weighted average of all above ground organs) as a function of the number of days after sowing (t, d).
The total B uptake at the R1 growth stage (70 days) was 80 g ha−1 and at the end of the crop cycle, R6 growth stage (139 days) 110 g ha−1. The B absorption rate presents a maximum value λmax on 112 days (R4/R5 growth stage) (Figure 4A) with 6 g ha−1 d−1. Thereafter the rate decreases to the end of the crop cycle.
Cu had a similar behavior to Mn and Zn, but with a slightly worse fit. Nevertheless, the power model for Cu content was chosen, in the same way as for the contents of Mn. The total absorption of Cu also increased during the crop development. At day 14, the absorption of Cu was 3 g ha−1, at the end of the vegetative growth stage (day 56, V15 growth stage), the absorption was 40 g ha−1 and at the end of the cycle, it increased to 180 g ha−1. With respect to the absorption rate, the behavior of Cu was similar to Zn, being high at the first sampling (14 days), decreasing until 38 days (V8 growth stage) and then increasing up to the maximum value at 109 days (between R4 and R4/R5 growth stages) of 2 g ha−1 d−1 (Figure 4A). Thereafter it decreases continuously until the end of the crop cycle.
The total absorption of Fe increased throughout the development of the crop, at 14 days (V2 growth stage) showing a value of 430 g ha−1. At R1 growth stage (70 days), the Fe uptake was 890 g ha−1 and at the end of the cycle 1,040 g ha−1. With respect to the absorption rate of Fe, it was high initially, at the V2 growth stage (14 days) with a value of 20 g ha−1 d−1. The nutrient absorption rate of Fe increased to the maximum value of 90 g ha−1 d−1 at 112 days. The Fe rate decreases thereafter to the end of the cycle (Figure 4B).
Mn behaved similarly to Cu. The total absorption increased during crop development from 290 g ha−1 at the R1 growth stage (70 days) to 930 g ha−1 at the end of the cycle (R6 growth stage, 139 days). At 14 days, the absorption rate was low, increasing thereafter continuously until 112 days. From this period, increasing values were observed, and the maximum absorption rate (λmax) occurred at 112 days (between R4/R5 and R5 growth stages) (Figure 4B), with a value of 12 g ha−1 d−1. Then, the Mn absorption rate decreased until harvest.
Zn total absorption was equal to10 g ha−1 at 14 days and 430 g ha−1at the end of the cycle. The absorption rate peak was 5 g ha−1 d−1 at 107 days (between R4 and R4/R5 growth stages) (Figure 4A), thereafter decreasing until harvest.
The Pearson correlation coefficient values (0.869, 0.741, 0.965, 0.742, and 0.945) (Table 4) for micronutrient (B, Cu, Fe, Mn, and Zn) content model (Figure 4A) were larger than the critical value, at the 10% of significance level.
Micronutrient Content in Stalk Sap
The values for B, Cu, Fe, Mn, and Zn contents (N), total absorption (A) and the maximum absorption rates for each micronutrient (λmax), and maximum concentrations (CC) are shown in Table 5.
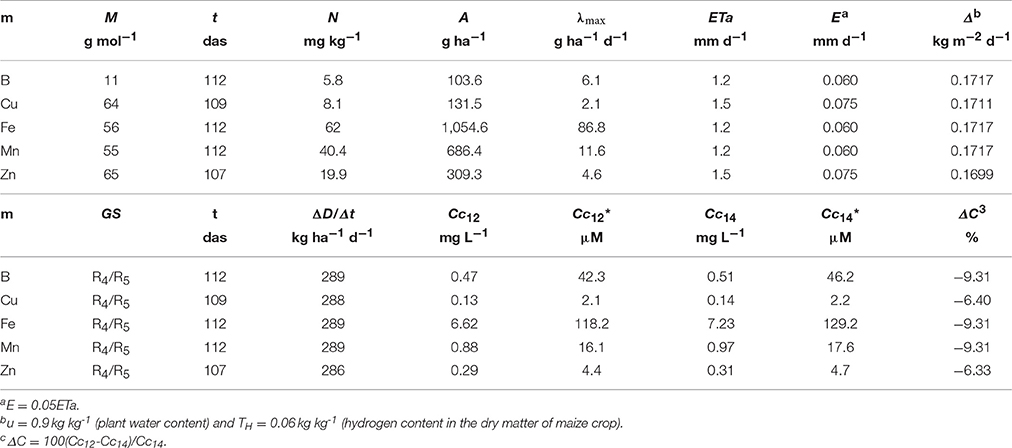
Table 5. Maximum concentration (CC, mgL−1 or Cc*, μM, as function of the molecular weight M, gmol−1) of each micronutrient (m) in crude sap (xylem) of maize crop (hybrid DKB390VTPRO2) at t days after sowing, corresponding to the growth stage (GS), above ground plant content (N, mgkg−1), nutrient absorption (A, gha−1), maximum absorption rate (λmax, gha−1d−1), actual evapotranspiration (ETa, mmd−1), evaporation (E, mmd−1), absorbed water by the plant to form dry matter, the water retained by the plant (α, kg m−2 d−1), total dry matter stored on the day of calculation (ΔD/Δt, kgm−2d−1) and relative difference (ΔC, %) of Cc values estimated by equations 12 (Cc12) and 14 (Cc14).
The maximum absorption rate (λmax, g ha−1 d−1) of the micronutrients occurred between 107 and 112 days, i.e., during the R4 (50% of the plants exh0ibiting farinaceous grains) and R5 (50% of the plants exhibiting hard farinaceous grains) growth stages (Ritchie et al., 1996). These growth stages are therefore the most important with respect to the nutritional needs of the maize crop. At these growth stages, the starch accumulation in the maize grain increases featuring a period of grain filling, resulting in greater dry mass of grain.
The ETa values in the corresponding days of λmax are relatively small because the period coincides with the local winter season, due to cloudy days. Estimates of the maximum concentration (CC, mg L−1) in the gross plant sap were highest for Fe, followed by Mn (Table 5).
Discussion
Evapotranspiration
Water absorption refers to the sum of the transpiration, the amount of water retained by the maize crop and the amount of water required to produce the total dry matter. Maize crop productivity depends fundamentally on the water absorption and the carbon dioxide assimilation, since carbon and oxygen (from CO2), and hydrogen (from H2O) represent about 96% of the dry matter.
The maize crop potential evapotranspiration (water requirement) during the whole cycle was 180 mm. The total actual evapotranspiration was 135 mm. There was a water deficit of 45 mm. A mild water stress occurred during 38 days of crop establishment, from April 14 to May 21.
Water Deficit
Effects of water deficit vary according to the development growth stage of the crop, and when occurring in the vegetative period, plant height was reduced, leaves become smaller, and consequently present a lower leaf area. However, the stress is mainly harmful to grain productivity when it occurs at the beginning of the tassel development up to grain filling. The demand for water increases rapidly about 2 weeks before the development of the tassel, and reaches a maximum at the flowering peak, continuing high for about two more weeks when it decreases rapidly.
Crop Cycle
The cropping period was from March to August, a season that is called “second maize harvest” in Brazil, nowadays more important than the “main maize harvest,” from September to March. The crop cycle had a duration of 139 days. The vegetative phase ended 70 days (R1 growth stage), accumulating 863°C days, and the reproductive phase extended from 70 to 139 days (R6 growth stage), with a total of 733°C days (Table 1).
Crop Growth and Development
At the end of the vegetative phase, the maize plant gives priority to the development of the tassel and ear, which causes a remobilization of the photo-assimilates and nutrients from the leaf to the production and dispersion of pollen and to grain filling. It is also possible to observe a slight reduction of stalk dry matter during 91–104 days (R3 and R4 growth stages) (Table 2).
During the reproductive phase, the ear is a significant physiological drain. The plant redistributes photo-assimilates and nutrients to the grain, for filling. Therefore, the closer to physiologic maturity, the more leaves and stalk enter in senescence.
The accumulation and mobilization of dry matter in maize crop has a characteristic sequence over the growth cycle. For the maize crop, some authors report senescence as a process that encompasses the above ground plant, besides being caused by internal and external factors and mediated by a genetic program.
At 112 days, the values of the growth rate continue to be positive (dY/dt), but with decreasing daily gains (d2Y/dt2), i.e., the maize plant reduces its rate of dry matter accumulation because of the senescence process.
Micronutrient Content
The demand for micronutrients depends mainly on the crop productivity (production of total dry matter mass per unit area) (Bray, 1948), and the variation of dry matter composition of genotypes of the species of interest (least significant component).
Studies of Ciampitti et al. (2013), evaluating the contents of B, Cu, Fe, Mn, and Zn in maize plants, showed similar results as those found in this study. These micronutrient contents are larger at the beginning of the development of the maize crop, and then decrease up to physiological maturity.
During the initial growth, as there is a low production of plant dry matter, a high concentration of micronutrients was found coming from the soil or being remobilized from other parts of the plant.
The absorption of micronutrients depends on the water absorption and the effective content of the micronutrient in the soil solution. Transpiration depends on the difference between water potential in the leaf and in the atmosphere. The absorption of water and nutrients depends on the elements of the climate (such as temperature, relative humidity and wind speed), crop (such as root system architecture, leaf area index and productivity) and soil (water and micronutrients content).
With crop growth, which usually follows a sigmoidal model, the dry matter accumulation is more expressive than the capacity of the plant to absorb and concentrate micronutrients. Therefore, we have a dilution effect due to the maize crop growth. Furthermore, it is known that higher concentrations of Fe and B, for example, are related to leaf and stalk. Over time, other structures gain greater proportion in the share of total dry matter thus contributing to part of this dilution effect.
Micronutrient Content in Stalk Sap
Due to complex factors related to the interaction between genotype and environment (climate and soil), the determination of the critical content in the xylem solution is the proposed procedure to evaluate soil fertility. Among the different factors, we highlight: phenological stage, effective depth of the root system corresponding to at least 90% of the potential evapotranspiration of the crop, distribution of the root system in the soil profile, soil water flow density, root trapping, mass flow and diffusion of micronutrients in soil, pH, temperature and content of the different micronutrients in soil solution and evapotranspiration, mainly.
During photosynthesis, the produced carbohydrate (CH2O) molecules are composed of carbon (C) and oxygen (O) atoms from atmospheric CO2, whereas the hydrogen (H) originates from water molecules from the soil. The produced O2 returning to the atmosphere also originates from the soil water molecule (Taiz and Zeiger, 2006):
This reaction is endothermic, requiring energy that, in the photosynthesis process, is provided by solar radiation, where (i) 6 carbon and 6 oxygen atoms of the produced carbohydrate molecule are derived from the enzymatic breakdown of atmospheric carbon dioxide by RuBisCO (Ribulose-1,5-bisphosphate carboxylase/oxygenase); (ii) 12 atoms of hydrogen of the produced carbohydrate molecule are derived from the extracted water from the soil and broken by the light in the leaf, process known as water photolysis; (iii) the other 12 atoms of hydrogen with 6 atoms of oxygen will build 6 molecules of water; and (iv) the 12 atoms of oxygen of the molecule of oxygen (O2), that return as gas to the atmosphere, are derived from water molecule: reaction proven by Robin Hill in the years 1960 using labeled oxygen (18O). Then, the absorbed water responsible for the total dry matter produced during the day of calculation can be estimated as and the water retained by the plant can be estimated as , so that the maximum concentration of a micronutrient in the stalk sap (Cc, mg L−1) is:
where ETa is the actual evapotranspiration (mm d−1), here calculated using the simple Thornthwaite and Mather (1955) water balance, E the soil surface evaporation (mm d−1), u the plant water content (kg kg−1), TH the hydrogen content in the dry matter of maize crop (0.06 kg kg−1) and dD/dt the total dry matter stored on the day of calculation (kg m−2 d−1):
Cc represents the critical concentration λs (mg L−1) in the soil solution. In this way, knowing Cc, it should be possible to develop a methodology for characterizing soil fertility and to recommend fertilization optimized to reach the maximum productivity as a function of the limiting nutrient.
With the aim of estimating the micronutrient maximum concentrations (Cc, mg L−1) in the maize stalk sap at the time of maximum absorption, Equation (12) was simplified to:
The elimination of the term [] results in an underestimation of 6.33% (Zn) to 9.31% (B, Fe, and Mn) (Table 5).
Experiments carried out with the aim of evaluating the absorption of nutrients by a maize crop also report that the increased absorption of nutrients B, Cu, Fe, Mn, and Zn occurred during reproductive phase, between R4 and R5 growth stages (Ciampitti et al., 2013).
The maximum concentration (CC, mg L−1) of each nutrient in the xylem sap is here assumed to be related to the soil solution absorbed by plant roots (Table 4). Based on the analysis of the results obtained in this research, it is suggested that future studies should be conducted in more than one growing season, with replicates of several years or even at different times. Such experiments may include different genotypes, as well as different regions, varying the population of plants in the experimental area, and simulate high, medium and low technology managements.
It is not possible to separate the effect of lack of water from the lack of micronutrients in the loss of maize crop productivity. The critical micronutrient content (Cc) is related to the transpiration and productivity (related to the maximum maize crop demand λmax). Theoretically, the micronutrient with lowest content in the stalk sap (related to the lowest soil offer λs) defines productivity. On the other hand, the limiting maximum micronutrient absorption rate (λmax) corresponding to the lower productivity defines the attainable productivity limited by water and micronutrient (Liebig's minimum law).
Water and Nutrients Absorption by Plants
In nature, water and nutrient absorption occurs simultaneously (with and without energy expenditure), because the solute movement in the soil occurs by the combined processes of diffusion and mass flow, which in both cases are related to dynamics of water in the natural system composed by soil, plant and atmosphere phases.
From the thermodynamic point of view, the soil chemical fertility depends on the physical process related to the water movement in nature. The transpiration depends, among other factors, on the water potential difference between vapor in the atmosphere and liquid water in the leaf.
The water potential (ψ, atm) in the atmosphere phase defines the magnitude order of transpiration, which depends on air temperature (T, K) and relative humidity (Ω, kPa kPa−1):
which depend on other climate elements such as solar radiation, rainfall and wind, for example.
Maximum Micronutrient Concentration in the Sap, Productivity and Transpiration
The water absorption by a crop is given by the sum of transpiration and constitutional water dependent on dry matter production. Absorption of nutrients is dependent on water absorption (or transpiration if we neglect constitutional water) and nutrient concentration on the absorbed solution. Therefore, high nutrient concentration in the soil solution (higher chemical fertility in the current classical model, since it does not reach salinization levels) is correlated with high concentration in the plant xylem solution, greater nutrient absorption, high dry matter production (of the different organs) and greater productivity (yield).
Therefore, this approach (preliminary studies to characterize the temporal variation of micronutrient composition of the above ground organs of maize and correlated uptake rates) allows developing a new concept to change the classic criteria of fertilization recommendation taking into account the reality of the facts (high dependence of micronutrients absorption to water absorption). The experimental data are used merely to give an example of application and to show the order of magnitude of the micronutrients contents in different organs and the micronutrients concentrations in the sap.
Figure 5 shows the micronutrient (B, Cu, Fe, Mn, and Zn) maximum concentrations in the maize stalk sap at the time tmax estimated by Equations (12) and (14) for the maize crop as a function of low (lower than 10,000 kg ha−1) and high (higher than 10,000 kg ha−1) yield and actual evapotranspiration. It is observed that the maximum concentration Cc presents high variation as a function of productivity in an environment of low evapotranspiration, which does not occur under high evapotranspiration. It was also observed that the simplified equation (Equation 14) presents smaller errors under the condition of high evapotranspiration.
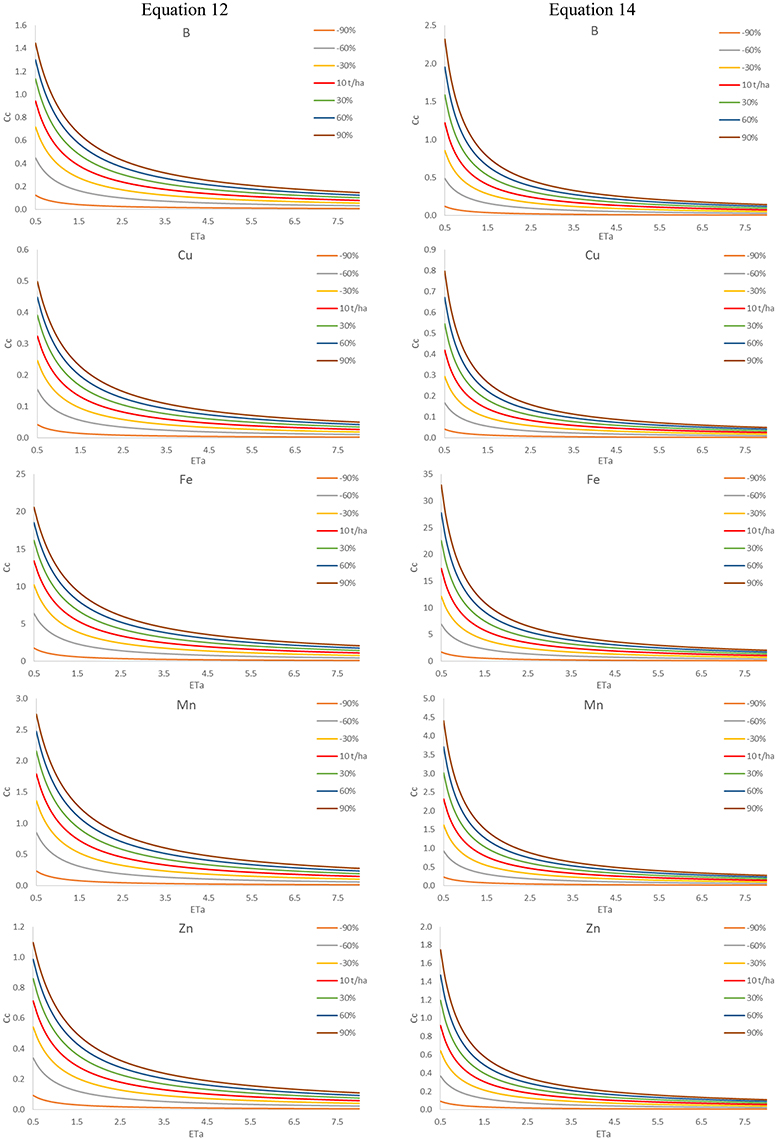
Figure 5. B, Cu, Fe, Mn, and Zn maximum concentrations (Cc, mgL−1) in the maize stalk sap estimated by complete (Equation 12) and simplified (Equation 14) equations for the maize crop as a function of yield (lower and higher than 10tha−1) and actual evapotranspiration (ETa, mmd−1).
Final Considerations
This preliminary study may serve as a basis for other researchers to develop an alternative methodology to the current procedure using chemical soil extractors. This alternative may vary from the measurement of the micronutrient content in the xylem in the indicator plant, which may be the species of interest at the point of maximum growth rate as described in this work, or even through the correlation of this value with the value measured in seedlings of the same species or using a native species present in the area (Cate and Nelson, 1965).
Chlorine, molybdenum and nickel were not considered in the present study due to the low amounts of these micronutrients used in maize fertilization programs, in general, for the following reasons: (i) chlorine is supplied when potassium is applied as KCl (about 40 kg ha−1 of K2O), (ii) molybdenum is most frequently used in soybean cultivation due to the symbiosis with Bradyrhizobium sp. and (iii) nickel presents few research results because its essentiality was found only recently.
The next steps of this preliminary study would be including roots and validating the model under different environmental conditions and with different genotypes. In this way, the model is able to take into account the effect of the environment and of the genotype that were not considered in this initial work, as well as to characterize the chlorine, molybdenum and nickel contents of different organs and their respective extractions.
Conclusions
We proposed a methodology that can be used for characterizing the micronutrient absorption rate of crops and tested it for a maize growing scenario. Results show that: (i) the micronutrient content variation in time follows a power model, with higher values for the initial growth stages of development and leveling off to minimum values at the R6 growth stage, (ii) the maximum micronutrient absorption rates occur in the reproductive growth stages, and (iii) these evaluations allowed to predict the maximum need for micronutrients, considered equal to their concentration in the stalk sap. The proposed methodology can be used as a basis for further improvement in micronutrient fertilization of maize and other crops.
Author Contributions
KM and DD designed the research; JF, FS, GF, and SM performed the research; KM, DD, KR, and Qd analyzed data; KM, DD, KR, and Qd wrote the manuscript.
Conflict of Interest Statement
The authors declare that the research was conducted in the absence of any commercial or financial relationships that could be construed as a potential conflict of interest.
The reviewer YZ and handling Editor declared their shared affiliation, and the handling Editor states that the process nevertheless met the standards of a fair and objective review.
Acknowledgments
This research was supported by the “National Council for Scientific and Technological Development” (CNPq) of “Ministry of Science, Technology, Innovations and Communications” (Grant No. 312470/2014-2), “Commission for the Improvement of Higher Education” (CAPES) of “Ministry of Education” and “Luiz de Queiroz College of Agriculture” of University of São Paulo, Brazil.
References
Allen, R. G., Pereira, L. S., Raes, D., and Smith, M. (1998). Crop Evapotranspiration: Guidelines for Computing Crop Water Requirements. Rome: FAO.
Alvares, C. A., Stape, J. L., Sentelhas, P. C., Gonçalves, J. L. M., and Sparovek, G. (2013). Köppen's climate classification map for Brazil. Meteorol Z. 22, 711–728. doi: 10.1127/0941-2948/2013/0507
Bender, R. R., Haegele, J. W., Ruffo, M. L., and Below, F. E. (2013). Nutrient uptake, partitioning, and remobilization in modern transgenic insect-protected corn hybrids. Agron J. 105, 161–170. doi: 10.2134/agronj2012.0352
Berger, K. C., and Truog, E. (1940). Boron deficiencies as revealed by plant and soil tests. J. Am. Soc. Agr. 32, 297–301. doi: 10.2134/agronj1940.00021962003200040007x
Bray, R. H. (1948). “Correlation of soil tests whit crop response to added fertilizers and with fertilizer requirement,” in Diagnostic Techniques for Soils and Crops, ed H. B. Kitchen (Washington, DC: The American Potash Institute), 53–86.
Cantarutti, R. B., Barros, B. F., Martinez, H. E. P., and Novais, R. F. (2007). “Avaliação da fertilidade do solo e recomendação de fertilizantes,” in Fertilidade do solo, eds R. F. Novais, V. H. Alvarez, B. F. Barros, R. L. F. Fontes, R. B. Cantarutti, and J. C. L. Neves (Viçosa, MG: Sociedade Brasileira de Ciência do Solo), 769–850.
Cate, R. B., and Nelson, L. A. (1965). A Rapid Method for Correlation of Soil Test Analysis with Plant Response Data. Raleigh, NC: North Carolina State University.
Ciampitti, I. A., Camberato, J. J., Murrell, S. T., and Vyn, T. J. (2013). Corn nutrient accumulation and partitioning in response to plant density and boron rate: I. Micronutrients. Agron J. 105 783–795. doi: 10.2134/agronj2012.0467
CONAB - Companhia Nacional de Abastecimento (2015). Séries históricas: de área plantada, produtividade e produção, relativas às safras 1976/77 a 2014/15 de grãos, 2001 a 2014 de café, 2005/06 a 2014/15 de cana-de-açúcar. Available online at in: http://www.conab.gov.br/conteudos.php?a=1252&. Accessed in: 10/25/2015.
Edwards, J. (2009). Maize Growth and Development. Orange, NSW: NSW Department of Primary Industries, 60.
Lindsay, W. L., and Norvell, W. A. (1978). Development of a DTPA soil test for zinc, iron, manganese, and copper. Soil Sci. Soc. Am. J. 42, 421–428. doi: 10.2136/sssaj1978.03615995004200030009x
Oliveira, E. L. (2003). Sugestões de adubação e calagem para culturas de interesse econômico no Estado do Paraná. Londrina: Instituto Agronômico do Paraná.
Ribeiro, A. C., Guimarães, P. T. G., and Venegas, V. H. A. (1999). Recomendações para o uso de corretivos e fertilizantes em Minas Gerais: 5. Aproximação. Via: Comissão de Fertilidade do Solo do Estado de Minas Gerais, 359.
Ritchie, S. W., Hanway, J. J., and Benson, G. O. (1996). How a Corn Plant Develops. Ames: Iowa State University of Science and Technology.
Sociedade Brasileira de Ciência do Solo (SBCS) (2004). Manual de Adubação e de Calagem Para os Estados do Rio Grande do Sul e de Santa Catarina, 10th Edn. Porto Alegre: Sociedade Brasileira de Ciência do Solo, Núcleo regional sul. Comissão de Química e Fertilidade do Solo, 400.
Soil Survey Staff (1975). Soil Taxonomy: A Basic System of Soil Classification for Making and Interpreting Soil Surveys. Washington, DC: USDA Agric. Handbook 436.
Systat Software (2000). Table Curve 2D: Automated Curve Fitting and Equation Discovery. Chicago: SPSS Science.
Thornthwaite, C. W., and Mather, J. R. (1955). The Water Balance. New Jersey, NJ: Drexel Institute of Technology.
van Raij, B., Cantarella, H., Quaggio, J. A., and Furlani, A. M. C. (1996). Recomendações de adubação e calagem para o estado de São Paulo. Campinas: Instituto Agronômico; Fundação IAC.
Keywords: Zea mays, micronutrient content, micronutrient partition, productivity, agricultural modeling
Citation: Martins KV, Dourado-Neto D, Reichardt K, de Jong van Lier Q, Favarin JL, Sartori FF, Felisberto G and Mello SC (2017) Preliminary Studies to Characterize the Temporal Variation of Micronutrient Composition of the Above Ground Organs of Maize and Correlated Uptake Rates. Front. Plant Sci. 8:1482. doi: 10.3389/fpls.2017.01482
Received: 05 January 2017; Accepted: 10 August 2017;
Published: 01 September 2017.
Edited by:
Nathaniel Newlands, Government of Canada, Science and Technology, CanadaReviewed by:
Yinsuo Zhang, Agriculture and Agri-Food Canada, CanadaLouis Kouadio, University of Southern Queensland, Australia
Kurt A. Rosentrater, Iowa State University, United States
Copyright © 2017 Martins, Dourado-Neto, Reichardt, de Jong van Lier, Favarin, Sartori, Felisberto and Mello. This is an open-access article distributed under the terms of the Creative Commons Attribution License (CC BY). The use, distribution or reproduction in other forums is permitted, provided the original author(s) or licensor are credited and that the original publication in this journal is cited, in accordance with accepted academic practice. No use, distribution or reproduction is permitted which does not comply with these terms.
*Correspondence: Durval Dourado-Neto, ddourado@usp.br