Corrigendum: The Arabidopsis ANGUSTIFOLIA3-YODA Gene Cascade Induces Anthocyanin Accumulation by Regulating Sucrose Levels
 Lai-Sheng Meng
 Ying-Qiu Li1,2
- 1The Key Laboratory of Biotechnology for Medicinal Plant of Jiangsu Province, School of Life Science, Jiangsu Normal University, Xuzhou, China
- 2Centre for Transformational Biotechnology of Medicinal and Food Plants, Jiangsu Normal University – Edinburgh University, Xuzhou, China
Anthocyanin accumulation specifically depends on sucrose (Suc) signaling/levels. However, the gene cascades specifically involved in the Suc signaling/level-mediated anthocyanin biosynthetic pathway are still unknown. Arabidopsis ANGUSTIFOLIA3 (AN3), a transcription coactivator, is involved in the regulation of leaf shape and drought tolerance. Recently, an AN3-CONSTITUTIVE PHOTOMORPHOGENIC 1 gene cascade has been reported to regulate the light signaling-mediated anthocyanin accumulation. Target gene analysis indicates that AN3 is associated with the YODA (YDA) promoter, a mitogen-activated protein kinase kinase kinase, in vivo for inducing anthocyanin accumulation. Indeed, loss-of-function mutants of YDA showed significantly increased anthocyanin accumulation. YDA mutation can also suppress the decrease in an3-4 anthocyanin accumulation. Further analysis indicates that the mutations of AN3 and YDA disrupt the normal Suc levels because of the changes of invertase activity in mutants of an3 or yda, which in turn induces the alterations of anthocyanin accumulation in mutants of an3 or yda via unknown regulatory mechanisms.
Introduction
Anthocyanins are a class of flavonoids widely found in plants and are responsible for plant colouration (Winkel-Shirley, 2001; Gould et al., 2002). The antioxidant properties of anthocyanins can provide nutritional benefits for humans and can protect plants from oxidative damage (Nagata et al., 2003).
Anthocyanin biosynthesis has been diffusely investigated in plants (Gou et al., 2011; Meng, 2015). In many plants, for example, Arabidopsis thaliana (thale cress), Antirrhinum majus (snapdragon) and Petunia hybrida (petunia), early biosynthesis genes (EBGs), including chalcone isomerase (CHI), chalcone synthase, flavonoid 3′-hydroxylase (F3′H) and flavanone 3-hydroxylase, can be induced early compared with late biosynthesis genes (LBGs), including leucoanthocyanidin oxygenase, dihydroflavonol 4-reductase, UDP-glucose, and anthocyanidin reductase (Meng, 2015).
Anthocyanin biosynthesis has been widely affected by biotic and abiotic factors (Yokawa et al., 2014). Phytohormones, for example, gibberellins (Weiss et al., 1995), abscisic acid and auxin (Jeong et al., 2004; Hoth et al., 2010), jasmonates (Qi et al., 2011), cytokinin (Deikman and Hammer, 1995) and ethylene (Morgan and Drew, 1997; Jeong et al., 2010), modulate anthocyanin biosynthetic pathways in cell suspensions or/and whole plants differently (Ozeki and Komamine, 1986). Moreover, sugar (e.g., sucrose [Suc] and glucose) is regarded as transported carbohydrates and signal molecules in vascular plants (Lou et al., 2007). Along with the synergistic effect on mobilizing sugar usage and storage or sugar production, glucose signaling mediates carbohydrate availability and modulates metabolism (Baier et al., 2004). Anthocyanin biosynthesis is also significantly upregulated along with Suc concentration, and upregulation during anthocyanin biosynthesis specifically depends on Suc (Solfanelli et al., 2006; Jeong et al., 2010).
Although, a few reports have shown that anthocyanin accumulation is specific for Suc signaling, what gene cascade Suc is integrated to and how Suc is linked to the relative proteins are still unknown. A recent work (Meng, 2015) showed that AN3 positively regulates anthocyanin accumulation. In this study, yda mutants exhibited higher anthocyanin accumulation than the wild-types. Molecular data indicated that YDA is a target gene of AN3. Moreover, AN3 genetically acts upstream of YDA to regulate anthocyanin accumulation. Further analysis revealed that the mutations of AN3 and YDA can disrupt the normal Suc levels as a result of higher or lower invertase (INV) activity in an3 and yda mutants, respectively. Thus, lower and higher anthocyanin accumulations were observed in an3 and yda mutants, respectively.
Materials and Methods
Plant Materials and Growth Conditions
an3-1, an3-4 (Horiguchi et al., 2005), yda-1, emb71, and yda-2 (Lukowitz et al., 2004; Kang et al., 2009; Meinke et al., 2009) mutants, 35S:AN3:3XGFP (Kanei et al., 2012) transgenic plants with Col-0 background were described previously. emb71 is an allele of yda (yda1 and yda2).
The an3-1 (AT5G28640, CS241), yda-1 (AT1G63700, CS6392), yda-2 (AT1G63700, CS6393), emb71 (AT1G63700, CS84618), and grf1 (AT2G22840, SALK_069339C) were obtained from the ABRC (Ohio State University). Professor G. Horiguchi (Rikkyo University, Japan) kindly provided via the 35S:AN3:3XGFP seeds. Prof. H. G. Nam (DGSIT, Korea) kindly provided the an3-4 mutant seeds. Prof. H. Q. Yang (ShangHai JiaoTong University, China) kindly provided the pHB-YDA:GFP plasmid.
The an3 yda double mutant was gained by an3-4 and yda-1 phenotype. The above method about the double mutant construction was described previously (Meng and Yao, 2015). By using the Agrobacterium tumefaciens-mediated floral dip method, we gained transgenic plants (Meng and Liu, 2015; Meng et al., 2015a).
ProYDA:GUS/an3-4 lines were obtained, as was described by Meng and Yao (2015). We introduced pMD111-Pro YDA:GFP (YDA pro:GFP with two TCTCTC motif or YDA pro:GFP without two TCTCTC motif) into the 35S:AN3 background, as were described previously (Meng and Yao, 2015). Transformants were selected on Hygromycin B for three generations and analysis of segregation ratios.
Condition of Arabidopsis plant growth was described by Meng and Yao (2015) and Meng L. et al. (2016).
Observation of Root System
Arabidopsis roots were photographed under relevant magnification using a HIROX three-dimensional video microscope (Meng L.S. et al., 2016).
Constructing Plasmid
For AN3 and YDA promoter analysis, we constructed relative plasmid, as was described by Meng and Yao (2015). Obtaining 35S:AN3-HA plasmid was described by Meng and Yao (2015). Obtaining pGWB5 /AGL103-YDA-GFP plasmid and obtaining pMD111-PAP1-GFP plasmid (containing TTCAAA motif) was described by Meng and Yao (2015).
GUS Expression
GUS assay was described by Meng et al. (2015a,b).
Confocal Laser Scanning Microscope for GFP Imaging
Confocal laser scanning microscope for GFP Imaging was described by Meng (2015).
ChIP Assay
ChIP assay was described by Meng (2015). The ChIP DNA products were analyzed through qPCR via using five pairs of primers that were synthesized to amplify ∼300-bp DNA fragments of the promoter and CDS region of YDA in ChIP analysis. The primer sequences of YDA were P1-tgt gtc act aac tca ctt cac; P2-gaa aac cct aag tag aac aac; P3-gct ttc gat ttg att cca ttt caa; P4- tca atg tga tct tca acc ta; P5- tac aaa gat taa cgc acc aaa gg; and P6-tca aaa gca atc gaa gaa tcc aa; P7-AAT CAT TAT AAA AGT CAG CAA CTA A; P8-AAG AAT ATG AAA TAC TTC CAA TTC A. The primer sequences were 5′-GCA GCA AGA TCG GTC GCG GA-3′ and 5′-ACC GCC ACC ACC ACT TCC CA-3′ for CDS region of YDA. The primer sequences of F3′H (TT6) were F1-(F1-ttg taa aca aca acg aaa act gaa; R1-aac ggc aac ggc tca tct tc); F2 (F2-cgc aag ccc gta cca gaa cat g; R2-tac agt ttc gtt tac acc gta g). The primer sequences of FLS were F1 (F1-ctc tct ctc tct cgc tct ca; R1-aac acc tgt ata aac aaa aaa gg); F2 (F2-tta tgg cct aaa ata taa taa cat c; R2-ata tgt gta agt cgt cga ggc). The primer sequences of CHI were C1 (F1-ctt gat tct tga tat tta tac cgc; R1-ttg tca gac caa ttc taa tcc ga); C2 (F2-caa ttg gcg act act ttc agt aa; R2-tta cac gta aca cgt tgg gaa at). The primer sequences of UBQ5 were F1—gac gct tca tct cgt cc; R1-gta aac gta ggt gag tcc a).
Real-Time Polymerase Chain Reaction (PCR)
Total RNA was extracted and real-time polymerase chain reaction (PCR) was performed, as described by Meng et al. (2015b). For analyzing EMB71/YDA expression level in 2-week-old Col-0, an3-1, an3-4, and 35S:AN3/an3-4 seedlings, primers F-5′-GCA GCA AGA TCG GTC GCG GA-3′ and R-5′-ACC GGG TCT CAG GTC GAG GG-3′ were used. For analyzing AN3 expression level in 2-week-old Col-0, emb71, Ler, yda-1, and yda-2 seedlings, primers F-5′-GCC TCA GCC ACC AAG TGT GCA T-3′ and R-5′-ACC GCC ACC ACC ACT TCC CA-3′ were used. For analyzing FLS, CHI, F3’H (TT6), TT19, UGT79B1, and UGT89B1 expression levels in 2-week-old Col-0, an3-4, and emb71 seedlings, primers F-5′-ATG GAG GTC GAA AGA GTC CAA-3′ and R-5′-TTT TCT TCC GAC GTC TTG TAA AC-3′ were used for FLS; primers F-5′-ATG GCT AAA CCC ACA TCA CGA-3′ and R-5′-GGT TTA GTA TAG AGT TAA AGA AGT-3′ were used for CHI; primers F-5′-ATG GCT CCA GGA ACT TTG ACT-3′ and R-5′-CAC GAG CGA GAC GAG TCA TAT-3′ were used for F3′H (TT6); primers F-5′-ATG GTT GTG AAA CTA TAT GGA CA-3′ and R-5′-CTA GAG ACT TGC CCA AAA GGT-3′ were used for TT19; primers F-5′-ATG GGT GTT TTT GGA TCG AAT G-3′ and R-5′-GAA GAA AGG GAC GTC GGA GT-3′were used for UGT79B1; and primers F-5′-ATG ACA ACA ACA ACA ACG AAG AA-3′ and R-5′-TAT AGC TTC GAG AGG AAG TTG CT-3′ were used for UGT89B1. The primer sequences of UBQ5 were F1-gac gct tca tct cgt cc; R1-gta aac gta ggt gag tcc a. UBQ5, a stable internal control gene, has been proven (Jain et al., 2006). The primer sequences of UBQ5 were F1—gac gct tca tct cgt cc; R1-gta aac gta ggt gag tcc a. UBQ5, a stable internal control gene, which has been proved by using the methods of Vandesompele et al. (2002).
Test of Sugar Metabolites
Twelve-day-old seedlings were ground in liquid nitrogen. Then, the powder was dissolved with 1 mL of 80% ethanol for 1 h. These extracts were centrifuged at 12,000 × g for 10–15 min. The supernatant and ethanol buffer were transferred to a fresh tube and evaporated under vacuum to dry for 40–60 min, and the residues were redissolved in 600 μL of ddH2O and kept at 70°C for 10–15 min.
Using chloroform/isoamyl alcohol (24:1, v/v), the aqueous fraction was extracted two to three times before high-performance liquid chromatography (HPLC) analysis. Sugars were quantified and identified via chromatography on an Agilent carbohydrate column and tested with a refractive index detector (Altex 156, Altex Scientific, Inc., Berkeley, CA, USA). Concentrations were measured from the integrated peak area and the peak heights using Suc, fructose and glucose (20 mg/mL) as standard samples (Kovtun et al., 2000).
Anthocyanin Measurement
Anthocyanin extraction and measurement have been described previously by Meng (2015).
Neutral INV Assay via Enzyme-Linked Immunosorbent Assay (ELISA)
Neutral INV in Arabidopsis plants was extracted and purified according to the method described previously by Lou et al. (2007). Enzyme-linked immunosorbent assay (ELISA) was used to assay INV activity. Briefly, the plant neutral INV activity assay kit (Sangon, Shanghai, China) was used. According to the manufacturer’s protocols, in assay medium (48-well plates) with neutral INV antigen, normal and assayed samples (antibody) were added and incubated at 37°C for 30 min. Then, the mixture was washed five times using a cleaning solution, and HRP (INV label) was applied and incubated at 37°C for 30 min to produce antigen–antibody–HRP complexes. After the reaction, the mixture was washed five times using a cleaning solution, and TMB-A and TMB-B were added and incubated at 37°C for 10 min for staining. TMB was catalyzed by HRP, and the mixture turned blue. When a termination buffer was applied, the mixture turned yellow. An enzyme mark instrument was used to assay the optical density values (450 nm). Finally, relative to a normal sample, the neutral INV activity of the assayed samples was estimated.
INV Activity Localisation
For localizing INV activity on Arabidopsis plants, histochemical staining method is performed based on a few coupled redox reactions to produce a non-soluble blue formazan precipitate, as described by Kuhn (1999) with minor modification. Five-day-old Arabidopsis seedlings were fixed in 4% formalin (pH 7.0–7.5) for 1 h. Then, fixed seedlings were rinsed several times in a few alterations of water and overnight to remove all endogenous sugars. After this rinsing process, these rinsed materials were incubated in a reaction mix buffer with 0.38 M disodium hydrogen phosphate buffer (pH 6.0), 15 units of glucose oxidase (Transgene SA, Illkirch, Strasbourg, France), 0.015% (wt/vol) phenazine methosulfate, 0.030% (wt/vol) nitroblue tetrazolium (NBT) and 1% Suc at 37°C under darkness. In the control reactions, Suc was not added. Reaction termination after 2–3 h was performed by water rinsing and post-fixing in 4% formalin for 30 min.
Results
Seedlings and Seeds of yda Mutants Showed Higher Anthocyanin Accumulation than the Wild-Types
Recently, Arabidopsis AN3 has been reported to be a positive regulator of anthocyanin accumulation (Meng, 2015), and Arabidopsis AN3-YDA has been reported to form the gene cascade for the regulation of drought tolerance (Meng and Yao, 2015). Therefore, whether YDA is also involved in the regulation of anthocyanin accumulation should be determined. Indeed, heterozygous mature seeds for the emb71 mutant (its stock number at the Arabidopsis Biological Resource Center is CS84618, and its gene locus is AT1G63700) can generate phenotypical segregation and form homozygous seeds with dark purple colouration (approximately 24.2%; Figure 1Aa,c) (Meinke et al., 2009). emb71 is an allele of yda (yda1 and yda2). Heterozygous mature seeds for the yda-1/+ (CS6392) mutant, a nonsense mutation truncating the protein within the catalytic domain (Lukowitz et al., 2004), were observed to determine whether alleles of YDA behave similarly. Indeed, yda-1/+ seeds can also generate phenotypical segregation and form homozygous seeds with dark purple colouration (<5%; Figure 1Ab,d). The anthocyanin concentration in yda seedlings was determined to confirm this finding. Subsequent findings indicated that the yda seedlings exhibited a higher anthocyanin content than the wild-type seedlings (Figure 1B). The 7-day-old wild-type seedlings were purplish at the primary roots, and the corresponding emb71 mutant roots exhibited excess anthocyanin accumulation (Supplementary Figure S1). Taken together, these findings revealed that YDA may negatively regulate anthocyanin accumulation.
FIGURE 1
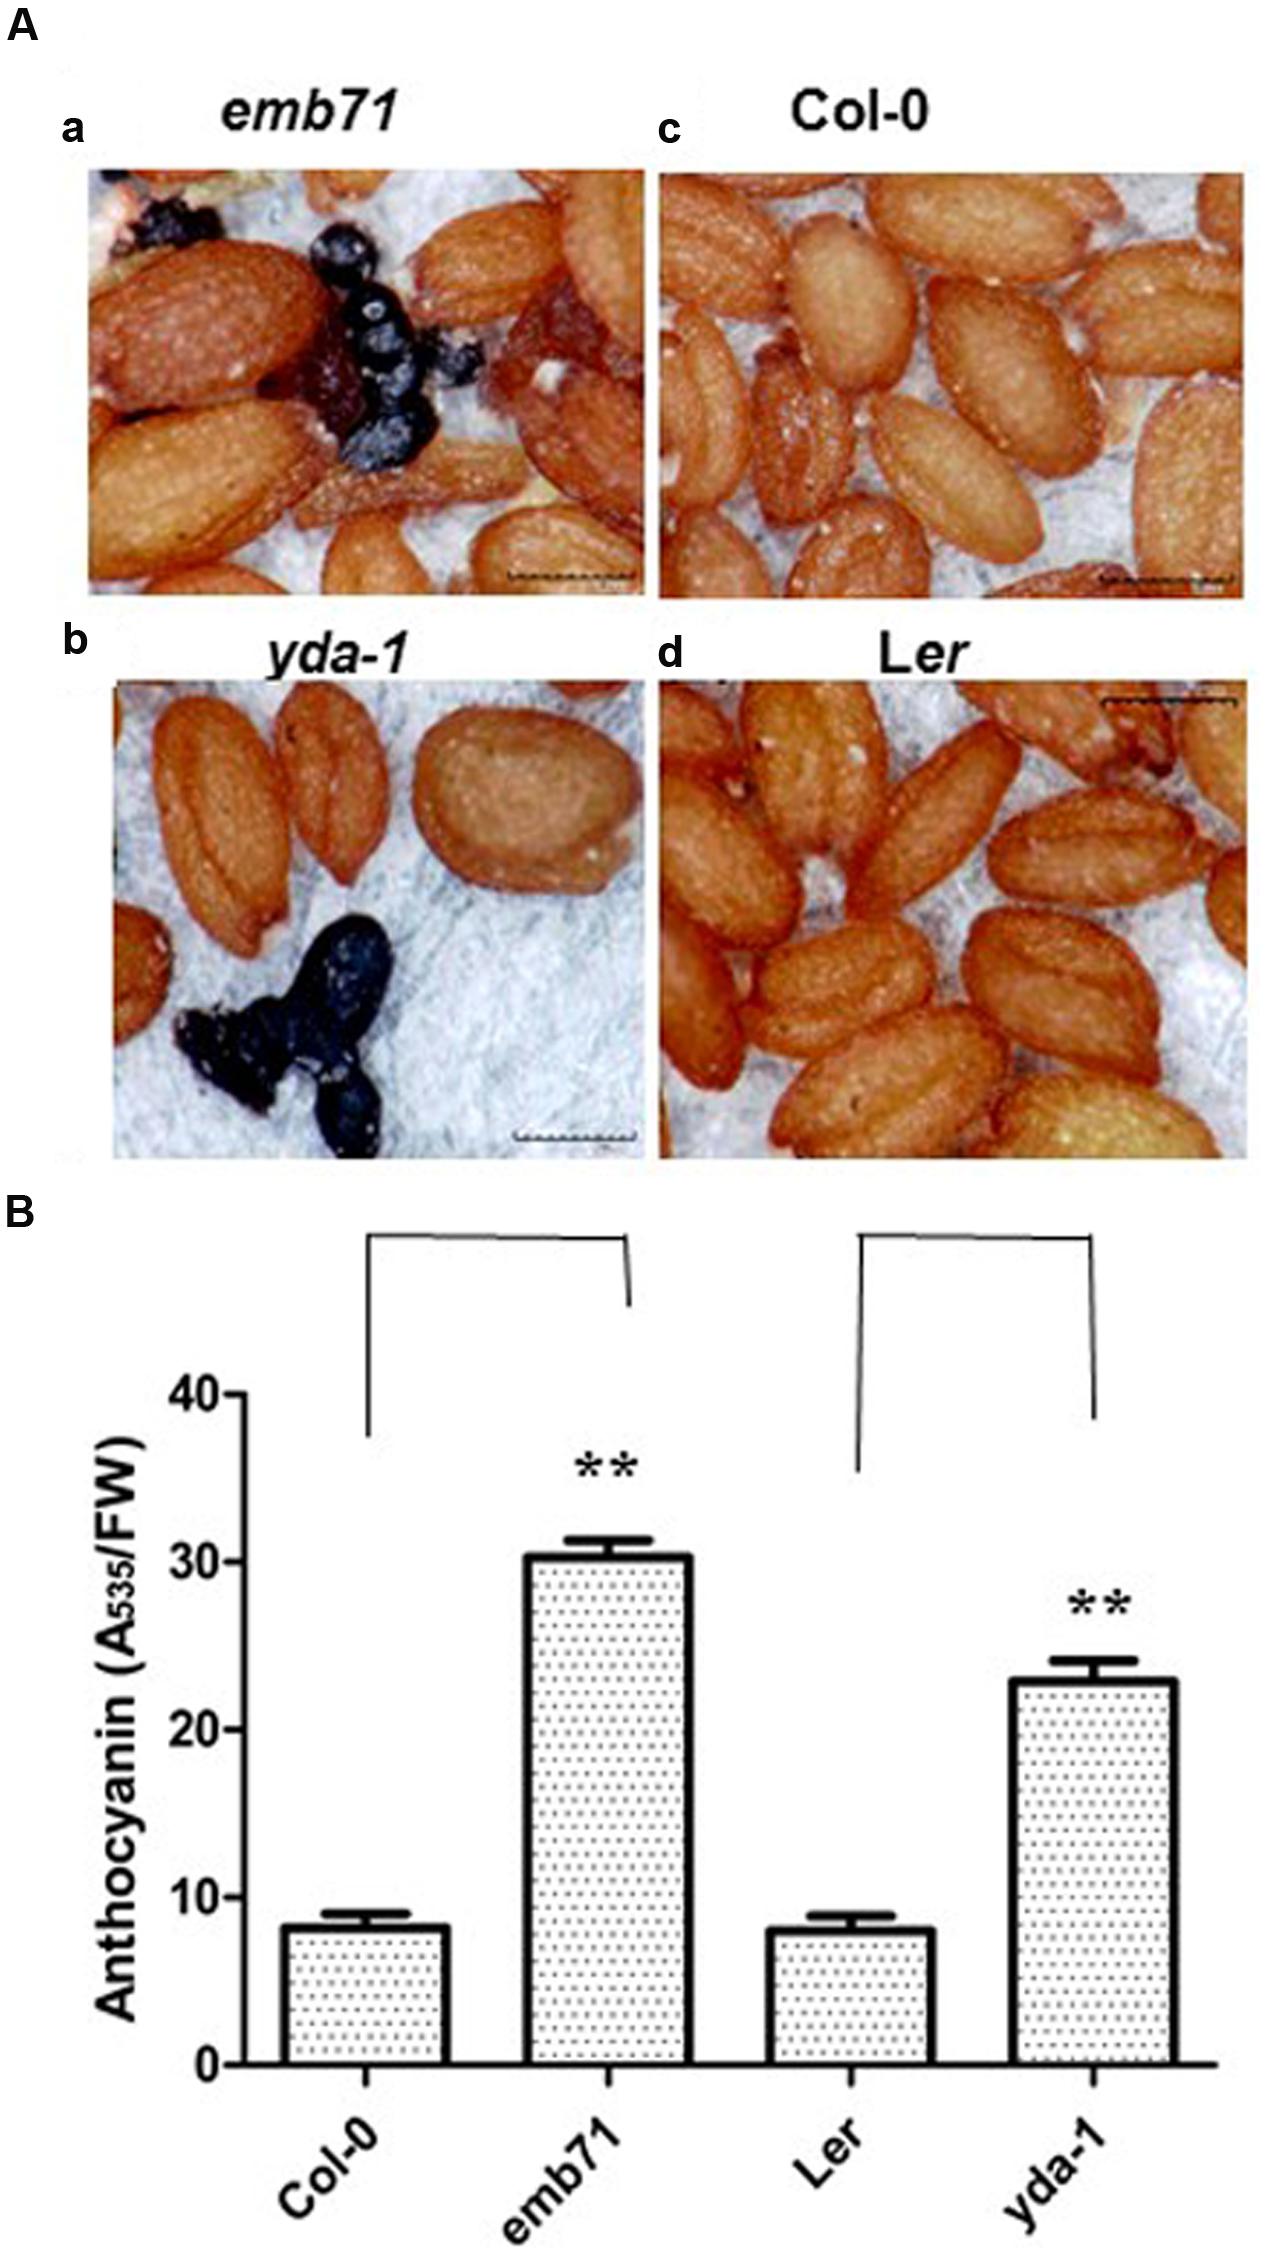
FIGURE 1. yda seeds and seedlings had increased anthocyanin accumulation. (A) Representative mature dry seeds emb71 (a), yda-1 (b), Wild-type (Col-0) (c), and Ler (d). Materials were from at least five independently propagated lines. Magnifications are the same. (B) Bar graph exhibiting the difference in the anthocyanin accumulation between the 12-day-old emb71, yda-1, Wild-type (Col-0) and Ler seedlings grown under white light conditions. Anthocyanin content was assayed via taking the absorbance of plant extracts at 535 nm over grams of fresh weight (FW). Error bars represent SD (n = 8). Heteroscedastic t-test analysis showed significant differences (∗∗P < 0.01). This experiment was repeated at least three times with similar results (biological replicates).
YDA Is a Target Gene of AN3 in the Regulation of Anthocyanin Accumulation
Pertinent experiments were performed to determine whether YDA was directly modulated via AN3 at the transcript level for inducing anthocyanin accumulation. As speculated, the transcript level of YDA was higher in an3-4 seedlings than in wild-type seedlings (Figure 2A). Meanwhile, AN3 transcript accumulation among the Col-0, emb71, yda-1, Ler, and yda-2 seedlings was analyzed. The observations indicated that the AN3 transcript level in wild-type seedlings was comparable with that in mutant seedlings (Figure 2B). Thus, AN3 might negatively regulate the YDA expression at the transcript level.
FIGURE 2
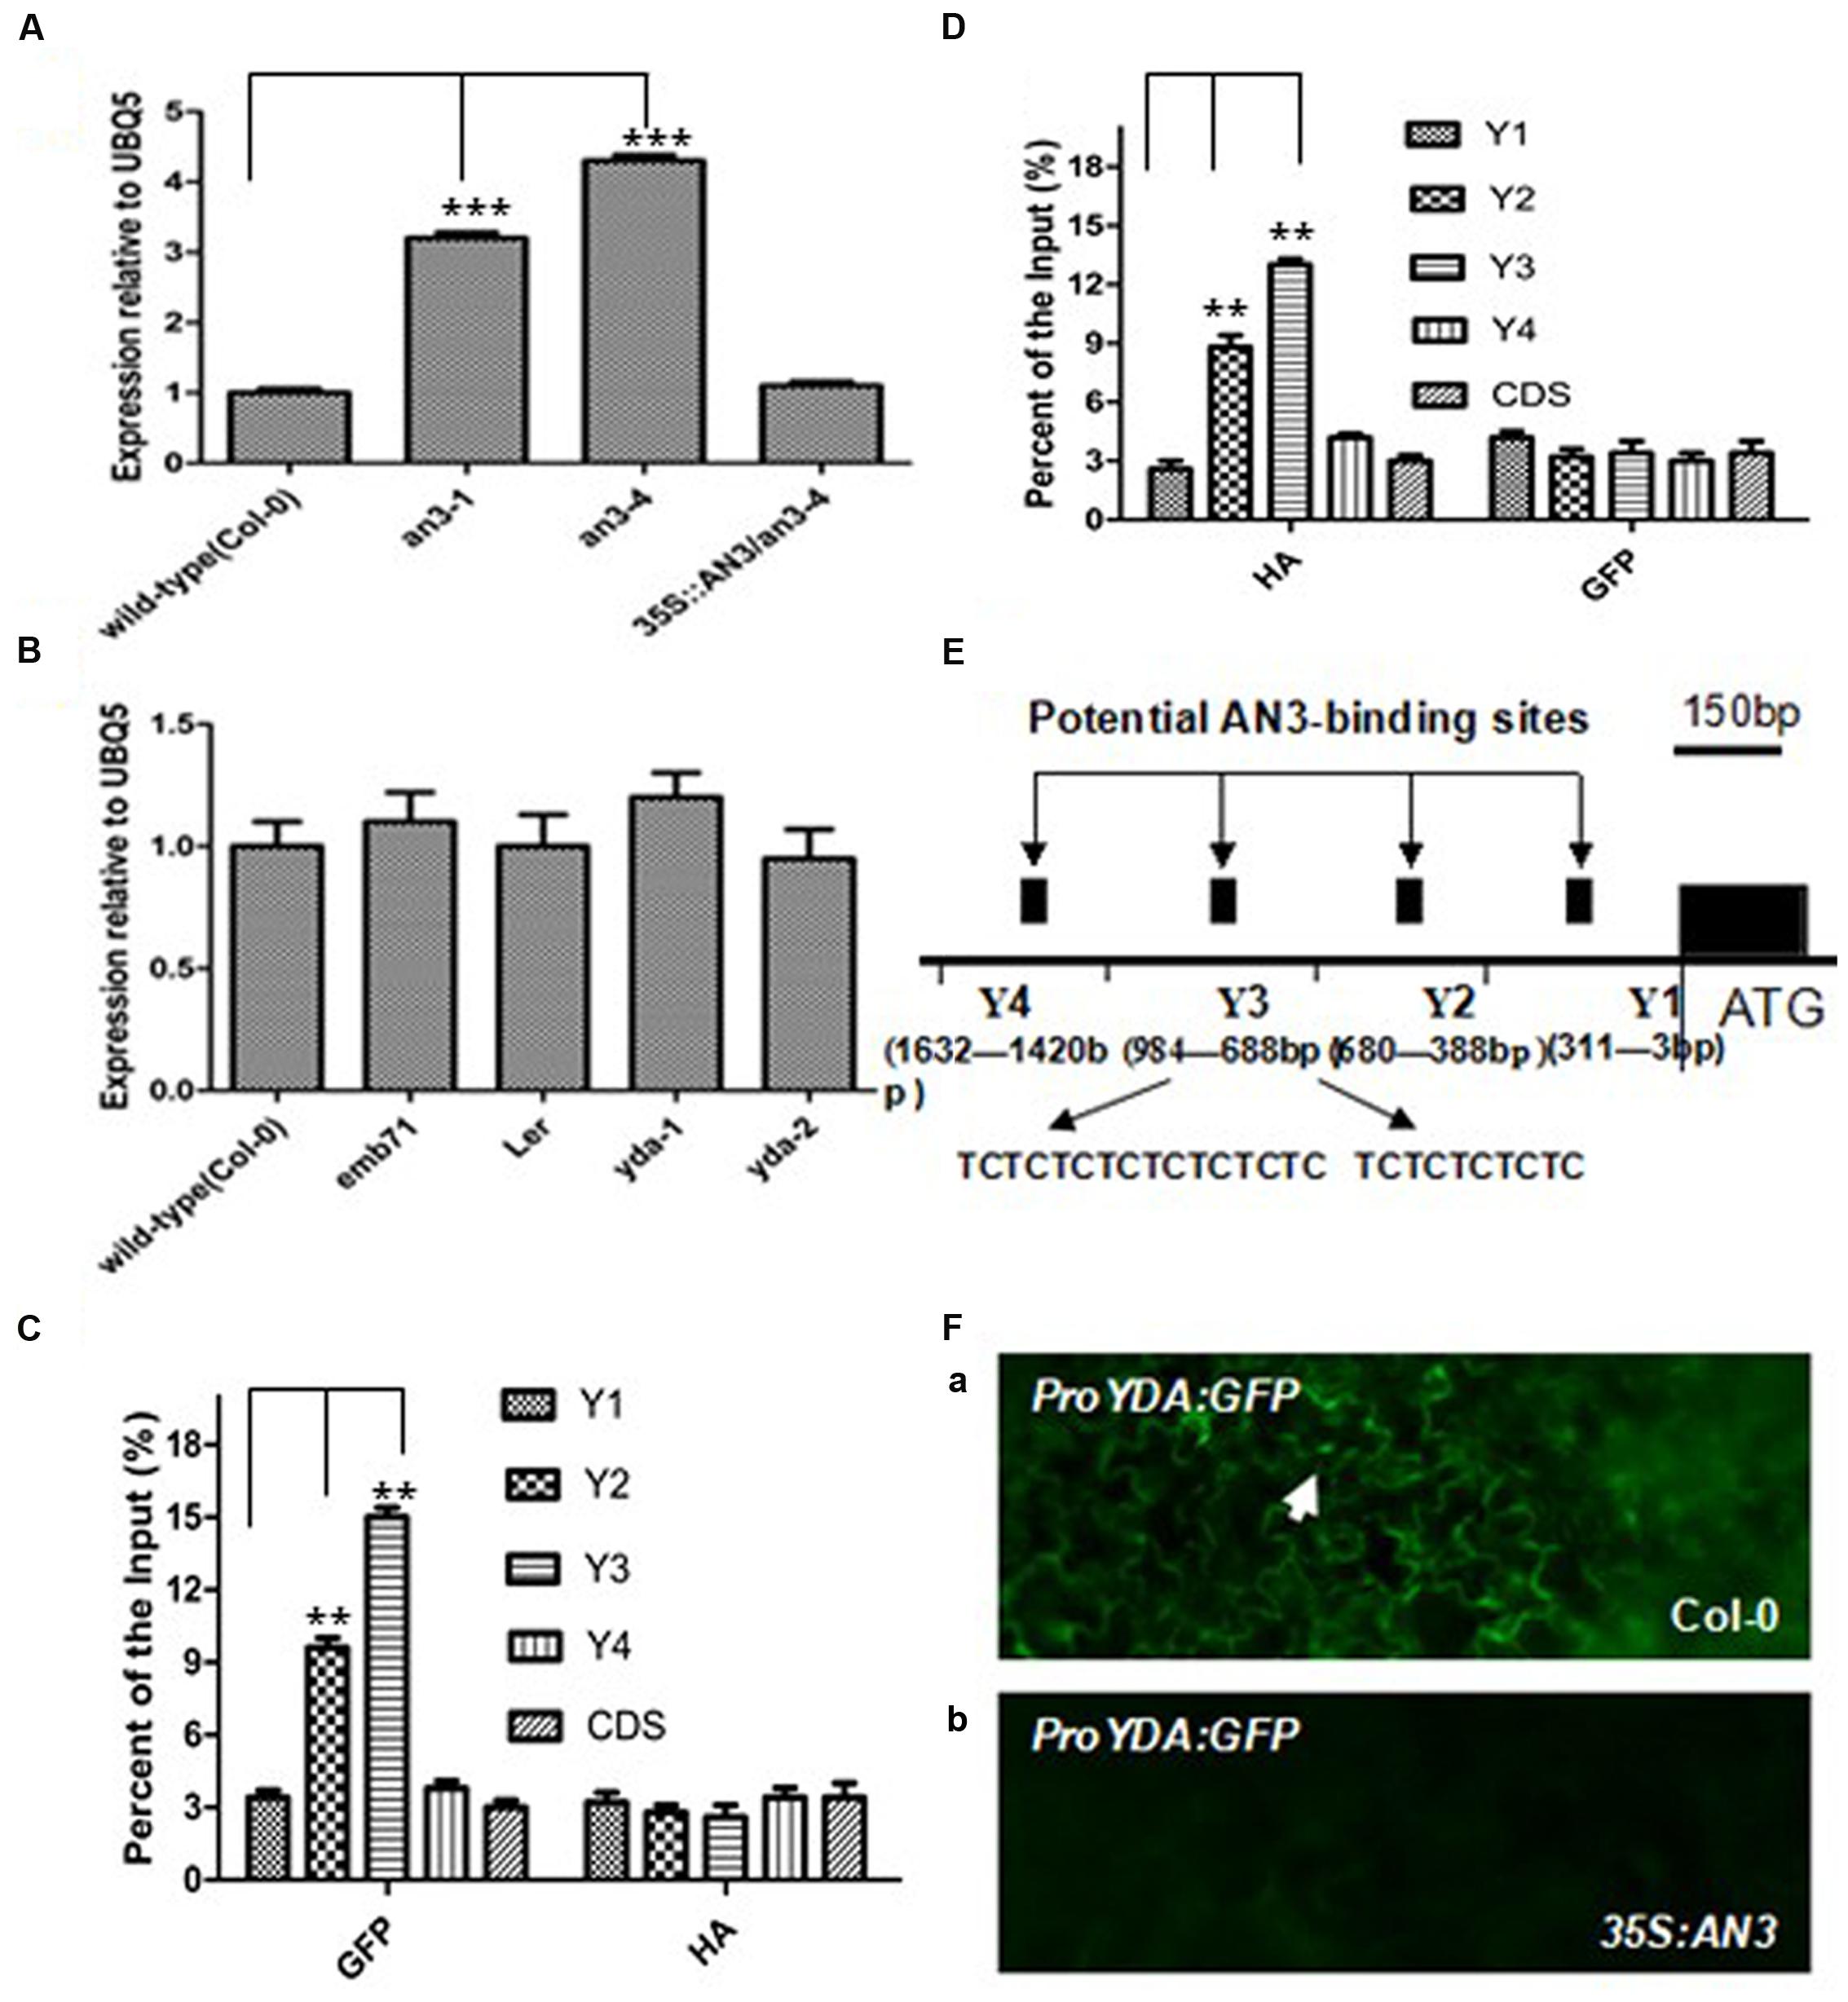
FIGURE 2. AN3 negatively regulates EMB71/YDA expression. (A) Bar graph exhibiting the difference of expression of EMB71/YDA between at least 10 Wild-type (Col-0), an3-1, an3-4, and 35S:AN3/an3-4 seedlings grown under white light conditions. (B) Bar graph exhibiting the difference of expression of AN3 between Wild-type (Col-0), emb71, Ler, yda-1, and yda-2 seedlings grown under white light conditions; Data were from quantitative RT-PCR. Materials were from seedlings of at least five independently propagated lines. And wild-type is set as 1.0. Quantifications were normalized to the expression of UBQ5. Error bars represent SD (n = 3). Heteroscedastic t-test analysis showed significant differences (∗∗∗P < 0.001). In (A,B) these experiments were repeated at least two times with similar results (technical replicates). (C) A chromatin immunoprecipitation (ChIP) analysis. Enrichment of particular YDA chromatin regions with anti-HA antibody (as a control) or anti-GFP antibody in 35S:AN3-3XGFP transgenic plants as detected by real-time PCR analysis. (D) A chromatin immunoprecipitation (ChIP) analysis. Enrichment of particular YDA chromatin regions with anti-GFP antibody (as a control) or anti-HA antibody in 35S:AN3-HA transgenic plants as detected by real-time PCR analysis. Quantifications were normalized to the expression of UBQ5. Error bars represent SD (n = 3). Heteroscedastic t-test analysis showed significant differences (∗∗P < 0.01). Input is set as 100% [supernatant including chromatin (input material) is considered as 100%, immunoprecipitated chromatin/input material X 100% for enrichment product of particular YDA chromatin regions]. In (C,D) these experiments were repeated at least two times with similar results (biological replicates). (E) Schematic of the YDA promoter loci and their amplicons for ChIP analysis. (F) ProYDA:GFP in WT (Col-0) (a) and 35S:AN3 (b) cotyledons. they are at same magnification. White arrows point to GFP-positive nuclei.
The proAN3-GUS expression levels were evidently observed in the meristem region of the Col-0 roots, but were only weakly detected in the differentiation and elongation regions of the Col-0 roots (Figures 3A–C,J). These findings are consistent with those of previous reports (Horiguchi et al., 2005, 2011), that is, the AN3 expressions were more evidently observed in young organs (e.g., young leaf meristem) than in mature organs (e.g., mature leaf blade). Meanwhile, the proYDA-GUS expression levels were significantly observed in the differentiation and elongation regions of the Col-0 roots, but were only weakly detected in the meristem region of the Col-0 roots (Figures 3D–F,K). By contrast, the proYDA-GUS expression levels can be significantly detected in all sections of the an3-4 roots (Figures 3G–I,L). These results confirmed that AN3 negatively regulates YDA at the transcriptional level.
FIGURE 3
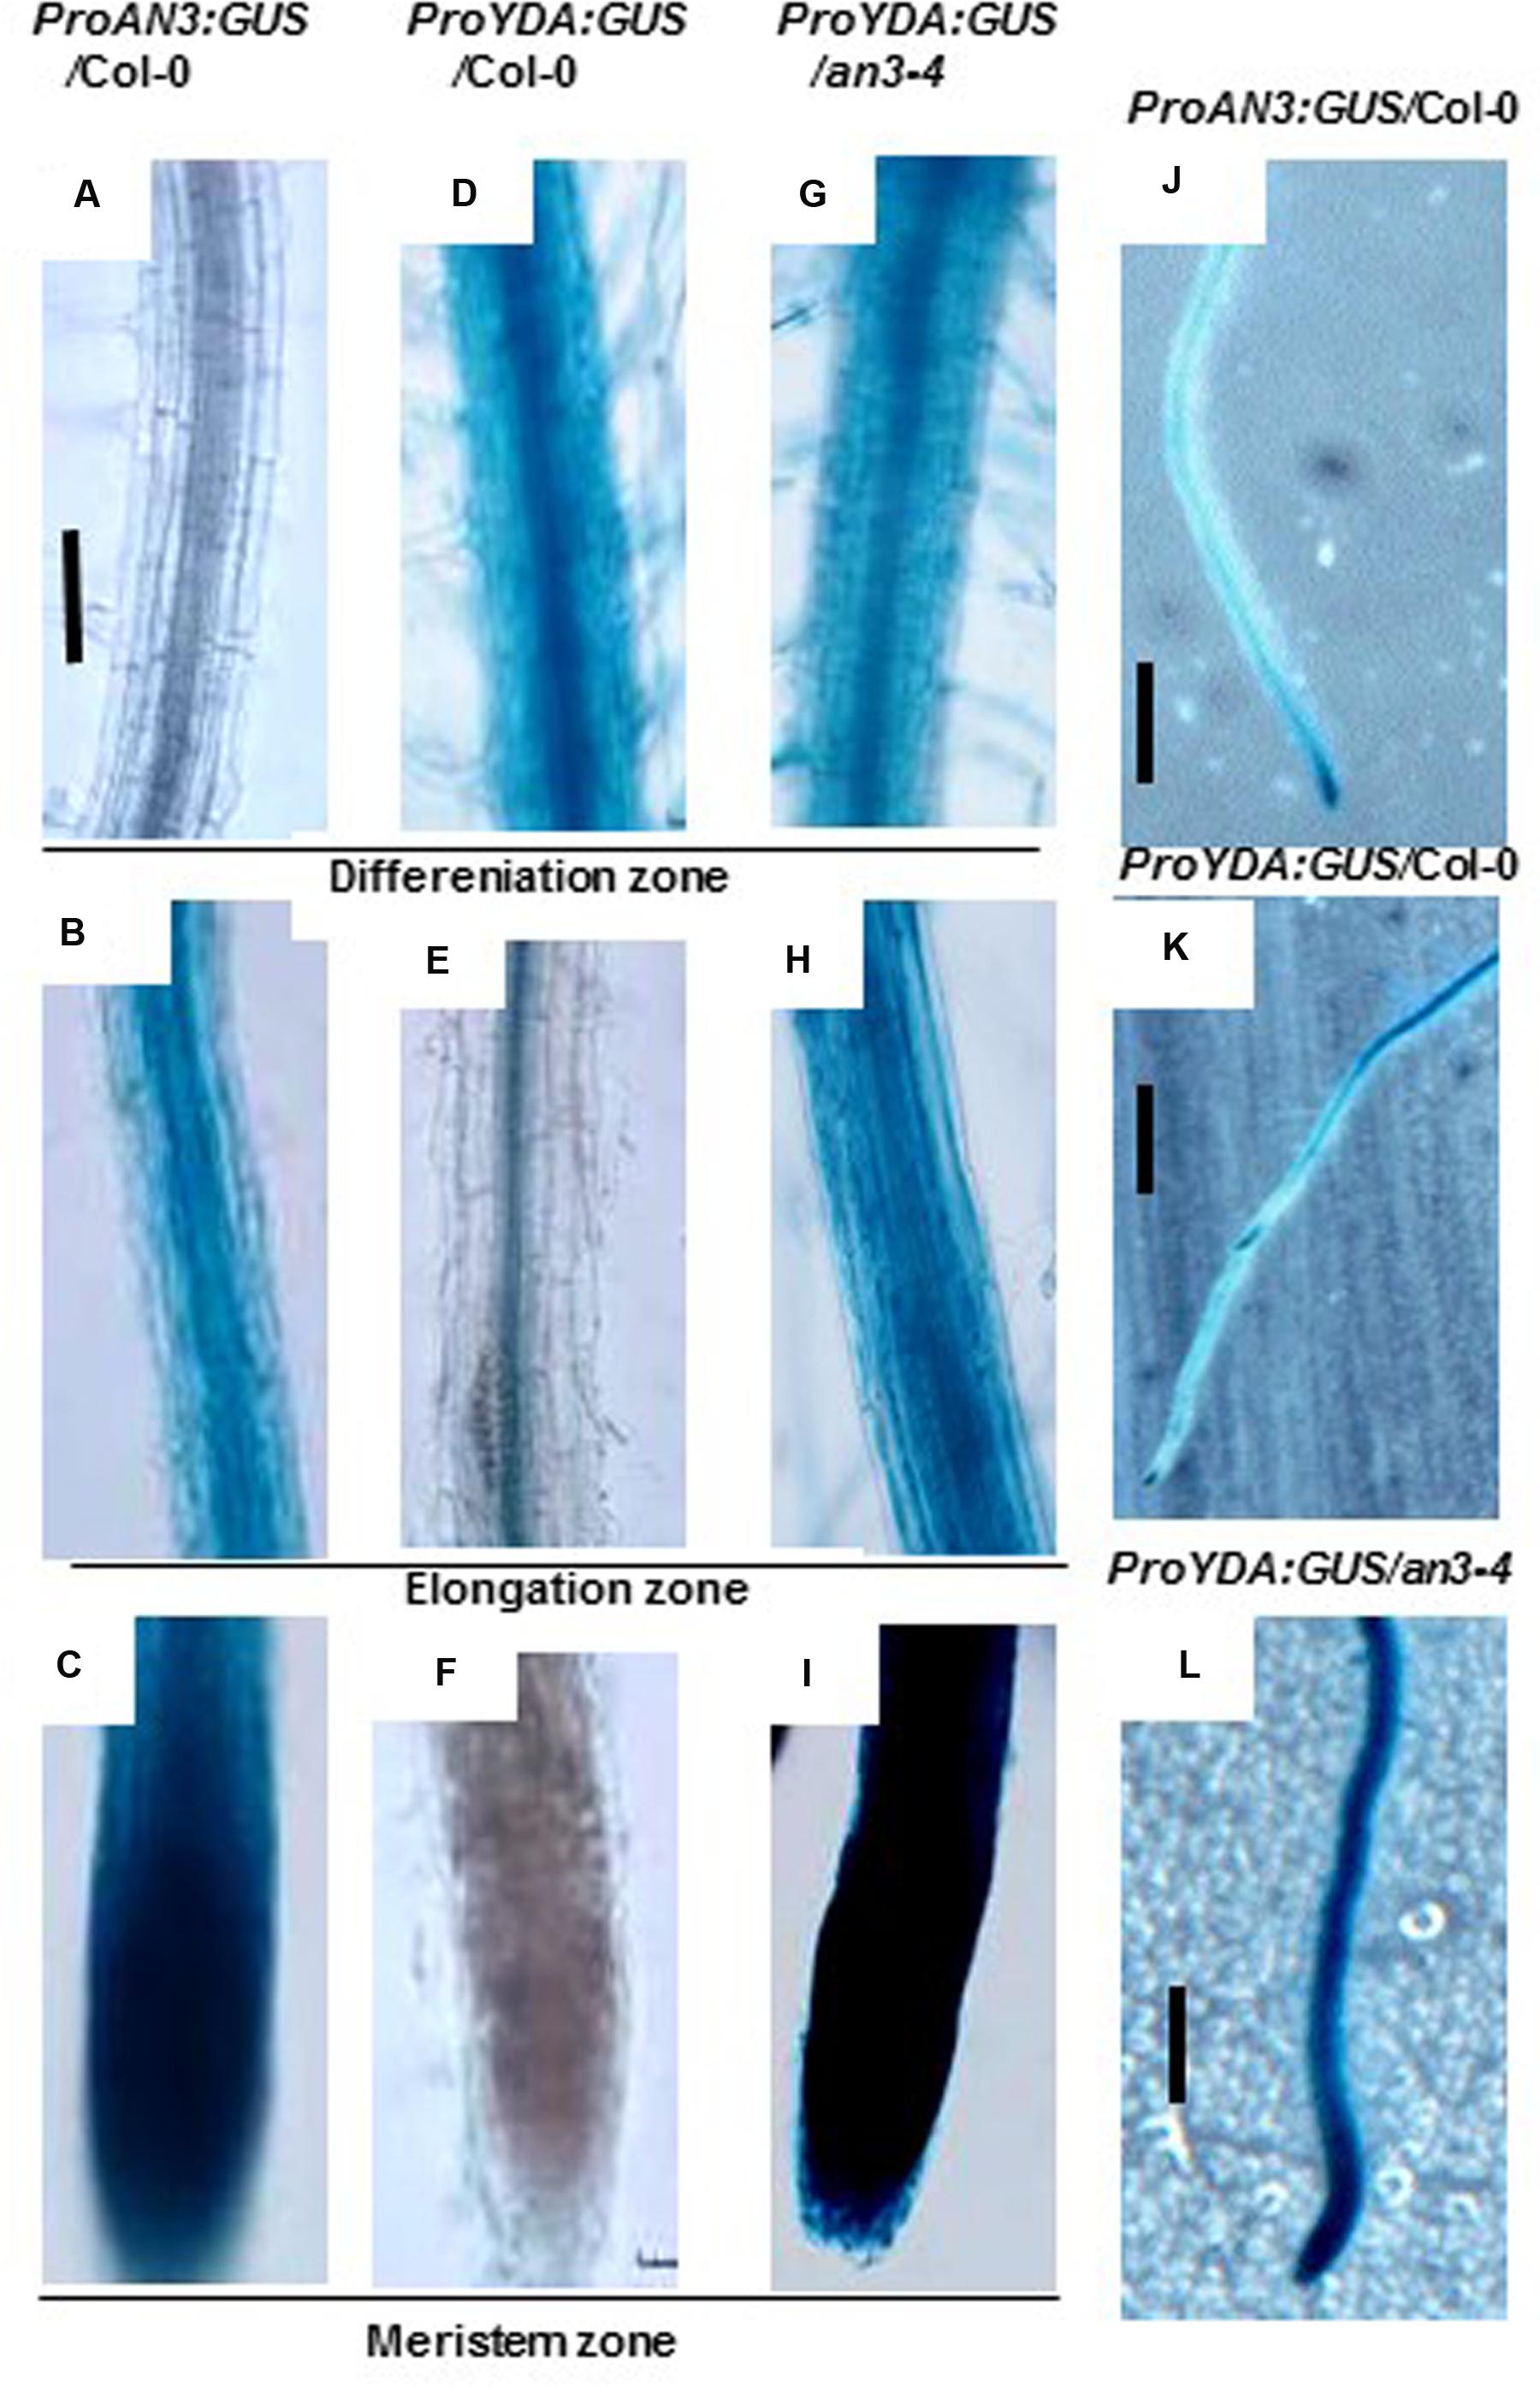
FIGURE 3. AN3 negatively regulates EMB71/YDA expression. (A–C) Representative ProAN3:GUS expression on root differentiation, elongation, and meristem zone in the wild-type background, respectively. (D–F) Representative ProEMB71/YDA:GUS expression on root differentiation, elongation, and meristem zone in the wild-type background, respectively. (G–I) Representative ProEMB71/YDA:GUS expression on root differentiation, elongation, and meristem zone in the an3-4 background, respectively. Bar = 100 um. (J–L) Representative ProAN3:GUS, ProEMB71/YDA:GUS and ProEMB71/YDA:GUS expression on primary roots in the wild-type background, in the wild-type background and in the an3-4 background, respectively. Bar = 2.0 mm. Transgenic plants with GUS were subjected to GUS staining for 8 h.
Figure 2E shows that only a few amplicons exist in the YDA promoter, which is used for chromatin immunoprecipitation (ChIP) analyses. These amplicons have two TCTC motifs (TCTCTCTCTCTCTCTC and TCTCTCTCTC), which span from -850 to -950 (Figure 2E) (Meng, 2015; Meng and Yao, 2015). ChIP-PCR analysis was performed to determine whether AN3 is associated with the YDA promoter of these TCTC motifs. Transgenic seedlings with the 35S:AN3-3XGFP and 35S:AN3-HA constructs were used. Amplicons of Y3 containing two motifs (Meng and Yao, 2015) (TCTCTCTCTC and TCTCTCTCTCTCTCTC), which span from -883 to -893 and from -910 to -934 in the YDA promoter, were highly enriched using the anti-GFP and anti-HA antibodies (Figures 2C,D). The amplicon of Y2, which spans from -388 to -680 in the YDA promoter, was adjacent to, but did not contain, two TCTC motifs, and the amplicons of Y1 and Y4, which span from -3 to -311 and from -1,420 to -1,632 in the YDA promoter, respectively, were distal to two TCTC motifs (Figure 2E). Consequently, region Y3 primers resulted in the largest amount of PCR product, and the amount of PCR amplification product was reduced with primers for region Y2 and even more so with primers for regions Y1, Y4 and CDS (Figures 2C,D). These findings indicate that AN3 is associated with the YDA promoter in vivo, which is necessary for AN3 to suppress YDA expression. In addition, AN3 cannot bind directly to YDA promoter sequences in a gel mobility shift assay in vitro (unpublished data). At 10 days post-germination, wild-type plants (Col-0) can express YDA pro:GFP containing TCTC motifs (10 out of 12), but overexpressing lines (35S:AN3) cannot (0 out of 12; Figure 2Fa,b). Taken together, these findings showed that the TCTC motifs in the YDA promoter are essential for AN3 to suppress the YDA promoter. Indeed, AN3 is associated with the YDA promoter in vivo.
an3 and yda Are Mutants of Sugar Metabolism and/or Sugar Signaling
In determining the type of signaling/metabolism that mediates the AN3-YDA gene cascade pathway, an3 and yda, as signaling/metabolism mutants, should be appropriately classified. Microarray data (Horiguchi et al., 2011) showed many sugar-related genes with at least twofold higher expression levels in the an3-4 seedlings than in the wild-type seedlings. Horiguchi et al. (2011) reported that the altered gene expression in an3-4 plants mostly influenced metabolism, not developmental regulation. Lukowitz et al. (2004) conducted a microarray analysis of yda mutants and indicated that only 14 of 8,000 genes exhibited changes in expression levels of at least twofold, and these genes included those involved in sugar-mediated signaling pathways (AT3G27660), sugar metabolism (AT5G57550, AT2G43570, and AT4G15760), Suc response (AT5G13930) and cell wall synthesis (At2g45220). That is, more than half are closely related to sugar metabolism and/or sugar signaling. In other microarrays of yda mutants (Bergmann et al., 2004), genes encoding the cell wall of differentiated epidermis were extensively reinforced. For example, more than 11% of the genes upregulated in yda mutants are involved in cell wall differentiation. These results indicated that AN3 and YDA might be involved in sugar metabolism and/or sugar signaling.
The growth responses of an3 and yda roots to high concentrations of glucose were assayed to validate this speculation. When grown on MS medium with 1% Suc, the an3 seedlings exhibited an elongated root length compared with the wild-type and complementary lines (35S:AN3/an3-4) (Figures 4Aa,b,B). However, when grown on MS medium with 5% glucose, but not 5% mannitol, the an3 seedlings exhibited a shortened root length compared with the wild-type and complementary lines (35S:AN3/an3-4), indicating that the response of an3 seedlings to high concentrations of glucose was hypersensitive and was metabolic, rather than osmotic, stress (Figures 4Ac–f,B). In addition to glucose sensing, the protein levels of AN3-3XGFP in the 35S:AN3-3XGFP seedlings were lower on solid MS medium with 5% glucose than with 1% Suc (Figure 5A), indicating that a higher concentration of glucose enhances AN3 degradation. Moreover, the an3 mutants have more rosette leaves than the wild-types at bolting [an3-4 mutant = 21.3 ± 2.2, wild-type (Col-0) = 13.3 ± 1.5 (22); ∗∗∗P < 0.001] (Horiguchi et al., 2005), implying that an3 mutants exhibit delayed flowering. Given that the flowering defect indicates the ability of the mutant to counteract the influence of sugars on flowering time (Zhou et al., 1998), whether the enhanced number of rosette leaves in an3 mutant plants can be restored by 5% glucose should be determined. As speculated, the an3 mutant plants had a similar number of rosette leaves to the wild-type plants on solid MS medium with 5% glucose (Figures 5C,D), indicating that the increase in an3 rosette leaf number is dependent on the glucose signal. This phenotype is opposite to glucose insensitive 1, a glucose-insensitive mutant, indicating that flowering time is not delayed by glucose signaling/metabolism (Zhou et al., 1998). In contrast to the an3 mutants, the yda seedlings showed dramatically shortened root length than the Ler seedlings when grown on solid MS medium with 1% Suc (Figures 4Ca,b,D) (Lukowitz et al., 2004). However, when grown on solid MS medium with 5% glucose, but not 5% mannitol, yda plants exhibited an elongated root length compared with Ler plants, implying that the response of yda seedlings to high concentrations of glucose was less sensitive and was metabolic, rather than osmotic, stress (Figures 4Cc–f,D). In addition to glucose sensing, the protein levels of YDA-GFP in the PHB:YDA-GFP seedlings were higher on solid MS with 5% glucose than that with 1% Suc (Figure 5B; Supplementary Figure S2). Notably, the root phenotype of the yda-1 mutant is similar to general carbon starvation brought about by the reduced capacity for Suc catabolism in root cells, such as the loss of starch from the root cap (Figure 5Ea,b), and the extreme reduction in root growth (Figure 4C; Lukowitz et al., 2004), which is due to the suppression of cell elongation in the root elongation zone [Ler = 360 ± 66 μm (n = 82); yda-1 = 220 ± 43 μm (n = 78)].
FIGURE 4
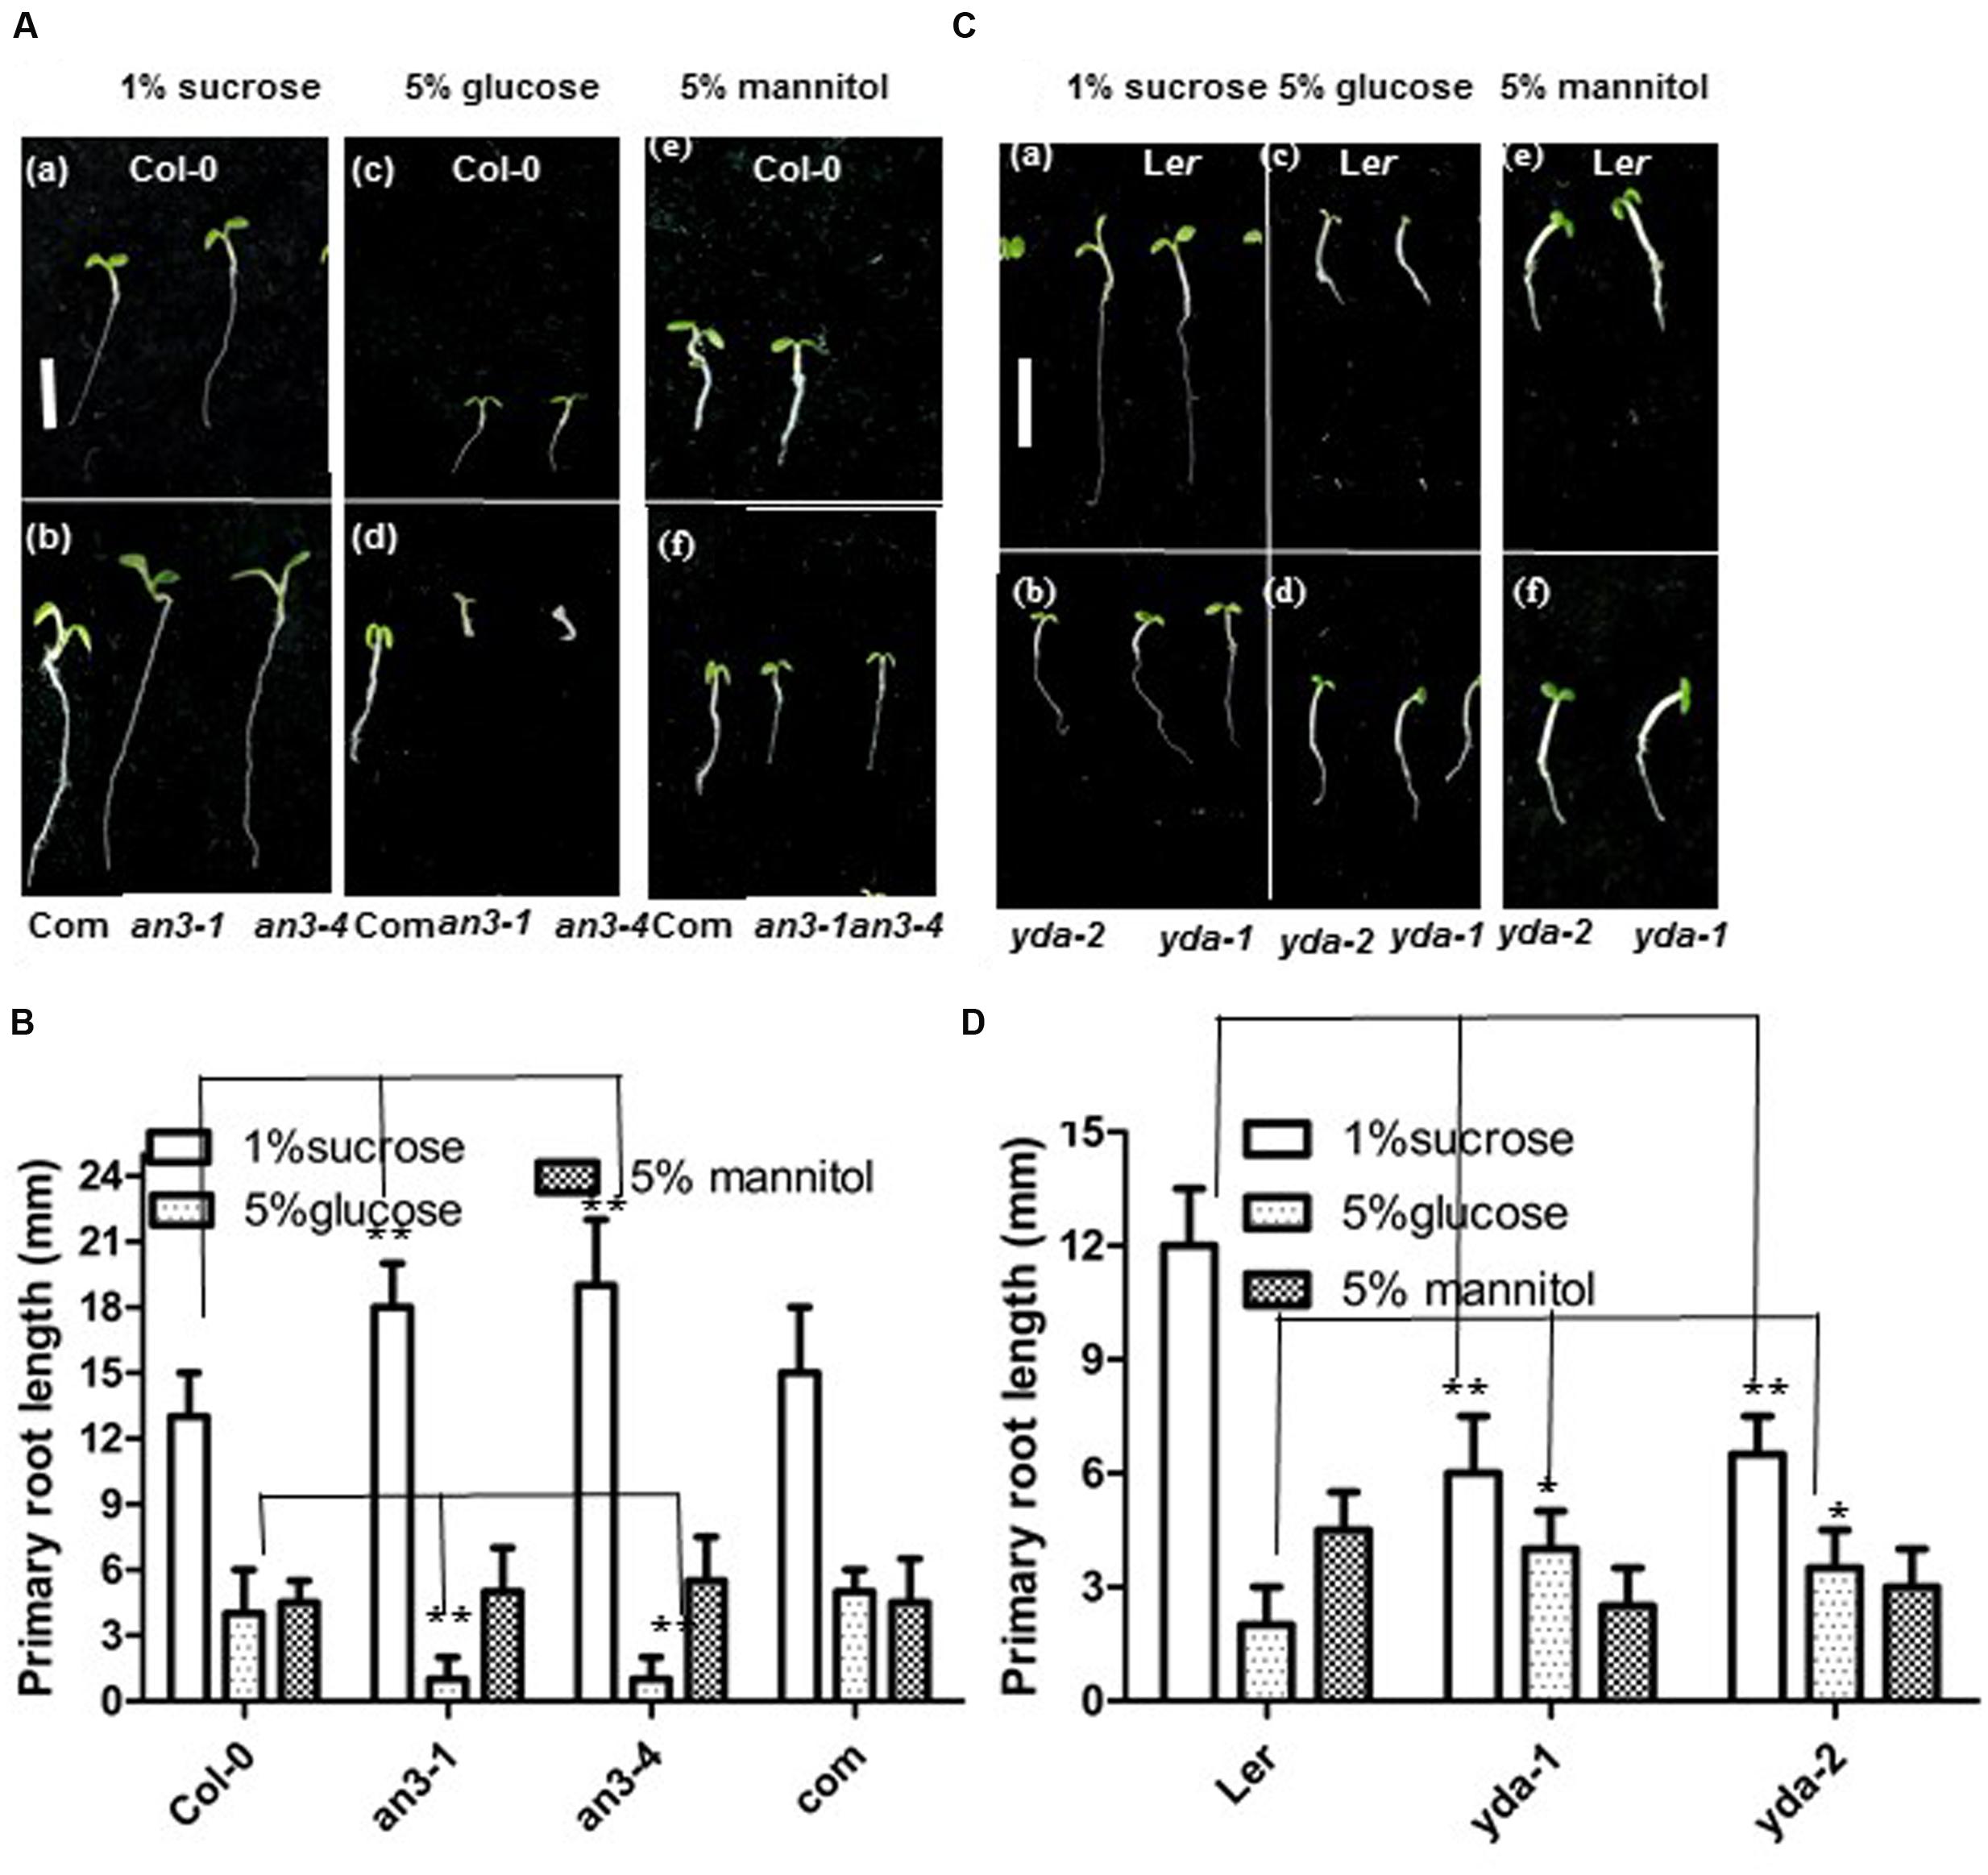
FIGURE 4. AN3 and EMB71/YDA are involved in sugar metabolism and/or sugar signaling. (A) Representative 5-day-old Wild-type (Col-0) (a), complementary line (35S:AN3/an3-4) (b), an3-1 (b) and an3-4 (b) seedlings grown on solid MS medium with 1% sucrose; and 5-day-old Wild-type (Col-0) (c), complementary line (35S:AN3/an3-4) (d), an3-1 (d) and an3-4 (d) seedlings grown on solid MS medium with 5% glucose; and 5-day-old Wild-type (Col-0) (e), complementary line (35S:AN3/an3-4) (f), an3-1 (f), and an3-4 (f) seedlings grown on solid MS medium with 5% mannitol. Bar = 5.0 mm. Com, complementary line. (B) Bar graph exhibiting the difference in the root length between Wild-type (Col-0), an3-1, an3-4 and complementary line (35S:AN3/an3-4) seedlings grown on solid MS medium with 1% sucrose, 5%glucose, and 5% mannitol, respectively. Error bars represent SD (n = 20). Heteroscedastic t-test analysis showed significant differences (∗∗P < 0.01). Experiments were repeated three times with similar results (biological replicates). (C) Representative 5-day-old Ler (a) and yda-1, yda-2 (b) seedlings grown on solid MS medium with 1% sucrose; and 5-day-old Ler (c) and yda-1, yda-2 (d) seedlings grown on solid MS medium with 5% glucose; and 5-day-old Ler (e) and yda-1, yda-2 (f) seedlings grown on solid MS medium with 5% mannitol. Bar = 5.0 mm. (D) Bar graph exhibiting the difference in the root length between Ler, yda-1, and yda-2 seedlings grown on solid MS medium with 1% sucrose, 5% glucose, and 5% mannitol, respectively. Error bars represent SD (n = 20). Heteroscedastic t-test analysis showed significant differences (∗∗P < 0.01; ∗P < 0.05). Experiments were repeated three times with similar results (biological replicates).
FIGURE 5
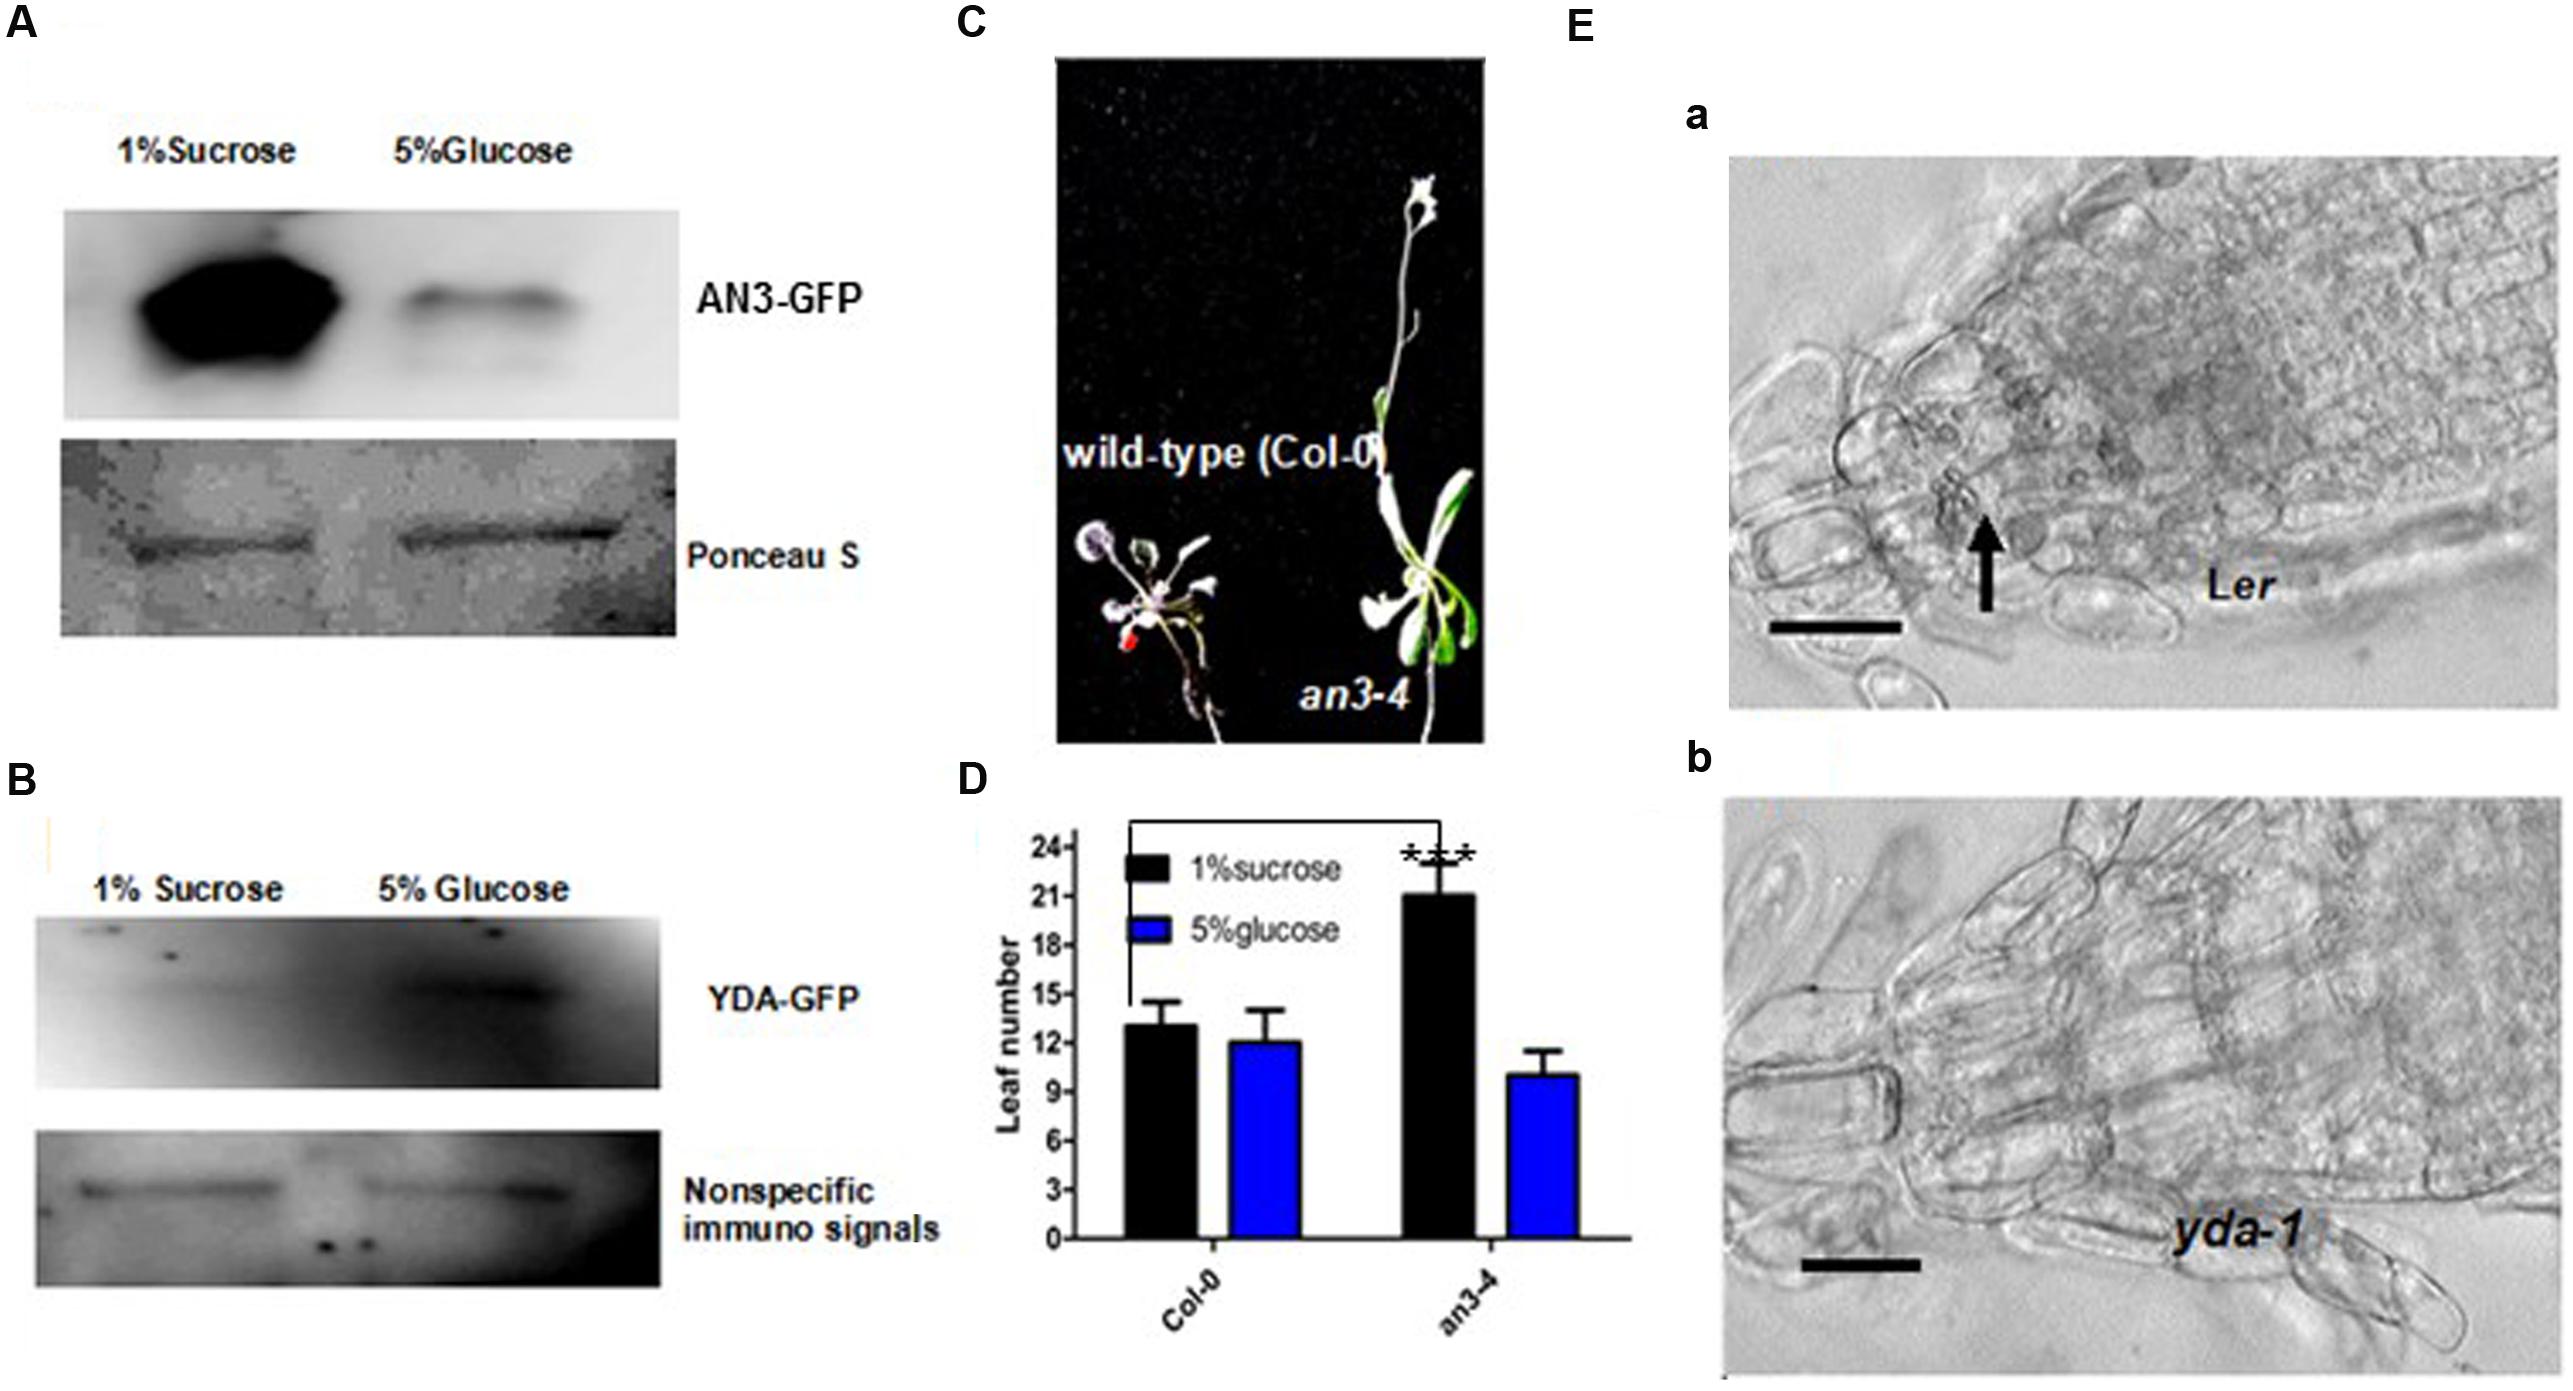
FIGURE 5. AN3 and EMB71/YDA are Involved in Sugar Metabolism and/or Sugar Signaling. (A) Representative 5% glucose treatment accelerates AN3 protein degradation. The 12-day-old 35S:AN3:3X:GFP seedlings grown on solid MS medium with 1% sucrose and 5% glucose. Materials were from at least 10 independently propagated lines. (B) Representative 5% glucose treatment stabilizes EMB71/YDA protein. The 12-day-old PHB:EMB71/YDA:GFP seedlings grown on solid MS medium with 1% sucrose and 5% glucose. Materials were from at least 10 independently propagated lines. (C) Representative 5% glucose can restore the an3-4 delayed flowering. Materials were grown on MS medium with 5% glucose for 4 weeks under long light (16 h light/8 h dark). Seedlings were from the same plate. Magnifications are the same. (D) Bar graph exhibiting the difference in the rosette leaf number between Wild-type (Col-0) and an3-4 seedlings grown on solid MS medium with 1% sucrose and 5% glucose for 4 weeks under long light (16 h light/8 h dark). Error bars represent SD (n = 12). Heteroscedastic t-test analysis showed significant differences (∗∗∗P < 0.001). Experiments were repeated two times with similar results (biological replicates). (E) Longitudinal sections of roots of 8-day-old Ler (a) and yda-1 (b) seedlings. Seedlings were from the same plate. Magnifications are the same. Results are typical of those for many seedling. The arrow indicates starch grains.
an3 and yda Are Not Other Plant Hormone Signaling/Metabolism Mutants
Given that plant hormones, such as auxin and abscisic acid (Jeong et al., 2004; Hoth et al., 2010), cytokinin (Deikman and Hammer, 1995) and gibberellins (Weiss et al., 1995), differentially regulate anthocyanin biosynthesis in whole plants and in cell suspensions (Ozeki and Komamine, 1986), whether an3 and yda are the signaling mutants of these plant hormones should be determined. The responses of an3-1 roots to exogenously applied hormones were assessed, and the responses of the assayed hormones (i.e., ABA, GA, IAA, NAA, KT, and 6-BA) did not significantly restore the growth defects of an3-1 roots (Supplementary Figure S3). Similarly, general hormone signaling did not restore the growth defect of yda roots, as proposed in a previous study (Lukowitz et al., 2004). Taken together, these findings indicated that an3 and yda are sugar signaling/metabolism mutants, but not other plant hormone signaling mutants.
The Decreased or Increased Anthocyanin Accumulation in the an3 or yda Mutants Is a Result of the Decreased or Increased Endogenous Suc Accumulation, Respectively
Given that sugar is an important regulator of the expression of genes encoding metabolic enzymes and proteins involved in anthocyanin biosynthesis (Baier et al., 2004), and the results indicate that an3 and yda are sugar signaling/metabolism mutants, whether lower or higher anthocyanin accumulation in the an3 and yda mutants is caused by lower or higher endogenous sugar accumulation, respectively, should be determined. The measurement of sugar metabolites in an3, Col-0, Ler, yda-1, and yda-2 seedlings was conducted using HPLC analysis. The results revealed that the concentrations of Suc and glucose, but not fructose, were significantly reduced in an3 seedlings than in Col-0 seedlings (Figures 6A–C), whereas the concentrations of Suc, but not fructose and glucose, were higher in yda seedlings than in Ler seedlings (Figures 6E–G). The anthocyanin biosynthetic pathways are strongly up-modulated along with Suc concentration, and the sugar-dependent upregulation of the anthocyanin synthesis pathway is Suc specific (Solfanelli et al., 2006; Jeong et al., 2010). Therefore, the lower Suc concentration in an3 seedlings might specifically cause the lower anthocyanin accumulation, whereas the higher Suc concentration in yda seedlings might specifically cause the higher anthocyanin accumulation. Given that plant hormones, such as auxin and abscisic acid (Jeong et al., 2004; Hoth et al., 2010), cytokinin (Deikman and Hammer, 1995), gibberellins (Weiss et al., 1995) and ethylene (Morgan and Drew, 1997; Jeong et al., 2010), differentially regulate anthocyanin biosynthesis in whole plants and in cell suspensions (Ozeki and Komamine, 1986), whether an3 and yda are the signaling/metabolism mutants of these plant hormones should be determined (Lukowitz et al., 2004). Therefore, the decreased or increased anthocyanin accumulation in the an3 or yda mutants is mainly caused by the decreased or increased endogenous Suc concentration, respectively.
FIGURE 6
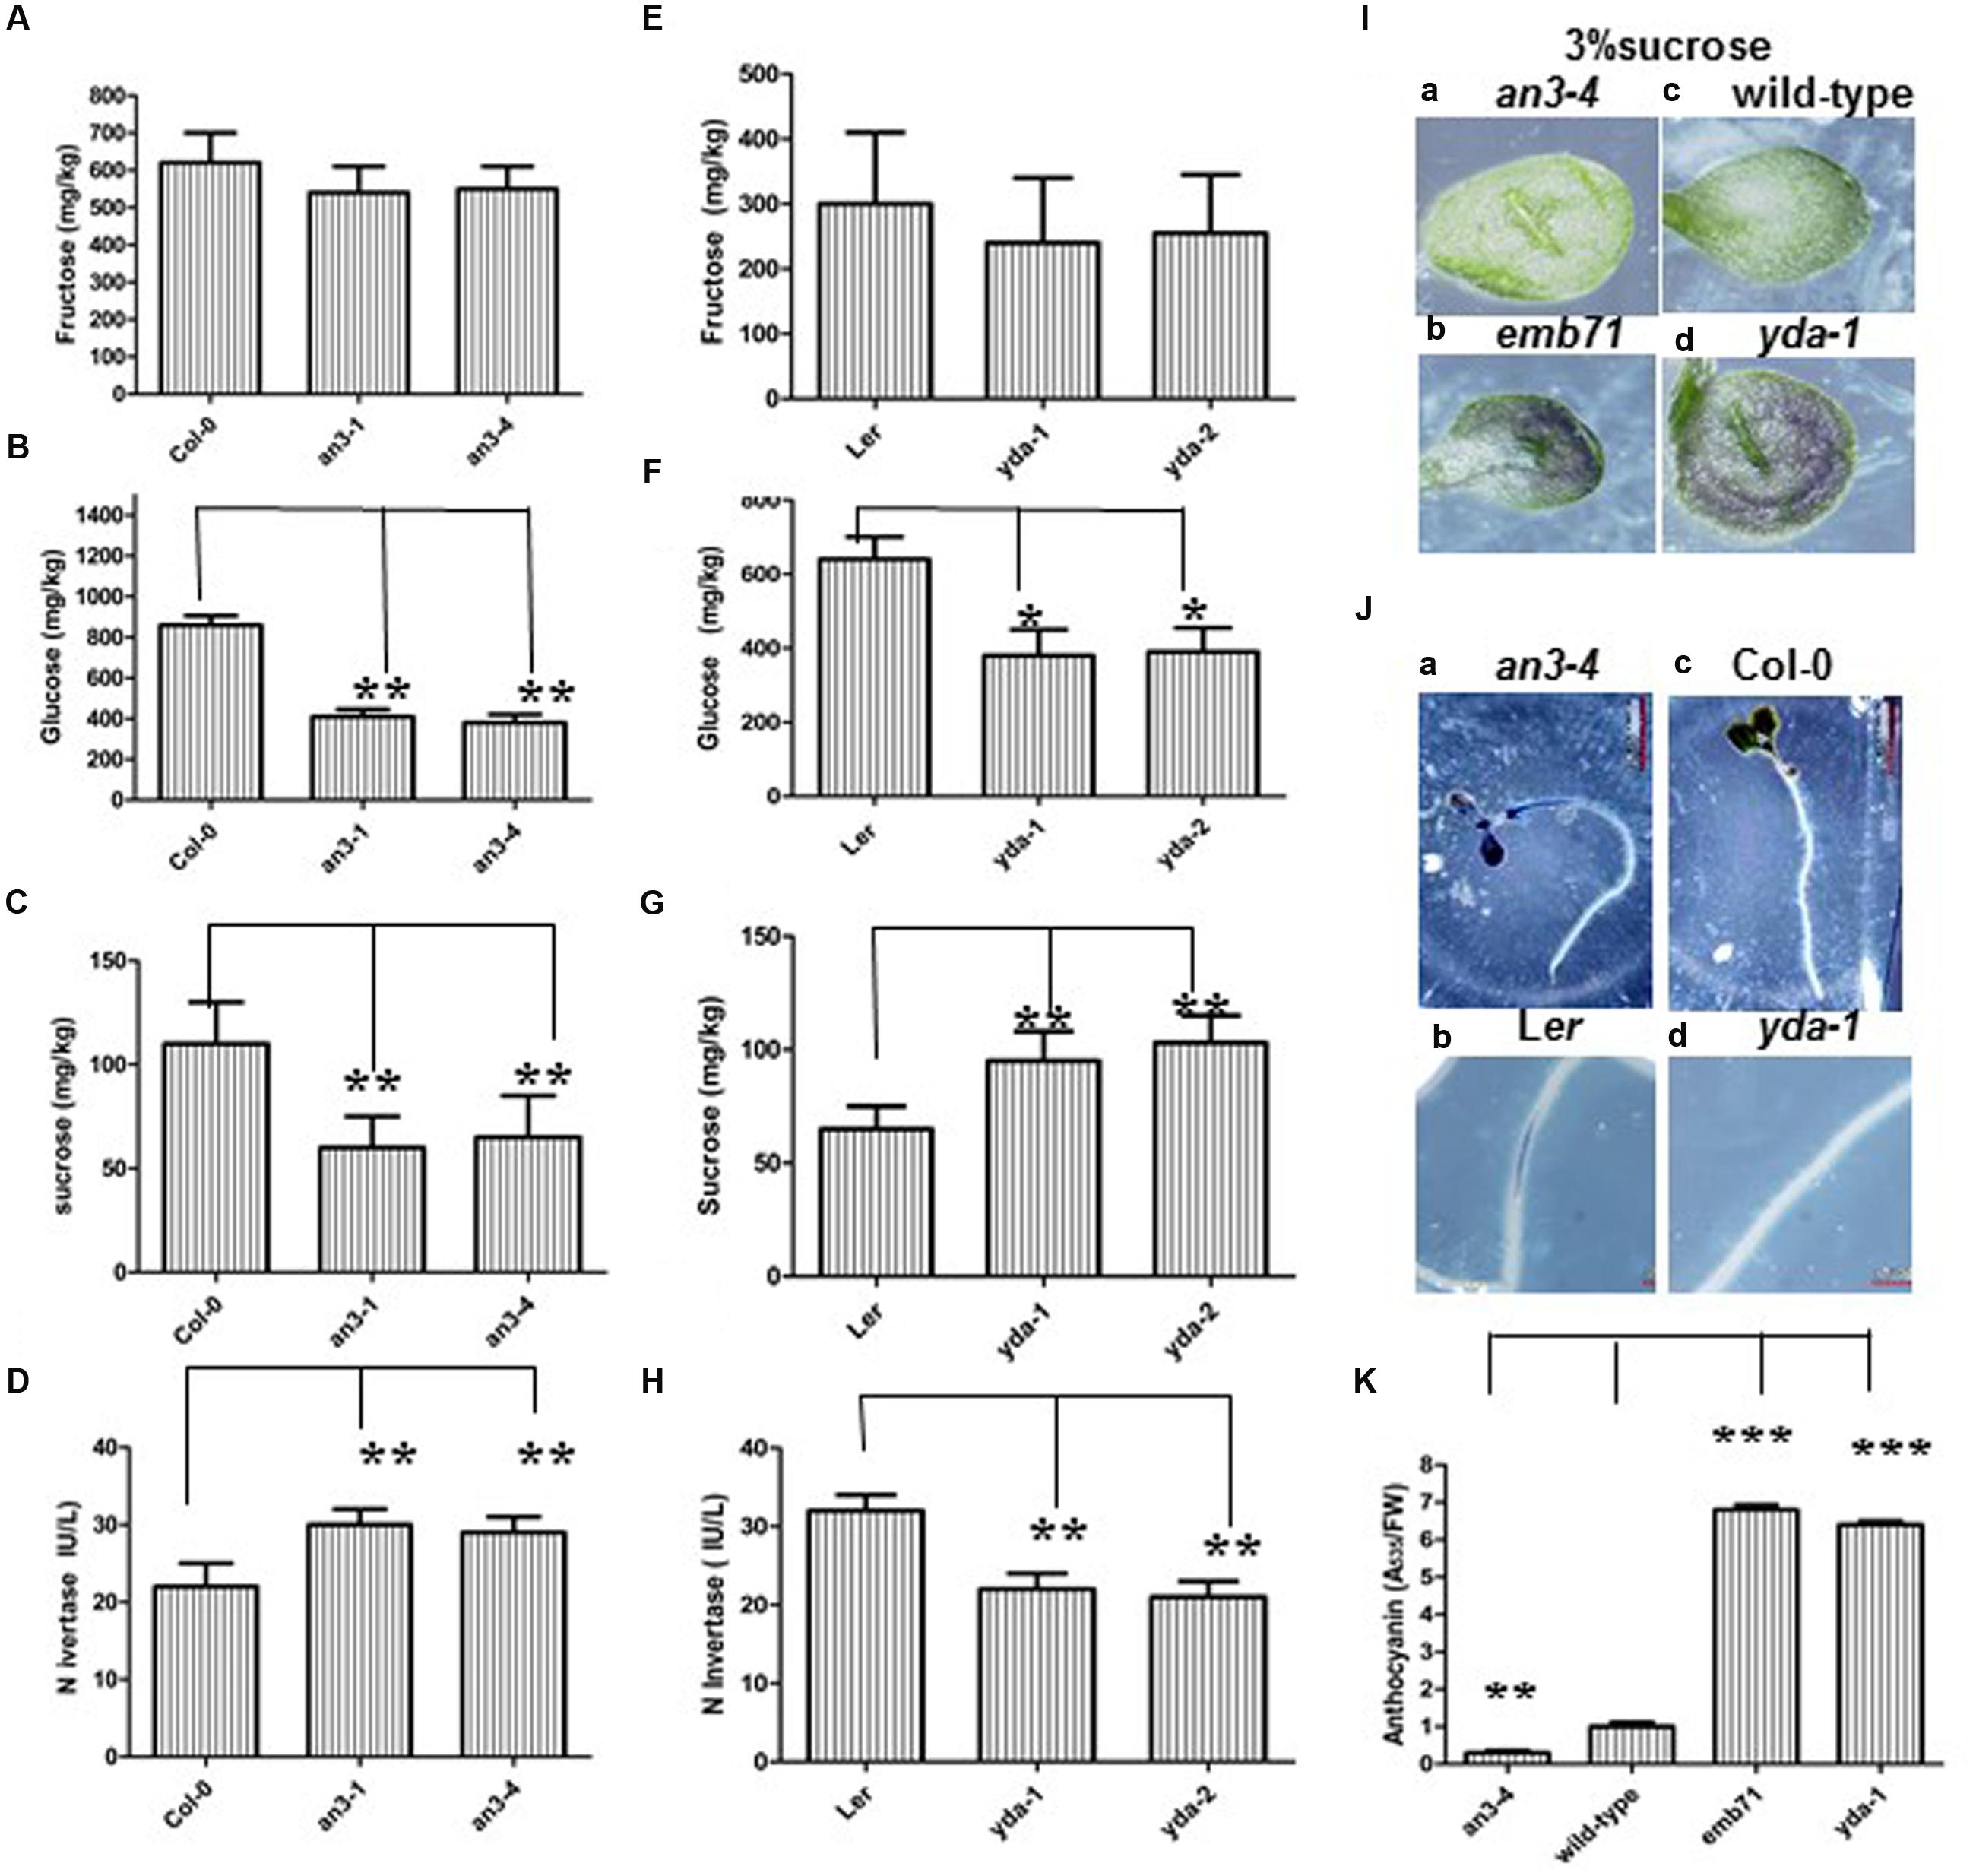
FIGURE 6. Abnormal Anthocyanin Accumulation in an3 and yda Mutants is Caused by Abnormal Endogenous Sucrose Accumulation. (A–C) Bar graph exhibiting the difference of concentrations of hexose (glucose and fructose) (A,B) and sucrose (C) between Wild-type (Col-0), an3-1 and an3-4 seedlings. (D) Bar graph exhibiting the difference of the invertase activity between Wild-type (Col-0), an3-1 and an3-4 seedlings. IU/L indicates that seedling mixture per liter can produce the number of the invertase activity. (E–G) Bar graph exhibiting the difference of concentrations of hexose (glucose and fructose) (E,F) and sucrose (G) between Ler, yda-1 and yda-2 seedlings. (H) Bar graph exhibiting the difference of the invertase activity between Ler, yda-1 and yda-2 seedlings. IU/L indicates that seedling mixture per liter can produce the number of the invertase activity. The above seedlings were grown under long light (16L/8D) conditions on MS medium supplemented with 1% sucrose, respectively. Error bars represent SD (n = 3). Heteroscedastic t-test analysis showed significant differences (∗∗P < 0.01; ∗P < 0.05). Experiments were repeated two times with similar results (biological replicates). (I) Representative cotyledons of the 8-day-old an3-4 (a), emb71 (b), wild-type (c), and yda-1 (d) seedlings grown under long light (16L/8D) conditions on MS medium supplemented with 3% sucrose. (J) Representative nitroblue tetrazolium (NBT) precipitation in the 6-day-old an3-4 (a), Ler (b), Col-0 (c), and yda-1 (d) roots grown under long light (16L/8D) conditions on MS medium supplemented with 1% sucrose. Magnifications are the same. (K) Bar graph exhibiting the difference in the anthocyanin accumulation between the an3-4, Wild-type (Col-0), emb71 and yda-1 cotyledons grown under white light conditions on MS medium supplemented with 3% sucrose. Total amount of anthocyanin content in per gram fresh weight of Col-0 seedlings is 8.2. Wild-type (Col-0) is set as 1.0. Error bars represent SD (n = 3). Heteroscedastic t-test analysis showed significant differences (∗∗∗P < 0.001; ∗∗P < 0.01). Experiments were repeated two times with similar results (technical replicates).
Exogenous Suc is applied in high concentrations to confirm this finding. That is, when grown on solid MS medium supplemented with 1% Suc, evident differences in anthocyanin accumulation can be observed on the epidermis of the abaxial side of leaves among the control, an3 and yda seedlings (Supplementary Figure S1) (Meng, 2015). When grown on solid MS medium supplemented with 3% Suc, more evident differences can be detected on the epidermis of the corresponding organs among the control, an3 and yda seedlings. That is, the epidermis of the abaxial side of the leaves of an3-4 seedlings had lower anthocyanin accumulation than that of control seedlings, whereas the epidermis of the abaxial side of the leaves of emb71 or yda-1 seedlings had higher anthocyanin accumulation than that of control seedlings (Figures 6Ia–d,K). However, when grown on solid MS medium supplemented with 5% Suc, no evident differences in anthocyanin accumulation can be detected on the epidermis of the corresponding organs among the an3, wild-type and yda seedlings (Supplementary Figure S4), indicating that 5% Suc can restore abnormal anthocyanin accumulation in an3 and yda mutants. Taken together, these results indicated that the decreased or increased anthocyanin accumulation in the an3 or yda mutants is mainly caused by the decreased or increased endogenous Suc accumulation, respectively.
The Decreased or Increased Endogenous Suc Accumulation in the an3 or yda Mutants Are Due to the Increased or Decreased INV Activity, Respectively
Given that the entry of carbon from Suc into cellular metabolism in plants can potentially be catalyzed by INV (Lou et al., 2007), whether the decreased or increased endogenous Suc accumulation in the an3 or yda mutant seedlings are caused by the increased or decreased INV activity, respectively, should be determined. Neutral INV is required for normal plant growth and development in Arabidopsis (Barratt et al., 2009), rice (Jia et al., 2008), and legumes (Welham et al., 2009). Neutral INV activity was assayed by ELISA. These findings indicated that the neutral INV activity in the an3 and yda mutants was, on average, enhanced and reduced by approximately 30% and approximately 24%, respectively, compared with that in the controls (Figures 6D,H), implying that the lack of AN3 and YDA activities might increase and decrease INV activity, respectively. Cell wall INV activity was determined to confirm this finding. NBT precipitate was observed in the elongation zone of an3-4 roots, but not in the corresponding organs of wild-type roots (Figure 6Ja,c). By contrast, NBT precipitate was observed in the elongation zone of Ler roots, but not in the corresponding organs of yda-1 roots (Figure 6Jb,d). Controlled incubation of the an3-4 mutant, wild-type, yda-1 mutant and Ler roots, which removed Suc, did not stain for INV (data not shown). The precipitate specifically indicates that cell wall INV has higher activity in the an3-4 mutant than in the wild-type roots, whereas cell wall INV has lower activity in the yda-1 mutant than in the Ler roots. Taken together, these experimental results indicated that the lower endogenous Suc accumulation in the an3 mutants was mainly caused by the enhanced INV activity, whereas the higher endogenous Suc accumulation in the yda mutants was mainly caused by the reduced INV activity.
AN3 Acts Genetically Upstream of YDA in Regulating Anthocyanin Accumulation
The response of an3-4 seedlings was hypersensitivity to high concentrations of glucose, whereas that of yda-1 seedlings was less sensitivity to high concentrations of glucose (Figures 7A,B). The an3-4 and yda-1 mutants were less sensitive to high concentrations of glucose, which is comparable with the response of yda-1 seedlings (Figures 7A,B). These findings indicated that YDA mutation inhibits the hypersensitivity of the an3-4 mutant to high concentrations of glucose.
FIGURE 7
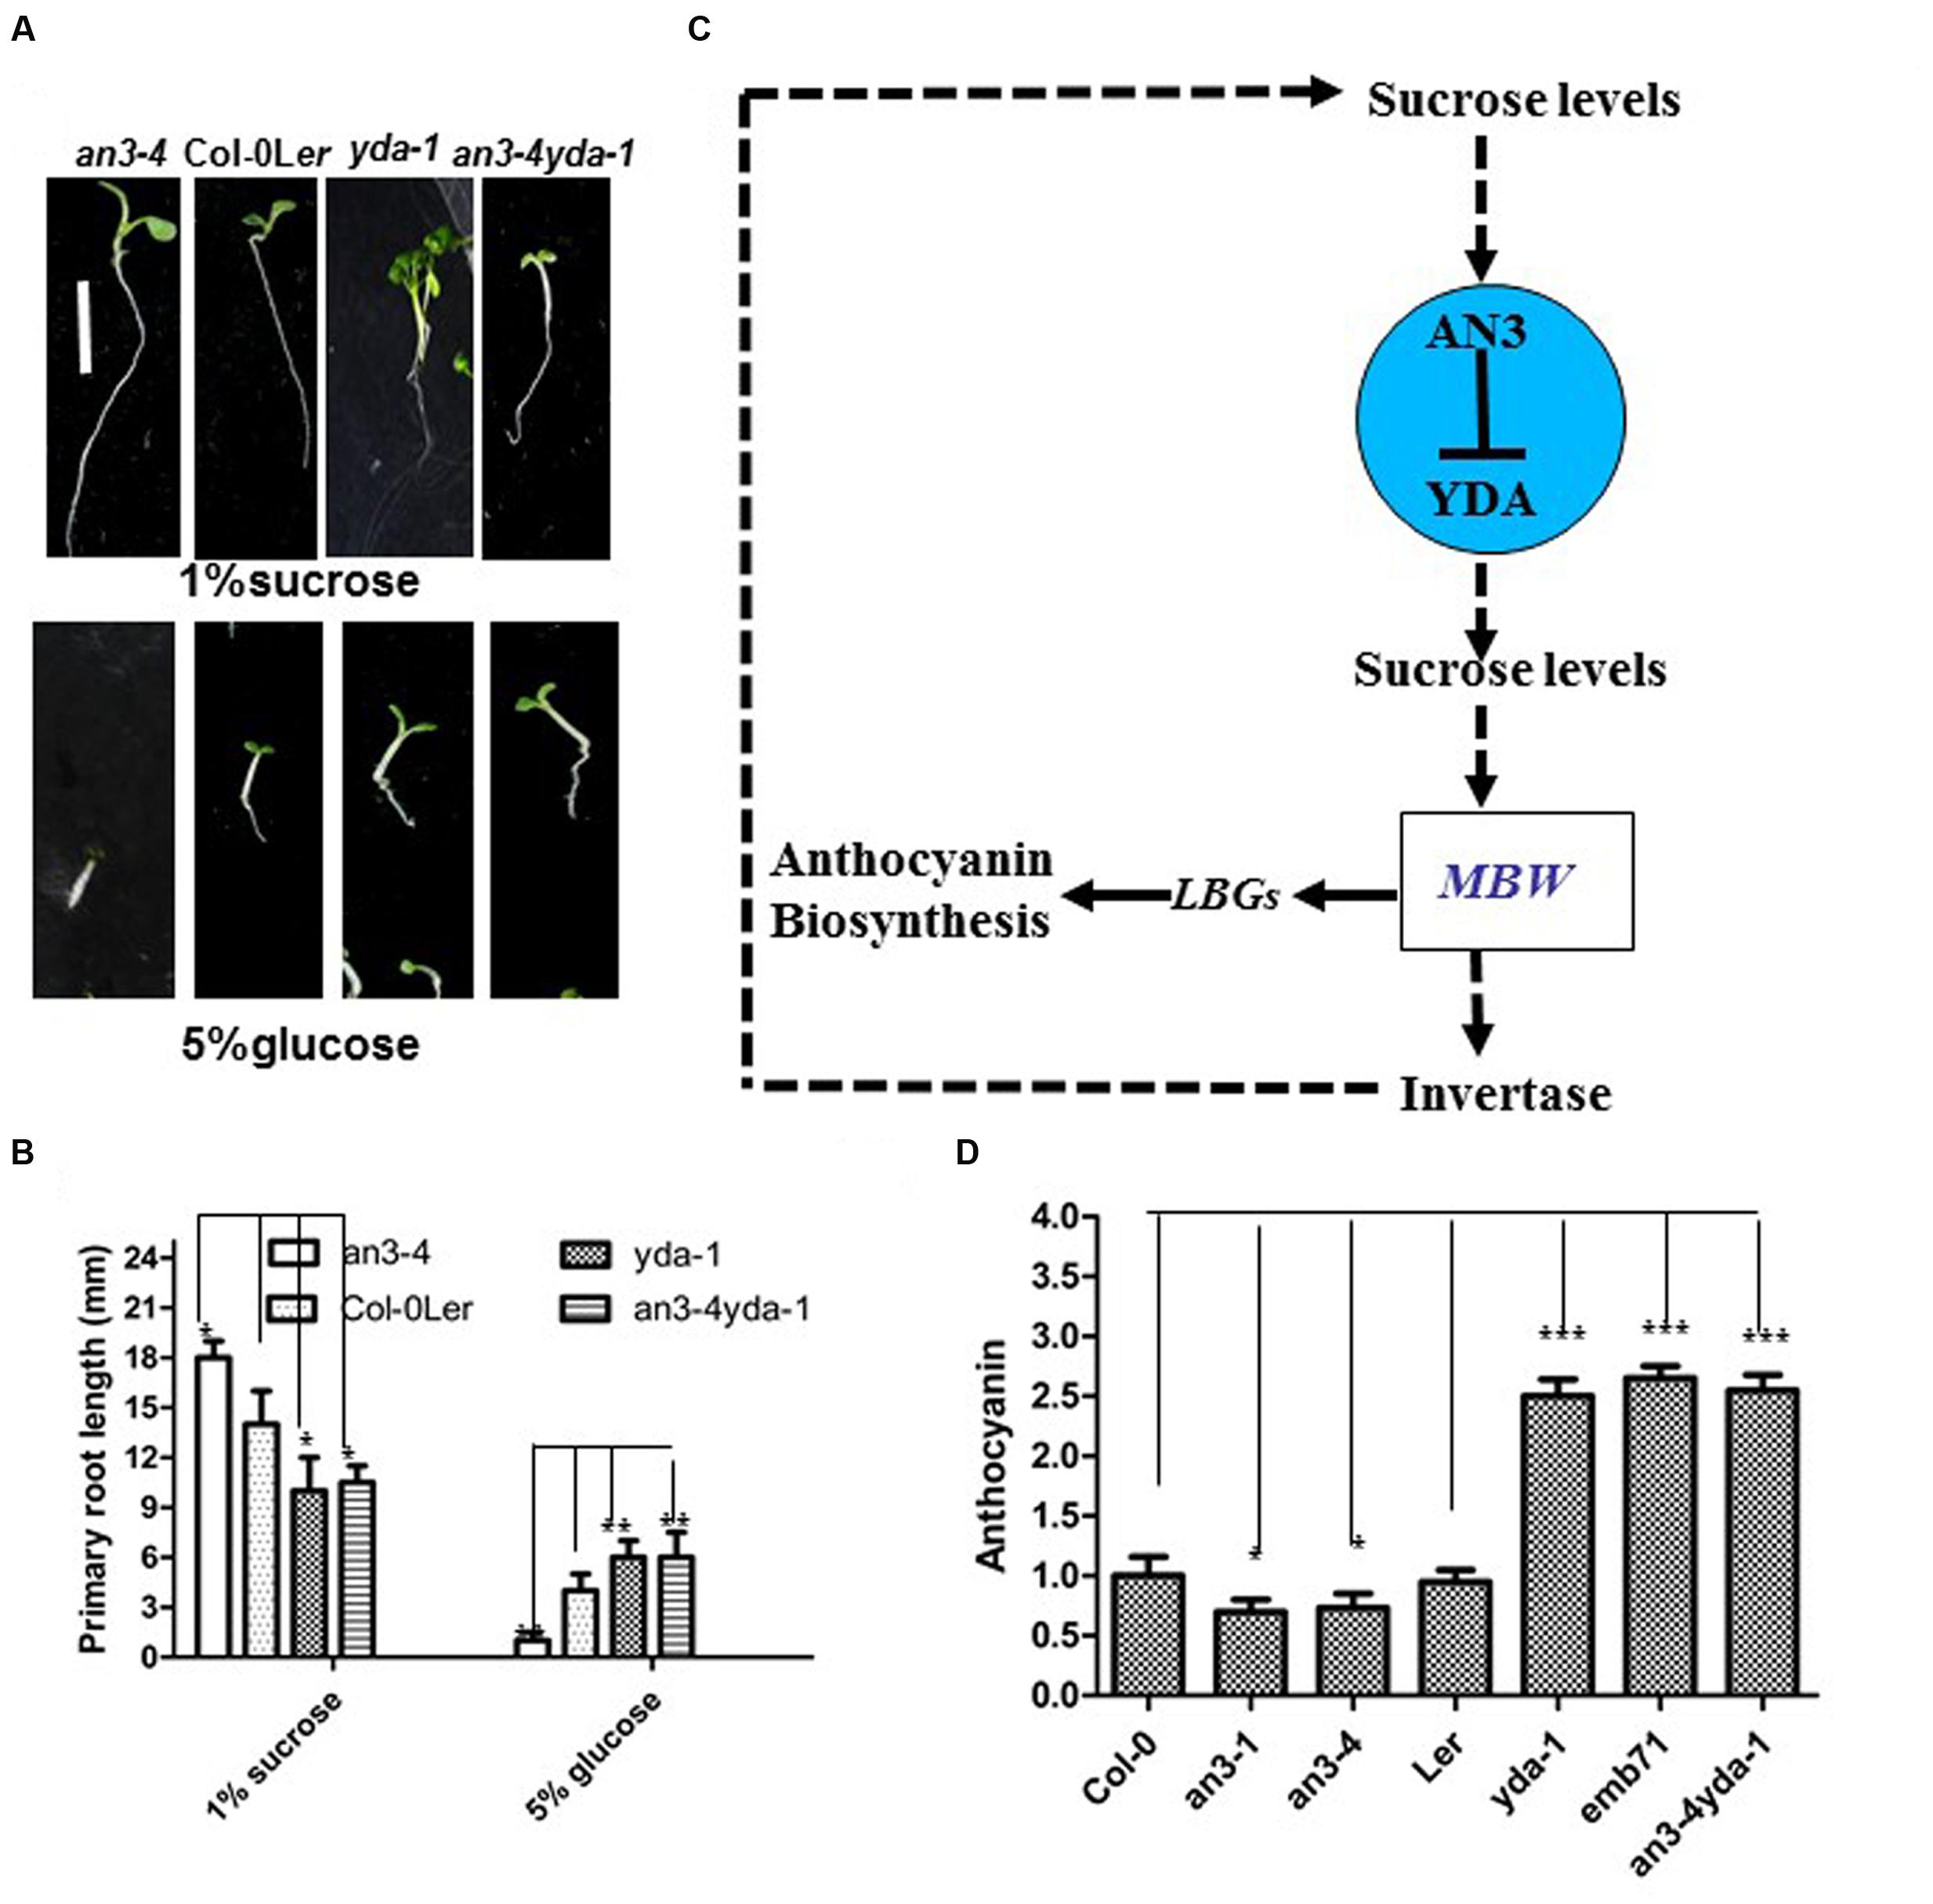
FIGURE 7. EMB71/YDA mutations differentially suppress an3-4 mutant. (A) Representative 5-day-old seedlings. Bar = 5 mm. (B) Bar graph exhibiting the difference in the root length. Error bars represent SD (n = 20). The above seedlings in (A,B) grown on solid MS medium with 1% sucrose and 5% glucose, and every kind of seedling have been indicated. Error bars represent SD (n = 17). Heteroscedastic t-test analysis showed significant differences (∗P < 0.05; ∗∗P < 0.01). Experiments were repeated two times with similar results (biological replicates). (C) A proposed model illustrating the regulation of anthocyanin accumulation by the AN3-EMB71/YDA gene cascade. The AN3-EMB71/YDA gene cascade tunes the sucrose levels, which may be as a result of the change of the invertase activity. The change of sucrose levels induces anthocyanin biosynthesis by unknown regulatory mechanisms. On the other hand, the MYB/bHLH/TTG1 (MBW) complex can directly regulate the invertase gene promoter, and in turn lead to the change of sucrose levels (Payyavula et al., 2013). This alternation may cause the change of stability in both AN3 and YDA in the AN3-YDA gene cascade. The solid lines indicate direct regulation, whereas the dotted lines indicate either indirect regulation or regulation in an unknown manner. (D) Bar graph exhibiting the difference in the anthocyanin accumulation between the every indicated seedlings grown under white light conditions on solid MS medium with 1% sucrose. Wild-type in normal is set as 1.0. Error bars represent SD (n = 13). Heteroscedastic t-test analysis showed significant differences (∗P < 0.05; ∗∗∗P < 0.001). Experiments were repeated two times with similar results (biological replicates).
Double mutant analysis was performed to determine whether AN3 acts genetically upstream of YDA in regulating anthocyanin accumulation. Specifically, an3-4, which presented a narrow rosette leaf (Horiguchi et al., 2005, 2011), was combined with yda-1, which showed a severely stunted phenotype compared with Ler (Bergmann et al., 2004; Lukowitz et al., 2004). The results showed that an3-4 and yda-1 seedlings exhibited enhanced anthocyanin accumulation, similar to that of yda-1 seedlings (Figure 7D). This crossing result indicated that yda-1 is epistatic to an3-4 in anthocyanin accumulation. These results also indicated that YDA mutation suppresses the reduced anthocyanin accumulation in an3-4 mutant plants, implying that AN3 acts genetically upstream of YDA in modulating the anthocyanin accumulation.
AN3-YDA Plays Specific (but Generally Not Pleiotropic) Roles between Carbohydrate Synthesis/Status and Anthocyanin Biosynthesis
This study determined whether the expression levels of genes encoding flavonols and anthocyanins were changed in an3 and yda mutants to verify the molecular basis of the changes of flavonol and anthocyanin levels. Microarray analysis (Horiguchi et al., 2011) revealed that the genes encoding a few regulators and flavonoid biosynthesis exhibited mostly two times lower expression levels in the an3-4 mutant than in the wild-type seedlings (for example, F3′H, CHI, TRANSPARENT TESTA 19, flavonol synthase, UGT89C1 and UDP-GLUCOSYL TRANSFERASE 79B1) (Meng, 2015). Quantitative RT-PCR (Q-RT-PCR) analysis was performed to confirm the conclusion. The results indicated that the gene expression levels were evidently lower in the an3-4 mutants than those in the wild-types (Supplementary Figure S6A), which is consistent with the results of microarray analysis (Horiguchi et al., 2011).
The regulatory and flavonoid biosynthetic genes that decreased in the an3-4 mutant were investigated, and the results showed that these genes were mostly EBGs and LBGs (Meng, 2015). The expression levels of EBGs were unchanged in the an3-4 mutant (Horiguchi et al., 2011). Therefore, whether AN3 protein is associated with the gene promoters of LBGs should be determined. First, this study determined whether these gene promoters contained TCTCTC or CACGTG motifs (Meng and Yao, 2015). The analysis indicated that the promoters of F3′H (TT6), FLS and CHI, but not TT19, UGT79B1 and UGT89B1, contained CACGTG or TCTCTC motifs. Second, this study verified whether AN3 protein was associated with the promoters of F3′H (TT6), FLS and CHI by ChIP-PCR analysis. The findings indicated that AN3 protein was not associated with these gene promoters in vivo (Supplementary Figure S5).
Then, the microarray data of YDA were analyzed (Lukowitz et al., 2004), and the results revealed that, although the expression level of CHI was higher in the emb71 mutants than in the control plants, the expression levels of F3′H, FLS, TT19, UGT79B1, and UGT89C1 genes were not evidently different between emb71 mutants and control plants. The findings of Q-RT-PCR analysis were consistent with those of microarray analysis (Supplementary Figure S6B) (Lukowitz et al., 2004). Given that the yda-1 (or emb71) mutant exhibited overproduction of anthocyanin accumulation, why were the expression levels of these genes not evidently different between control and yda-1 (or emb71) mutant plants? EMB71/YDA is the MEKK1/Ste11/Bck1 class of mitogen-activated protein kinase kinase kinases; thus, EMB71/YDA might regulate TT19, F3’H, UGT79B1, UGT89B1 and FLS at the post-translational level. Therefore, although the yda-1 (or emb71) mutant exhibited overproduction of anthocyanin accumulation, the expression levels of these regulatory and flavonoid biosynthetic genes were not evidently different among wild-type and yda-1 (or emb71) mutant seedlings. Taken together, these data indicated that the AN3-YDA gene cascade plays specific, but generally not pleiotropic, roles between carbohydrate synthesis/status and anthocyanin biosynthesis.
Discussion
In this work, an3 mutants exhibited lower anthocyanin accumulation than the wild-types, whereas yda mutants exhibited higher anthocyanin accumulation than the wild-types. The an3 and yda mutants can disrupt the normal Suc levels as a result of higher or lower INV activity in an3 and yda mutants, respectively. Thus, lower and higher anthocyanin accumulations were observed in an3 and yda mutants, respectively. Taken together, the results showed that the AN3-YDA gene cascade may influence the INV activity, which affects the Suc levels. In turn, Suc levels can induce the change of anthocyanin levels to a certain extent via unknown regulatory mechanisms (Figure 7C). By contrast, the infiltration of the potato transcription factor anthocyanin 1 (StAN1) into tobacco leaves enhanced the gene expression of SUSY and INV (Payyavula et al., 2013). Thus, in Arabidopsis, certain factors of the MYB/bHLH/TTG1 (MBW) complex may affect the Suc levels by regulating the transcript levels of the INV gene (Figure 7C). Moreover, in the AN3-YDA gene cascade, the change of the Suc/glucose levels can cause the differential protein stability of AN3 and YDA, which again affects the MYB/bHLH/TTG1 (MBW) complex and anthocyanin levels of the AN3-YDA gene cascade regulating the Suc levels (Figure 7C).
Although the AN3-YDA gene cascade evidently affects the Suc levels, which probably triggers Suc signaling, its mechanism is still unknown. Jeong et al. (2010) reported that, although carbohydrate metabolism is not involved in the expression of the sugar transporter gene SUC1, their findings indicated that the redox status of photosynthetic electron transport represents a signal for anthocyanin induction. By contrast, SUC1 is probably responsible for the enhanced Suc levels of the shoot for sugar sensing/signaling, but its specific role in enhancing shoot Suc levels remains elusive and requires further characterisation (Jeong et al., 2010). Moreover, SUC1 plays a significant role in transporting exogenous Suc taken by proton-independent sugar transporters from the root tips (Chaudhuri et al., 2008). Jeong et al. (2010) reported that SUC1 represents an integrator for signals provided by Suc. The identification of DELLA as a novel component in sucrose signaling, and the DELLA proteins act as a key positive regulator in the sucrose signaling pathway controlling anthocyanin biosynthesis (Li et al., 2014). Therefore, it is interesting whether the AN3-YDA gene cascade directly targets this sucrose signal integrator of SUC1 or the sucrose signaling component of DELLA for sucrose signal transduction. The interesting relationship awaits future research.
The AN3-YDA Gene Cascade Presents Important Biological Functions in the Regulation of Anthocyanin Accumulation by Unknown Regulatory Mechanism
The an3 and yda mutants exhibited lower and higher anthocyanin accumulations than the wild-types, respectively (Figure 1; Meng, 2015). Furthermore, the an3 and yda double mutants exhibited higher anthocyanin accumulation than the wild-types (Figure 7D), indicating that AN3 is upstream of YDA and that the YDA mutation significantly enhanced anthocyanin accumulation in the an3-4 mutant. These findings indicated a negative relationship between AN3 and YDA in the regulation of anthocyanin accumulation. Further analysis of the influence of AN3 associated with the YDA promoter in vivo (Figures 2 and 3) on glucose sensing (Figure 4) and the stability of AN3 and YDA protein on high concentrations of glucose (Figures 5A,B), on endogenous Suc content (Figure 6) and on INV activity (Figure 6) confirmed the negative regulatory effects of AN3 on YDA.
Moreover, 5% sucrose can restore abnormal anthocyanin accumulation in an3 and yda mutants (Supplementary Figure S4). Thus, the sugar signaling pathway is still functioning or, in case an3 and yda would be involved in this signaling, there exists an alternative signaling pathway. However, these data do not support the conclusion that AN3 and YDA are part of the sucrose signaling. Thus, the AN3-YDA gene cascade obviously affect sugar levels, which will trigger the sugar signaling, the mechanism of which is still unknown.
Taken together, AN3-YDA gene cascade has important biological functions in the regulation of anthocyanin accumulation by unknown regulatory mechanism.
Accession Numbers
Sequence data derived from this paper can be found in the Arabidopsis Genome Initiative database under the following accession numbers AN3 (At5G28640) and EMB71/YDA (At1G63700).
Author Contributions
L-SM designed experiments. L-SM performed the experiments. L-SM, Y-QL, and M-QL completed statistical analysis of data. L-SM and J-HJ wrote this manuscript.
Conflict of Interest Statement
The authors declare that the research was conducted in the absence of any commercial or financial relationships that could be construed as a potential conflict of interest.
Acknowledgments
We thank Profs Hong Gil Nam (DGSIT, South Korea) and Cheng-Bin Xiang (University of Science and Technology of China, China) for their support at the initial stage of this work. This study was supported by grants from the National Science Foundation of China (31370646). The Doctoral Scientific Research Founding of Jiangsu Normal University.
Supplementary Material
The Supplementary Material for this article can be found online at: http://journal.frontiersin.org/article/10.3389/fpls.2016.01728/full#supplementary-material
References
Baier, M., Hemmann, G., Holman, R., Corke, F., Card, R., Smith, C., et al. (2004). Characterization of mutants in Arabidopsis showing increased sugar-specific gene expression, growth, and developmental responses. Plant Physiol. 134, 81–91. doi: 10.1104/pp.103.031674
Barratt, D. H. P., Derbyshire, P., Findlay, K., Pikea, M., Wellnerb, N., Lunnc, J., et al. (2009). Normal growth of Arabidopsis requires cytosolic invertase but not sucrose synthase. Proc. Natl. Acad. Sci. U.S.A. 106, 13124–13129. doi: 10.1073/pnas.0900689106
Bergmann, D. C., Lukowitz, W., and Somerville, C. R. (2004). Stomatal development and pattern controlled by a MAPKK kinase. Science 304, 1494–1497. doi: 10.1126/science.1096014
Chaudhuri, B., Ho mann, F., Lalonde, S., Brady, S. M., Orlando, D. A., Benfey, P., et al. (2008). Protonophore- and pH-insensitive glucose and sucrose accumulation detected by FRET nanosensors in Arabidopsis root tips. Plant J. 56, 948–962. doi: 10.1111/j.1365-313X.2008.03652.x
Deikman, J., and Hammer, P. E. (1995). Induction of anthocyanin accumulation by cytokinins in Arabidopsis thaliana. Plant Physiol. 108, 47–57. doi: 10.1104/pp.108.1.47
Gou, J. Y., Felippes, F. F., Liu, C. J., Weigel, D., and Wang, J. W. (2011). Negative regulation of anthocyanin biosynthesis in Arabidopsis by a miR156-targeted SPL transcription factor. Plant Cell 23, 1512–1522. doi: 10.1105/tpc.111.084525
Gould, K. S., McKelvie, J., and Markham, K. R. (2002). Do anthocyanins function as antioxidants in leaves? Imaging of H2O2 in red and green leaves after mechanical injury. Plant Cell Environ. 25, 1261–1269.
Horiguchi, G., Kim, G. T., and Tsukaya, H. (2005). The transcription factor AtGRF5 and the transcription coactivator AN3 regulate cell proliferation in leaf primordia of Arabidopsis thaliana. Plant J. 43, 68–78. doi: 10.1111/j.1365-313X.2005.02429.x
Horiguchi, G., Nakayama, H., Ishikawa, N., Kubo, M., Demura, T., Fukuda, H., et al. (2011). ANGUSTIFOLIA3 plays roles in adaxial/abaxial patterning and growth in leaf morphogenesis. Plant Cell Physiol. 52, 112–124. doi: 10.1093/pcp/pcq178
Hoth, S., Niedermeier, M., Feuerstein, A., Hornig, J., and Sauer, N. (2010). An ABA responsive element in the AtSUC1 promoter is involved in the regulation of AtSUC1 expression. Planta 232, 911–923. doi: 10.1007/s00425-010-1228-4
Jain, M., Nijhawan, A., Tyagi, A. K, and Khurana, J. P. (2006). Validation of housekeeping genes as internal control for studying gene expression in rice by quantitative real-time PCR. Biochem. Biophys. Res. Commun. 345, 646–651. doi: 10.1016/j.bbrc.2006.04.140
Jeong, S. T., Goto-Yamamot, N., Kobayashi, S., and Esaka, M. (2004). Effects of plant hormones and shading on the accumulation of anthocyanins and the expression of anthocyanin biosynthetic genes in grape berry skins. Plant Sci. 167, 247–252. doi: 10.1016/j.plantsci.2004.03.021
Jeong, S. W., Das, P. K., Jeoung, S. C., and Park, Y. I. (2010). Ethylene suppression of sugar-induced anthocyanin pigmentation in Arabidopsis. Plant Physiol. 154, 1514–1531. doi: 10.1104/pp.110.161869
Jia, L., Zhang, B., and Wu, Z. C. (2008). OsCYT-INV1 for alkaline/neutral invertase is involved in root cell development and reproductivity in rice (Oryza sativa L.). Planta 228, 51–59. doi: 10.1007/s00425-008-0718-0
Kanei, M., Horiguchi, G., and Tsukaya, H. (2012). Stable establishment of cotyledon identity during embryogenesis in Arabidopsis by ANGUSTIFOLIA3 and HANABA TARANU. Development 139, 2436–2446. doi: 10.1242/dev.081547
Kang, C. Y., Lian, H. L., Wang, F. F., Huang, J. R., and Yagn, H. Q. (2009). Cryptochromes, phytochromes, and COP1 regulate light-controlled tosmatal development in Arabidopsis. Plant Cell 21, 2624–2641. doi: 10.1105/tpc.109.069765
Kovtun, Y., Chiu, W. L., Tena, G., and Sheen, J. (2000). Functional analysis of oxidative stress-activated mitogen-activated protein kinase cascade in plants. Proc. Natl. Acad. Sci. U.S.A. 97, 2940–2945. doi: 10.1073/pnas.97.6.2940
Kuhn, C. (1999). Update on sucrose transport in higher plants. J. Exp. Bot. 50, 935–953. doi: 10.1093/jxb/50.Special_Issue.935
Li, Y., Van den Ende, W., and Rolland, F. (2014). Sucrose induction of anthocyanin biosynthesis is mediated by DELLA. Mol. Plant 7, 570–572. doi: 10.1093/mp/sst161
Lou, Y., Gou, J. Y., and Xue, H. W. (2007). PIP5K9, an Arabidopsis phosphatidylinositol monophosphate kinase, interacts with a cytosolic invertase to negatively regulate sugar-mediated root growth. Plant Cell 19, 163–181. doi: 10.1105/tpc.106.045658
Lukowitz, W., Roeder, A., Parmenter, D., and Somerville, C. (2004). A MAPKK kinase gene regulates extra-embryonic cell fate in Arabidopsis. Cell 116, 109–119. doi: 10.1016/S0092-8674(03)01067-5
Meinke, D., Sweeney, C., and Muralla, R. (2009). Integrating the genetic and physical maps of Arabidopsis thaliana: identification of mapped alleles of cloned essential (EMB) genes. PLoS ONE 4:e7386. doi: 10.1371/journal.pone.0007386
Meng, L., Wang, Y., Loake, G. J., and Jiang, J. (2016). Seed Embryo Development is Regulated via an AN3-MINI3 Gene Cascade. Front. Plant Sci. 7:1645. doi: 10.3389/fpls.2016.01645
Meng, L. S. (2015). Transcription coactivator Arabidopsis ANGUSTIFOLIA3 modulates anthocyanin accumulation and light-induced root elongation through transrepression of constitutive photomorphogenic1. Plant. Cell Environ. 38, 838–851. doi: 10.1111/pce.12456
Meng, L. S., and Liu, A. Z. (2015). Light signaling induces anthocyanin biosynthesis via AN3 mediated COP1 expression. Plant Signal. Behav. 10:e1001223. doi: 10.1080/15592324.2014.1001223
Meng, L. S., Wang, Y. B., Yao, S. Q., and Liu, A. (2015a). Arabidopsis AINTEGUMENTA mediates salt tolerance by trans-repressing SCABP8. J. Cell Sci. 128, 2919–2927. doi: 10.1242/jcs.172072
Meng, L. S., Wang, Z. B., Cao, X. Y., Zhang, H. J., Wang, Y. B., and Jiang, J. H. (2016). ASYMMETRIC LEAVES2-LIKE15 gene, a member of AS2/LOB family, shows a dual abaxializing or adaxializing function in Arabidopsis lateral organs. Acta Physiol. Plant 38:240. doi: 10.1007/s11738-016-2256-x
Meng, L. S., Wang, Z. B., Yao, S. Q., and Liu, A. (2015b). The ARF2–ANT– COR15A gene cascade regulates ABA signaling-mediated resistance of large seeds to drought in Arabidopsis. J. Cell Sci. 128, 3922–3932. doi: 10.1242/jcs.171207
Meng, L. S., and Yao, S. Q. (2015). Transcription co-activator Arabidopsis ANGUSTIFOLIA3 (AN3) regulates water-use efficiency and drought tolerance by modulating stomatal density and improving root architecture by the transrepression of YODA (YDA). Plant Biotechnol. J. 13, 893–902. doi: 10.1111/pbi.12324
Morgan, P. W., and Drew, M. C. (1997). Ethylene and plant responses to stress. Physiol. Plant 100, 620–630. doi: 10.1034/j.1399-3054.1997.1000325.x
Nagata, T., Todoriki, S., Masumizu, T., Suda, I., Furuta, S., Du, Z., et al. (2003). Levels of active oxygen species are controlled by ascorbic acid and anthocyanin in Arabidopsis. J. Agric. Food Chem. 51, 2992–2999.
Ozeki, Y., and Komamine, A. (1986). Effects of growth regulators on the induction of anthocyanin synthesis in carrot suspension cultures. Plant Cell Environ. 27, 1361–1368.
Payyavula, R. S., Singh, R. K., and Navarre, D. A. (2013). Transcription factors, sucrose, and sucrose metabolic genes interact to regulate potato phenylpropanoid metabolism. J. Exp. Bot. 64, 5115–5131. doi: 10.1093/jxb/ert303
Qi, T., Song, S., Ren, Q., Wu, D., Huang, H., Chen, Y., et al. (2011). The Jasmonate-ZIM-domain proteins interact with the WD-repeat/bHLH/MYB complexes to control jasmonate-regulated anthocyanin accumulation and trichome initiation in Arabidopsis. Plant Cell 23, 1795–1814. doi: 10.1105/tpc.111.083261
Solfanelli, C., Poggi, A., Loreti, E., Alpi, A., and Perata, P. (2006). Sucrose-specific induction of the anthocyanin biosynthetic pathway in Arabidopsis. Plant Physiol. 140, 637–646. doi: 10.1104/pp.105.072579
Vandesompele, J., De Preter, K., Pattyn, F., Poppe, B., Van Roy, N., De Paepe, A., et al. (2002). Accurate normalization of realtime quantitative RT-PCR data by geometric averaging of multiple internal control genes. Genome Biol. 3:RESEARCH0034. doi: 10.1186/gb-2002-3-7-research0034
Weiss, D., Van Der Luit, A., Knegt, E., Vermeer, E., Mol, J. N. M., and Kooter, J. M. (1995). Identification of endogenous gibberellins in petunia flowers (induction of anthocyanin biosynthetic gene expression and the antagonistic effect of abscisic acid). Plant Physiol. 107, 695–702. doi: 10.1104/pp.107.3.695
Welham, T., Pike, J., Horst, I., Flemetakis, E., Katinakis, P., Kaneko, T., et al. (2009). A cytosolic invertase is required for normal growth and cell development in the model legume, Lotus japonicus. J. Exp. Bot. 60, 3353–3365. doi: 10.1093/jxb/erp169
Winkel-Shirley, B. (2001). Flavonoid biosynthesis. A colorful model for genetics, biochemistry, cell biology, and biotechnology. Plant Physiol. 126, 485–493.
Yokawa, K., Fasano, R., Kagenishi, T., and Baluška, F. (2014). Light as stress factor to plant roots – case of root halotropism. Front. Plant Sci. 5:718. doi: 10.3389/fpls.2014.00718
Keywords: AN3/GIF1, YODA (YDA), sucrose levels, anthocyanin accumulations, Arabidopsis
Citation: Meng L-S, Li Y-Q, Liu M-Q and Jiang J-H (2016) The Arabidopsis ANGUSTIFOLIA3-YODA Gene Cascade Induces Anthocyanin Accumulation by Regulating Sucrose Levels. Front. Plant Sci. 7:1728. doi: 10.3389/fpls.2016.01728
Received: 26 August 2016; Accepted: 02 November 2016;
Published: 22 November 2016.
Edited by:
Stefan Martens, Edmund Mach Foundation, ItalyReviewed by:
Anton R. Schäffner, Helmholtz Zentrum München, GermanyAxel Schmidt, Max Planck Institute for Chemical Ecology, Germany
Copyright © 2016 Meng, Li, Liu and Jiang. This is an open-access article distributed under the terms of the Creative Commons Attribution License (CC BY). The use, distribution or reproduction in other forums is permitted, provided the original author(s) or licensor are credited and that the original publication in this journal is cited, in accordance with accepted academic practice. No use, distribution or reproduction is permitted which does not comply with these terms.
*Correspondence: Lai-Sheng Meng, menglsh@jsnu.edu.cn Ji-Hong Jiang, jhjiang@jsnu.edu.cn