The functional consequences of cortical circuit abnormalities on gamma oscillations in schizophrenia: insights from computational modeling
1
Research Service, Veterans Affairs Boston Healthcare System, Boston, MA, USA
2
Department of Psychiatry, Harvard Medical School, Boston, MA, USA
Schizophrenia is characterized by cortical circuit abnormalities, which might be reflected in γ-frequency (30–100 Hz) oscillations in the electroencephalogram. Here we used a computational model of cortical circuitry to examine the effects that neural circuit abnormalities might have on γ generation and network excitability. The model network consisted of 1000 leaky integrate-and-fire neurons with realistic connectivity patterns and proportions of neuron types [pyramidal cells (PCs), regular-spiking inhibitory interneurons, and fast-spiking interneurons (FSIs)]. The network produced a γ oscillation when driven by noise input. We simulated reductions in: (1) recurrent excitatory inputs to PCs; (2) both excitatory and inhibitory inputs to PCs; (3) all possible connections between cells; (4) reduced inhibitory output from FSIs; and (5) reduced NMDA input to FSIs. Reducing all types of synaptic connectivity sharply reduced γ power and phase synchrony. Network excitability was reduced when recurrent excitatory connections were deleted, but the network showed disinhibition effects when inhibitory connections were deleted. Reducing FSI output impaired γ generation to a lesser degree than reducing synaptic connectivity, and increased network excitability. Reducing FSI NMDA input also increased network excitability, but increased γ power. The results of this study suggest that a multimodal approach, combining non-invasive neurophysiological and structural measures, might be able to distinguish between different neural circuit abnormalities in schizophrenia patients. Computational modeling may help to bridge the gaps between post-mortem studies, animal models, and experimental data in humans, and facilitate the development of new therapies for schizophrenia and neuropsychiatric disorders in general.
A considerable body of evidence has been amassed from post-mortem brain samples that schizophrenia is associated with particular abnormalities of neural microcircuits. At the same time, our knowledge of the abnormalities of brain function and macroscopic anatomy in schizophrenia has expanded considerably. What is needed now is an integration of findings across these different domains. Towards this end, we constructed a simple computational model of a small cortical area with which we could simulate γ-frequency (30–100 Hz) synchronization. We then examined the effects of schizophrenic neural circuit abnormalities on the γ oscillation and network excitability. Our goal was to determine if reduced synaptic connectivity, reduced inhibitory neurotransmission, and NMDA receptor hypofunction could be detectable with non-invasive measures, so that it might be possible to infer which types of neural circuit dysfunction might be present in schizophrenia patients.
Neural synchronization in the γ band has been proposed to mediate the formation and selection of cell assemblies in local and distributed circuits (Singer, 1999
). Synchronous γ oscillations emerge in a network from the interplay between pyramidal cells (PCs) and interneurons (Borgers and Kopell, 2005
; Oren et al., 2006
). One class of inhibitory interneuron appears to be particularly important for mediating γ oscillations: the perisomatic-targeting, fast-spiking interneurons (FSIs) that express the calcium-binding protein parvalbumin (PV) (Bartos et al., 2007
). This class includes chandelier and basket cells, which make γ-amino-butyric-acid type A (GABAA) synapses onto their targets, and also synchronize each other through gap junctions. In schizophrenia PV interneurons show evidence of decreased GABA synthesis, suggesting a specific link between this disorder and the neural/cognitive functions associated with γ oscillations (Gonzalez-Burgos and Lewis, 2008
; Uhlhaas et al., 2008
).
Supporting this hypothesis, reductions of γ oscillation power and/or phase synchronization in the scalp-recorded electroencephalogram (EEG) have been observed in schizophrenia patients, for example in the auditory (e.g., Spencer et al., 2008b
, 2009
; Light et al., 2006
; ) and visual (e.g., Spencer et al., 2008a
) sensory modalities; in corollary-discharge processes in the motor system (Ford et al., 2008
); and in the prefrontal cortex in association with cognitive control processes (Cho et al., 2006
). Furthermore, correlations have been found between oscillation measures and schizophrenia symptoms such as hallucinations, disorganization, thought disorder, and attention deficits (Spencer et al., 2004
, 2008b
), avolition/apathy (Ford et al., 2008
), and working memory (Light et al., 2006
).
As a complementary measure we examined network excitability. Cortical excitability (commonly measured with transcranial magnetic stimulation [TMS]) is increased in schizophrenia, most likely due to a deficit in GABAergic neurotransmission (Hoffmann and Cavus, 2002
; Daskalakis et al., 2007
). Increased excitability in sensory and association cortex is associated with hallucinations (Hoffman et al., 2003
; Merabet et al., 2003
). A possible link to γ oscillation abnormalities in schizophrenia is suggested by the observation that chandelier cells are involved in regulating PC excitability (Zhu et al., 2004
).
One of the most well-established findings in post-mortem studies of schizophrenia is of reduced synaptic connectivity in the cerebral cortex. Selemon and Goldman-Rakic (1999)
proposed that increases in neuronal density in particular regions of the cortex without cell loss (Pakkenberg, 1993
) reflect decreases in the neuropil due to the loss of dendritic and axonal processes. Supporting this proposal are findings such as reduced somal size, spine density, and dendritic field size of PCs (e.g., Garey et al., 1998
; Glantz and Lewis, 2000
; Pierri et al., 2001
; Broadbelt et al., 2002
; Chana et al., 2003
; Black et al., 2004
; Sweet et al., 2009
), reduced synaptophysin levels (Perrone-Bizzozero et al., 1996
; Glantz and Lewis, 1997
), and decreased expression of genes encoding synaptic proteins (Mirnics et al., 2000
; Torrey et al., 2005
). These studies point to region-specific reductions in synaptic connectivity in schizophrenia and provide a microstructural basis for the regional cortical volume and thickness reductions found with magnetic resonance imaging (MRI) (e.g., Shenton et al., 2001
; Kuperberg et al., 2003
).
To date, the preponderance of evidence for synaptic connectivity reductions comes from measures of excitatory inputs to PCs. It is not known whether inhibitory interneuron connectivity is affected as well. To our knowledge, the consequences of reduced synaptic connectivity for neurophysiological activity in schizophrenia have not been studied. Therefore, we examined the effects of three kinds of synaptic connectivity reductions: excitatory connections between PCs (recurrent excitatory connectivity), recurrent excitatory and inhibitory inputs to PCs (PC input connectivity), and connections between all cells (total connectivity).
We compared connectivity reductions to the well-studied consequences of reducing FSI output. It is likely that reduced GABA synthesis in PV interneurons in schizophrenia is one cause of γ deficits, as GABA antagonism suppresses γ (Whittington et al., 1995
), and decreasing the output from PV interneurons leads to decreased γ power in local circuits (Sohal et al., 2009
). In modeling studies reducing the GABA output from FSIs to PCs decreased γ power (Traub et al., 2000
; Vierling-Claassen et al., 2008
).
Finally, a growing body of evidence links the hypofunction of N-methyl-D aspartate (NMDA) receptors in schizophrenia to PV interneuron abnormalities (e.g., Woo et al., 2004
; Behrens et al., 2007
). NMDA receptor hypofunction has been proposed to be a core neural substrate of schizophrenia (Javitt and Zukin, 1991
), as NMDA receptor antagonists elicit a profile of positive and negative symptoms and cognitive deficits in healthy individuals that bears a strong resemblance to schizophrenia (Krystal et al., 2003
). Studies in animal models have found that γ power (Pinault, 2008
) and network activity (Homayoun and Moghaddam, 2007
) can be increased by NMDA receptor antagonism, presumably by reducing the excitatory drive to PV interneurons. Therefore, we simulated the antagonism of NMDA receptors on FSIs.
Network Architecture
The model network was implemented in the IDL programming environment (ITT Visual Information Solutions, Boulder, CO, USA) and the code is available upon request. The network consisted of 1000 leaky integrate-and-fire neurons (Burkitt, 2006
), and was similar in design and behavior to other models of γ oscillations (e.g., Brunel and Wang, 2003
; Borgers and Kopell, 2005
). Eighty percent (800) of the cells were PCs and 20% (200) were inhibitory interneurons. Of the latter, 75% (150) were regular-spiking interneurons (RSIs) and 25% (50) were FSIs (Condé et al., 1994
; Gabbott and Bacon, 1996
). The FSIs and RSIs were designed to emulate the firing behavior and connectivity of PV-expressing, perisomatic-targeting interneurons (basket and chandelier cells) and apical dendrite-targeting interneurons, respectively (Zaitsev et al., 2005
). Cell parameters were: resting potential: −70 mV; firing threshold: −52 mV; after-spike reset potential: −59 mV; and membrane time constant: 20 ms for PCs and RSIs, 10 ms for FSIs.
Connectivity was random. Connection probabilities were based upon the data of Gibson et al. (1999)
(see Table 1
). PCs were sparsely interconnected, while inhibitory interneurons made denser connections between themselves and PCs (particularly FSIs; Cobb et al., 1995
). Synaptic weights between PCs and FSIs were stronger than other weights to simulate the faster and stronger excitation of PV interneurons than PCs (e.g., Povysheva et al., 2006
), and the faster and stronger recurrent inhibition of PCs by PV interneurons than dendrite-targeting interneurons (e.g., Pouille and Scanziani, 2004
; Brill and Huguenard, 2009
). The spike transmission time was fixed at 2 ms.
Three synapses were modeled using differences-of-exponentials: fast excitatory [α-amino-3-hydroxy-5-methyl-4-isoxazole propionic acid (AMPA)], slow excitatory (NMDA), and fast inhibitory (GABAA). The rise/decay time constants were: AMPA, 0.5/2 ms; NMDA, 2/100 ms; GABAA, 0.5/5 ms (Brunel and Wang, 2003
). The voltage dependence of the NMDA current was modeled using Equation 5 of Jahr and Stevens (1990)
(1 mM Mg+ concentration). The NMDA/AMPA receptor conductance strength ratio was 45% for PCs (Myme et al., 2003
). For interneurons the NMDA/AMPA ratio was set to 10% as the evidence suggests that NMDA receptors on FSIs are sparse (e.g., Muñoz et al., 1999
) and contribute very little excitation (e.g., Gonzalez-Burgos et al., 2005
).
Each cell received a separate random spike input with a frequency of 100 Hz (Poisson distribution). Noise spikes only occurred at excitatory synapses. The noise input weight was set at 16 mS. Integration was performed with the Euler method using a 0.001 ms time step (Hansel et al., 1998
).
Simulations
In the connectivity experiments, connections were deleted at random from the network from 10–100% in steps of 10%. In the recurrent excitatory connectivity experiment, the excitatory connections between PCs were subject to deletion. In the PC input connectivity experiment, both excitatory connections between PCs and inhibitory inputs to PCs were deleted. In the total connectivity experiment, all connections between all cells were deleted.
In the FSI output experiment, the synaptic weights from FSIs to PCs, RSIs, and FSIs were reduced from 10–100% (steps of 10%). And in the FSI NMDA input experiment, the NMDA input to FSIs was decreased from 10–100% (steps of 10%).
For each condition of the experiments the network was initialized with the same random number generator seed so that the weight matrix and noise input were replicated. Thus, the baseline state in each experiment was the same. Additional complete sets of experiments were run with different initial conditions and the same general patterns of results were found.
Analysis Methods
Our measures were: (1) the power of the network oscillation (2) the phase synchrony between cell populations during the oscillation, and (3) the excitability of the network. The network settled into a γ oscillation by 500 ms after the start of the run (Figure 1
), so the 500–1000 ms period was used for analysis.
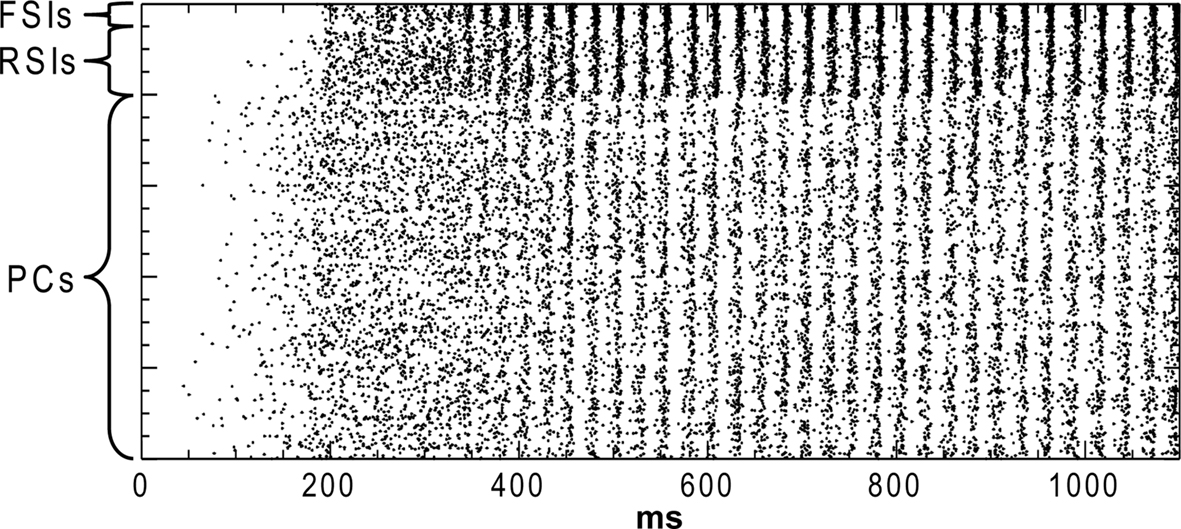
Figure 1. Rastor plot of network spiking in the baseline condition. Pyramidal cells (PCs), regular-spiking interneurons (RSIs), and fast-spiking interneurons (FSIs) are indicated.
To compute oscillation power, for each cell population (PCs, RSIs, and FSIs), the membrane potential was averaged across all cells within that population. The power spectrum of the average membrane potential was then computed with a Fast Fourier Transform (FFT) (2-Hz frequency resolution). This measure reflects synchronous population activity because non-synchronous activity is averaged out.
For inter-population phase synchrony, the FFT was computed on the membrane potential for each cell and converted into a phase spectrum. The phase difference was calculated for each pair of cells in comparisons between the populations (i.e., PC-RSI, PC-FSI, and RSI-FSI), and phase synchrony was computed as 1 minus the circular variance of phases (Fisher, 1993
) for each between-population comparison. This measure yielded an inter-population phase synchrony spectrum which ranged from 0 (random phase distribution) to 1 (perfect phase synchrony) (cf. Lachaux et al., 1999
).
Excitability was measured as simply the number of spikes during the analysis window, averaged across all the cells for each population.
Baseline “Healthy” Activity
In the baseline condition the cells in the network generated a synchronous oscillation at 40 Hz (Figures 1 and 2
). PC spiking was sparse, with ∼5% of PCs firing on each cycle of the γ oscillation. RSI spiking was less sparse, with 12–25% of the cells spiking per γ cycle, and FSIs spiked the most, with 20–50% of the cells spiking per cycle (Figure 2
B). The baseline spike count values were: PCs: 14.0, RSIs: 32.1, and FSIs: 58.9 spikes/cell in the analysis window.
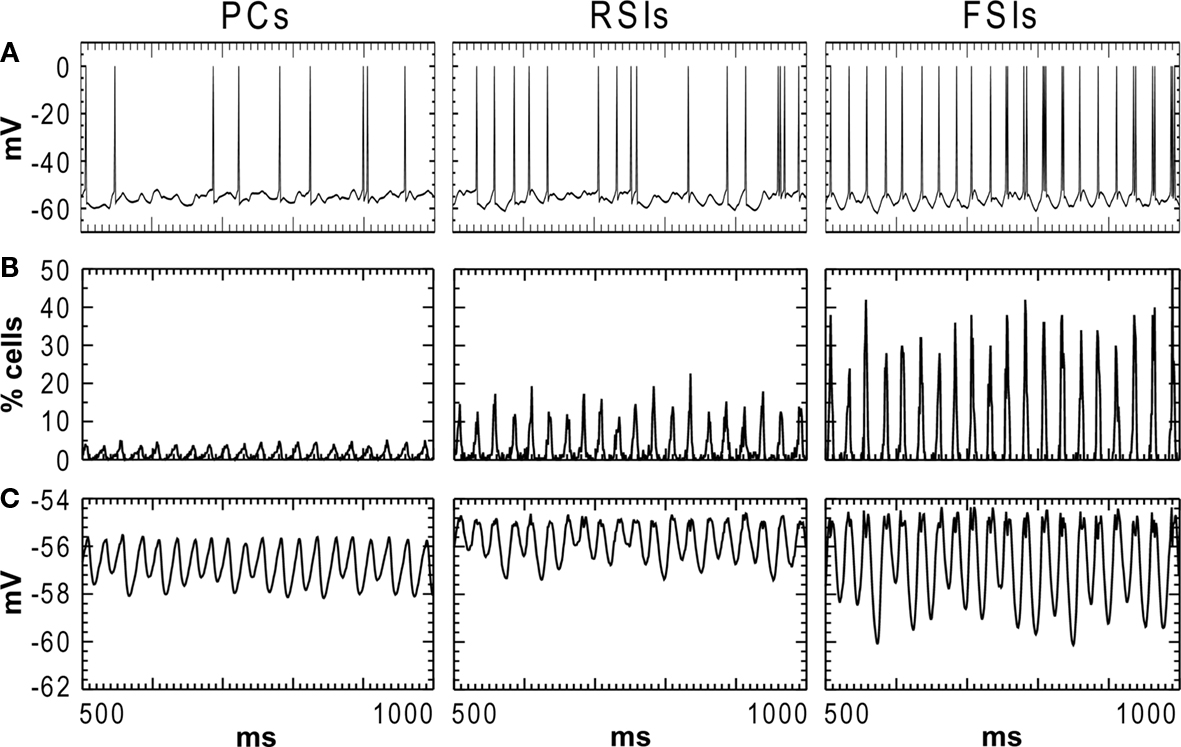
Figure 2. Activity of each cell population in the baseline condition during the 500–1000 ms analysis window. (A) Individual cell membrane potentials with spikes superimposed. (B) Population spiking activity for each cell type, in % of cells per population (bin width = 1 ms). (C) Membrane potential averaged across each cell population.
Oscillation power was strongest for FSIs (0.819 mV2), followed by RSIs (0.157 mV2) and PCs (0.177 mV2) (Figure 3
A). As can be seen in the phase synchrony spectra (Figure 3
A), the cell populations were closely synchronized with each other. The baseline phase synchrony values were: PC-RSI: 0.924, PC-FSI: 0.950, and RSI-FSI: 0.958.
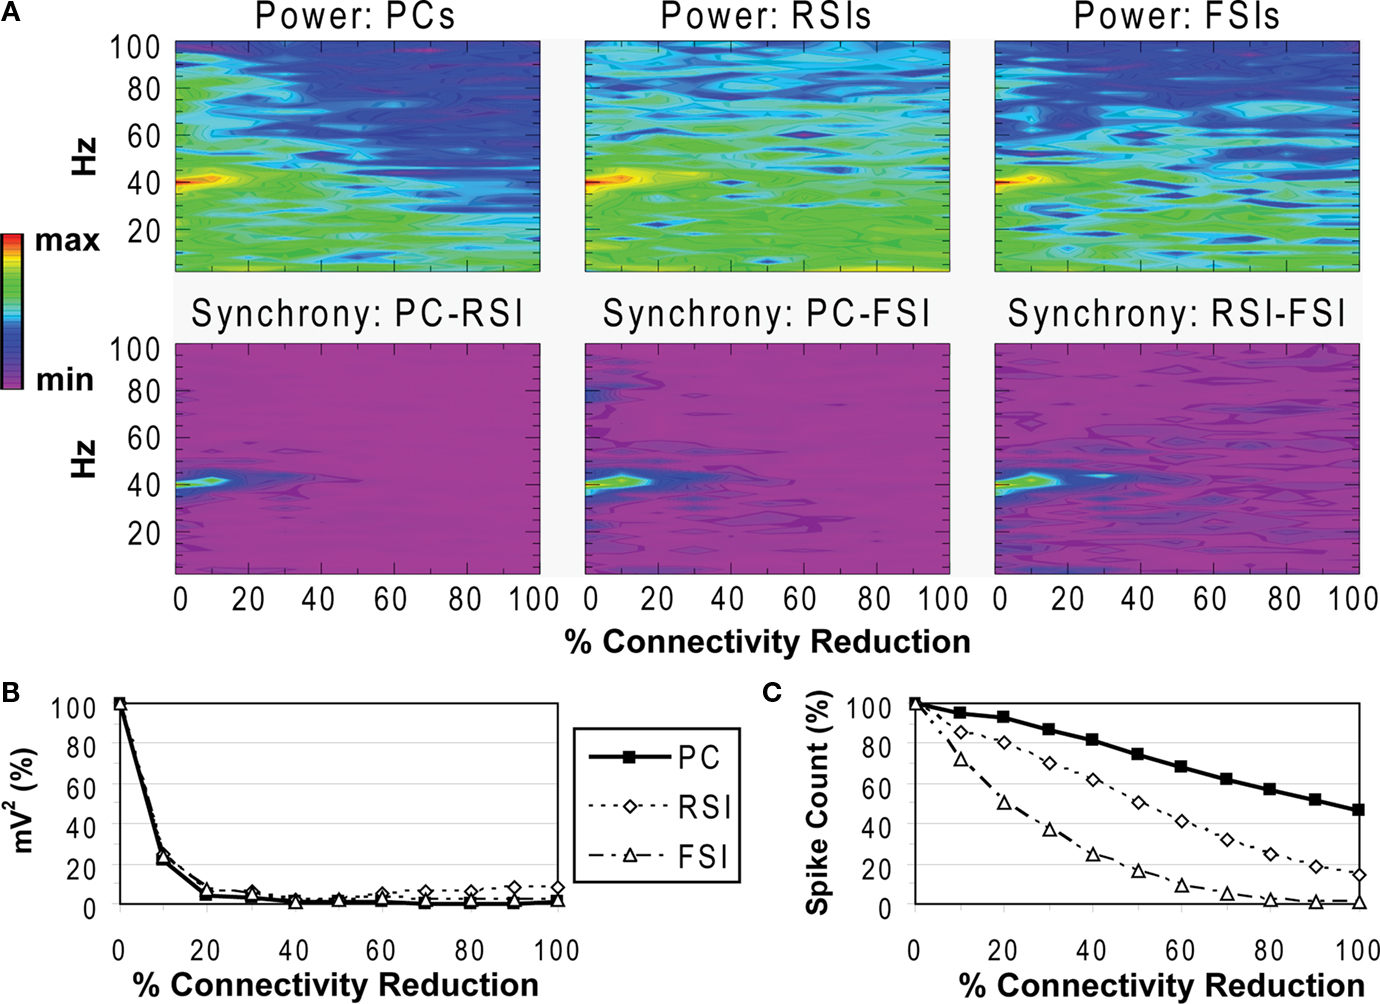
Figure 3. Recurrent excitatory connectivity experiment. Measures are given as a function of % connectivity reduction. (A) Power and phase synchrony spectra in the γ oscillation simulation. Power (mV2, log10 transformed) is scaled between the minimum and maximum for each plot. Phase synchrony is scaled from 0 to 1. (B) Change in peak oscillation power (mV2) expressed as percentage of baseline. (C) Excitability of each cell population measured as the mean spike count, expressed as percentage of baseline.
Recurrent Excitatory Connectivity
Reducing the number of connections between PCs had a dramatic effect on the network γ oscillation (Figures 3
A,B). Power and inter-population phase synchrony were sharply reduced by the 20% level of connectivity reduction. Past the 50% level, a dominant frequency was no longer present, and the network no longer generated a coherent population oscillation.
In the excitability data (Figure 3
C) it can be seen that the spike count for each cell population declined as recurrent excitatory connectivity was reduced. This drop-off was steepest for FSIs, which received proportionally much more excitation from PCs versus the noise drive than PCs and RSIs, due to the stronger weights of the PC- > FSI connections (see Table 1
). At the 20% level the FSI spike count was reduced by 50%, and approached the asymptotic value of 0 by the 70% level. PC and RSI spike counts declined to 46.3 and 14.0%, respectively, at the 100% level.
Thus, reducing PC recurrent excitation led to a decreased excitatory drive not only to the PCs but to the interneurons as well. This decrease in excitation abolished the γ oscillation and reduced network excitability.
PC Input Connectivity
Reducing the number of excitatory and inhibitory inputs to PCs also had a potent effect on the γ oscillation. The power and phase synchrony of the network oscillation dropped off sharply from the 0% to the 20% connectivity reduction level (Figures 4
A,B). Past the 40% level the networFSI Nmda Inputk ceased its synchronized oscillation.
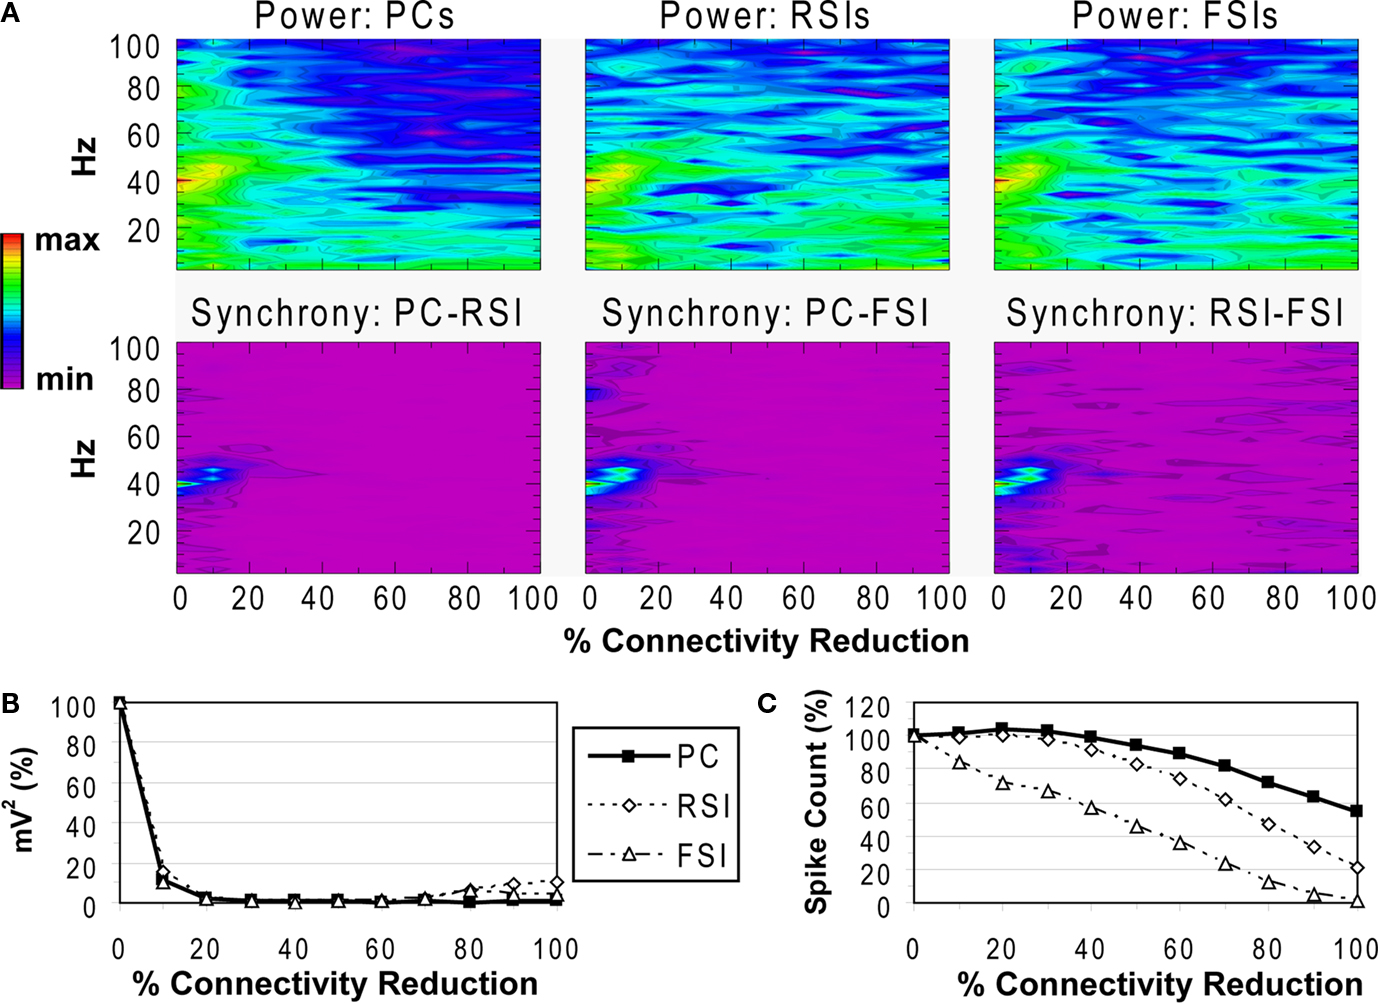
Figure 4. PC input connectivity experiment. See Figure 3
for details.
In contrast, the effects on excitability of the cell populations (Figure 4
C) were milder than in the recurrent excitatory connectivity experiment. The FSI spike count did not decline as steeply, instead showing an almost linear decrease to 0%. The PC spike count increased to 104.4% of baseline at the 20% level before declining, settling to a higher count than in the previous experiment (54.3% at the 100% level). The RSI spike count decreased slightly at the 10% level (98.6%) before returning to baseline at the 20% level (100.3%), and then declining to 21.6% at the 100% level.
As in the recurrent excitatory connectivity experiment, a small reduction in the number of recurrent excitatory and inhibitory inputs to PCs was sufficient to produce a robust deficit in the γ oscillation. Since phasic inhibition from interneurons to PCs is necessary for γ generation, the impairment of γ in this experiment was expected. In contrast, the concurrent loss of excitatory and inhibitory inputs to the PCs led to a different pattern in the excitability data. The loss of inhibitory inputs to the PCs counteracted the loss of excitatory inputs, and in fact led to a small disinhibitory effect in the 10–30% range of connectivity reduction. Thus, the loss of inhibitory as well as recurrent excitatory inputs to PCs partially alleviated the reduction of excitability in the network. (We note that a similar but weaker disinhibitory effect was probably present in the recurrent excitatory connectivity experiment, since a reduction in interneuron excitation would have decreased the inhibitory inputs to PCs.)
Total Connectivity
Reducing the total number of connections in the network again produced a strong reduction in power and inter-population phase synchrony by the 20% connectivity reduction level (Figures 5
A,B), although the drop-off was not as steep as in the other two experiments. The network lost coherence past the 40% level. At the 70% level the network re-synchronized in a 2 Hz oscillation that was driven by RSI-FSI synchronization, but this oscillation was not maintained at higher levels of connectivity reduction.
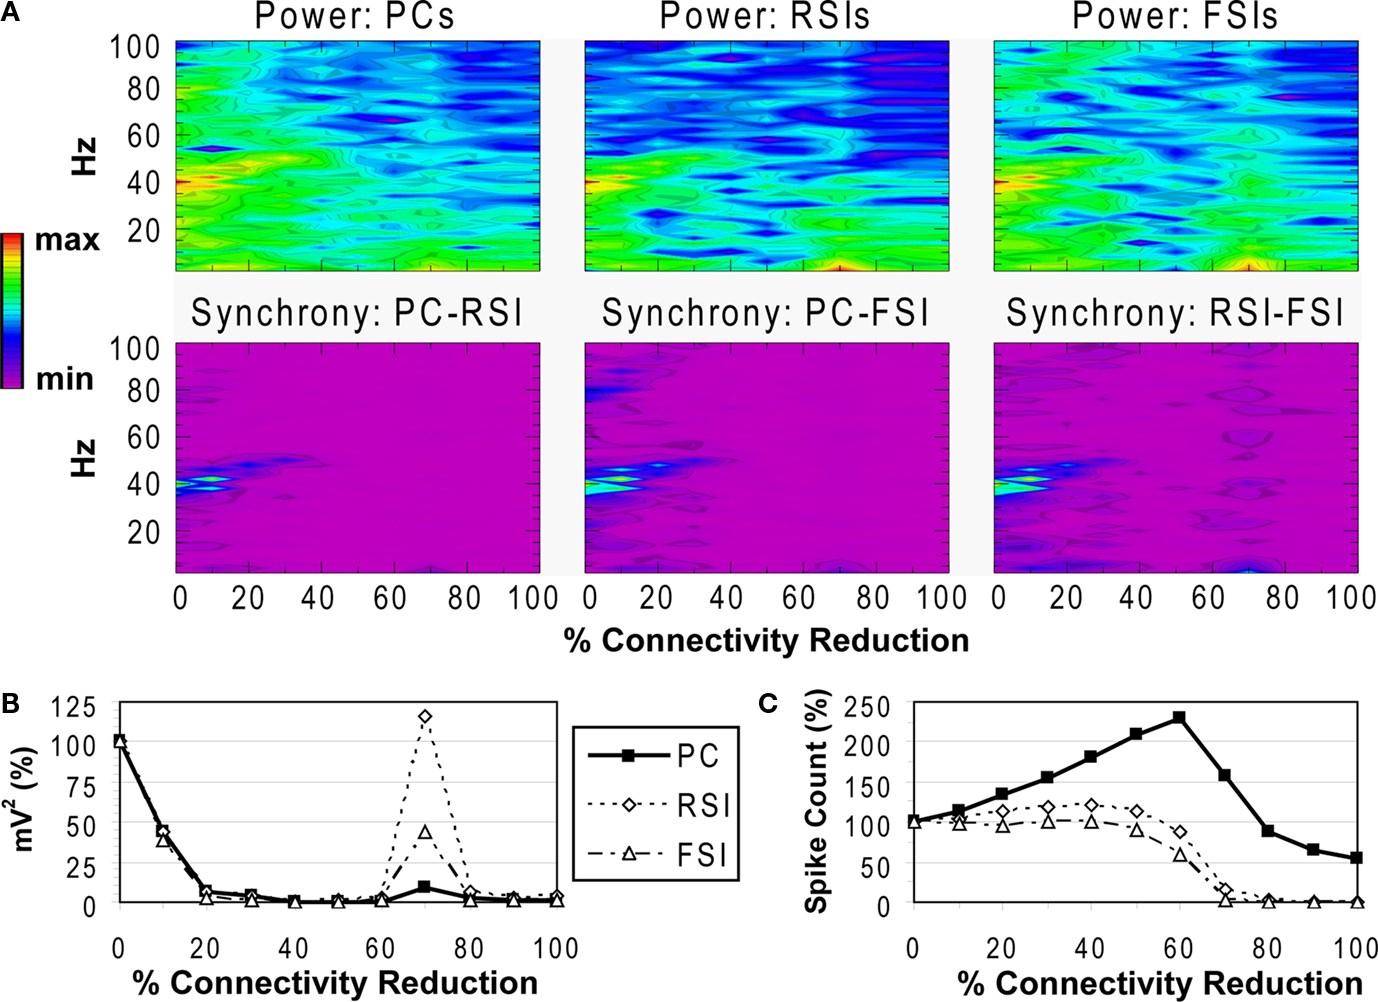
Figure 5. Total connectivity experiment. See Figure 3
for details.
The excitability data (Figure 5
C) show that the PC spike count increased linearly from the 0% to the 60% connectivity reduction level, reaching 228% before declining to 54% at the 100% level. Between the 0% and 50% levels the RSI spike count increased from baseline, peaking at 120% at the 40% level before declining to ∼0% at the 80% level. The FSI spike count stayed close to baseline from the 0% to the 50% levels before declining to 0% at the 80% level. (The preservation of PC spiking but not interneuron spiking from noise inputs at the 100% level was due to the larger NMDA/AMPA ratio in PCs.)
As in the other connectivity experiments, the γ oscillation was nearly abolished with small levels of connectivity reduction. Similar to the PC connectivity experiment, at lower levels of connectivity reduction (<60%), the loss of inhibitory connections in the network had stronger effects on excitability than the loss of excitatory connections. The loss of inhibitory connections led to an overall disinhibition that caused a large increase in PC spiking and balanced the loss of excitation in the interneurons. The disinhibitory effects were larger in this experiment because inhibitory connections between interneurons were eliminated, in addition to inhibitory inputs to PCs.
FSI Output
Reducing the weights of the connections from FSIs to other cells resulted in a different pattern of effects on network activity compared to reducing synaptic connectivity. As FSI inhibition decreased, the power and phase synchrony of the γ oscillation decreased also (Figures 6
A,B), but to a lesser degree than in the connectivity experiments. Inter-population phase synchrony did not decrease to a large degree (under 0.5) until the 80% level of FSI output reduction. The oscillation persisted to a small degree past this level, likely mediated by the RSIs and by the high PC spike count (see below).
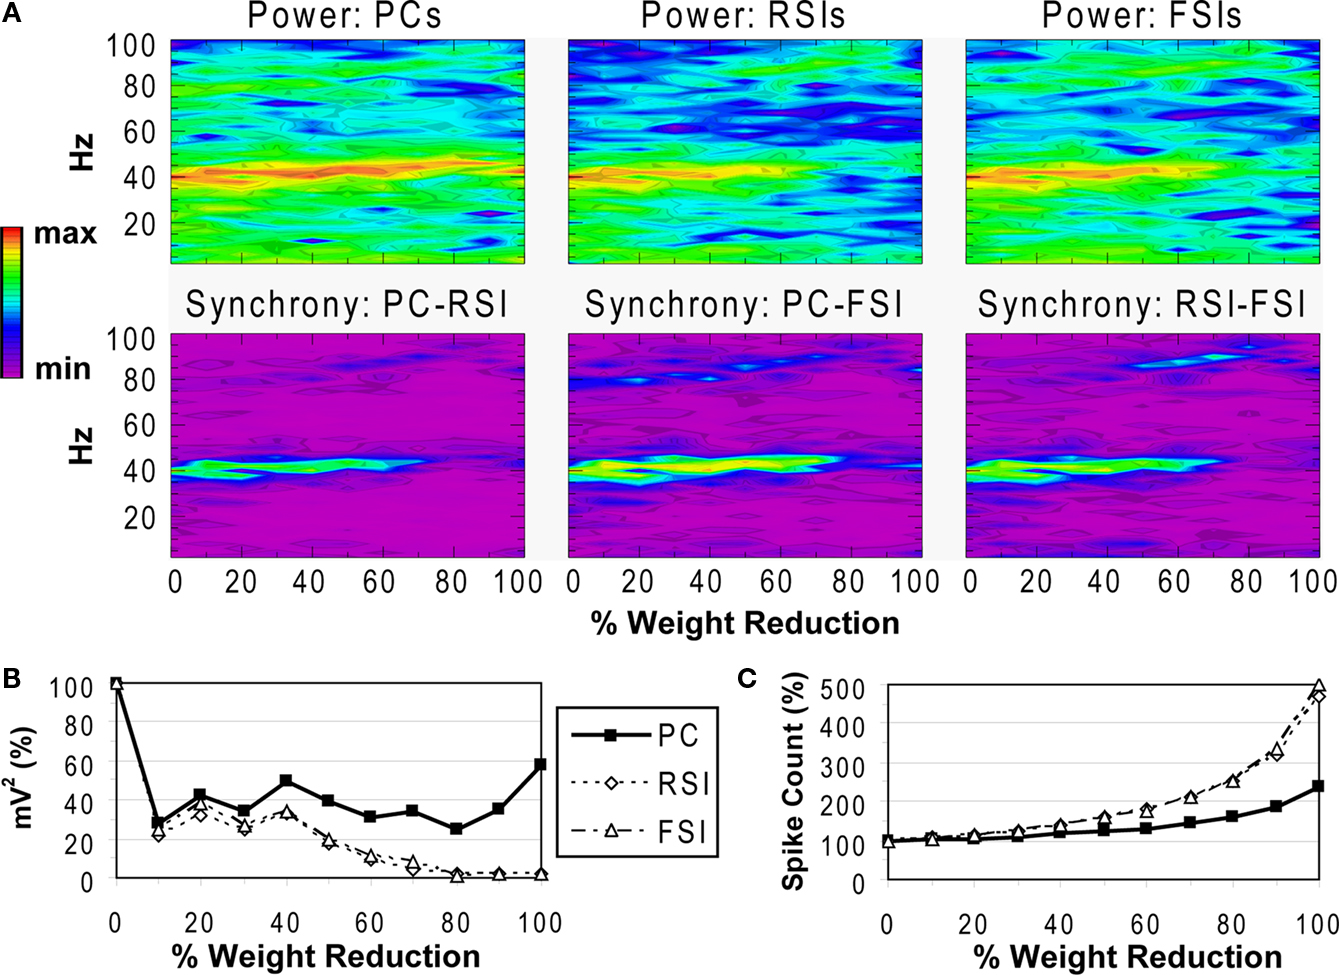
Figure 6. FSI output experiment. See Figure 3
for details.
As FSI output decreased the excitability of all the cell populations increased due to disinhibition (Figure 6
C). The PC spike count reached 238% and interneuron spike counts reaching ∼500% at the 100% connectivity reduction level.
These results show confirm the important role that FSIs play in both network γ synchronization and in controlling cortical excitability.
FSI NMDA Input
Reducing the NMDA input to FSIs led to an initial decrease in γ power at the 10% level, followed by increased power from the 20–100% levels for FSIs and from the 30–80% levels for PCs and RSIs (Figures 7
A,B). At 90–100%, γ power decreased, returning to baseline for PCs and decreasing to ∼50% of baseline for RSIs. Phase synchrony of the γ oscillation showed little change, varying within a range of +/−0.05 and not dropping below 0.84 (for PC-RSI synchrony). These effects were accompanied by increased excitability for PCs and RSIs, and a slight decrease in excitability for FSIs (Figure 7
C).
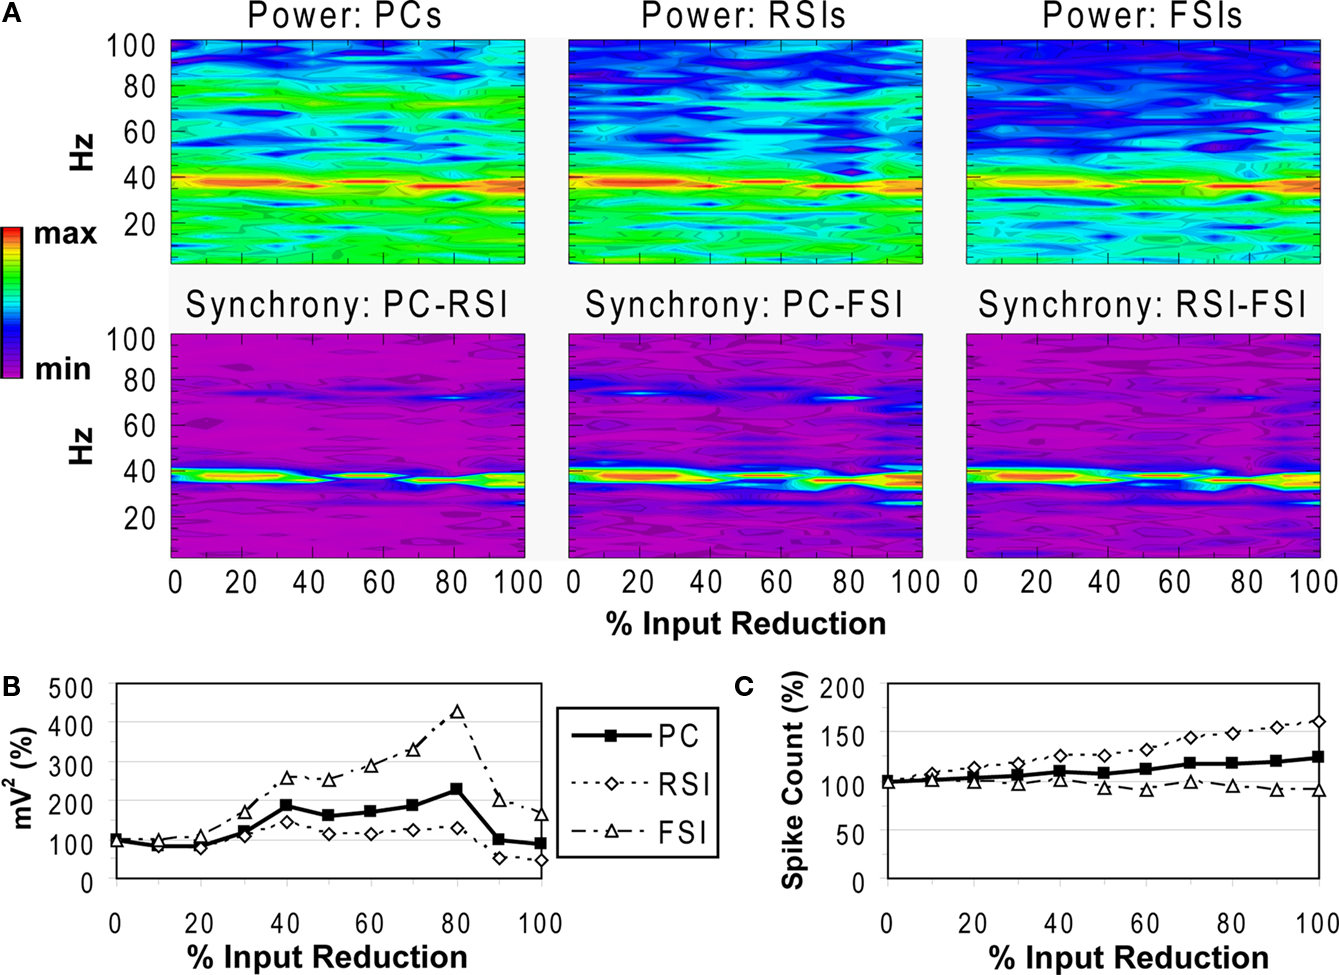
Figure 7. FSI NMDA input experiment. See Figure 3
for details.
Thus, reducing the NMDA input to FSIs paradoxically resulted in a general increase in γ power and network excitability. The NMDA portion of the total excitatory input to FSIs was small, being 10% of the AMPA contribution. Reducing the NMDA input decreased an approximately tonic source of excitation to FSIs, initially causing a drop in γ power but then resulting in increased power and PC excitability via disinhibition. In fact, removal of the tonic component of the excitatory drive to FSIs may have improved the ability of these cells to synchronize, keeping network phase synchrony from changing significantly.
Summary
We examined the effects of reductions in synaptic connectivity, FSI output, and NMDA input to FSIs on γ generation and excitability in a model cortical network. Generally, small reductions of synaptic connectivity (10–20%) produced large decreases in the power and inter-population phase synchrony of the γ oscillation, regardless of the kind of connections that were affected. In contrast, the kind of connectivity reduction influenced the patterns of cell excitability: deleting only recurrent excitatory connections decreased the excitability of all three cell populations, while additionally deleting inhibitory connections resulted in increased excitability due to disinhibition at lower levels of connectivity reduction. At higher levels of connectivity reduction, excitability decreased. In comparison, reducing FSI output decreased γ power and synchrony to a lesser degree, and increased network excitability through disinhibition. Reducing the NMDA input to FSIs also increased network excitability, and γ power increased while phase synchrony was relatively unaffected.
Validity of the Model
Our model of cortical circuitry produced a population oscillation in the γ frequency range when driven by noise inputs at excitatory synapses. The noise input functions in roughly the same manner as a constant current input: it provides an approximately tonic excitatory drive to the cells through the NMDA receptors. As a result of this drive, a fast oscillation emerges in the network from the interplay between PCs and inhibitory interneurons. (In pilot work we found that the frequency of the oscillation depended partially on the strength of the noise input, increasing for stronger inputs above a particular threshold.) The γ oscillation produced by this kind of model resembles the oscillations seen in vivo in the hippocampus and neocortex (e.g., Oren et al., 2006
; Roopun et al., 2008
; Sohal et al., 2009
).
In other pilot experiments the network could generate an “evoked” γ oscillation when given a transient, rather than tonic, stimulus. This effect resembles the EEG pattern evoked by TMS (e.g., Ferrarelli et al., 2008
), and might serve as a model for TMS-EEG phenomena. When the network was given steady-state stimulation in addition to noise input, it produced a steady-state response at the stimulation frequency, with an enhancement of this response at the resonant frequency of the network (40 Hz in this case). So this seems to be a reasonable if simplified model of “real” γ rhythms.
Reduced Synaptic Connectivity
Spine density measurements offer the closest comparable data to the synaptic connectivity reductions simulated here. Spines are the principal site of glutamatergic synapses on PCs (Nimchinsky et al., 2002
), but a small portion of spines also includes GABAergic synapses (∼3%; Kubota et al., 2007
). Therefore, spine density measurements in schizophrenia reflect predominantly excitatory inputs to PCs. Since the abnormalities that have been observed have been found mainly in layers 3 and 5, they are likely to involve primarily intracortical circuits, and thus recurrent excitation.
Deleting just recurrent excitatory connections was sufficient to abolish the network γ oscillation. This finding suggests that the excitatory drive to the network furnished by recurrent excitation was necessary for γ generation. However, the additional deletion of inhibitory connections increased PC spiking via disinhibition while reducing the γ oscillation to a similar degree. Thus, the impairment of γ generation by reduced synaptic connectivity was not tied to the specific type of connection deleted. Rather, it reflected the altered structure of the network. This result is consistent with findings from other modeling studies that a minimum number of connections is necessary for γ synchronization (e.g., Wang and Buzsaki, 1996
; Borgers and Kopell, 2003
), although the precise number varies due to differences in the models.
Another potential factor that could result in a reduction of the power of the network oscillation is an increase in the variance of the number of inputs per cell (Borgers and Kopell, 2003
). We investigated this possibility, but the variance in inputs per cell decreased as connectivity was reduced, so the disruption of γ synchronization was not caused by increased input variance.
PC spine density in post-mortem samples has been studied in several brain areas, and significant reductions in schizophrenia patients have ranged from 15% to 55% (Garey et al., 1998
; Glantz and Lewis, 2000
; Broadbelt et al., 2002
; Sweet et al., 2009
). In all of our synaptic connectivity experiments this range of reduction was sufficient to produce a large deficit in γ. Thus, a γ deficit in schizophrenia patients could be a marker of reduced synaptic connectivity in the underlying cortical network. However, it is unknown to what extent inhibitory connectivity might also be affected in schizophrenia. Our simulations suggest that a γ deficit would not be indicative of the type of the underlying synaptic connectivity abnormality.
The degree to which cortical volume/thickness reductions in schizophrenia reflect synaptic connectivity reductions at the circuit level is not presently known. Regional reductions of cortical volume range up to 15% at the group level (Shenton et al., 2001
). The present data suggest that γ may be a more sensitive indicator of circuit integrity than MRI measures, as only a 10% decrease in synaptic connectivity was sufficient to produce a sizable γ deficit.
Reduced FSI Output
In post-mortem schizophrenia samples, the expression of GAD67, an enzyme required for GABA synthesis, has been reported to be reduced to undetectable levels in PV-expressing interneurons (e.g., Hashimoto et al., 2003
). Hence, the upper levels of FSI output reduction in our model are probably the most relevant. At these levels γ generation was impaired, although not as severely as when synaptic connectivity was reduced. Sohal et al. (2009)
used optogenetic techniques to inhibit the firing of PV-expressing interneurons in vivo and also found a modest reduction of γ. These relatively smaller impairments could be due to the participation of other interneuron classes in the γ oscillation (e.g., Oren et al., 2006
). The increase in network excitability due to FSI output reduction was consistent with experimental evidence (Zhu et al., 2004
).
Reduced NMDA Input to FSIs
Reduced NMDA input to FSIs produced a clear signature: an increase in γ power, along with increased network excitability. These effects are consistent with those of NMDA receptor antagonism reported respectively by Pinault (2008) and Homayoun and Moghaddam (2007)
. These findings suggest that the administration of NMDA receptor antagonists at subanesthetic doses preferentially affects NMDA receptors on PV interneurons. However, it should be noted that this effect is regionally specific, as γ increases and decreases due to NMDA receptor antagonism have been reported in various brain regions (Roopun et al., 2008
). Modeling may prove useful in understanding the basis of these regional variations.
Implications
The main goal of this study was to determine if different kinds of neural circuitry abnormalities associated with schizophrenia – synaptic connectivity reductions, reduced FSI output, and reduced NMDA input to FSIs – would produce distinct patterns of effects that might be make them detectable with non-invasive measures such as EEG and MRI. We found that reductions of synaptic connectivity and FSI output produced γ deficits, while reduced NMDA input to FSIs produced γ increases. Network excitability changes demonstrated a different pattern: excitability decreased when recurrent excitation was reduced, while excitability increased when the FSI contribution to network activity was reduced, either by deleting inhibitory inputs to PCs, reducing FSI outputs, or decreasing the NMDA-mediated depolarization of FSIs. Therefore, the identification of microcircuit abnormalities in schizophrenia patients with non-invasive methods is likely to require a multimodal approach that combines neurophysiological and neuroanatomical methodologies.
Most reports to date of γ oscillation abnormalities in schizophrenia have found that the power and/or phase synchronization of γ oscillations are reduced in schizophrenia patients relative to healthy individuals (see Introduction). Here we found that γ deficits could be ascribed to both synaptic connectivity and FSI output reductions. In principle, these causes could be distinguished by localizing the neuroanatomical source of an oscillation, then measuring the volume and/or thickness of the generating cortical region with MRI techniques. A γ deficit with normal structural measurements of the generating cortex would point to a deficit in GABAergic transmission, whereas a γ deficit with reduced cortical volume would suggest reduced synaptic connectivity as a cause (not excluding the possibility of a GABAergic deficit).
TMS would add a complementary dimension to this approach. By measuring the excitability of the generating region of a γ oscillation it would be possible to determine whether a deficit in inhibitory function was present. TMS would be sensitive to reduced FSI output, reduced NMDA input to FSIs, and presumably reduced inhibitory connectivity, as all three of these abnormalities lead to increased network excitability. If structural MRI analysis found evidence of reduced synaptic connectivity in the region, normal excitability measures would indicate that this abnormality involved only recurrent excitation. On the other hand, if increased excitability was present, this would indicate that inhibitory function was also affected. Standard cortical excitability measurements with TMS are limited by the necessity of having an output measure such as motor evoked potentials, which are not available in most cortical areas, but TMS-evoked EEG oscillations may provide a new tool with which to assess circuit integrity (e.g., Ferrarelli et al., 2008
).
Not all γ abnormalities in schizophrenia are deficits. A few studies have reported that across patients, the power and/or phase synchronization of certain γ/β oscillations are positively correlated with symptom measures (Spencer et al., 2004
, 2008b
, 2009
). It is noteworthy that these positive correlations have been found mainly for psychotic symptoms, especially hallucinations. These findings imply that psychosis may be associated in some circumstances with an excessive degree of oscillatory synchronization. Since the only known circuit abnormality in schizophrenia that can produce increased γ power is NMDA receptor hypofunction, positive correlations between γ/β oscillations and psychotic symptoms may reflect dysfunctional NMDA input to FSIs. This hypothesis, however, is complicated by the co-occurrence of positive correlations within patient groups with overall γ deficits at the group level (Spencer et al., 2008b
, 2009
).
For instance, Spencer et al. (2009)
found that the phase locking aspect of the 40 Hz auditory steady-state response (ASSR) in the left auditory cortex of schizophrenia patients was decreased relative to control subjects. Within the patient group, though, there was a positive correlation between auditory hallucination symptom scores and phase locking, such that the most symptomatic patients had nearly normal phase locking values. This pattern suggests the presence of multiple neural circuitry abnormalities within the generating region, and a multimodal imaging approach would be necessary to identify these abnormalities. Combining EEG source localization with structural MRI, we would predict that the overall ASSR deficit in patients would be accounted for by a reduction of primary auditory cortex volume (the main ASSR generator; e.g., Hirayasu et al., 2000
), while NMDA receptor hypofunction in patients with hallucinations would explain the positive γ/hallucination correlation.
While we did not attempt to simulate the blood oxygenation level-dependent (BOLD) response here, a number of studies have found that the BOLD response measured with functional MRI is correlated with local field potentials in the γ band (e.g., Logothetis et al., 2001
; Niessing et al., 2005
), as well as intracranial (Mukamel et al., 2005
; Lachaux et al., 2007
) and non-invasive recordings of γ oscillations in humans (e.g., Brookes et al., 2005
; Martuzzi et al., 2009
; Zaehle et al., 2009
; but see Winterer et al., 2007
; Muthukumaraswamy and Singh, 2009
; Muthukumaraswamy et al., 2009
). Thus, it might be reasonable to predict that microcircuit abnormalities that cause decreases or increases in γ power would produce similar changes in the BOLD response. This relationship should be particularly expected for synaptic connectivity reductions, since it is thought that the BOLD response mainly reflects the metabolic demand of the synaptic input to a cortical area, rather than its spiking output (e.g., Viswanathan and Freeman, 2007
). With reduced synaptic connectivity in a cortical area there would be fewer synaptic inputs, the change in metabolism in response to changing inputs would be reduced, and the BOLD response would thus be decreased.
In contrast, since NMDA receptor antagonism increases neural activity through disinhibition (Homayoun and Moghaddam, 2007
), the BOLD response would be expected to increase for circuits affected by reduced NMDA input to FSIs. Studies of non-schizophrenic visual hallucinators have reported increased baseline activity as measured by BOLD (ffytche et al., 1998
) and increased excitability as measured by TMS (Merabet et al., 2003
) in visual cortex, which would both be consistent with NMDA receptor hypofunction.
It is not as clear what effects reduced FSI output due to reduced GABA synthesis would have on the BOLD response. A moderate reduction might be expected, given that there was a moderate reduction in γ power. However, Muthukumaraswamy et al. (2009)
found that the BOLD response to visual stimulation in primary visual cortex was negatively correlated with the concentration of GABA in the same area, as measured by magnetic resonance spectroscopy, so that as GABA concentration increased, the BOLD response decreased. The power of a γ oscillation generated in the same area of visual cortex was not correlated with the BOLD response, but the frequency of the oscillation was positively correlated with GABA concentration. As it is not presently known how resting GABA concentration is functionally related to network activity (BOLD and γ) during stimulation, more data are needed to understand how these findings might pertain to schizophrenia, but the multimodal approach these authors employed can clearly provide new insights into cortical physiology.
Limitations of the Present Study and Future Directions
This study had several limitations. While we attempted to make the connectivity parameters as close as possible to published observations, laminar connectivity was not modeled. Furthermore, the neuron dynamics were very simple (for instance, there was no spike adaptation or bursting) and were much less heterogeneous than in real cortical circuits. Also, the spike transmission time was fixed rather than variable. Nevertheless, these factors should not make our results less valid. Rather, γ synchronization might be even more susceptible to disruption by reducing connectivity in models with more complex dynamics and heterogeneous cell types (Santhakumar and Soltesz, 2004
).
In future studies it will be important to examine synaptic connectivity in networks that incorporate laminar connectivity patterns, as synaptic connectivity reductions have been localized to particular layers. For instance, Sweet and colleagues have found evidence that intrinsic processing within the primary auditory cortex, and feedforward but not feedback circuits from primary to associational auditory cortex, are dysfunctional in schizophrenia (e.g., Sweet et al., 2004
, 2007
). We will also examine how abnormalities in the circuitry of one cortical region may affect γ synchronization and network excitability in a distant area.
We note that one major question that has not yet been examined in post-mortem studies is whether inhibitory connectivity is impaired in schizophrenia. Furthermore, it would be useful to understand the degree to which GAD67 expression correlates with the functional output of inhibitory interneurons.
Conclusions
Computational modeling may help to bridge the gaps between post-mortem studies, animal models, and experimental data in humans. The strength of this approach is that it affords the ability to completely control and measure all aspects of the system under study. By simulating the neural circuit abnormalities found in schizophrenia, it is in principle possible to study the responses of these altered neural circuits in a potentially more realistic manner than by using animal models which approximate certain aspects of the disorder.
One use of computational modeling in schizophrenia research is to test hypotheses about the functional consequences of particular neural circuit abnormalities, as was done here. Another use of computational modeling is to explore the efficacy of different drugs on various aspects of neural circuit function that would be difficult to measure collectively in vivo. For instance, the actions of GABA- vs. glutamate-targeting drugs could be compared on biomarkers such as γ oscillations, cortical excitability, sustained activity, and plasticity. Both types of medications are designed to improve the function of FSIs but in different ways. A GABA agonist might reduce cortical excitability but not improve working memory-related sustained activity, while an NMDA agonist might improve both biomarkers. Exploring drug effects on neural circuits via modeling could provide clues as to how these drugs might work and reveal which biomarkers might be most sensitive to their effects. In this manner, the precision of drug development might be enhanced and the discovery process facilitated.
The author declares that the research was conducted in the absence of any commercial or financial relationships that could be construed as a potential conflict of interest.
Brookes, M. J., Gibson, A. M., Hall, S. D., Furlong, P. L., Barnes, G. R., Hillebrand, A., Singh, K. D., Holliday, I. E., Francis, S. T., and Morris, P. G. (2005). GLM-beamformer method demonstrates stationary field, alpha ERD and gamma ERS co-localisation with fMRI BOLD response in visual cortex. Neuroimage 26, 302–308.
Chana, G., Landau, S., Beasley, C., Everall, I. P., and Cotter, D. (2003). Two-dimensional assessment of cytoarchitecture in the anterior cingulate cortex in major depressive disorder, bipolar disorder, and schizophrenia: evidence for decreased neuronal somal size and increased neuronal density. Biol. Psychiatry 53, 1086–1098.
Hirayasu, Y., McCarley, R. W., Salisbury, D. F., Tanaka, S., Kwon, J. S., Frumin, M., Snyderman, D., Yurgelun-Todd, D., Kikinis, R., Jolesz, F. A., and Shenton, M. E. (2000). Planum temporale and Heschl gyrus volume reduction in schizophrenia: a magnetic resonance imaging study of first-episode patients. Arch. Gen. Psychiatry 57, 692–699.
Kuperberg, G. R., Broome, M. R., McGuire, P. K., David, A. S., Eddy, M., Ozawa, F., Goff, D., West, W. C., Williams, S. C. R., van der Kouwe, A. J. W., Salat, D. H., Dale, A M., and Fischl, B. (2003). Regionally localized thinning of the cerebral cortex in schizophrenia. Arch. Gen. Psychiatry 60, 878–888.
Martuzzi, R., Murray, M. M., Meuli, R. A., Thiran, J. P., Maeder, P. P., Michel, C. M., Grave de Peralta Menedez, R., and Gonzalez Andino, S. L. (2009). Methods for determining frequency- and region-dependent relationships between estimated LFPs and BOLD responses in humans. J. Neurophysiol. 101, 491–502.