 Clara J. M. Hoppe
95% of researchers rate our articles as excellent or good
Learn more about the work of our research integrity team to safeguard the quality of each article we publish.
Find out more
ORIGINAL RESEARCH article
Front. Mar. Sci. , 25 July 2017
Sec. Global Change and the Future Ocean
Volume 4 - 2017 | https://doi.org/10.3389/fmars.2017.00229
In order to understand how ocean acidification (OA) and enhanced irradiance levels might alter phytoplankton eco-physiology, productivity and species composition, we conducted an incubation experiment with a natural plankton assemblage from sub-surface Subarctic waters (Davis Strait, 63°N). The phytoplankton assemblage was exposed to 380 and 1,000 μatm pCO2 at both 15 and 35% surface irradiance over 2 weeks. The incubations were monitored and characterized in terms of their photo-physiology, biomass stoichiometry, primary production and dominant phytoplankton species. We found that the phytoplankton assemblage exhibited pronounced high-light stress in the first days of the experiment (20–30% reduction in photosynthetic efficiency, Fv/Fm). This stress signal was more pronounced when grown under OA and high light, indicating interactive effects of these environmental variables. Primary production in the high light treatments was reduced by 20% under OA compared to ambient pCO2 levels. Over the course of the experiment, the assemblage fully acclimated to the applied treatments, achieving similar bulk characteristics (e.g., net primary production and elemental stoichiometry) under all conditions. We did, however, observe a pCO2-dependent shift in the dominant diatom species, with Pseudonitzschia sp. dominating under low and Fragilariopsis sp. under high pCO2 levels. Our results indicate an unexpectedly high level of resilience of Subarctic phytoplankton to OA and enhanced irradiance levels. The co-occurring shift in dominant species suggests functional redundancy to be an important, but so-far largely overlooked mechanism for resilience toward climate change.
Climate change imposes strong alterations in the environmental conditions of marine ecosystems (Pörtner et al., 2014). Phytoplankton, the main primary producers of the oceans, are not only exposed to ocean warming and acidification (OA), but also face changes in irradiance and nutrient regimes (Steinacher et al., 2010; Pörtner et al., 2014). While the consequences of OA have received a lot of attention over the past decades, interactive effects of multiple drivers have been the focus of more recent studies (Riebesell and Gattuso, 2015). Interactions between light and pCO2 levels, for example, have been demonstrated in phytoplankton isolates and natural assemblages from temperate and subtropical regions (Gao and Campbell, 2014). Beneficial effects of OA have been shown to be more pronounced under low light levels (Kranz et al., 2010; Rokitta and Rost, 2012), while OA appears to inhibit phytoplankton growth under high or variable light (Gao et al., 2012; McCarthy et al., 2012; Jin et al., 2013). This latter result was attributed to an enhanced susceptibility toward high-light stress under OA (Hoppe et al., 2015).
In addition to interactive effects of environmental drivers, ecological processes and interactions in the context of OA have recently gained more scientific interest (e.g., Gaylord et al., 2015). Studies on natural phytoplankton assemblages, on the one hand, have shown that OA-dependent changes in species-specific growth rates can cause strong changes in the composition of phytoplankton assemblages, which have the potential to amplify physiological effects on the community level (Tortell et al., 2008; Hoppe et al., 2013). On the other hand, trophic interactions have been shown to compensate for effects on the level of primary producers (Ghedini et al., 2015). Generally, there is still little process-understanding on both, mechanisms that absorb change, as well as those that cause strong effects and sudden shifts in ecosystem functions.
Only few studies on the effects of OA on phytoplankton have been conducted in the Subarctic and Arctic Oceans. These suggest slightly positive OA-responses in primary productivity and phytoplankton growth, with CO2-sensitivities decreasing with increasing temperature (Engel et al., 2013; Coello-Camba et al., 2014; Holding et al., 2015). Interaction with other environmental drivers, such as light, have thus far not been investigated. In the Arctic Ocean, not only warming and OA are occurring at faster rates than observed in any other ocean, but also irradiance levels and nutrient availabilities are strongly affected due to reduced sea-ice cover and enhanced stratification of surface waters (AMAP, 2013; Pörtner et al., 2014). Knowledge on interactive effects of these drivers is therefore especially warranted for this region.
Furthermore, the frequency in upwelling events resulting from enhanced winds and more exposed sea surface areas has been shown to increase in the Arctic, triggering more frequent blooms in the otherwise stratified and nutrient-limited summer and autumn months (Ardyna et al., 2014). Our experimental setup was chosen to simulate such an upwelling event, where sub-surface waters are entrained into the surface and phytoplankton need to acclimate to sudden changes in their environment. We sought to investigate whether changes in overall irradiance levels as well as ongoing ocean acidification would influence the acclimation response to such conditions.
An incubation experiment with a natural plankton assemblage was conducted during the Arctic-GEOTRACES 2015 summer campaign on board CCGS Amundsen. The experiment was initiated on July 19th 2015 in the Subarctic southern part of Davis Strait (63° 57.857′ N, 60° 7.552′ W). Before sampling, a depth profile of conductivity and temperature was collected (CTD, seabird SBE9+), with chlorophyll a (Chla) fluorescence measured using a Seapoint SCF fluorometer probe. The mixed layer depth (MLD) was calculated from temperature and salinity-derived density profiles, using a density difference criterion (Δσ = 0.125 kg m−3; Levitus, 1982).
We sampled phytoplankton assemblages from the bottom of the sub-surface chlorophyll maximum (50 m depth) using a trace metal clean rosette (TMR) system modified according to Measures et al. (2008) equipped with 12 L Teflon-coated GO-FLO (General Oceanics, FL USA). Seawater from the GO-FLO bottles was dispensed into acid-cleaned 50 L carboys under HEPA filtered air. Subsequently, seawater was pre-screened through acid-cleaned 100 μm nylon mesh to exclude large grazers and transferred into acid-clean 8 L polycarbonate bottles with custom-built fittings for aeration and sub-sampling of bottles.
These incubation bottles were kept in on-deck incubators temperature-controlled by surface waters while being continuously bubbled with air of two pCO2 levels delivered from commercially prepared mixtures (380 and 1,000 μatm; LC and HC, respectively, representing ambient and future atmospheric partial pressures). The phytoplankton assemblages were exposed to these pCO2 conditions at two light levels, 15% (LL) and 35% (HL) surface irradiance (PAR; 400–700 nm) as illustrated in Figure 1. The light levels were chosen to represent contrasting irradiance regimes resulting from sea ice melt and stratification. Light levels in the incubator tanks were measured by a LI-1400 data logger (LI-COR) equipped with a 4π-sensor (Walz) and adjusted to the desired values by applying neutral density screening in combination with blue screens (#209 and CT blue, Lee filters). Temperature in the incubators was estimated from the continuously logged data in the ship's underway system, corrected for a constant offset of 6°C calibrated using discrete measurements in the incubators.
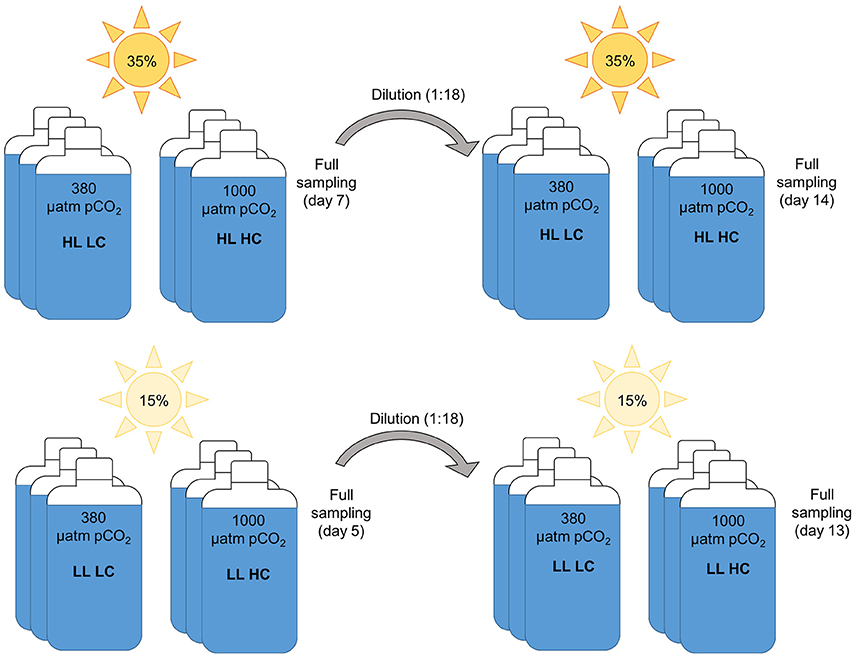
Figure 1. Schematic of experimental setup and sampling time points.
All treatments were conducted in triplicate bottles, resulting in a total of 12 bottles per experiment. To prevent nutrient limitation, macronutrients from chelexed stock solutions were added in ratios appropriate for the region, yielding approx. 20 μM NO−3, 2.5 μM PO3−4 and 30 μM Si(OH)4 (Varela et al., 2013). Dilution of incubations were conducted in order to allow sufficient time for the phytoplankton assemblages to acclimate to the experimental conditions, and for shifts in the species composition to occur, while also preventing nutrient limitation and/or drifts in carbonate chemistry. Incubations were diluted 18-fold with filtered seawater from the initial sampling location and with nutrient added as done initially. Dilution were conducted after 5–7 days, at the time when differentially fast growing incubations had produced the same amount of biomass. Seawater for dilutions was collected with a second TMR deployment directly after the first. Dilution water was filtered through rinsed 0.2 μm filtration cartridges (AcroPak, Pall Corporation) and stored in the dark at 4°C in 50 L acid-cleaned carboys until nutrient addition and use.
As described below, phytoplankton activity in the incubation bottles was monitored by daily measurements of macronutrient concentrations, pH, basal and maximal Chla fluorescence yields. To this end, 30 ml of volume were taken out of the incubations each day, while 50 ml for Chla measurement were taken out every second day. The initial phytoplankton assemblage as well as those assemblages present directly before the dilution (after 5 and 7 days for low and high light treatments, respectively) and during the final sampling (after 13 and 14 days for low and high light treatments, respectively) were assessed by measuring a range of bulk stoichiometric parameters, and by performing several physiological assays.
Samples for dissolved inorganic carbon (DIC) and total alkalinity (TA) were collected in 250 ml borosilicate glass bottles with stoppers. Initial samples were taken from the 50 L carboys during filling of the experimental bottles while samples prior dilutions and at the end of the incubation were taken directly from the experimental bottles. All samples were analyzed as quickly as possible, and no more than 6 h after collection to minimize alteration by biological activity. DIC and TA were analyzed on board by coulometric and potentiometric titration respectively, using a VINDTA 3C (versatile instrument for the determination of titration alkalinity, by Marianda) following the methods found in Dickson et al. (2007). Routine analyses of Certified Reference Materials provided by A.G. Dickson (Scripps Institute of Oceanography) ensured that the uncertainty in the DIC and TA measurements was less than 2 μmol kg−1 and 3 μmol kg−1, respectively. Seawater pH on the total scale (pHtotal) was determined potentiometrically with a two-point calibrated glass reference electrode (IOline, Schott Instruments). A TRIS-based reference standard (Dickson et al., 2007) was used to convert from NBS to total scale and to correct for variability in electrode performance (reproducibility 0.02 units; n = 16).
Seawater carbonate chemistry (including pCO2) was calculated from TA and DIC using CO2SYS (Pierrot et al., 2006) using the refitted dissociation constants of carbonic acid of Mehrbach et al. (Mehrbach et al., 1973; Millero et al., 2002) for calculations. Dissociation constants for KHSO4 were taken from Dickson (Dickson, 1990). pH and pCO2 levels are given for temperatures as measured by the CTD in case of the initial sampling conditions, or for average in-situ temperatures in the incubators during sampling.
Samples for determination of total Chla were gently filtered onto pre-combusted glass-fiber filters (GF/F, Whatman; <200 mmHg), immediately placed into liquid nitrogen and stored at −20°C until analysis. Chla was subsequently extracted overnight at −20°C in 8 mL 90% acetone. After removal of the filter, Chla concentrations were determined on a fluorometer (Turner Designs), using an acidification step (1 M HCl) to determine phaeopigments (Knap et al., 1996). Size fractionated Chla was estimated by filtering onto stacked 5.0 and 0.6 μm polycarbonate filters (Sterlitech Corporation) separated by nylon drain disks (Millipore) as described in Semeniuk et al. (2009).
Samples for particulate organic carbon (POC) and nitrogen (PON) determination were taken at the initial, dilution and final time points by gentle filtration (<200 mmHg) on pre-combusted GF/F filters. Filters were stored in pre-combusted glass petri dishes at −20°C. Filters were acid fumed over concentrated HCl for 2–3 days. Subsequently, filters were dried at 60°C over night. Carbon and nitrogen amounts were measured on CHN analyser (1106 Carlo Erba) with a precision of ± 1.3%.
In parallel to the POC samples, aliquots for the determination of biogenic silica (bSi [bSiO2]) were gently filtered onto 0.6 μm cellulose acetate filter (Sterlitech Corporation), and stored in plastic petri dishes at −20°C. Subsequently, filters were dried over night at 60°C. Alkaline hydrolysis with sodium hydroxide (NaOH) (Brzezinski and Nelson, 1989) was used to convert bSi into Si(OH)4. The concentration of Si(OH)4 was measured based on the formation of beta silicomolybdic acid with a UV/Vis spectrophotometer (Beckman DU 530), using a reverse-order reagent blank (Brzezinski and Nelson, 1986).
Samples for dissolved organic carbon (DOC) were taken in acid-washed and sample-rinsed HDPE bottles after filtration over rinsed GFF syringe filter through acid-washed plastic syringes. DOC concentrations were determined by high-temperature catalytic oxidation (HTCO) with a Shimadzu TOC/TN analyzer (Dittmar et al., 2008).
Samples for cell counts were fixed with a combination of buffered-formalin (2% final concentration) and glutaraldehyde (0.1% final concentration). Samples were analyzed on a light microscope (Axiovert, Zeiss) after 24 h sedimentation time in 10 mL Utermöhl chambers (Hydro-Bios). Unfortunately, sample aggregation due to strong precipitation of paraformaldehyde or trioxymethylene made quantitative cell counts impossible. We thus report only qualitative observations of large dominant groups in the various treatment samples.
Picoeukaryote abundances were investigated by means of flow cytometry (Marie et al., 2014). Phytoplankton cells were preserved in duplicate by adding 3.5 mL of sample to 100 μL fixation solution (yielding 0.5% formaldehyde and 0.3% hexamine final concentration). After gentle mixing, samples were stored at room temperature in the dark for 10 min, and subsequently frozen in liquid nitrogen and stored at −80°C until analysis. Before analysis, samples were thawed on ice and mixed thoroughly. Analysis of the <10 μm fraction of the plankton communities was performed based on red (FL3 channel, >670 nm) and green (FL1 channel, 533 ± 30 nm) fluorescence, as well as sideward and forward light scattering using a BD Accuri® C6 flow cytometer equipped a with blue solid-state laser (488 nm excitation wavelength). Phytoplankton samples were primarily analyzed based on the cells autofluorescence signal (FL3; threshold = 800) on medium fluidics settings (35 μL min−1; 16 μm core size) with a limit of 50,000 events or 500 μL. Sizes of cells were based on previous measurements of calibration beads and phytoplankton cultures (I. Luddington, pers. comm.). As the absolute cell number is strongly dependent on the time point of sampling, it does not give a clear indication of the fraction of picoeukaryotes of the whole assemblage. Further, as we did not observe microzooplankton in our samples, POC concentrations represent a valid estimate for total phytoplankton biomass. POC-normalized picoeukaryote counts are thus the best available estimator for picoplankton abundances.
Net Primary production (NPP) was determined from all bottles on dilution and final days using 24 h incubations under the experimental light conditions (i.e., under LL and HL in on-deck incubators). An 18 μCi spike of NaH14CO3 (PerkinElmer, 53.1 mCi mmol−1 or 2.109 MBq mol−1 stock) was added to 180 mL sub-samples. These sub-samples were divided into duplicate 60 ml samples for incubations, a 50 ml sample that was filtered immediately after spiking (T0), and three 0.5 ml aliquots, which were used to determine the total activity in each spiked sample (total counts, TC) after addition of 0.5 ml 1N NaOH. After 24 h, incubated samples were filtered onto GF/F-filters, acidified with 1 ml 6N HCl and left to degas overnight. After addition of 10 mL of scintillation cocktail (ECOLUMTM, MP Biomedicals), samples were vortexed and left to stand in the dark for ~12 h before counting on a liquid scintillation counter (DPMsample; Tri-Carb, PerkinElmer), using automatic quench correction and a counting time of 5 min. NPP rates [μg C (μg Chla)−1 d−1] were calculated as
where [DIC] and [Chla] denote the concentrations of dissolved inorganic carbon and Chla in the sample, respectively. DPMsample denotes the disintegrations per minute (DPM) in each sample, DPMT0 reflects the T0 value, DPMTC denotes the DPM of the TC sample, and t is the duration of the incubation. The value of 1.05 corrects for the fractionation against 14C relative to 12C (Nielsen, 1955).
Sub-samples for basic photophysiology measurements via fast repetition rate fluorometry (FRRF) were taken daily at approx. 1 h after local sunrise. Samples were kept at low light and temperatures corresponding to incubator temperatures for a minimum of 30 min before measurements, in order to achieve dark-acclimation. All FRRF measurements were conducted on a benchtop FRRF instrument (Soliense Instuments) as described in Schuback et al. (2017). For each sample, a single turnover protocol (70 flashlets with 0.7 μs length and 2.5 μs interval, 87,800 μmol quantam−2 s−1 peak power intensity, resulting in an excitation sequence of 225 μs, providing ~7–12 quanta per RCII), was applied to derive the chlorophyll a fluorescence (ChlF) yields Fo and Fm. These were used to calculate Fv/Fm (= (Fm-Fo)/Fm), a parameter which provides an estimate of the quantum efficiency of charge separation in PSII. Furthermore, we derived the functional absorption cross section σPSII (Å2 RCII−1).
On dilution and final sampling days, we conducted additional measurements of steady state light curves, as described in Schuback et al. (2017). Rates of initial charge separation in reaction center II (ETRRCII, mol e− mol RCII s−1) were calculated from ChlF yields measured at 9 incrementally increasing background PAR levels and the exponential model of Webb et al. (1974) was used to fit ETRRCII vs. light curves and derive the maximum, light saturated rate PRCIImax (mol e−mol RCII−1 s−1), the light-depended increase in ETRRCII before light saturation αRCII (mol e−mol RCII−1 s−1 [μmol quanta m−2 s−1]−1) and the light saturation parameter Ek (μmol quanta m−2 s−1).
Two hour 14C-uptake light response curves were conducted from all bottles on dilution and final days. 250 ml from each incubation bottle was spiked with NaH14CO3 (PerkinElmer, 53.1 mCi mmol−1 stock, final concentration 22 kBq mL−1, 2.109 MBq mol−1 specific activity), and the spiked sample was aliquoted into 20 ml glass scintillation vials, which were incubated for 2 h at 10 light intensities ranging from 10 to 500 μmol quanta m−2 s−1. Two 20 ml samples per bottle were filtered immediately after spiking (T0), and three 0.5 ml aliquots were taken from each spiked sample and added to 0.5 ml 1N NaOH to determine the total activity (total counts, TC). The 2 h incubations were ended by filtering the samples onto 25 mm GF/F filter, which were acidified with 0.5 ml 1N HCl and left to degas on an orbital shaker for 24 h. After degassing, 10 ml scintillation cocktail (ECOLUMTM, MP Biomedicals) were added to each vial, and vials were treated as described above for 24 h 14C experiments. 14C-uptake rates were normalized to [Chla] and light response curves were fit to the model of Webb et al. (1974) to derive the maximum, light saturated rate Pchlamax (mol C (mol Chla)−1 s−1), the light-depended increase in 14C-uptake before light saturation αRCII (mol C (mol Chla)−1 s−1 [μmol quanta m−2 s−1]−1) and the light saturation parameter Ek (μmol quanta m−2 s−1).
Samples for phytoplankton light absorption spectra were taken from each bottle at dilution and final days and analyzed using the quantitative filter pad technique (Mitchell et al., 2002) essentially as described in Schuback et al. (2016). The spectral distribution of light available to phytoplankton in the incubation bottles, in the photosynthetron and in the FRRF instrument was measured using a micro-spectrometer equipped with a fiber-optic probe (STS-VIS, Ocean Optics). A spectral correction factor was then derived and applied to correct values of σPSII (and consequently ETRRCII) as well as short-term 14C-uptake rates (Schuback et al., 2016). Spectrally corrected rates of 2 h 14C-uptake and ETRRCII were utilized to derive the conversion factor κ/nPSII (mol e−mol C−1(mol Chla) mol RCII−1) at light limitation (= αRCII/ αChla) and light saturation (= PRCIImax/ PChlamax), as described in more detail in Schuback et al. (2015, 2016).
Except for the light response curves, all data are given as the mean of three replicates with ± one standard deviation. We define the low light and low pCO2 conditions (LL LC) as our control treatment. To test for significant differences between the treatments, two-way analyses of variance (ANOVA) with additional Kolmogorov-Smirnov normality and Tukey post-hoc tests were performed. The significance level was set to 0.05. Statistical analyses were performed with the program SigmaPlot (SysStat Software Inc.). Regarding the light response curves, replicate measurements were combined before curve fitting. Here, significant differences were defined as situations where the 0.95 confidence interval of derived fit parameters did not overlap.
The sampling took place in in mid-July in the Southern Davis Strait. The location was characterized by strong salinity stratification and a shallow mixed layer (~10 m). A sub-surface Chla maximum (up to 3.5 μg L−1) was present below the secondary mixed layer at about 30–45 m depths (Figure SI1). Sampling was conducted at the bottom of the Chla maximum at 50–55m depth, where the water temperature was −1.5°C, salinity was 32.44 and seawater pCO2 was slightly below atmospheric values (Table SI1). Initial macronutrient concentrations in the sampled seawater were 8.1 μM nitrate, 0.8 μM phosphate and 8.0 μM silicate (Table SI1). Chla concentrations were 0.41 μg L−1, with 41% of total Chla in the >5 μm size fraction.
The initial phytoplankton assemblage was composed of a mix of picoeukaryotes dinoflagellates (Prorocentrum sp. being most abundant), and diatoms. The observed distinct picoeukaryote population occurring in all incubations was identified as Micromonas pusilla (the most dominant species in the Arctic Ocean) based on previous measurements with a culture of this species as well as literature data (Lovejoy et al., 2007). Within the diatom assemblage, microscopic examination revealed about 10 genera, with Fragilariopsis sp. and Pseudo-nitzschia sp. present in higher numbers than other genera (e.g., Chaetoceros spp., Thalassiosira sp.). As discussed in the methods sections, precipitation of the fixative made it impossible to derive good quantitative counts of the various species in our samples. However, our qualitative observations indicate that there was no clear dominance of any particular phytoplankton group within the initial assemblage.
The PAR on the day before sampling can be taken as an indicator of the light climate to which phytoplankton were exposed to before the experiment. Average PAR above the sea surface was 544 μmol photons m−2 s−1, with a noon maximum of 1,282 μmol photons m−2 s−1. Based on a Kd of 0.8–0.09 m−1 (taken from two light profiles measured close to the sampling location), these irradiances correspond to an average PAR of 4–10 μmol photons m−2 s−1 and a maximum of 24 μmol photons m−2 s−1 at depth were water was collected. Initial POC-normalized NPP was 0.028 ± 0.001 and 0.019 ± 0.001 μmol C (μmol POC)−1 d−1 in LL and HL treatments, respectively. Initial Fv/Fm values were 0.52 ± 0.01, suggesting that cells experienced no stress or nutrient limitation.
Over the 2 weeks of on-deck incubation (comprising 6–7 days before and after the dilution), surface water temperatures and sea surface PAR levels varied substantially. Average daily PAR above the sea surface was 440 ± 130 μmol photons m−2 s−1, with average maximum values of 1,445 ± 215 μmol photons m−2 s−1, and a range of daily maximum values from 945 to 1,755 μmol photons m−2 s−1. Average and maximum PAR values during the initial growth phase before the dilution were 80 and 215 μmol photons m−2 s−1 higher than during the second growth phase between dilution and final sampling. Please note that these PAR levels were reduced to 15 and 35% in LL and HL treatments, respectively.
Due to significant variability in SST across the ship's track during the course of the experiment, temperatures within the incubators ranged between ~4.5 and 15.0°C, with an average of 7.9 ± 2.1°C. At the start of the experiment, the temperatures were about 10–12°C, and these temperatures decreased to mean values around 5–7°C within the first 2 days of the experiment and rose to higher values of about 7–15°C for the last few days. Please note that temperatures in the incubators were about 6°C higher than in situ surface water values. This thermal offset was primarily due to warming of the seawater in transit through the ship's flow-through system. We argue that our experimental setup nonetheless reflects a realistic scenario as the incubation temperatures were close the range of current naturally occurring, and certainly in that of future Subarctic waters temperatures in Arctic outflow shelf regions (Straneo and Heimbach, 2013; Pörtner et al., 2014). Thus, the observed results seem to be a realistic representation for Arctic phytoplankton assemblages.
Carbonate chemistry in the different treatment bottles was well controlled, with average pH of 8.04 ± 0.07 and 7.64 ± 0.05 for LC and HC levels, respectively (Figure 2). Corresponding pCO2 levels (measured directly before the dilution and at final sampling point) for the HC and LC treatments were 300 ± 40 and 955 ± 85 μatm, respectively (Table SI2). During the last 2 days of the experiment, pH started to drift slightly due to biomass build-up (~0.10–0.15 units, equivalent to 100 μatm pCO2; Figure 2).
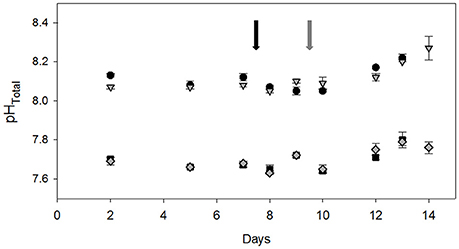
Figure 2. Development of pHtotal in LL LC (black circles), LL HL (black squares), HL LC (gray triangles), and HL HC (gray diamonds) treatments over the course of the incubation experiment (n = 3 ± errors bars indicate 1 s.d.). The arrows indicate the time of dilution for LL (black) and HL (gray) treatments.
Nutrient additions yielded values of up to 17 μM NO−3, 2.5 μM PO3−4 and 30 μM Si(OH)4. Higher phosphate levels (13 μM) were present during the first grow-up phase due to an inadvertent addition of excess PO3−4 to all incubation bottles. On the last day of the experiment, phytoplankton exhausted NO−3 concentrations in all HL LC and one HL HC bottle. However, high Fv/Fm and NPP measured in these bottles suggests that phytoplankton did not experience significant nutrient stress (Figures 3, 5). In the LL treatments, residual nutrients exceeded 10 μM for NO−3 and Si(OH)4 as well as 1.5 μM for PO3−4.
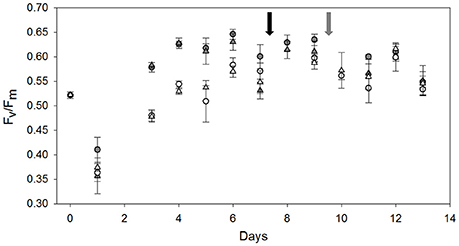
Figure 3. Development of the dark-acclimated photosynthetic quantum efficiency (Fv/Fm) in LL LC (gray circles), LL HL (gray triangles), HL LC (open circles), and HL HC (open triangles) treatments over the course of the experiment (n = 3, errors bars indicate 1 s.d.). The arrows indicate the time of dilution for LL (black) and HL (gray) treatments.
The biomass composition of the phytoplankton assemblages changed strongly over the course of the experiment, and were initially affected by both light and CO2 treatments. However, these effects decreased over the course of the experiment. POC to PON ratios varied between 6.6 and 8.7 mol C (mol N)−1 and did not show any consistent trends across the applied treatments or between time points (Table 1). The ratio of Chla to POC (Chla:C) in the HL treatments directly before the dilution was slightly higher than that under LL (two-way ANOVA, F = 21.3, p = 0.002), while the CO2 treatments had no effect (Table 1). During the final sampling, Chla:C ratios showed no overall light or OA effects. Small, but statistically significant light- and CO2-dependent trends were observed for bSi to POC ratios (bSi:C; Table 1). Before the dilution, the bSi:C ratios were higher under HL compared to LL (two-way ANOVA, F = 47.6, p < 0.001) and slightly lower under HC compared to LC (two-way ANOVA, F = 6.9, p = 0.034). During the final sampling, bSi:C ratios were two fold higher than those measured directly before the dilution, but there were no differences between treatments (Table 1). DOC concentrations at both sampling time points were not affected by any of the experimental treatments (123 ± 40 μmol L−1). POC-normalized DOC concentrations were between 1.7 and 3.5 mol DOC (mol POC)−1. The values of the initially sampled assemblage were more than an order of magnitude higher [60.1 ± 1.3 mol DOC (mol POC)−1], suggesting no significant DOC production in the incubations.
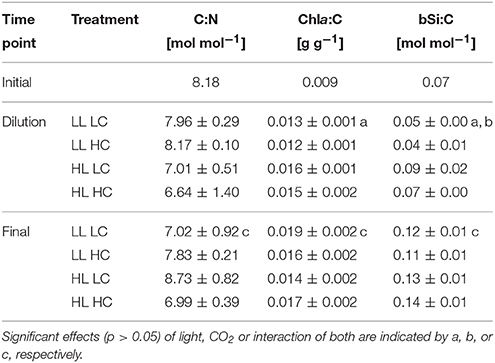
Table 1. Elemental composition of phytoplankton assemblages in terms of C:N, Chla:C and bSi:C ratios before the dilution and at the end of the experiment (n = 3; mean ± 1 s.d.).
The >5 μm Chla size fraction consisted almost exclusively of diatoms (Table 2). In the LL treatments, the >5 μm Chla size fraction directly before the dilution was with 37 ± 4% under LC and 32 ± 2% under HC (Table 2) less abundant compared to the initial assemblage (59%; Table SI1). Conversely, in the HL treatments the >5 μm size fraction increased to about 70%, with slightly lowered values under HC compared to LC (Table 2). Thus, the size-fractionation of Chla was significantly affected by both light (two-way ANOVA, F = 412.3, p < 0.001) and CO2 levels (two-way ANOVA, F = 10.0, p = 0.013). After the dilution, the >5 μm fraction increased in all treatments (Table 2). During the final sampling, the contribution of the >5 μm size fraction was significantly higher in the HL treatments (two-way ANOVA, F = 16.8, p = 0.003), and under low CO2 levels (two-way ANOVA, F = 11.8, p = 0.009).
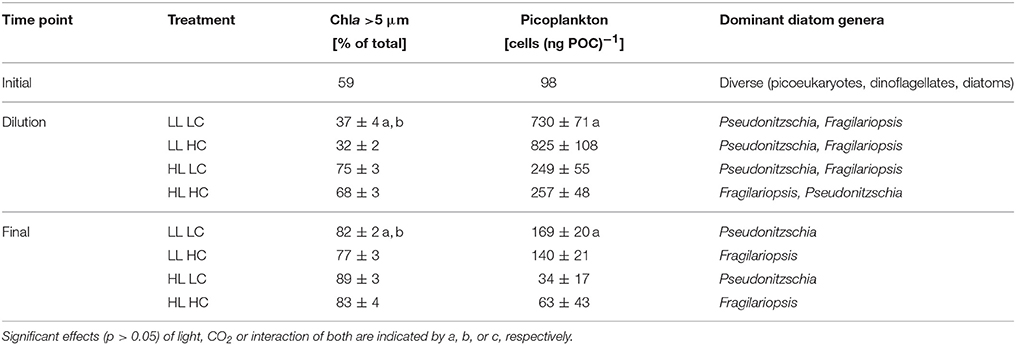
Table 2. Composition of phytoplankton assemblages characterized by the proportion of the >5 μm size-fraction to total Chla, C-normalized picoplankton counts as well as the dominant diatom genera before the dilution and at the end of the experiment (n = 3; mean ± 1 s.d.).
Flow-cytometric analysis indicated that the <10 μm size fraction consisted mainly of picoeukaryotes (1–2 μm; likely Micromonas pusilla based on flow-cytometric characteristics and light microscopic analysis). The abundances of picoeukaryotes relative to POC before the dilution were about 30% lower under HL compared to LL (two-way ANOVAs, F = 149.7, p < 0.001; Table 2 and Figure 4). There was no CO2 effect on the abundances of these groups. During the final sampling, picoeukaryote counts per unit POC were about 60–80% lower under HL compared to LL (two-way ANOVA, F = 52.8, p < 0.001).
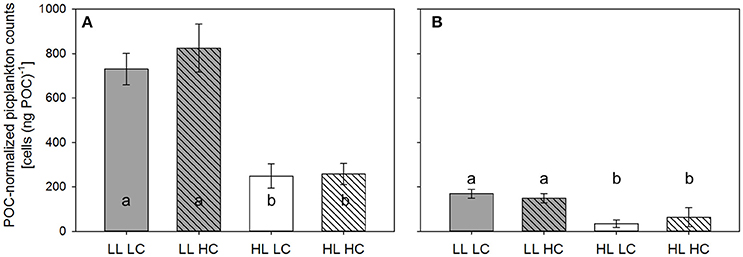
Figure 4. POC-normalized picoeukaryote counts measured in LL (gray bars) and HL incubators (white bars) under LC (open bars) and HC (hatched bars) over 24 h before the dilution (A) and the final sampling (B) of the experiment (n = 3, errors bars indicate 1 s.d.). Different letters indicate significant differences between treatments.
In all treatments, Pseudo-nitzschia cf. delicatissima and Fragilariopsis cf. cylindrus were the most abundant diatom species from the time of dilution onwards (Table 2). Prior to the dilutions, there were no apparent CO2 effects on diatom composition. However, during the final sampling, CO2 levels caused a strong increase (>50% of the cells present) in the dominance of P. delicatissima under LC and of F. cylindrus under HC (Table 2). Microzooplankton grazers such as ciliates were not observed in significant abundances.
Initially, we observed a clear acclimation phase to the incubation conditions. This was most visible in a 30% decline of Fv/Fm(0.52 ± 0.01 to 0.38 ± 0.03) between the initial sampling of the in situ population and the first incubation time-point on day 1 (Figure 3), indicating substantial high-light stress under all applied conditions. After this initial reduction, Fv/Fm progressively increased to values above 0.60, indicating full recovery from photo-inhibition. However, the time needed for recovery was substantially different in the two light treatments, with LL incubations recovering within 3 days, and HL incubations requiring 8 days to reach maximum Fv/Fm values (Figure 3).
In line with this, NPP was about 30% lower under HL compared to LL on the first day of the experiment (Table SI3). By the time of the dilution, however, NPP doubled with increasing light, but decreased by about 20% with increasing pCO2 (Figure 5, Table SI3; two-way ANOVAs, F = 70.9, p < 0.001 for light and F = 7.7, p = 0.027 for pCO2 treatments). At the final sampling, NPP rates had increased under LL conditions, and no significant treatment effects were observed by the end of the experiment (Figure 5).
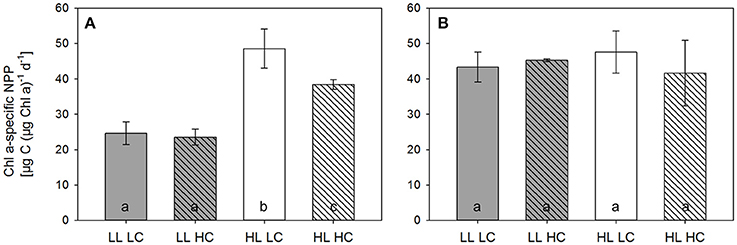
Figure 5. Chla-specific net primary production (NPP) measured in LL (gray bars) and HL incubators (white bars) under LC (open bars) and HC (hatched bars) over 24 h directly before the dilution (A) and the final sampling (B) of the experiment (n = 3, errors bars indicate 1 s.d.). Different letters indicate significant differences between treatments.
The efficiency of photosynthetic electron transport under limiting light levels (initial slope α-ETRRCII) directly before the dilution was more than 20% higher under LL compared to HL (Table 3). High pCO2 levels had a significant positive effect on photosynthetic electron transport, but only under LL conditions. The corresponding carbon fixation efficiency under limiting light levels (initial slope α-Cfix) was not affected by either light nor pCO2 (Table 3). Maximum rates of electron transport per RCII (Pmax-ETRRCII) and carbon fixation per Chla (Pmax-Cfix) were 30–50% higher under HL than LL before the dilutions. Similarly, the light saturation index for electron transport (Ek-ETRRCII) was about twice as high under HL compared to LL, but it did not differ between pCO2 levels (Table 3). In contrast, the light saturation index for carbon fixation (Ek-Cfix) did exhibit neither pCO2 nor light responses. The conversion factor from light saturated electron transport to carbon fixation (Pmax-KC/nPSII) under HL HC was significantly higher than in the other three treatments (15–20%; Figure 6, Table 3). During the final sampling, most of the fit parameters from ETRRCII- and 14C fixation-based light response curves (α, Ek, Pmax) were not different among treatments (Table 3). Only under HL, Pmax-ETRRCII increased with pCO2 by about 20%, while Pmax-Cfix decreased by a similar amount under these conditions, causing Pmax-KC/nPSII to be elevated by more than 40% compared to all other treatments (Figure 6).
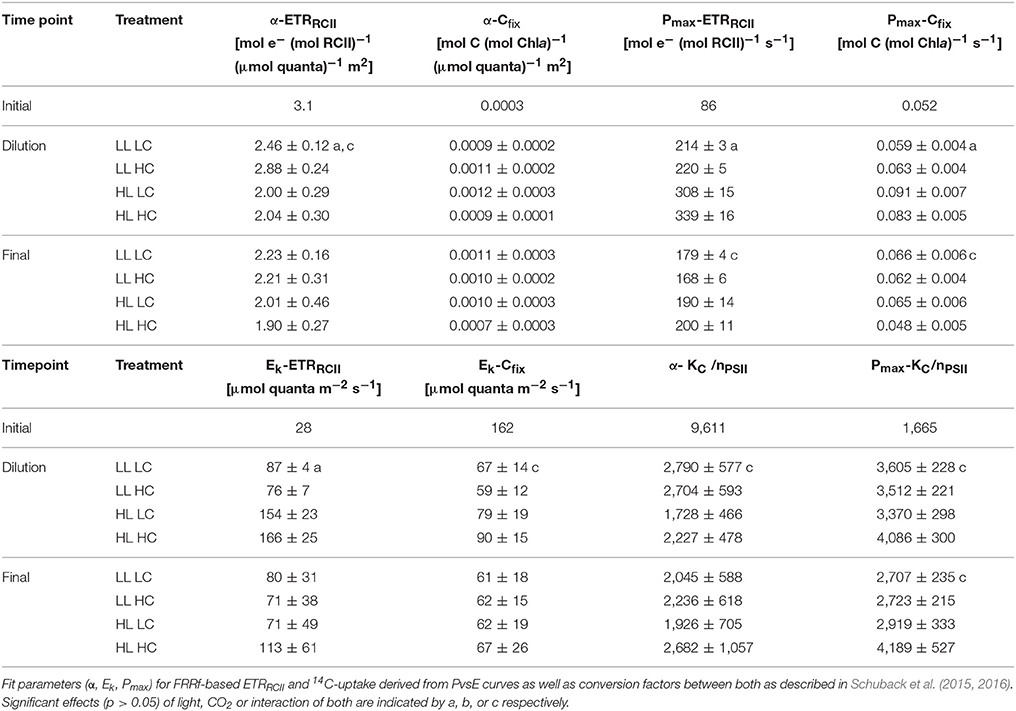
Table 3. Photophysiological characteristics of phytoplankton assemblages directly before the dilution and at the end of the experiment (n = 3; mean ±1 s.d.).
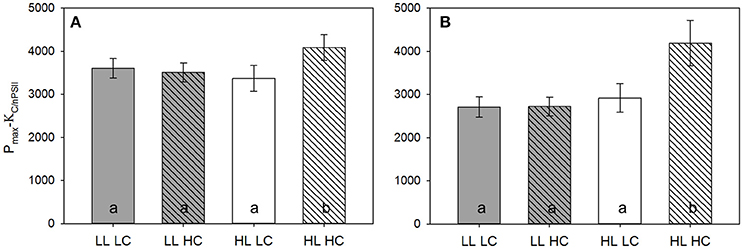
Figure 6. Conversion factor between maximum electron transport rates and carbon fixation, Pmax-KC/nPSII, as described in more detail in Schuback et al. (2016), measured in LL (gray bars) and HL incubators (white bars) under LC (open bars), and HC (hatched bars) over 24 h directly before the dilution (A) and the final sampling (B) of the experiment (n = 3, errors bars indicate 1 s.d.). Different letters indicate significant differences between treatment.
Phytoplankton thrive in highly variable environments. They therefore must be able to efficiently deal with both short- and long-term changes. The aim of this study was to understand if and how phytoplankton assemblages can acclimate to enhanced light and ocean acidification after mimicked upwelling, events that are increasingly observed in the Arctic summer and autumn (Ardyna et al., 2014). The assemblage was sampled in a sub-mixed layer depth with low mean irradiance levels, and thus had to deal with a strong increase in light intensities in a short period of time. During acclimation to the experimental conditions, initial physiological responses indicate high light stress, which was more pronounced under OA. In all treatments, the initial stress response to high light disappeared over time. The ability of the assemblage to acclimate can partially be explained by the developing dominance of different, but functionally redundant species in the different experimental treatments. The potential underlying mechanisms of the high resilience (i.e., efficient recovery from stress) of phytoplankton assemblages will be discussed.
Strong effects of increased irradiances on photo-physiology were observed after initiation of the experiment. Photosynthetic efficiency, measured as Fv/Fm, strongly decreased at the start of the experiment in all treatments (Figure 3). Recovery was, however, much faster under LL compared to HL. The initials assemblage consisted of both picoeukaryotes and diatoms, that were previously acclimated to low irradiance prevailing in the sub-surface Chla maximum. The lower abundance of picoeukaryotes (Figure 4, Table 2) and thus higher importance of diatoms in all HL treatments is consistent with the fact that diatoms possess higher photo-protective capabilities compared to picoeukaryotes, which are more likely to suffer from photo-inhibition and associated costs for photo-repair (Raven, 1998; Wagner et al., 2006). These differences in photo-physiology are well in line with the observation that diatoms dominate in dynamic mixed layers, while picoeukaryotes are adapted to more strongly stratified and thus more stable light conditions (Sarthou et al., 2005; Worden et al., 2009; Talmy et al., 2013).
Diatoms exhibit particularly high maximum growth rates and are, at least under high nutrient conditions, able to outcompete most other phytoplankton including picoeukaryotes (Raven, 1998; Assmy and Smetacek, 2009). This agrees well with the high NPP rates (Figure 5) measured in the diatom-dominated HL treatments before the dilution. Under LL, picoeukaryotes seemed to initially benefit from a lag phase in diatom growth, and were thus able to dominate the phytoplankton assemblages early in the experiment. Under HL, picoeukaryotes appeared to be photo-inhibited and thus outcompeted by diatoms under these conditions. The dominance of picoeukaryotes (mainly M. pusilla) under LL and diatoms under HL can also explain the counter-intuitively rising Chla:C ratios with increasing light (Table 1). Previous studies have shown low Chla:C ratios in M. pusilla resulting from high energy demand imposed by motility (Halsey et al., 2014) and its mixotrophic nature (McKie-Krisberg and Sanders, 2014). The lower Chla:C under LL in the initial part of the experiment thus may primarily reflect ecological shifts within the species assemblages, rather than photo-physiological effects.
Under high pCO2 levels, the high light-dependent dominance of diatoms was dampened. Within a given light level, we found that the bSi:POC ratios and the fraction of Chla >5 μm were significantly smaller under high pCO2 (Tables 1, 2), suggesting an increased importance of picoeukaryotes in the phytoplankton assemblages under OA. Our data are consistent with the results of earlier studies describing beneficial OA effects on picoeukaryotes, particularly on M. pusilla (Engel et al., 2008; Meakin and Wyman, 2011; Newbold et al., 2012; Brussaard et al., 2013; Maat et al., 2014). This CO2-dependent stimulation has been attributed to inefficient carbon concentrating mechanisms of M. pusilla (Engel et al., 2008), a high tendency to CO2 leakage (Raven, 1998), as well as the high surface to volume ratios of small cells (Brussaard et al., 2013), all of which would contribute to the beneficial effects of increased diffusive CO2 supply under OA (Rost et al., 2008).
Increased pCO2 levels also affected the responses in terms of bulk biomass build-up and photo-physiology. Both positive and negative interactive effects of pCO2 and irradiance on the performance of phytoplankton have been described in previous studies (e.g., Kranz et al., 2010; Wu et al., 2010; Gao et al., 2012; Rokitta and Rost, 2012), likely representing detrimental effects on pH homeostasis as well as beneficial effects on carbon acquisition under OA (Bach et al., 2013; Kottmeier et al., 2016). In the current study, NPP was significantly lowered by OA directly before the dilutions, and this effect was more pronounced under HL than under LL (Figure 5, Table SI3). Thus, the detrimental effects of OA seem to manifest more strongly under the relatively high PAR levels applied in the HL treatment. In fact, a significant decrease in Chla-specific NPP with increasing pCO2 was apparent under HL (Tukey post-hoc test, p = 0.01), while it was not significant under LL (Tukey post-hoc test, p = 0.75). This could be caused by an increased susceptibility of diatoms toward high light stress under high pCO2 levels (Wu et al., 2010; Gao et al., 2012; Hoppe et al., 2015).
In line with this, the conversion factor between ETRRCII and 14C-uptake at light-saturation (Pmax-KC/nPSII; Table 3, Figure 6) increased strongly with pCO2 under HL. This conversion factor consists of two parameters, the electron requirement of carbon fixation (KC [mol e− (mol C)−1]) and the Chla per functional reaction center of photosystem II (1/nPSII [mol Chla (mol RCII)−1]) (Schuback et al., 2015, 2016). While 1/nPSII varies with irradiances and nutrient availability as well as between taxonomic groups (Suggett et al., 2010), there is no indication that it depends on pCO2 levels. The energy transfer efficiency from photochemistry to biomass build-up (i.e., 1/KC) has been previously reported to decrease under OA and dynamic irradiances as a consequence of increased susceptibility toward high light stress (Hoppe et al., 2015; Kottmeier et al., 2016). Thus, higher respiratory costs for photo-repair mechanisms together with alternative electron pathways (satisfying higher ATP demands) may have caused the increase in the conversion factor and ultimately the lowered NPP rates observed under HL and HC (Figures 5, 6).
After an initial lag phase, HL-grown assemblages acclimated to the new growth conditions and managed to significantly increase NPP directly before the dilutions (Figure 5). After the dilution, also LL-acclimated assemblages managed to increase productivity. In fact, all OA- and light-dependent effects on Chla- and POC-specific NPP, evident until the time of dilution, disappeared at the final sampling (Figure 5, Table SI3). Hence, the assemblages were apparently quite resilient, i.e., able to return to stable conditions after disturbance (Scheffer and Carpenter, 2003). With respect to irradiance levels, for instance, the physiological characteristics of the assemblages converged to similar values irrespective of the light treatment at the end of the experiment (Tables 1, 3; Figure 5). This acclimation process was accompanied by an increasing dominance of diatoms (>85% of Chla >5 μm), and a strong decline in biomass-normalized picoeukaryote counts (Table 2). Even though diatoms have high capacities for photo-acclimation (Wagner et al., 2006; Lavaud, 2007), the lack of light effects on primary production at the end of the experiment is surprising, especially since the assemblage was initially sampled from a low-light environment. It is important to note, however, that our sampling region is characterized by high seasonal light variability imposed by changes in sea-ice conditions and stratification of the surface ocean (Carmack and Wassmann, 2006; Nicolaus et al., 2012). This may cause a high capacity to acclimate to a large range of irradiances. Further, our results are consistent with the results of previous studies showing no or only subtle stimulation in growth of Arctic phytoplankton under OA (Coello-Camba et al., 2014; Holding et al., 2015; Thoisen et al., 2015; Hoppe et al., under review).
Ultimately, this acclimation was highly efficient and no significant differences in terms of primary production were observed at the different light levels (Figure 5). This is in line with findings from the Southern Ocean, where blooms with very different light regimes imposed by mixing yielded similar NPP rates (Hoppe et al., 2017), as well as with data on Arctic blooms, which can show similar biomass build-up under stratified high light as well as ice- and snow-covered low light conditions (Assmy et al., 2017). The OA effects on primary production disappeared over time (Figure 5), even though pCO2 levels remained constant of the course of the experiment. The conversion factor between maximum electron transport rates and carbon fixation (Pmax-KC/nPSII), however, indicated that even at the end of the experiment, the energy transfer efficiency may still be reduced under HL and HC (Figure 6). Hence, the stable primary production (Figure 5) despite potentially higher energetic costs for photo-repair mechanisms (Figure 6) may have been achieved by increased photosynthetic energy generation. It seems that the compensatory effects at least partially took place on the level of intra-cellular energy supply and demand (Behrenfeld et al., 2008).
While the effects of OA on bulk parameters were rather minor at the end of the experiment, pCO2 nonetheless must have affected the competitive abilities of the dominant species. Throughout the experiment, significantly lower contribution of the >5 μm size fraction to the HC assemblages remained (Table 2), further supporting the beneficial effects of OA on picoeukaryotes discussed above. Also within the final diatom assemblages, different species dominated under the two pCO2 levels irrespective of the applied light conditions (Table 2). The shift between Pseudo-nitzschia delicatissima under LC and the Fragilariopsis cylindrus under HC is strikingly similar to previous experiments from the Southern Ocean studies (Tortell et al., 2008; Hoppe et al., 2013). Here, P. prolongatoides dominated the low pCO2 treatments in two, and F. curta dominated the high pCO2 levels in one of them (while in the other, Chaetoceros was the dominant taxa). In a laboratory study, an Antarctic P. subcurvata did not benefit from high pCO2 levels, while C. debilis or F. kergulensis increased their growth rates or maximal photosynthetic rates under high CO2 conditions (Trimborn et al., 2013). Pseudo-nitzschia does not appear to regulate photosynthesis as a function of pCO2 and thus seems unable to profit from OA (Trimborn et al., 2014). In contrast, F. kergulensis has been shown to efficiently acclimate to high pCO2 by increasing electron transport and carbon fixation rates (Trimborn et al., 2014). As primary production did not increase under HC, it seems that species dominance under OA was not determined by an increase in Fragilariopsis' growth and production rates (Pančić et al., 2015; Thoisen et al., 2015), but rather by the decreasing fitness of Pseudo-nitzschia with increasing pCO2 (Tortell et al., 2008; Hoppe et al., 2013; Trimborn et al., 2013).
Our results indicate that CO2-dependent shifts between functionally redundant species can “buffer” stronger OA responses observed in single strain experiments and be a mechanism underlying resilience in processes such as NPP. This trend is opposite to the results of OA experiments with Southern Ocean phytoplankton assemblages, in which changes in NPP and functional shifts in species composition amplified each other in terms of their effects on the biological carbon pump (Tortell et al., 2008; Hoppe et al., 2013). In summary, our results suggest that light treatments provoked physiological responses within the assemblages and affected species composition in the first days, while OA exerted a larger influence on diatom species composition by the end of the experiment. The combination of these physiological and ecological responses can be invoked to explain the observed interactive effects of light and CO2.
One needs to take into account that incubation temperatures were above in-situ values and generally variable over the course of the on-deck experiment, which could have affected the outcome of this experiment. Especially the 2°C higher values during the second half of the experiment could have helped to buffer OA effects at the final sampling (Sett et al., 2014). We argue, however, that the observed temperature range nonetheless reflects a realistic scenario for the future Arctic Ocean (AMAP, 2013; Pörtner et al., 2014). Thus, the here observed pattern could also apply to future Arctic phytoplankton assemblages. Most importantly, as the temperatures did not differ between pCO2 treatments, the described species shifts and potential for functional redundancy as a mechanism for resilience are independent of this issue.
Despite the strong initial stress response, efficient acclimation to the applied experimental conditions were observed over timescales of about one week. Such high physiological plasticity toward varying irradiance and pCO2 levels could be caused by the fact that the initial assemblage was taken from a coastal system. The prevailing strong gradients in irradiance and pCO2 levels in these systems (MacIntyre et al., 2000; Waldbusser and Salisbury, 2014) could help to explain the observed resilience of phytoplankton assemblages toward sudden changes in their growth environment. The question whether Arctic open ocean assemblages possess lower resilience toward OA and enhanced light, as has been observed for temperature responses (Coello-Camba et al., 2015), remains to be tested.
The resilience of Subarctic phytoplankton to some effects of ongoing climate change may be higher than previously thought. Furthermore, our study is the first to indicate that functional redundancy of different species within phytoplankton assemblages can lead to high resilience toward OA. The limits of such capacity to “absorb” change need to be investigated, as resilient systems can often respond by sudden and drastic shifts in ecosystem functions once certain threshold conditions are reached (Scheffer and Carpenter, 2003). Importantly, more scientific attention should be brought to those cases where experiments on climate change indicate little or no effect (Connell and Ghedini, 2015). Given the fast rates of climate change in high-latitude oceans, they seem a prime study locations for such investigation.
CH, NS, DS, MM, and BR designed the study. CH, NS, and DS conduced the experiment and acquired the data. CH and NS measured samples and analyzed the raw data. CH, NS, DS, MM, and BR interpreted the data. CH wrote the manuscript with support from all co-authors.
The authors declare that the research was conducted in the absence of any commercial or financial relationships that could be construed as a potential conflict of interest.
We wish to acknowledge the assistance of the crew and captain of GCCS Amundsen during our research expedition. We thank Jay Cullen and David Janssen for the provision and help with the operation of the trace-metal sampling rosette. Karina Giesbrecht and Diana Varela are acknowledged for their help with the biogenic silica as well as Jacoba Mol and Helmut Thomas for carbonate chemistry measurements. We are grateful for the nutrient measurements run by Isabelle Courchesne and Gabrièle Deslongchamps, the POC and PON measurements by Maureen Soon, the PAR data by Marjolaine Blais and Michel Gosselin as well as the DOC analysis by Mandy Kiel and Boris Koch. Julie LaRoche and Ian Luddington are acknowledged for their help with the flowcytometric measurements. Furthermore, we would like to thank Philippe Tortell, Tereza Jarníková, Nadine Lehmann, Jingxuan Li and Manuel Colombo for help during setup and sampling of the experiments. Special thanks go to Martine Lizotte for her support at various stages of the project. Funding for this work was provided from the Climate Change and Atmospheric Research program of the Natural Sciences and Engineering Research Council of Canada. CH received funding through a Feodor Lynen Research Fellowship granted by the Alexander von Humboldt foundation.
The Supplementary Material for this article can be found online at: http://journal.frontiersin.org/article/10.3389/fmars.2017.00229/full#supplementary-material
AMAP (2013). AMAP Assessment 2013: Arctic Ocean Acidification. Oslo: Arctic Monitoring and Assessment Programme (AMAP).
Ardyna, M., Babin, M., Gosselin, M., Devred, E., Rainville, L., and Tremblay, J.-É. (2014). Recent Arctic ocean sea ice loss triggers novel fall phytoplankton blooms. Geophys. Res. Lett. 1, 6207–6212. doi: 10.1002/2014GL061047
Assmy, P., Fernández-Méndez, M., Duarte, P., Meyer, A., Randelhoff, A., et al. (2017). Leads in Arctic pack ice enable early phytoplankton blooms below snow-covered sea ice. Nat. Sci. Rep. 7:40850. doi: 10.1038/srep40850
Assmy, P., and Smetacek, V. (2009). “Algal blooms,” in Encyclopedia of Microbiology, ed M. Schaechter (Oxford: Elsevier), 27–34. doi: 10.1016/b978-012373944-5.00001-8
Bach, L. T., Mackinder, L. C. M., Schulz, K. G., Wheeler, G., Schroeder, D. C., Brownlee, C., et al. (2013). Dissecting the impact of CO2 and pH on the mechanisms of photosynthesis and calcification in the coccolithophore Emiliania huxleyi. New Phytol. 199, 121–134. doi: 10.1111/nph.12225
Behrenfeld, M. J., Halsey, K. H., and Milligan, A. J. (2008). Evolved physiological responses of phytoplankton to their integrated growth environment. Philos. Trans. R. Soc. B Biol. Sci. 363, 2687–2703. doi: 10.1098/rstb.2008.0019
Brussaard, C. P. D., Noordeloos, A. A. M., Witte, H., Collenteur, M. C. J., Schulz, K., Ludwig, A., et al. (2013). Arctic microbial community dynamics influenced by elevated CO2 levels. Biogeosciences 10, 719–731. doi: 10.5194/bg-10-719-2013
Brzezinski, M. A., and Nelson, D. M. (1986). A solvent extraction method for the colorimetric determination of nanomolar concentrations of silicic acid in seawater. Mar. Chem. 19, 139–151. doi: 10.1016/0304-4203(86)90045-9
Brzezinski, M. A., and Nelson, D. M. (1989). Seasonal changes in the silicon cycle within a gulf stream warm-core ring. Deep Sea Res. A Oceanogr. Res. Papers 36, 1009–1030. doi: 10.1016/0198-0149(89)90075-7
Carmack, E., and Wassmann, P. (2006). Food webs and physical–biological coupling on pan-Arctic shelves: unifying concepts and comprehensive perspectives. Prog. Oceanogr. 71, 446–477. doi: 10.1016/j.pocean.2006.10.004
Coello-Camba, A., Agust,í, S., Holding, J., Arrieta, J. M., and Duarte, C. M. (2014). Interactive effect of temperature and CO2 increase in Arctic phytoplankton. Front. Mar. Sci. 1:49. doi: 10.3389/fmars.2014.00049
Coello-Camba, A., Agustí, S., Vaqué, D., Holding, J., Arrieta, J. M., Wassmann, P., et al. (2015). Experimental assessment of temperature thresholds for arctic phytoplankton communities. Estuaries Coasts 38, 873–885. doi: 10.1007/s12237-014-9849-7
Connell, S. D., and Ghedini, G. (2015). Resisting regime-shifts: the stabilising effect of compensatory processes. Trends Ecol. Evol. 30, 513–515. doi: 10.1016/j.tree.2015.06.014
Dickson, A. G. (1990). Standard potential of the reaction: AgCl(s) + ½ H2(g) = Ag(s) + HCl(aq), and the standard acidity constant of the ion HSO−4 in synthetic seawater from 273.15 to 318.15 K. J. Chem. Thermodyn. 22, 113–127. doi: 10.1016/0021-9614(90)90074-Z
Dickson, A. G., Sabine, C. L., and Christian, J. R. (2007). Guide to Best Practices for Ocean CO2 Measurements, PICES Special Publication 3. Sidney, BC: North Pacific Marine Science Organization.
Dittmar, T., Koch, B., Hertkorn, N., and Kattner, G. (2008). A simple and efficient method for the solid-phase extraction of dissolved organic matter (SPE-DOM) from seawater. Limnol. Oceanogr. Methods 6, 230–235. doi: 10.4319/lom.2008.6.230
Engel, A., Borchard, C., Piontek, J., Schulz, K. G., Riebesell, U., and Bellerby, R. (2013). CO2 increases 14C primary production in an Arctic plankton community. Biogeosciences 10, 1291–1308. doi: 10.5194/bg-10-1291-2013
Engel, A., Schulz, K. G., Riebesell, U., Bellerby, R., Delille, B., and Schartau, M. (2008). Effects of CO2 on particle size distribution and phytoplankton abundance during a mesocosm bloom experiment (PeECE II). Biogeosciences 5, 509–521. doi: 10.5194/bg-5-509-2008
Gao, K., and Campbell, D. A. (2014). Photophysiological responses of marine diatoms to elevated CO2 and decreased pH: a review. Funct. Plant Biol. 41, 449–459. doi: 10.1071/FP13247
Gao, K., Xu, J., Gao, G., and Li, Y. (2012). Rising CO2 and increased light exposure synergistically reduce marine primary productivity. Nat. Clim. Chang. 2, 519–523. doi: 10.1038/nclimate1507
Gaylord, B., Kroeker, K. J., Sunday, J. M., Anderson, K. M., Barry, J. P., Brown, N. E., et al. (2015). Ocean acidification through the lens of ecological theory. Ecology 96, 3–15. doi: 10.1890/14-0802.1
Ghedini, G., Russell, B. D., and Connell, S. D. (2015). Trophic compensation reinforces resistance: herbivory absorbs the increasing effects of multiple disturbances. Ecol. Lett. 18, 182–187. doi: 10.1111/ele.12405
Halsey, K. H., Milligan, A. J., and Behrenfeld, M. J. (2014). Contrasting strategies of photosynthetic energy utilization drive lifestyle strategies in ecologically important picoeukaryotes. Metabolites 4, 260–280. doi: 10.3390/metabo4020260
Holding, J. M., Duarte, C. M., Sanz-Martin, M., Mesa, E., et al. (2015). Temperature dependence of CO2-enhanced primary production in the European Arctic Ocean. Nat. Clim. Chang. 5, 1079–1082. doi: 10.1038/nclimate2768
Hoppe, C. J. M., Hassler, C. S., Payne, C. D., Tortell, P. D., Rost, B., and Trimborn, S. (2013). Iron limitation modulates ocean acidification effects on southern ocean phytoplankton communities. PLoS ONE 8:e79890. doi: 10.1371/journal.pone.0079890
Hoppe, C. J. M., Holtz, L.-M., Trimborn, S., and Rost, B. (2015). Ocean acidification decreases the light-use efficiency in an Antarctic diatom under dynamic but not constant light. New Phytol. 207, 159–171. doi: 10.1111/nph.13334
Hoppe, C. J. M., Klaas, C., Ossebaar, S., Soppa, M. A., Cheah, W., Laglera, L. M., et al. (2017). Controls of primary production in two phytoplankton blooms in the Antarctic Circumpolar Current. Deep Sea Res. Part II Top. Stud. Oceanogr. 138, 63–73. doi: 10.1016/j.dsr2.2015.10.005
Jin, P., Gao, K., Villafañe, V. E., Campbell, D. A., and Helbling, E. W. (2013). Ocean acidification alters the photosynthetic responses of a coccolithophorid to fluctuating ultraviolet and visible radiation. Plant Physiol. 162, 2084–2094. doi: 10.1104/pp.113.219543
Knap, A., Michaels, A., Close, A., Ducklow, H., and Dickson, A. G. (1996). Protocols for the Joint Global Ocean Flux Study (JGOFS) Core Measurements, Reprint of the IOC Manuals and Guides No. 29. UNESCO.
Kottmeier, D. M., Rokitta, S. D., and Rost, B. (2016). Acidification, not carbonation, is the major regulator of carbon fluxes in the coccolithophore Emiliania huxleyi. New Phytol. 211, 126–137. doi: 10.1111/nph.13885
Kranz, S. A., Levitan, O., Richter, K.-U., Prášil, O., Berman-Frank, I., and Rost, B. (2010). Combined effects of CO2 and light on the N2-fixing cyanobacterium Trichodesmium ims101: physiological responses. Plant Physiol. 154, 334–345. doi: 10.1104/pp.110.159145
Lavaud, J. (2007). Fast regulation of photosynthesis in diatoms: mechanisms, evolution and ecophysiology. Funct. Plant Sci. Biotechnol. 1, 267–287.
Levitus, S. (1982). “Climatological atlas of the world ocean,” in Prof. Paper 13, National Oceanic and Atmospheric Administration, Rockville, MD.
Lovejoy, C., Vincent, W. F., Bonilla, S., Roy, S., Martineau, M.-J., Terrado, R., et al. (2007). Distribution, phylogeny, and growth of cold-adapted picoprasinophytes in Arctic Seas. J. Phycol. 43, 78–89. doi: 10.1111/j.1529-8817.2006.00310.x
Maat, D. S., Crawfurd, K. J., Timmermans, K. R., and Brussaard, C. P. (2014). Elevated CO2 and phosphate limitation favor Micromonas pusilla through stimulated growth and reduced viral impact. Appl. Environ. Microbiol. 80, 3119–3127. doi: 10.1128/AEM.03639-13
MacIntyre, H. L., Kana, T. M., and Geider, R. J. (2000). The effect of water motion on short-term rates of photosynthesis by marine phytoplankton. Trends Plant Sci. 5, 12–17. doi: 10.1016/S1360-1385(99)01504-6
Marie, D., Rigaut-Jalabert, F., and Vaulot, D. (2014). An improved protocol for flow cytometry analysis of phytoplankton cultures and natural samples. Cytometry A 85, 962–968. doi: 10.1002/cyto.a.22517
McCarthy, A., Rogers, S. P., Duffy, S. J., and Campbell, D. A. (2012). Elevated carbon dioxide differentially alters the photophysiology of Thalassiosira pseudonana (bacillariophyceae) and Emiliania huxleyi (haptophyta). J. Phycol. 48, 635–646. doi: 10.1111/j.1529-8817.2012.01171.x
McKie-Krisberg, Z. M., and Sanders, R. W. (2014). Phagotrophy by the picoeukaryotic green alga Micromonas: implications for Arctic oceans. ISME J. 8, 1953–1961. doi: 10.1038/ismej.2014.16
Meakin, N. G., and Wyman, M. (2011). Rapid shifts in picoeukaryote community structure in response to ocean acidification. ISME J. 5, 1397–1405. doi: 10.1038/ismej.2011.18
Measures, C. I., Landing, W. M., Brown, M. T., and Buck, C. S. (2008). High-resolution Al and Fe data from the atlantic ocean CLIVAR-CO2 Repeat Hydrography A16N transect: extensive linkages between atmospheric dust and upper ocean geochemistry. Glob. Biogeochem. Cycles 22, 1944–9224. doi: 10.1029/2007GB003042
Mehrbach, C., Culberson, C. H., Hawley, J. E., and Pytkowicz, R. M. (1973). Measurement of the apparent dissociation constants of carbonic acid in seawater at atmospheric pressure. Limnol. Oceanogr. 18, 897–907. doi: 10.4319/lo.1973.18.6.0897
Millero, F. J., Pierrot, D., Lee, K., Wanninkhof, R., Feely, R., Sabine, C. L., et al. (2002). Dissociation constants for carbonic acid determined from field measurements. Deep Sea Res. 49, 1705–1723. doi: 10.1016/S0967-0637(02)00093-6
Mitchell, B. G., Kahru, M., Wieland, J., and Stramska, M. (2002). Determination of Spectral Absorption Coefficients of Particles, Dissolved Material and Phytoplankton for Discrete Water Samples. Greenbelt, MD: Godard Space Flight Center.
Newbold, L. K., Oliver, A. E., Booth, T., Tiwari, B., Desantis, T., Maguire, M., et al. (2012). The response of marine picoplankton to ocean acidification. Environ. Microbiol. 14, 2293–2307. doi: 10.1111/j.1462-2920.2012.02762.x
Nicolaus, M., Katlein, C., Maslanik, J., and Hendricks, S. (2012). Changes in Arctic sea ice result in increasing light transmittance and absorption. Geophys. Res. Lett. 39:L24501. doi: 10.1029/2012GL053738
Nielsen, E. S. (1955). The interaction of photosynthesis and respiration and its importance for the determination of 14C-discrimination in photosynthesis. Physiol. Plant. 8, 945–953. doi: 10.1111/j.1399-3054.1955.tb07790.x
Pančić, M., Hansen, P. J., Tammilehto, A., and Lundholm, N. (2015). Resilience to temperature and pH changes in a future climate change scenario in six strains of the polar diatom Fragilariopsis cylindrus. Biogeosciences 12, 4235–4244. doi: 10.5194/bg-12-4235-2015
Pierrot, D. E., Lewis, E., and Wallace, D. W. R. (2006). MS Exel Program Developed for CO2 System Calculations. Oak Ridge, TN: US Department of Energy.
Pörtner, H.-O., Karl, D. M., Boyd, P. W., Cheung, W. W. L., Lluch-Cota, S. E., Nojiri, Y., et al. (2014). “Ocean systems,” in Climate Change 2014: Impacts, Adaptation, and Vulnerability. Part A: Global and Sectoral Aspects. Contribution of Working Group II to the Fifth Assessment Report of the Intergovernmental Panel on Climate Change, eds C. B. Field, V. R. Barros, D. J. Dokken, K. J. Mach, M. D. Mastrandrea, T. E. Bilir, M. Chatterjee, K. L. Ebi, Y. O. Estrada, R. C. Genova, B. Girma, E. S. Kissel, A. N. Levy, S. MacCracken, P. R. Mastrandrea, and L. L. White (Cambridge; New York, NY: Cambridge University Press), 411–484.
Raven, J. (1998). The twelfth Tansley lecture. Small is beautiful: the picophytoplankton. Funct. Ecol. 12, 503–513. doi: 10.1046/j.1365-2435.1998.00233.x
Riebesell, U., and Gattuso, J.-P. (2015). Lessons learned from ocean acidification research. Nat. Clim. Chang. 5, 12–14. doi: 10.1038/nclimate2456
Rokitta, S. D., and Rost, B. (2012). Effects of CO2 and their modulation by light in the life-cycle stages of the coccolithophore Emiliania huxleyi. Limnol. Oceanogr. 57, 607–618. doi: 10.4319/lo.2012.57.2.0607
Rost, B., Zondervan, I., and Wolf-Gladrow, D. (2008). Sensitivity of phytoplankton to future changes in ocean carbonate chemistry: Current knowledge, contradictions and research needs. Theme section ‘effects on ocean acidification on marine ecosytems’. Mar. Ecol. Prog. Ser. 373, 227–237. doi: 10.3354/meps07776
Sarthou, G., Timmermans, K. R., Blain, S., and Tréguer, P. (2005). Growth physiology and fate of diatoms in the ocean: a review. J. Sea Res. 53, 25–42. doi: 10.1016/j.seares.2004.01.007
Scheffer, M., and Carpenter, S. R. (2003). Catastrophic regime shifts in ecosystems: linking theory to observation. Trends Ecol. Evol. 18, 648–656. doi: 10.1016/j.tree.2003.09.002
Schuback, N., Flecken, M., Maldonado, M. T., and Tortell, P. D. (2016). Diurnal variation in the coupling of photosynthetic electron transport and carbon fixation in iron-limited phytoplankton in the NE Subarctic Pacific. Biogeosciences 13, 1019–1035. doi: 10.5194/bg-13-1019-2016
Schuback, N., Hoppe, C. J. M., Tremblay, J.-E., Maldonado, M. T., and Tortell, P. D. (2017). Primary productivity and the coupling of photosynthetic electron transport and carbon fixation in the Arctic Ocean. Limnol. Oceanogr. 62, 898–921. doi: 10.1002/lno.10475
Schuback, N., Schallenberg, C., Duckham, C., Maldonado, M. T., and Tortell, P. D. (2015). Interacting effects of light and iron availability on the coupling of photosynthetic electron transport and CO2-assimilation in marine phytoplankton. PLoS ONE 10:e0133235. doi: 10.1371/journal.pone.0133235
Semeniuk, D. M., Cullen, J. T., Johnson, W. K., Gagnon, K., Ruth, T. J., and Maldonado, M. T. (2009). Plankton copper requirements and uptake in the Subarctic Northeast Pacific Ocean. Deep Sea Res. Part I Oceanogr. Res. Papers 56, 1130–1142. doi: 10.1016/j.dsr.2009.03.003
Sett, S., Bach, L. T., Schulz, K. G., Koch-Klavsen, S., Lebrato, M., and Riebesell, U. (2014). Temperature modulates coccolithophorid sensitivity of growth, photosynthesis and calcification to increasing seawater pCO2. PLoS ONE 9:e88308. doi: 10.1371/journal.pone.0088308
Steinacher, M., Joos, F., Frölicher, T. L., Bopp, L., Cadule, P., Cocco, V., et al. (2010). Projected 21st century decrease in marine productivity: a multi-model analysis. Biogeosciences 7, 979–1005. doi: 10.5194/bg-7-979-2010
Straneo, F., and Heimbach, P. (2013). North Atlantic warming and the retreat of Greenland's outlet glaciers. Nature 504, 36–43. doi: 10.1038/nature12854
Suggett, D. J., Borowitzka, M. A., and Prášil, O. E. (2010). Chlorophyll A Fluorescence in Aquatic Sciences: Methods and Applications, Vol. 4. Dordrecht: Springer, 326. doi: 10.1007/978-90-481-9268-7
Talmy, D., Blackford, J., Hardman-Mountford, N. J., Dumbrell, A. J., and Geider, R. J. (2013). An optimality model of photoadaptation in contrasting aquatic light regimes. Limnol. Oceanogr. 58, 1802–1818. doi: 10.4319/lo.2013.58.5.1802
Thoisen, C., Riisgaard, K., Lundholm, N., Nielsen, T. G., and Hansen, P. J. (2015). Effect of acidification on an Arctic phytoplankton community from Disko Bay, West Greenland. Mar. Ecol. Prog. Ser. 520, 21–34. doi: 10.3354/meps11123
Tortell, P. D., Payne, C. D., Li, Y., Trimborn, S., Rost, B., Smith, W. O., et al. (2008). CO2 sensitivity of Southern Ocean phytoplankton. Geophys. Res. Lett. 35:L04605. doi: 10.1029/2007GL032583
Trimborn, S., Brenneis, T., Sweet, E., and Rost, B. (2013). Sensitivity of Antarctic phytoplankton species to ocean acidification: growth carbon aquisition, and species interaction. Limnol. Oceanogr. 58, 997–1007. doi: 10.4319/lo.2013.58.3.0997
Trimborn, S., Thoms, S., Petrou, K., Kranz, S., and Rost, B. (2014). Physiological responses of Southern Ocean phytoplankton to instantaneous changes in light and CO2 supply. J. Exp. Mar. Biol. Ecol. 451, 44–54. doi: 10.1016/j.jembe.2013.11.001
Varela, D. E., Crawford, D. W., Wrohan, I. A., Wyatt, S. N., and Carmack, E. C. (2013). Pelagic primary productivity and upper ocean nutrient dynamics across Subarctic and Arctic Seas. J. Geophys. Res. Oceans 118, 7132–7152. doi: 10.1002/2013JC009211
Wagner, H., Jakob, T., and Wilhelm, C. (2006). Balancing the energy flow from captured light to biomass under fluctuating light conditions. New Phytol. 169, 95–108. doi: 10.1111/j.1469-8137.2005.01550.x
Waldbusser, G. G., and Salisbury, J. E. (2014). Ocean acidification in the coastal zone from an organism's perspective: multiple system parameters, frequency domains, and habitats. Ann. Rev. Mar. Sci. 6, 221–247. doi: 10.1146/annurev-marine-121211-172238
Webb, W. L., Newton, M., and Starr, D. (1974). Carbon dioxide exchange of Alnus rubra. Oecologia 17, 281–291. doi: 10.1007/BF00345747
Worden, A. Z., Lee, J.-H., Mock, T., Rouzé, P., Simmons, M. P., Aerts, A. L., et al. (2009). Green evolution and dynamic adaptations revealed by genomes of the marine picoeukaryotes Micromonas. Science 324, 268–272. doi: 10.1126/science.1167222
Keywords: multiple stressors, climate change, primary productivity, species composition, compensatory effects, diatoms
Citation: Hoppe CJM, Schuback N, Semeniuk DM, Maldonado MT and Rost B (2017) Functional Redundancy Facilitates Resilience of Subarctic Phytoplankton Assemblages toward Ocean Acidification and High Irradiance. Front. Mar. Sci. 4:229. doi: 10.3389/fmars.2017.00229
Received: 09 March 2017; Accepted: 06 July 2017;
Published: 25 July 2017.
Edited by:
Philip Boyd, University of Tasmania, AustraliaReviewed by:
Linn Hoffmann, University of Otago, New ZealandCopyright © 2017 Hoppe, Schuback, Semeniuk, Maldonado and Rost. This is an open-access article distributed under the terms of the Creative Commons Attribution License (CC BY). The use, distribution or reproduction in other forums is permitted, provided the original author(s) or licensor are credited and that the original publication in this journal is cited, in accordance with accepted academic practice. No use, distribution or reproduction is permitted which does not comply with these terms.
*Correspondence: Clara J. M. Hoppe, clara.hoppe@awi.de
†Present Address: Nina Schuback, Department of Physics and Astronomy, Curtin University, Perth, WA, Australia
Disclaimer: All claims expressed in this article are solely those of the authors and do not necessarily represent those of their affiliated organizations, or those of the publisher, the editors and the reviewers. Any product that may be evaluated in this article or claim that may be made by its manufacturer is not guaranteed or endorsed by the publisher.
Research integrity at Frontiers
Learn more about the work of our research integrity team to safeguard the quality of each article we publish.