 Brian J. Campbell1†Alex L. Sessions2*Daniel N. Fox3Blair G. Paul4Qianhui Qin5Matthias Y. Kellermann6David L. Valentine1,4
- 1Department of Earth Science, University of California, Santa Barbara, Santa Barbara, CA, United States
- 2Division of Geological and Planetary Sciences, California Institute of Technology, Pasadena, CA, United States
- 3Undergraduate College of Letters and Sciences, University of California, Santa Barbara, Santa Barbara, CA, United States
- 4Marine Science Institute, University of California, Santa Barbara, Santa Barbara, CA, United States
- 5Interdepartmental Graduate Program in Marine Science, University of California, Santa Barbara, Santa Barbara, CA, United States
- 6Institute for Chemistry and Biology of the Marine Environment, Carl von Ossietzky University, Wilhelmshaven, Germany
Fatty acids produced by H2-metabolizing bacteria are sometimes observed to be more D-depleted than those of photoautotrophic organisms, a trait that has been suggested as diagnostic for chemoautotrophic bacteria. The biochemical reasons for such a depletion are not known, but are often assumed to involve the strong D-depletion of H2. Here, we cultivated the bacterium Cupriavidus necator H16 (formerly Ralstonia eutropha H16) under aerobic, H2-consuming, chemoautotrophic conditions and measured the isotopic compositions of its fatty acids. In parallel with the wild type, two mutants of this strain, each lacking one of two key hydrogenase enzymes, were also grown and measured. In all three strains, fractionations between fatty acids and water ranged from -173‰ to -235‰, and averaged -217‰, -196‰, and -226‰, respectively, for the wild type, SH- mutant, and MBH- mutant. There was a modest increase in δD as a result of loss of the soluble hydrogenase enzyme. Fractionation curves for all three strains were constructed by growing parallel cultures in waters with δDwater values of approximately -25‰, 520‰, and 1100‰. These curves indicate that at least 90% of the hydrogen in fatty acids is derived from water, not H2. Published details of the biochemistry of the soluble and membrane-bound hydrogenases confirm that these enzymes transfer electrons rather than intact hydride (H-) ions, providing no direct mechanism to connect the isotopic composition of H2 to that of lipids. Multiple lines of evidence thus agree that in this organism, and presumably others like it, environmental H2 plays little or no direct role in controlling lipid δD values. The observed fractionations must instead result from isotope effects in the reduction of NAD(P)H by reductases with flavin prosthetic groups, which transfer two electrons and acquire H+ (or D+) from solution. Parallels to NADPH reduction in photosynthesis may explain why D/H fractionations in C. necator are nearly identical to those in many photoautotrophic algae and bacteria. We conclude that strong D-depletion is not a diagnostic feature of chemoautotrophy.
Introduction
The stable hydrogen isotope (D/H) ratios of n-alkyl lipids vary widely among the organisms that produce them. In plants and algae, fractionation between water and lipid hydrogen generally falls in a range of roughly –130‰ to –260‰ (Sessions et al., 1999; Chikaraishi et al., 2004; Zhang and Sachs, 2007; Chivall et al., 2014; Heinzelmann et al., 2015a). In heterotrophic microbes, the fractionation is typically smaller, and sometimes even reversed, leading to characteristically D-enriched lipids. Zhang et al. (2009a) further suggested that organisms using TCA-cycle substrates would produce more D-enriched lipids than those using glycolytic substrates, and this pattern has been largely confirmed in a number of other species of aerobic heterotrophs (Dirghangi and Pagani, 2013; Dawson et al., 2015; Heinzelmann et al., 2015b; Kopf et al., 2015; Osburn et al., 2016).
In contrast, chemoautotrophs have been studied much less frequently. Valentine et al. (2004) reported on Sporomusa sp., an anaerobic H2-consuming acetogen that exhibits very large D/H fractionations (>400‰) relative to water. Campbell et al. (2009) grew Desulfobacterium autotrophicum, an obligate anaerobe, on H2 + CO2 or on formate and observed D-depletions of lipids generally between 260 and 390‰. Fatty acids in cultures grown on H2 were only slightly (20–30‰) D-depleted relative to those grown on formate. Zhang et al. (2009a) presented data for Cupriavidus oxalaticus and C. necator grown aerobically on oxalate and formate, both of which lead to fractionations of 250–300‰. Heinzelmann et al. (2015b) grew Thiobacillus denitrificans on thiosulfate and measured fatty acids depleted in D by 217–275‰ relative to growth water. Osburn et al. (2011) presented data from a series of hot springs in Yellowstone National Park, in which C20 fatty acids were positively attributed to members of the order Aquificales. In this setting, Aquificales organisms are thought to grow as aerobic hydrogenotrophs, while their fatty acids exhibit D-depletions relative to ambient water of 250–300‰.
Together these findings suggested a pattern in which chemoautotrophs are D-depleted relative to photoautotrophs, but by quite variable amounts. Larger depletions seemed to be generally associated with anaerobes and/or with hydrogenotrophy, although no mechanistic understanding of those patterns has yet been proposed. H2 is very strongly D-depleted relative to water at equilibrium, by >600‰ (Horibe and Craig, 1995), providing a possible source for lower D/H ratios in hydrogenotrophs. Yet in the study of D. autotrophicum, Campbell et al. (2009) found that H2 contributed no hydrogen to lipids. Conversely, in cultures grown in D2O, the hydrogenotrophic methanogen Methanothermobacter thermautotrophicus derives part of its methane hydrogen indirectly from H2 via the hydrogenase-catalyzed release of H+ into the intracellular aqueous proton pool (Spencer et al., 1980). It thus remains unclear whether – or why – hydrogenotrophy should be associated with D-depletion of lipids.
To study such issues, we cultivated three strains of C. necator aerobically on H2 + CO2: strain H16 wild type, a mutant lacking the membrane-bound hydrogenase (MBH-), and a mutant lacking the soluble hydrogenase (SH-). Both of these hydrogenases catalyze the reversible, heterolytic oxidation of H2 to 2H+ + 2e- and are involved in energy generation. These mutants allowed a direct test of the involvement of hydrogenase enzymes in generating strongly D-depleted lipid signatures. We monitored the hydrogen isotopic composition of H2 during the growth of each culture and found that it shifted toward equilibrium with H2O. Parallel cultures grown in waters of varying D/H allowed us to indirectly assess the contributions of H2 and H2O to lipid hydrogen.
Materials and Methods
Bacterial Strains and Experimental Conditions
Cupriavidus necator H16 (DSM 428, ATCC 17699) is a Gram-negative, aerobic, facultatively lithoautotrophic, H2-oxidizing bacterium that has been widely studied and reported under previous names, including Hydrogenomonas H16, Alcaligenes eutrophus (Davis et al., 1969), Ralstonia eutropha (Yabuuchi et al., 1995), and Wautersia eutropha (Vaneechoutte et al., 2004). Most recently, W. eutropha was reassigned to the prior taxon C. necator (Vandamme and Coenye, 2004).
C. necator H16 was obtained from the German Collection of Microorganisms and Cell Cultures (DSMZ), as were two mutant strains isolated by Pfitzner (1974): SH- (strain LH-7, DSM 416) and MBH- (strain PH-9, DSM 418) (Schink and Schlegel, 1978). All strains were grown in phosphate-buffered mineral media for chemolithotrophic growth (DSMZ Medium 81). In the main experiment, each strain was grown in three separate cultures having no, moderate (∼500‰) and high (∼1100‰) levels of D-enrichment in the medium water. Culture media of differing D/H ratio were prepared by volumetric dilution of a 10% D2O stock to the required level (Campbell et al., 2009). To better understand variability, we conducted a second experiment in which C. necator H16 and the two hydrogenase mutants were cultivated in triplicate. These triplicate cultures of each strain were prepared without D-enrichment of the medium water.
Culture conditions were chosen to balance the following objectives: (1) maximize biomass available for isotopic analysis, (2) minimize shifts in isotopic composition of water and H2, and (3) safely handle combustible mixtures of H2 + O2. Cultures were therefore grown in moderate-sized batch cultures with headspace replenished once per day, as follows. The 200-mL cultures were grown in ∼1050-mL borosilicate glass bottles modified for closure with butyl rubber stoppers (13-mm inner diameter, 20-mm outer) and aluminum crimps. Before inoculation of sterile media, headspace gas was replaced with H2 + CO2 (80:20 by volume). Gas was sterilized by flow through a sterile, cotton-packed syringe after removal of trace O2 by flow through a heated steel column containing reduced copper filings (Hungate, 1969). The 250 mL of filter-sterilized atmospheric air was added to the headspace via syringe, yielding a slight overpressure and headspace gas composition of approximately 62% H2, 15% CO2, 5% O2, and 18% N2 (by volume). Headspace and liquid media were allowed to equilibrate overnight before inoculation.
Starter cultures of each strain were grown to optical density ≥ 1 (OD, 660 nm) in a single culture with δDwater ≈-25‰. To minimize the contribution of these cells to final biomass, they were diluted ∼10-fold by transfer into sterile medium (δDwater ≈-25‰). From this dilute culture, 1 mL was used to inoculate 200 mL sterile medium.
Cultures were incubated at 31°C with shaking at 100 rpm. Headspace gas composition was maintained by daily replacement with H2/CO2 and addition of air (as described above). OD was measured only once per day to minimize interference with the isotopic composition of headspace gases. The cultures of each strain were harvested when all three cultures exhibited OD > 0.9. Except where noted, collection and storage of samples for D/H analyses followed the protocol of Campbell et al. (2009). Water samples were collected from each culture immediately after inoculation and immediately before harvest. A single gas sample of ∼10 mL was collected from each bottle immediately prior to harvest. In the first experiment, wild-type and MBH- cultures were harvested after collection of final H2 and water samples on the seventh day after inoculation. SH- cultures were similarly harvested on the 16th day after inoculation. In the second experiment, all cultures were harvested after collection of final H2 and water samples on the 23rd day after inoculation. For the first experiment, biomass was collected via vacuum filtration onto precombusted glass-microfiber filters (Whatman GF/F, 0.7-μm nominal pore size). Filtration apparatus was soaked in 5% HCl and rinsed thoroughly with milli-Q water between harvesting successive cultures. For the second experiment, biomass was pelleted by centrifugation and kept frozen prior to extraction.
Fatty Acid and Polar Lipid Analyses
Harvested biomass for fatty acid analyses was first lyophilized, then saponified in 1M KOH/H2O (70°C, 6 h) to provide the maximum yield of free fatty acids. pH was adjusted to <2 with 6M HCl, and the fatty acids were extracted into methyl t-butyl ether (Valentine et al., 2004). In the main experiment, a 10% aliquot of the extract from each sample was derivatized as the trimethylsilyl (TMS) ethers by reaction with bis-trifluoroacetamide (BSTFA) at 40°C for 15 min, and analyzed by gas chromatography/mass spectrometry (GC/MS) on a Thermo Trace GC/DSQII MS. Fatty acid TMS ethers were identified from their mass spectra and retention times by comparison to library spectra and authentic standards. Double bond position for the 18:1Δ9 fatty acid was confirmed by analysis of the picolinic ester, which fragments distinctively at the double bond position (Christie, 2003). The cyc-17:0, cyc-19:0, and OH-14:0 fatty acids were identified by comparison to an authentic standard of bacterial fatty acids (Sigma Chemical, St. Louis, MO, United States). Fatty acids were quantified as their TMS ethers by splitting ∼30% of the GC effluent to a flame ionization detector (FID). Samples were quantified relative to an internal standard (palmitic acid isobutyl ester) assuming equal response factors for all compounds. In the second experiment involving triplicate cultures in water without D-enrichment, fatty acids were derivatized and quantified as fatty acid methyl esters only. Hydroxyl-fatty acids were not quantified for this experiment.
To provide a more comprehensive understanding of membrane lipid composition, biomass from the second experiment was also subjected to polar lipid analysis. Biomass was first lyophilized and then aliquots were extracted according to a modified Bligh and Dyer protocol (Kellermann et al., 2016). In brief, a combination of lyophilized cell pellets and 3 g of pre-combusted silica sand were extracted in four cycles by ultrasonication using a solvent mixture (ratio 2:1:0.8; v:v:v) of methanol (MeOH), dichloromethane (DCM), and aqueous buffer solution. A phosphate buffer (8.7 g l-1 KH2PO4, pH 7.4) was used for the first two and a trichloroacetic acid buffer (50 gl-1 TCA, pH 2) for the last two extraction steps. After each extraction, the solution was separated by centrifugation and all four supernatants were consecutively pooled in a separatory funnel, in which DCM and water had been added to facilitate optimal phase separation. After transfer of the organic phase, the remaining aqueous phase was extracted two more times with DCM. Finally, the pooled organic layers were washed three times with deionized milliQ water and the total lipid extract evaporated under a stream of N2 and stored at -20°C.
For polar lipid analysis, an aliquot of the total lipid extract was dissolved in MeOH:DCM, (9:1, v:v) and analyzed using a quadrupole time-of-flight mass spectrometer (Q-ToF-MS). Chromatographic separation was achieved on a Waters Acquity BEH C18 column (1.7 μm, 2.1 × 150 mm) with an ACQUITY Ultra Performance Liquid Chromatography (UPLC) H-Class System (Waters Co., Milford, MA, United States) coupled to a Synapt G2-Si HDMS high-resolution Q-ToF-MS (Waters Co., Manchester, United Kingdom) equipped with a LockSpray dual electrospray ion source operated in both positive (POS) and negative (NEG) ionization modes. The Q-ToF-MS was calibrated in resolution mode over a mass-to-charge (m/z) ranging from 50 to 2000 by using a 0.5 mmol L-1 sodium formate solution. For each run leucine enkephalin was used as lock mass, generating a reference ion for POS ([M+H]+ = 556.2771) and NEG ionization mode ([M-H]- = 554.2615) to ensure a mass tolerance for all MS or MS/MS experiments of less than 1 ppm. Mass spectral data were collected using the MSe data acquisition function to simultaneously obtain information on the intact molecule (no collision energy applied) as well as their fragmentation data (collision energy ramp reaching from 15 to 75 eV).
Analytes were eluted at a flow rate of 0.4 ml min-1 using a linear gradient of MeOH:H2O (85:15, v:v, eluent A) to MeOH:isopropanol (50:50, v:v, eluent B) both with 0.04% formic acid and 0.1% aqueous NH3 (Wörmer et al., 2013). The initial condition was 100% A held for 2 min, followed by a gradient to 15% B in 0.1 min and a gradient to 85% B in 18 min. The column was then washed with 100% B for 8 min and subsequently returned and held for 5 min to the initial conditions to equilibrate the column for the following run. The column temperature was set to 65°C.
Lipid identification was achieved by analyzing the exact masses of possible precursor ions in positive and negative ionization modes, in combination with their characteristic fragmentation patterns and compound identities described in previous studies (i.e., Kellermann et al., 2011; Tavormina et al., 2017). FA species of the individual polar lipids were identified in negative ionization mode. That is, after collisional activation of a polar lipid, the FA species are liberated with a neutral loss of water to yield an [M - H - 18]- ion. Note that the identification based on MS and MS/MS is a tentative characterization of the analytes. For comparison, all molecular ions (and their adducts) were quantified in positive ionization mode. Since response factors of individual lipid molecules were not accounted for, we only compare relative distribution of lipid species among samples.
Hydrogen Isotopic Analyses
D/H ratios of water were analyzed with a pyrolysis elemental analyzer (ThermoElectron TC/EA) at UCSB as described by Campbell et al. (2009) and are reported as part-per-thousand (permil, or ‰) deviations from the VSMOW international standard in the conventional δD notation. δD values were calibrated by comparison to two NIST Standard Reference Materials (VSMOW, δD = 0.0‰ and GISP, δD = -189.8‰) and three laboratory working standards of intermediate δD values. The root mean square (RMS) error of δD values for all analyzed standards (n = 48) was 3.3‰, which we interpret as the minimum uncertainty in measured values for δDwater.
Fatty acids were further purified from the remaining (90%) lipid extract by separation into four fractions by solid-phase extraction on an amino-propyl stationary phase following the methodology of Sessions (2006). Fatty acids (fraction 4) were then derivatized as methyl esters by reaction with BF3/MeOH (60°C for 10 min), and further reacted with acetic anhydride/pyridine (80°C for 20 min) to produce the acetate derivatives of hydroxyl-fatty acids. D/H ratios of fatty acid esters were determined by reference to both internal (coinjected) and external standard n-alkanes similar to those described by Campbell et al. (2009). The pooled standard deviation for replicate analyses of the external n-alkane standards was 1.4‰, and the RMS error was 3.3‰ (n = 30). The pooled standard deviation for measurements of n-alkane standards coinjected with samples, was 3.4‰ (n = 54). δD values of FAMEs were corrected for the contributions of methyl and acetyl groups as described by Valentine et al. (2004) and Campbell et al. (2009).
Samples of culture headspace gas for analysis of H2 isotope ratio were dried by passing over anhydrous CaSO4, then stored in glass serum bottles with butyl rubber stoppers until analysis, 197–206 days. Samples were introduced to the IRMS via a ThermoElectron GasBench device, with δD values measured directly on the H2 by comparison to standards (Campbell et al., 2009). Mean precision for unknown samples was 3.4‰.
Isotope Data Analysis
C. necator metabolizes two potential sources of hydrogen: water and H2. By varying the isotopic compositions of the inputs, and measuring the concomitant changes in isotopic composition of lipids, we can deduce the relative contributions of those two sources to lipid hydrogen. A complication, however, is that uptake/utilization of hydrogen from either H2 or H2O is likely accompanied by kinetic fractionations of substantial magnitude. It is not possible to uniquely deconvolve both the relative contributions of those two external sources, and the isotopic fractionations associated with each, using the experimental data available here (see discussion in Sessions and Hayes, 2005). Instead, we follow the approach of Zhang et al. (2009a) in constructing ‘fractionation curves,’ as follows.
Isotopic abundance data for lipids and water reported in delta notation by the Isodat software were first converted to isotope ratios using Rx = (δDx + 1)Rstd, where δDx is the measured δD value of sample x and Rstd is the isotope ratio of VSMOW: 0.00015576 (Hagemann et al., 1970). For each fatty acid, we then fit the data from parallel cultures that were grown in water of differing δD values to an equation (Sessions and Hayes, 2005) of the form.
where R is the isotope ratio of fatty acids, growth water, and hydrogen gas, α is the net isotopic fractionation factor associated with utilization of each hydrogen source, and Xwater is the abundance-fraction of fatty acid hydrogen originating from water (as opposed to H2). Briefly, a linear regression of RFA against Rwater yields a slope equal to XwaterαFA/water, and an intercept equal to (1 -Xwater)αFA/H2RH2. Since RH2 is known, (1 -Xwater)αFA/H2 can be computed directly. This leaves three unknowns (Xwater, αFA/water, αFA/H2) and only two constraints. The set of all possible solutions that satisfy the experimental constraints (for a given fatty acid under constant growth conditions) then define a curve in a plot of αFA/water versus αFA/H2, which Zhang et al. (2009a) termed a ‘fractionation curve.’ Further inferences about the magnitudes of the individual fractionations can be drawn from this construct, as discussed in Sections “Results” and “Discussion.”
Results
Culture Conditions and Growth
Conditions for the nine independent cultures of the first experiment are summarized in Table 1. In cultures with low-D water, δDwater increased slightly (4–6‰) over time, while the other treatments exhibited no significant change in δDwater. Culture media with the lowest δDwater values were farthest from isotopic equilibrium with the supplied H2, and D-enrichment of water in these cultures would be consistent with hydrogenase-catalyzed isotopic exchange between H2 and H2O (see discussion in Campbell et al., 2009). For the purpose of estimating fractionations, we adopt the average of the two water δD measurements for each culture (reported in Table 1).
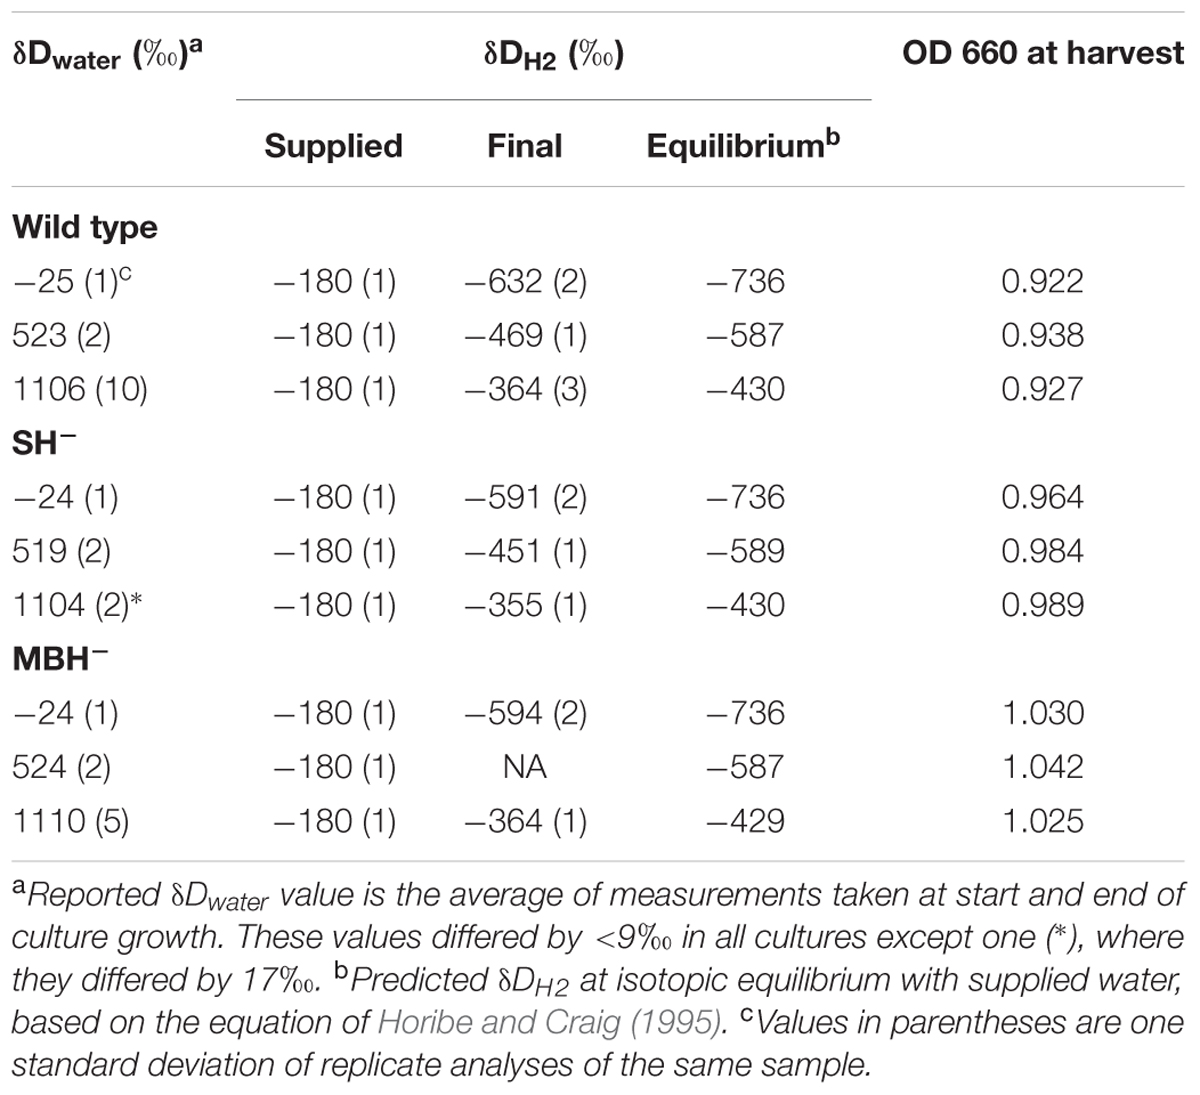
TABLE 1. Experimental conditions for growth of C. necator.
Values of δDH2 changed more dramatically between the last replacement of the headspace and the gas sample taken immediately before harvesting (a period of approximately 1 day). In every culture, δDH2 changed by several hundred permil in the direction of equilibrium with water (Table 1). The rate of isotopic change was also a function of the extent of H2/water disequilibrium, consistent with isotopic exchange as the controlling mechanism for changes in δD values of both water and H2. Such shifts in δDH2 must have occurred following every replacement of headspace gas, albeit probably to lesser extents when there was less biomass present. These significant shifts in δDH2 complicate the analysis of isotopic fractionations, because the harvested biomass must integrate isotopic signals from the changing H2. Fortunately, as we show below, the contribution of H2 to lipid hydrogen is minor; thus, even these large shifts in δDH2 introduce only minor noise into values of δDFA (see section “δD Values of Fatty Acids”).
Growth curves for the cultures were constructed from once-daily measurements of OD, which offered limited resolution of the growth phases. The growth curves for all three strains in both rounds of experiment became pseudo-linear after a brief period of apparently exponential growth (Supplementary Table S1). This behavior is consistent with growth limited by O2 supply, which precludes calculation of meaningful generation times. Nevertheless, growth of the SH- mutant was appreciably slower than for the other two strains, as has been previously observed (Schink and Schlegel, 1978). Given that all strains received the same daily supply of H2 + O2, this result presumably reflects a lower growth efficiency of the SH- strain, related to its reliance on reverse electron transport for NAD+ reduction (discussed below).
Table 2 summarizes the conditions for the triplicate cultures of the second experiment, in which the three strains grew in medium water without D-enrichment. The results were similar to those of the first experiment, including impaired growth of the SH- strain relative to the others.
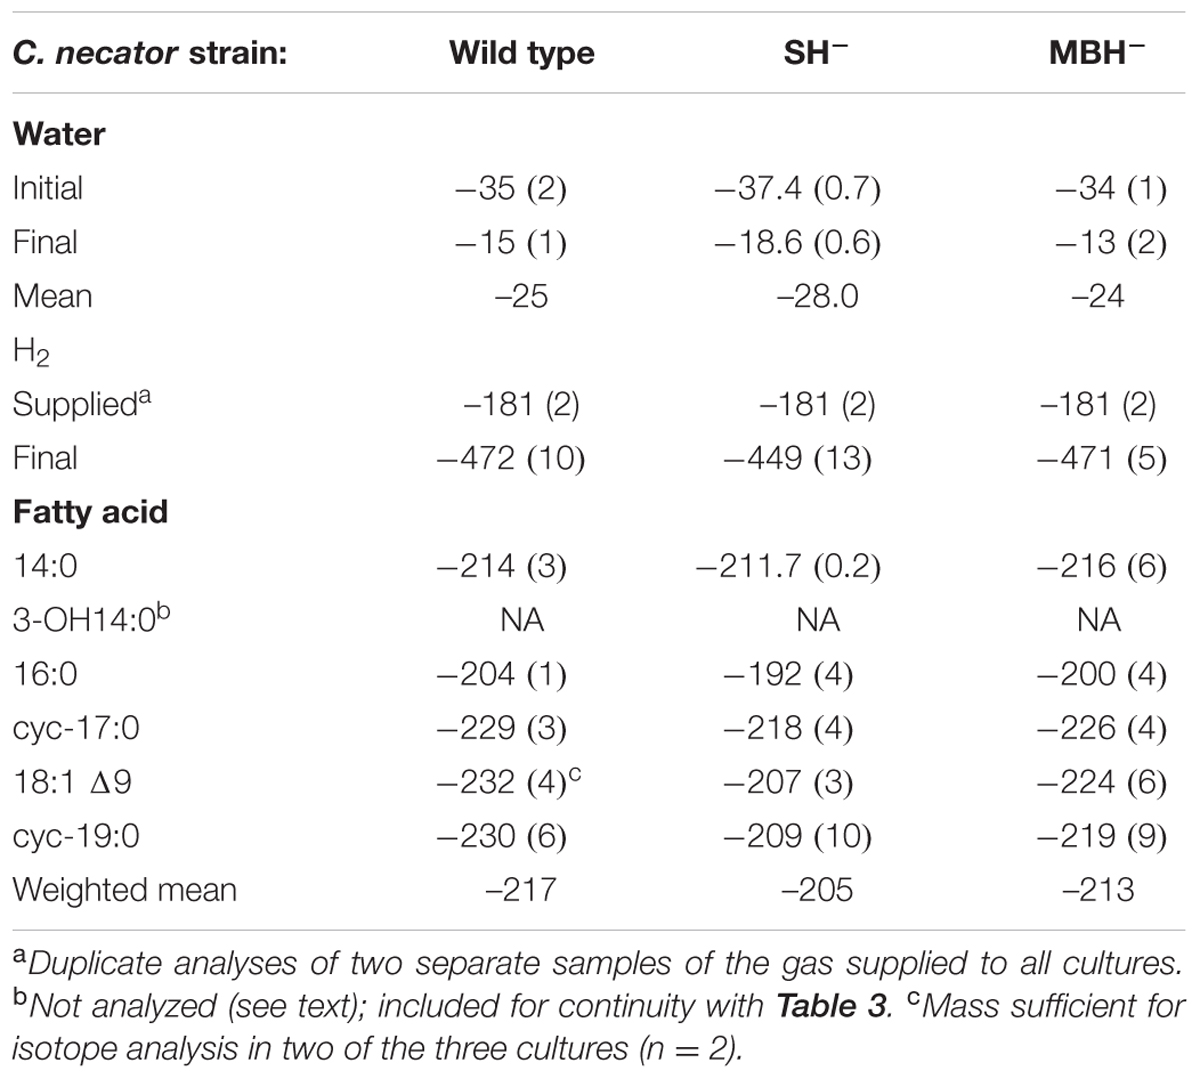
TABLE 2. Summary of δD values (mean, one standard deviation) from triplicate cultures grown in media without D-enriched water.
Relative Abundances of Fatty Acids and Polar Lipids
The predominant lipids in C. necator were n-alkyl fatty acids. In every strain and culture condition of the first experiment, the same six fatty acids accounted for 98% of the total abundance: tetradecanoic (14:0), 3-hydroxytetradecanoic (OH-14:0), hexadecanoic (16:0), 9,10-methylenehexadecanoic (cyc-17:0), octadec-9-enoic (18:1Δ9), and 9,10-methyleneoctadecanoic (cyc-19:0) acids (Figure 1). 16:0 and cyc-17:0 were the most abundant, accounting for ∼70% of total fatty acids. Variations in fatty acid abundance between culture conditions were insignificant, and between strains were minor. The biggest differences between strains were for 18:1Δ9 (3.5% in SH-, 7.0% in the wild type, 7.6% in MBH-) and for cyc-19:0 (9.3% in SH-, 6.5% in the wild type, 5.5% in MBH-).
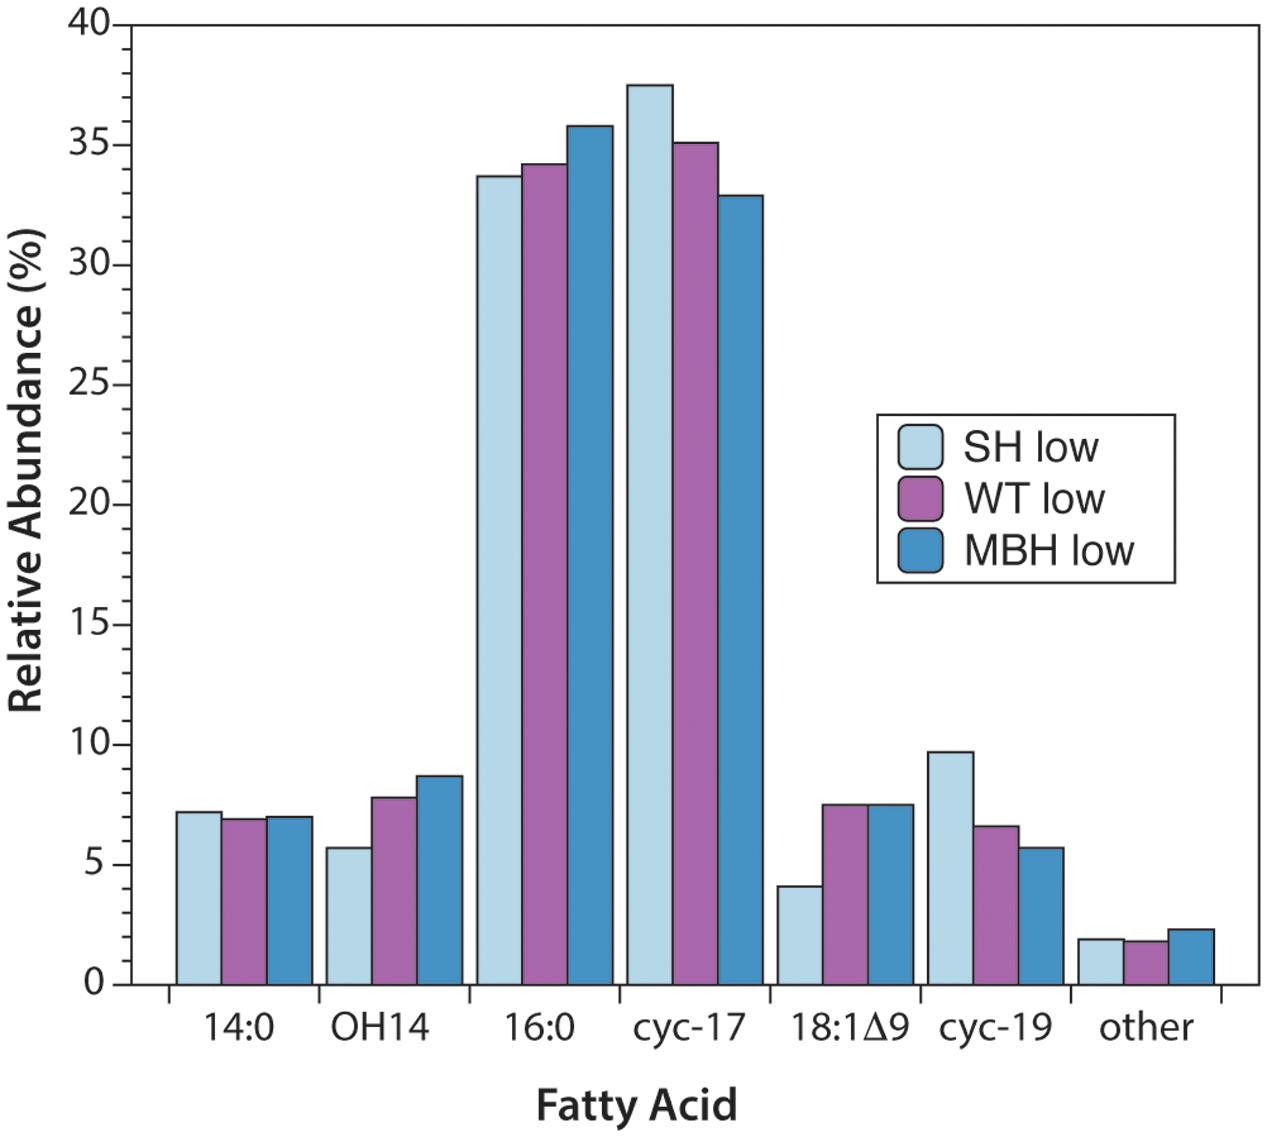
FIGURE 1. Relative abundances of fatty acids from the three strains of C. necator, all grown in non-D-enriched medium. Colors represent the SH- (light blue), wild-type (purple), and MBH- (dark blue) strains.
The second experiment yielded the same abundant fatty acids, with the exception that OH-14:0, was not quantified (see section “Fatty Acid and Polar Lipid Analyses”). Relative abundances of the other five predominant fatty acids were comparable to those of the main experiment after exclusion of OH-14:0 from the total abundance. In the second experiment, on average across strains, 16:0 represented approximately 5% more, and 18:1 approximately 5% less, of the total abundance of the predominant fatty acids (excluding OH-14:0). The results were otherwise similar, with the average results for 14:0, cyc-17:0, and cyc-19:0 differing by less than 1% between experiments. Differences between strains were even smaller in the second experiment than in the first. These small differences in the relative abundance of fatty acids are unlikely to affect their H-isotopic compositions. Complete abundance data are provided in the Supplementary Table S1.
The polar lipid composition among the analyzed C. necator strains (wild type, MBH-, and SH-) showed little variation. In all samples, the phospholipids were dominant and comprised >60% of the polar lipid composition, followed by the electron and proton carrier ubiquinone (UQ) and two bacteriohopanols (BHPs; Figures 2A,B). The detected phospholipid headgroups were composed of only phosphatidylethanolamine (PE) and phosphatidylglycerol (PG; Figure 2C). However, PE clearly dominated at roughly 95% of the phospholipid fraction, with highest relative contributions containing the fatty acid combination of 16:0 and cyc-17:0, 16:0 and 16:0, and cyc-17:0 and cyc-19:0 (Figure 2D). Furthermore, the results of this liquid chromatography (LC)-based fatty acid analysis resemble the relative proportions of fatty acids, except for OH-14:0, demonstrated by the GC-based analyses described above. LC-based results also indicate the predominance of 16:0 and cyc-17:0 fatty acids, which together represented greater than 80% of the total (Figure 2E).
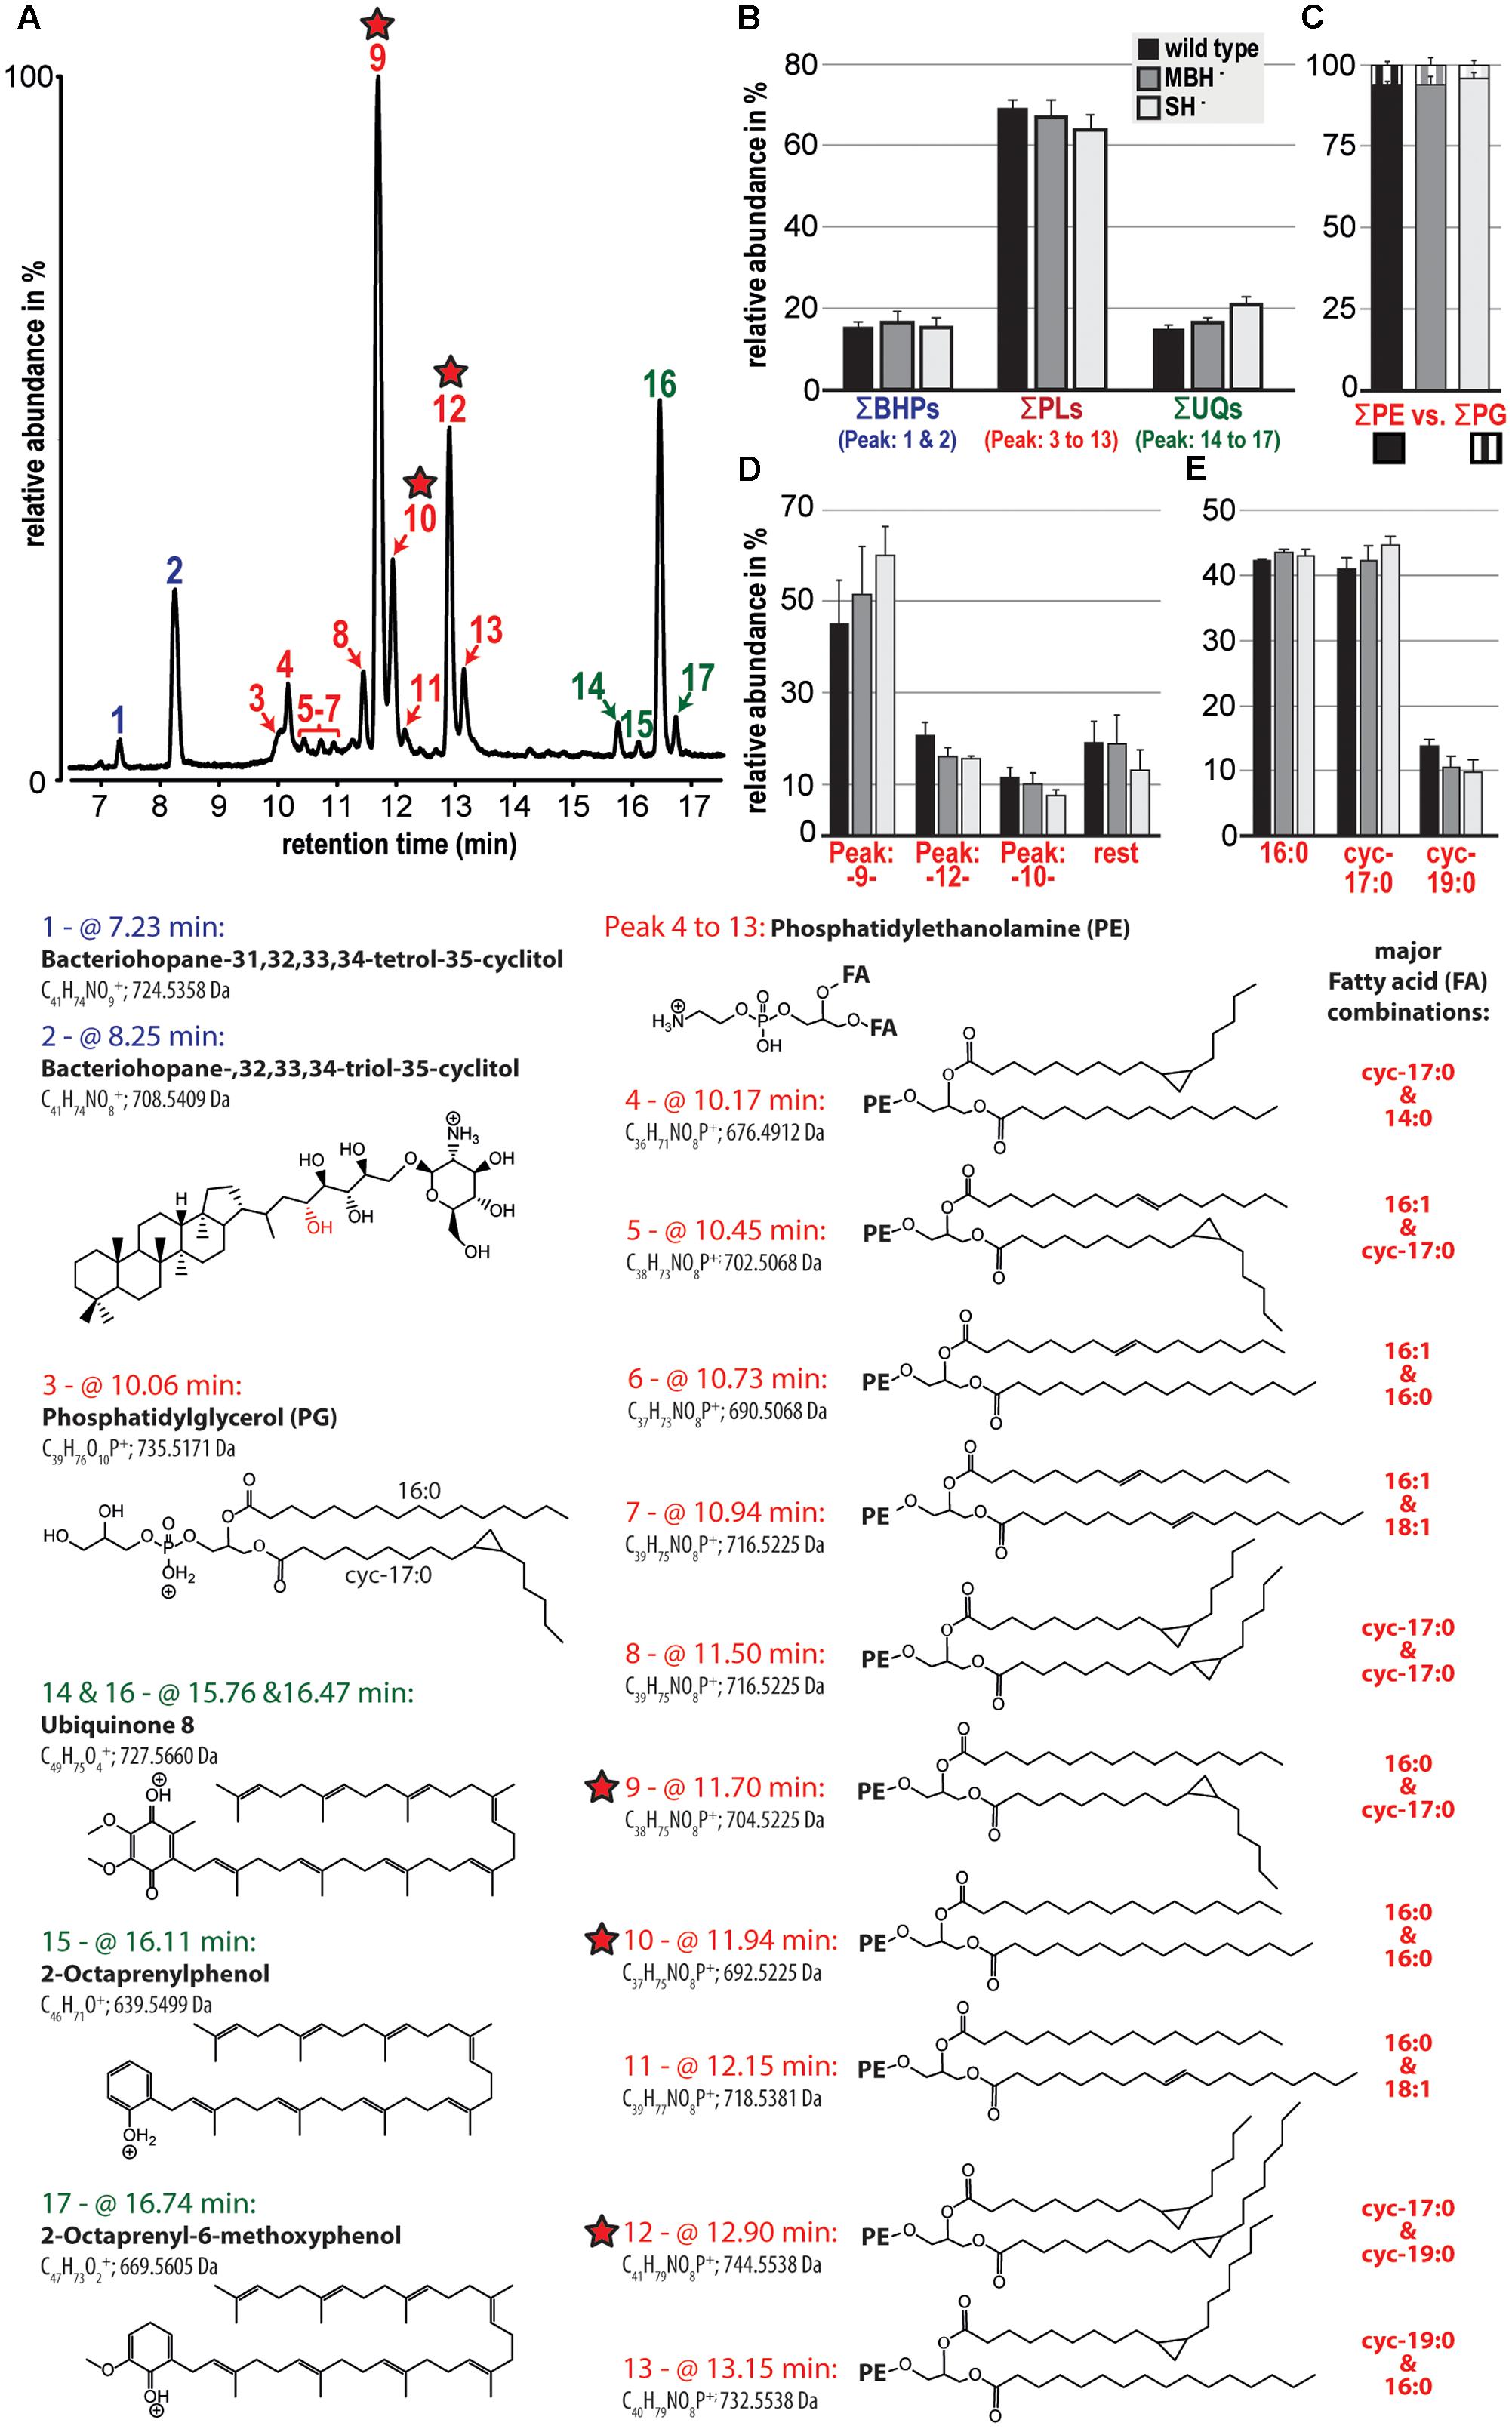
FIGURE 2. Relative abundances of the polar lipid composition from the three strains of C. necator are shown together with their tentative molecular structures. All strains were grown in triplicate and variations among triplicate indicated as standard deviation (black bars in B to E). (A) A partial chromatogram of all identified polar lipid species and (B) groups the relative contribution of total bacteriohopanols (BHPs), total phospholipids (PLs), and total ubiquinones (UQs). (C) Highlights the dominance of PE-containing headgroups among the total phospholipid fraction and (D) shows in more detail the relative contribution of the three most prominent phospholipids (also highlighted by red stars). (E) Represents a liquid chromatography-based calculation of the phospholipid-derived fatty acid composition. The applied identifications are based solely on MS and MS/MS and are therefore tentative. Because response factors of individual lipid molecules were not measured, this study compares the relative distribution of lipid species among samples.
Polar lipid analysis of biomass from the second experiment indicated that the most significant variation among the C. necator strains was an increase in the relative proportion of UQ in the MBH- mutant and foremost in the SH- mutant (Figure 2B). The contribution of cyc-17:0 also increased, and that of cyc-19:0 decreased, in the same order among the strains (Figure 2E). Complete polar lipid data are provided in the Supplementary Table S1.
δD Values of Fatty Acids
C. necator δDFA values ranged from -260‰ to 686‰ (Figure 3, Tables 2, 3, and Supplementary Figure S1). The range for a given δDwater treatment was far narrower, but increased with the δD of the water; i.e., δDFA values were more variable between D-enriched cultures. Analyses of triplicate cultures (second experiment) indicated that biological variability in these δDFA values was generally <5‰, and always <10‰ (1σ). The pooled standard deviation of all fatty acids in all replicate cultures was 5.1‰, a value that we take as representative uncertainty in the following discussion. This is only slightly greater than analytical precision (typically <4‰). In each strain and each culture condition of both experiments, fatty acids were strongly D-depleted relative to growth water, by 178–278‰, with the magnitude of this depletion increasing with δDwater. In the first experiment (Table 3 and Supplementary Table S1), the abundance-weighted mean fractionation between fatty acids and growth water was -217‰ in the wild type, -196‰ in SH-, and -226‰ in MBH- (all values for the δDwater = -25‰ growth condition). In the second experiment at similar growth conditions (Table 2 and Supplementary Table S1), abundance-weighted mean fractionations were all shifted to slightly heavier values: -197‰ in the wild type, -182‰ in SH-, and -194‰ in MBH-. To test whether the small changes in abundance of 18:1 and cyc-19:0 FA between strains could be responsible for such differences, we recalculated weighted mean δD values excluding those two compounds. Differences between the strains remain unchanged when these fatty acids are excluded (not shown).
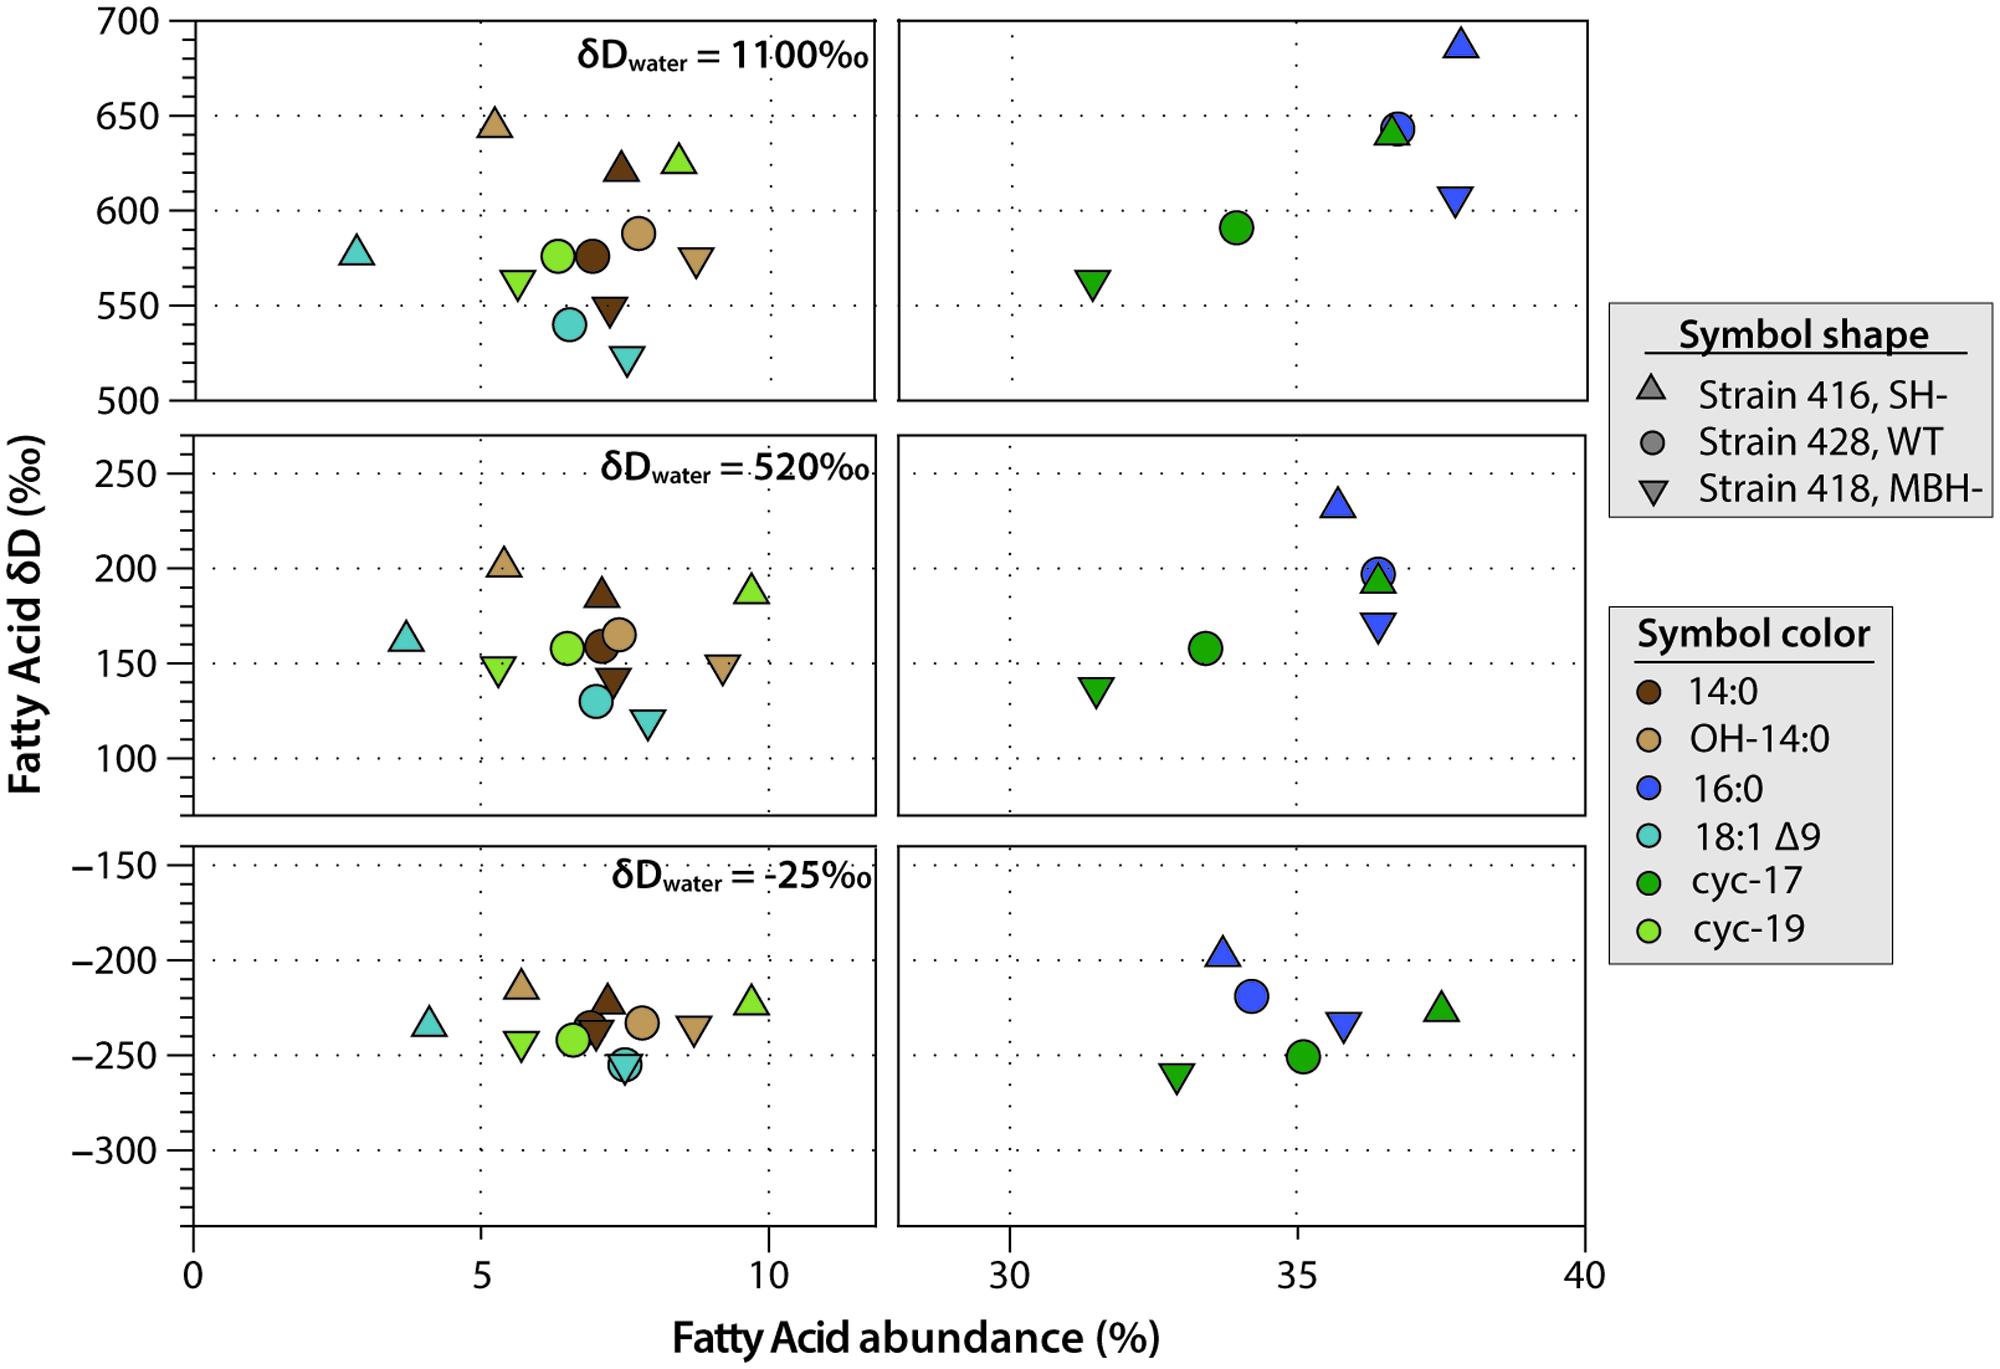
FIGURE 3. Relative abundance and δDFA values of the six major fatty acids from C. necator cultures. The δDwater values of culture medium are shown for each group. Error bars (±1 SD) are approximately the size of each symbol, or smaller.
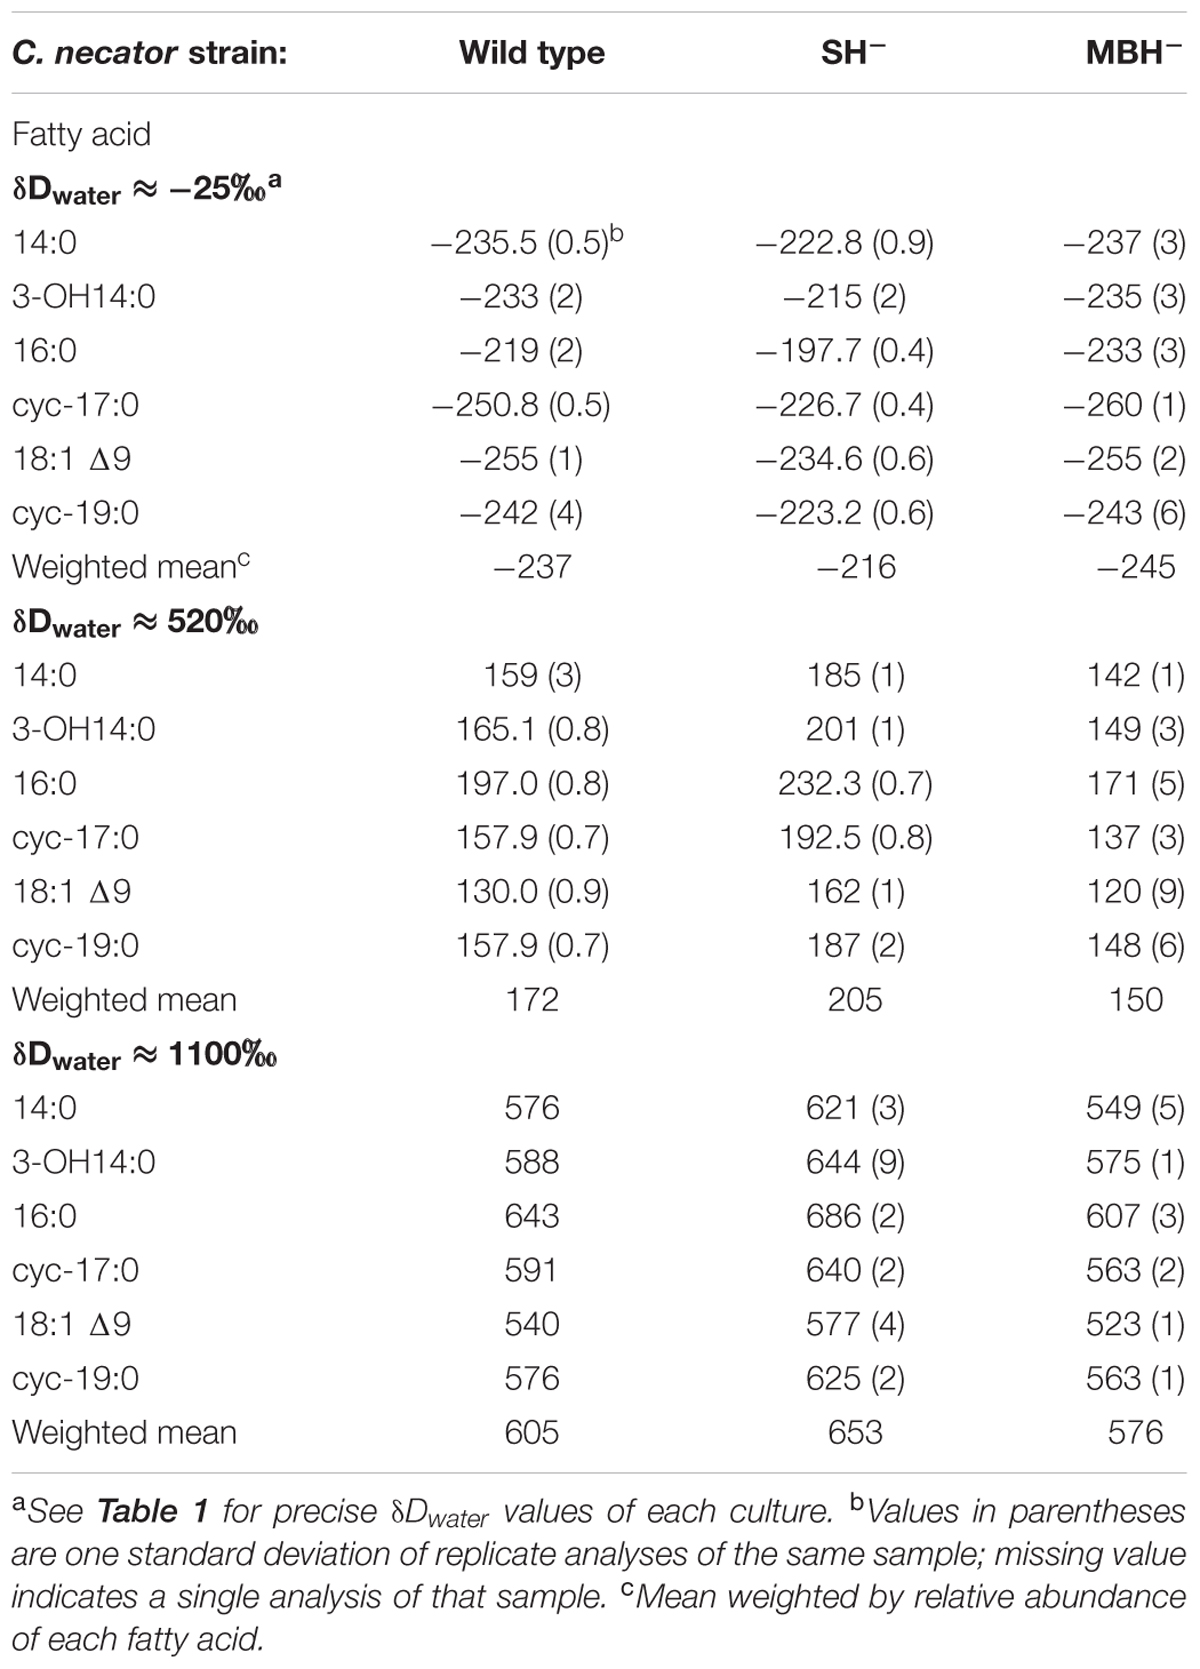
TABLE 3. Fatty acid δD values from C. necator cultures.
Comparing δDFA values within each culture, the 16:0 fatty acid was consistently the most D-enriched fatty acid, often by 20–30‰ relative to other fatty acids. In eight of the nine cultures in the main experiment (Table 3), OH-14:0 was the second most D-enriched, and 18:1Δ9 was the most D-depleted. For all fatty acids, δD values varied systematically among strains in the order MBH- < wild type < SH-, with the three strains typically spanning a range of 30–40‰. That range was broader for cultures grown in D-enriched medium.
The results of the second experiment (Table 2) confirmed the relative D-enrichment of the 16:0 fatty acid, but OH-14:0 was not analyzed. These data also confirmed that fatty acids from the SH- strain were significantly more D-enriched than those from the other strains (p < 0.002), but did not yield consistent variation in δDFA between the MBH- mutant and the wild type. Accordingly, the differences between wild type and MBH- strains for the δDwater = -25‰ experiments are not statistically significant (p < 0.19). However, the second experiment included only cultures grown in low-D medium, whereas in the first experiment the difference in δDFA between the MBH- mutant and the wild type was stronger at higher levels of D-enrichment (see Supplementary Figure S1). Assuming the biological variance in high-D conditions is similar to that in the low-D experiment, i.e., that σδD = 5.1‰, the differences between MBH- and the wild type at medium- and high-D enrichments would be significant at p < 0.001. Therefore, we retain for discussion the observed systematic variation in δDFA in the order MBH- < wild type < SH-.
Fatty acid δD values were strongly correlated with those of water (Figure 4; R2 ≥ 0.9999 and p < 0.003 in every regression). Slopes for these correlations ranged from 0.686 to 0.783, consistent with water providing the majority of hydrogen in fatty acids. For all three strains, slopes were highest for 16:0 fatty acid, and lowest for 18:1Δ9 fatty acid. This order follows the pattern of fractionation (16:0 is D-enriched and so less fractionated, thus α is larger; 18:1 is D-depleted and so more fractionated, α is smaller), as would be expected if the proportion of water-derived hydrogen (Xwater) remained roughly constant across fatty acids. Similarly, for any given fatty acid, slopes were slightly higher in SH- and slightly lower in MBH- relative to the wild type, again following the pattern of fractionation (SH- is D-enriched and less fractionated; MBH- is D-depleted and more fractionated).
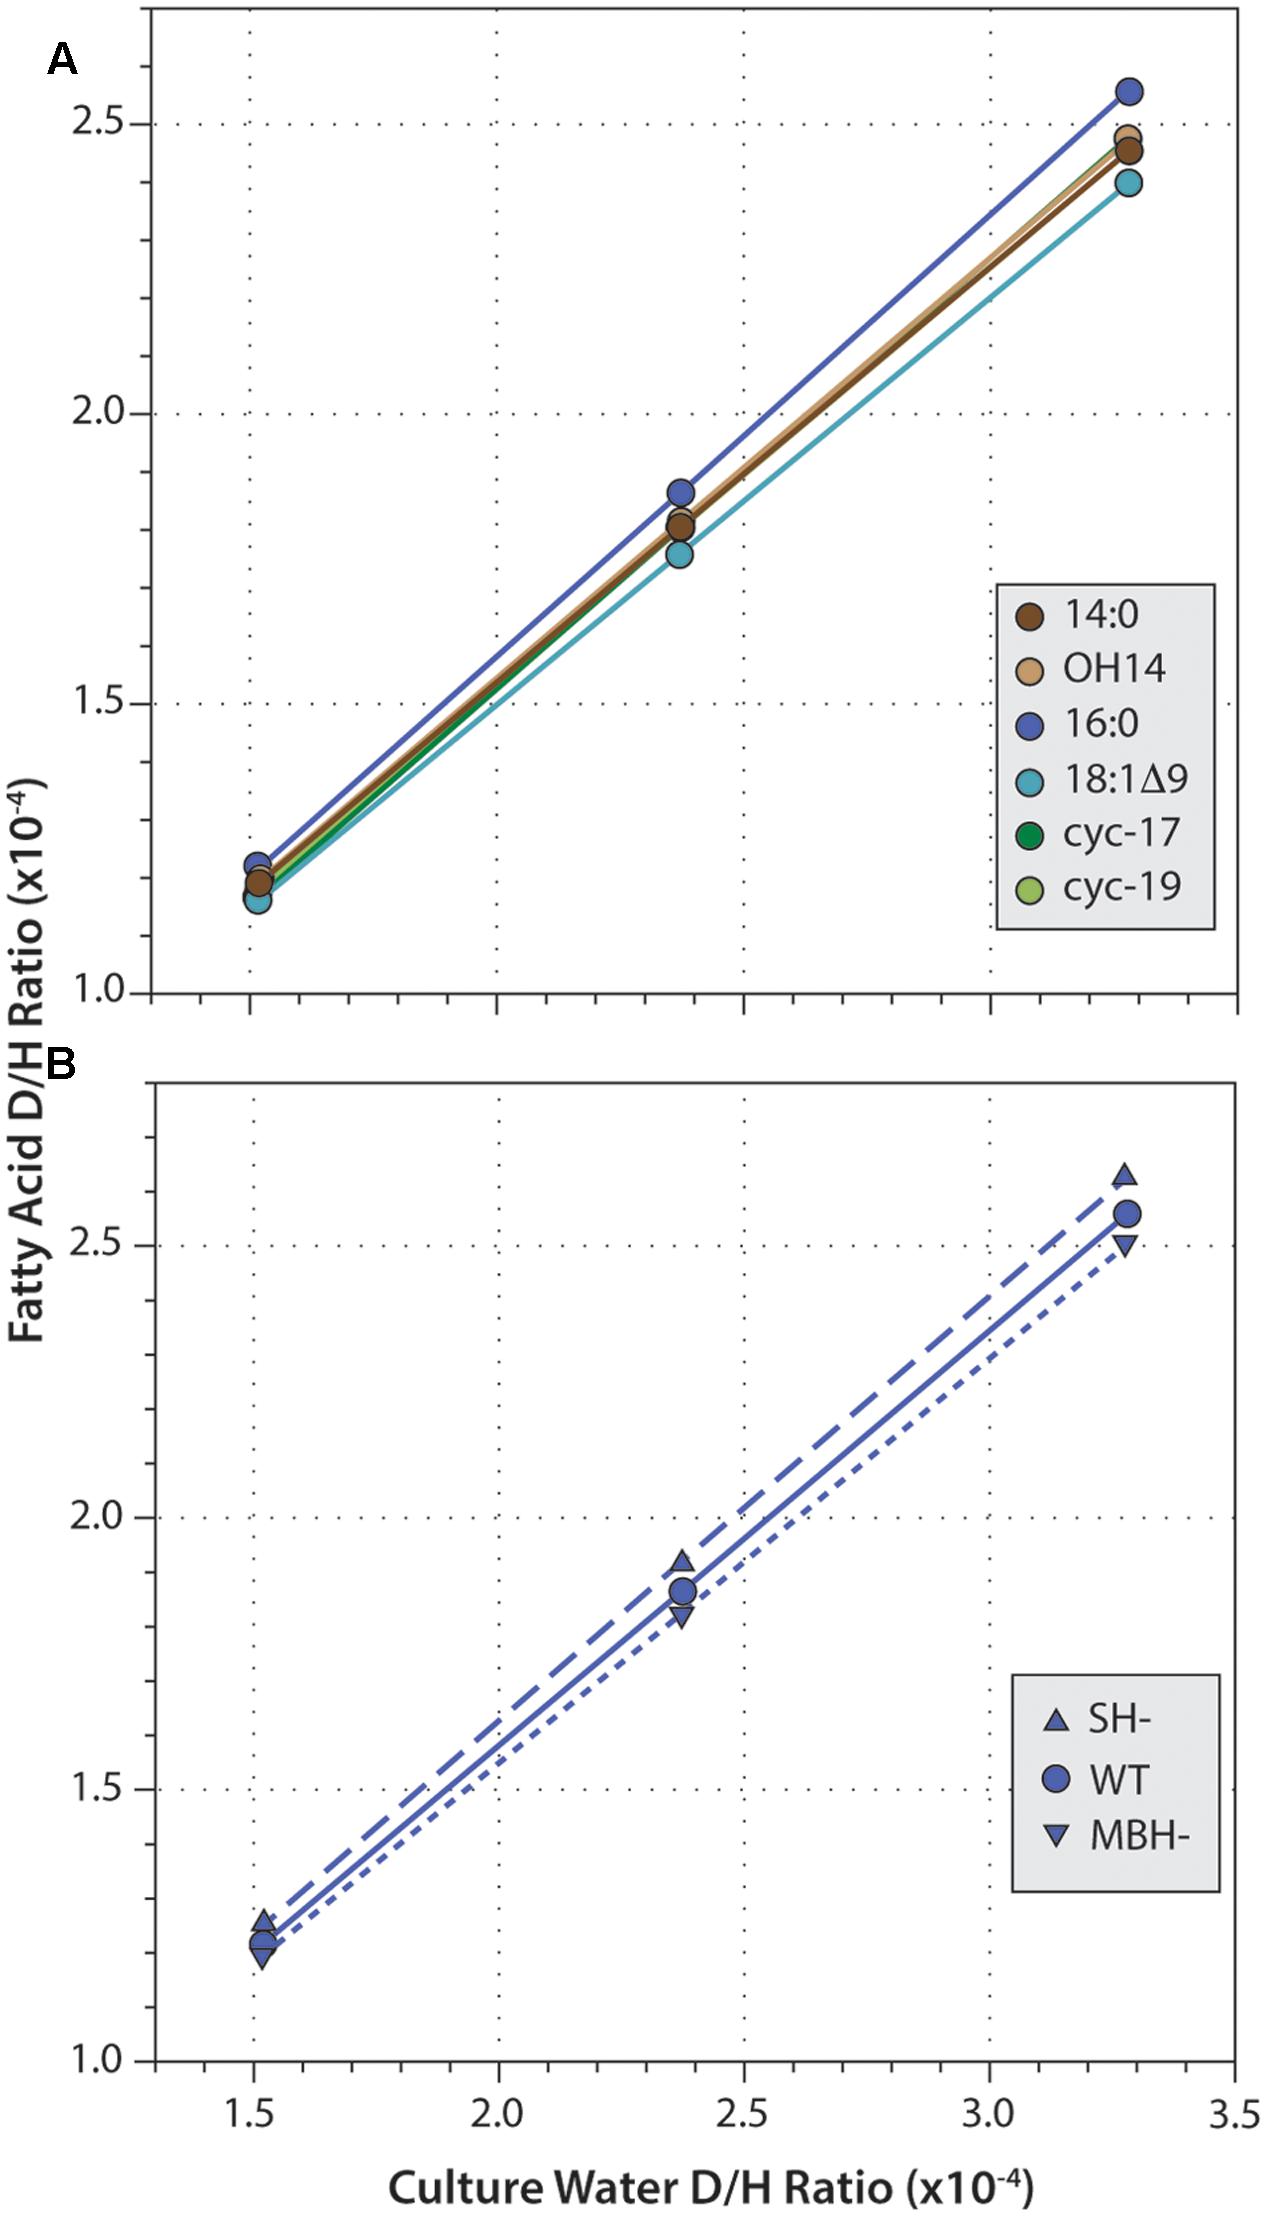
FIGURE 4. Linear regressions of fatty acid D/H ratio versus growth medium D/H. (A) Data for six fatty acids from the wild-type strain. (B) Data for 16:0 fatty acid from three strains. Regressions for other data (not shown) are all highly similar.
Fractionation curves derived from these linear regressions (Figure 5) are virtually identical for the same fatty acid from different strains, including the hydrogenase mutants. In contrast, curves for different fatty acids from the same strain are shifted along a nearly vertical trajectory. Such shifts are representative of primarily a change in net lipid/H2 fractionation (see discussion in Zhang et al., 2009a), although differences between fatty acids are presumably a manifestation of differences in biosynthetic fractionation rather than differences in metabolic reactions of H2 per se. Zhang et al. (2009a) suggested that for heterotrophs the two fractionations (lipid/water and lipid/substrate) should likely be within ∼300‰ of each other, a region defined by the gray shading in Figure 5. In C. necator, the fractionation of H2 may be much more significant than that of water, leading to even lower αFA/H2 to αFA/water ratios (above and to the left of the gray region). In either case, this analysis indicates that 90% or more of the fatty acid hydrogen was derived from water, not H2. The net fractionation between fatty acids and water can also be compared to those of D. autotrophicum grown chemoautotrophically; it derives lipid hydrogen exclusively from water, which allowed Campbell et al. (2009) to measure αFA/water directly (tan shaded zone in Figure 5). The fractionations for C. necator are near the upper end of this range.
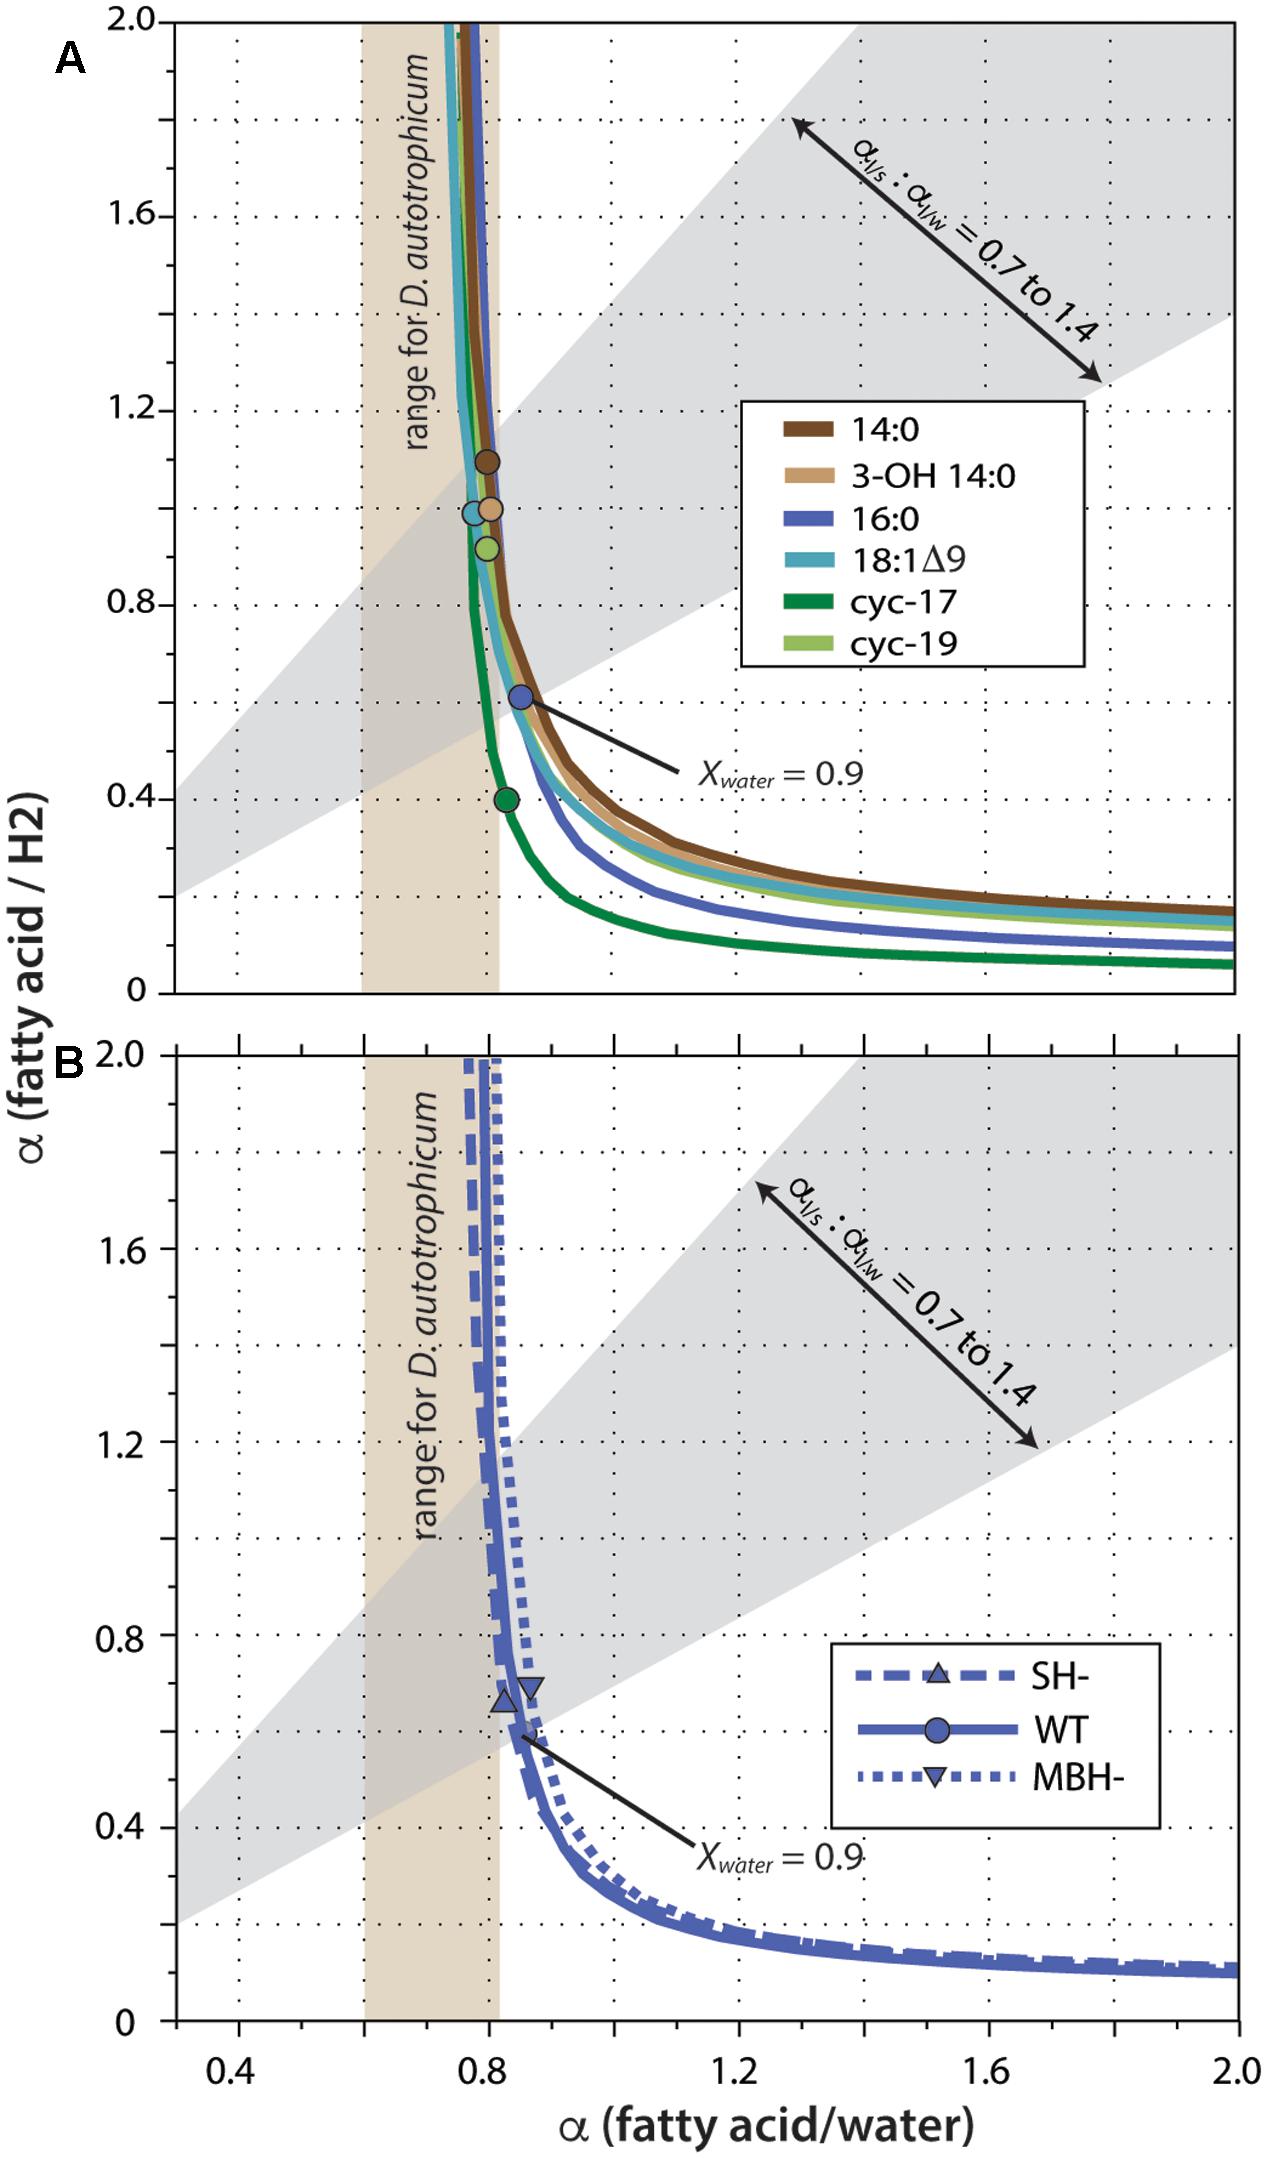
FIGURE 5. Fractionation curves for different fatty acids from the wild-type strain (A), or for 16:0 fatty acid from different strains (B). Each curve represents the set of all possible combinations of lipid/H2 fractionation, lipid/water fractionation, and Xwater (fraction of lipid hydrogen derived from water) that fit a given set of experimental constraints. Circles mark the point on each curve corresponding to the value Xwater = 0.90; these are marked only to facilitate comparison between curves, and do not otherwise have particular meaning. The gray shaded region outlines values where the two fractionations differ by no more than 300‰, as proposed by Zhang et al. (2009a). Tan shaded region indicates lipid/water fractionations measured for D. autotrophicum that uses only water hydrogen (Campbell et al., 2009).
A significant complication for this analysis regards the fact that the δD values of headspace H2 changed throughout the growth cultures, in a convoluted fashion (because of daily H2 additions and continuous equilibration with H2O). The curves in Figure 5 were generated assuming δDH2 = –400‰ for all cultures, a value that is at the low end of the averages observed for any single culture (averages ranged from -267 to -406‰; the generation of fractionation curves implicitly assumes a constant value of RH2 for all cultures). Regardless, the shapes and relative positions of those curves do not depend on the assumed value. The assumed value for δDH2 does affect the absolute vertical position (i.e., the implied lipid/H2 fractionation factor) of the curves, with a less negative δDH2 value moving the curves downward. But since all fatty acids derive from the same H2 source, all of the curves move up and down together as δDH2 is changed. For our analysis here, the most conservative assumption would be δDH2 = –632‰, i.e., the most negative value measured at any time point in any one of the cultures. Under that assumption, the upper bound of the gray shaded region in Figure 5 would intersect the fractionation curve at Xwater = 0.92, instead of the Xwater = 0.95 obtained by assuming δDH2 = –400‰. Assuming higher (less negative) δDH2 values would only result in even higher inferred Xwater values. The conclusion that little to no lipid hydrogen derived from H2 is thus robust, regardless of the actual, growth-integrated δD value of headspace H2.
Discussion
A first-order observation for C. necator grown on H2 + O2 is that net D/H fractionations of its fatty acids relative to growth medium water fall in the range of -199‰ to -236‰, indistinguishable from those of many photoautotrophic algae and bacteria (Sessions et al., 1999; Chikaraishi et al., 2004; Zhang and Sachs, 2007; Zhang et al., 2009b; Chivall et al., 2014; Heinzelmann et al., 2015a). Deleting either the membrane-bound hydrogenase (MBH) enzyme or the soluble hydrogenase (SH) enzyme has only a small effect on δDFA values, changing them by 25‰ or less (Figure 3 and Table 3). Fractionation curves, constrained by experiments in which the δD of growth water was varied systematically, are also consistent with very little lipid hydrogen (approximately 10% or less) being derived from H2, and with lipid/water fractionations in the neighborhood of 200‰ (Figure 5). All lines of experimental evidence therefore point to a minimal contribution of H2 metabolism to lipid δD values in C. necator.
There are, nevertheless, subtle but systematic differences in δDFA values between the wild type and hydrogenase mutants. In our main experiment, fatty acids from SH- were 19.2‰ more D-enriched than those from the wild type (range 18–24‰) in experiments with δDwater = -25‰. Differences between cultures grown on more D-enriched water were in the same directions, but even larger (up to 46‰ in magnitude). In comparing fatty acids from MBH- and wild-type strains, there was no significant difference in cultures with δDwater = -25‰, but significant differences in more D-enriched cultures. MBH- fatty acids were D-depleted relative to the wild type in those experiments. Such differences cannot plausibly be attributed to changes in fatty acid abundance, as there were barely detectable variations in their relative abundance between the strains. Schouten et al. (2006) and Leavitt et al. (2016) have previously suggested growth rate as an important influence on fractionation, with faster growing strains exhibiting larger fractionations (more negative εFA/water values). Although growth rates could not be quantified in our experiments (see section “Culture Conditions and Growth”), the relationship between growth rates and fractionations was qualitatively similar to that observed by Schouten et al. (2006) and Leavitt et al. (2016). Notably, however, the size of the effect in the latter study was ∼100‰, whereas in our data it is only 25‰ or less. Somewhat contradictorily, Osburn et al. (2016) have shown for a large survey of anaerobic heterotrophs that, in general, fractionation is not correlated with growth rate, although there is possibly a weak correlation amongst the slowest-growing organisms. The influence of growth rate on D/H fractionations in Cupriavidus thus remains uncertain.
Below, we address three remaining questions. First, what role (if any) do hydrogenase enzymes play in setting the isotopic composition of lipids, either in this organism or other hydrogenotrophs? Second, are strong D-depletions truly a hallmark of chemoautotrophic metabolism, as has been previously proposed (Zhang et al., 2009a)? Third, is it coincidence that the δDFA values of C. necator are indistinguishable from those of plants?
Hydrogenase Influence on Fatty Acid Isotopic Compositions
In prokaryotes, including C. necator, n-alkyl fatty acids are synthesized in the cytoplasm from the precursor acetyl-CoA, which is a key intermediate in many pathways (Heath et al., 2002). During the elongation cycle, hydrogen is transferred to fatty acids from NADPH and – if certain alternative enzymes are present – from NADH (Campbell and Cronan, 2001) during two separate reduction steps. The first, catalyzed by the FabG subunit, reduces 3-ketoacyl-ACP to 3-hydroxyacl-ACP. In most studied organisms this subunit is known to use only NADPH as cofactor. However, the genome of C. necator H16 contains at least one FabG with 97% amino acid similarity to a FabG from Cupriavidus taiwanensis that uses NADH as cofactor (Javidpour et al., 2014). The second reduction, of enoyl-ACP to 3-hydroxyenoyl-ACP, is catalyzed by the FabI subunit, which is well known to use both NADH and NADPH cofactors. Thus, it appears likely that C. necator has the capability of using NADH, probably in combination with NADPH, as a hydride donor for fatty acid biosynthesis.
The immediate sources of hydrogen to fatty acid biosynthesis are thus acetyl-CoA, NAD(P)H, and water (for further discussion, see Osburn et al., 2016). The activities of precursor pathways during autotrophic growth are not known, but in C. necator cultivated on gluconate, the major source of NADPH and acetyl-CoA is the oxidation of sugars via the pentose phosphate (PP) pathway (Lee et al., 2003). In C. necator, carbohydrate precursors (which flow to PP) are produced by the Calvin–Benson–Bassham (CBB) cycle (Bowien and Kusian, 2002), which in turn uses NADH as the reductant. NADH is itself generated largely from H2 via the SH (see below).
C. necator H16 reportedly possesses four putative hydrogenases, each assigned to a different group within the [NiFe] hydrogenase class (Schwartz et al., 2003; Vignais and Colbeau, 2004). The regulatory hydrogenase (RH) belongs to Group 2, the cytoplasmic H2 sensors. RH regulates biosynthesis of the two energy-generating hydrogenases and is not directly involved in metabolism (Lenz and Friedrich, 1998). MBH belongs to Group 1, the uptake hydrogenases. The SH belongs to Group 3, the bidirectional, heteromultimeric, cytoplasmic hydrogenases. MBH and SH both generate energy by the heterolytic cleavage of H2. In [NiFe] hydrogenases, the process consists of two steps: first H2 is cleaved into H- (hydride) and H+ ions, and then the two electrons are extracted from the hydride leaving a second H+ (de Lacey et al., 2005). The electrons are transferred to an acceptor, while the protons (or deuterons) are transported out of the protein to the surrounding water (Vignais, 2005). Despite these shared properties, MBH and SH differ in both location and function, and they probably have different effects on the pools of water and NADH available for biosynthesis. The reaction network involving hydrogenases and these intermediates must be considered as a whole (Figure 6). A fourth [NiFe] hydrogenase (Hyd4) is apparently coded for on the megaplasmid of C. necator H16 (Schwartz et al., 2003). However, since the triple mutant lacking RH, MBH, and SH shows no detectable hydrogenase activity, the function of the Hyd4 genes is unknown and is not considered further here.
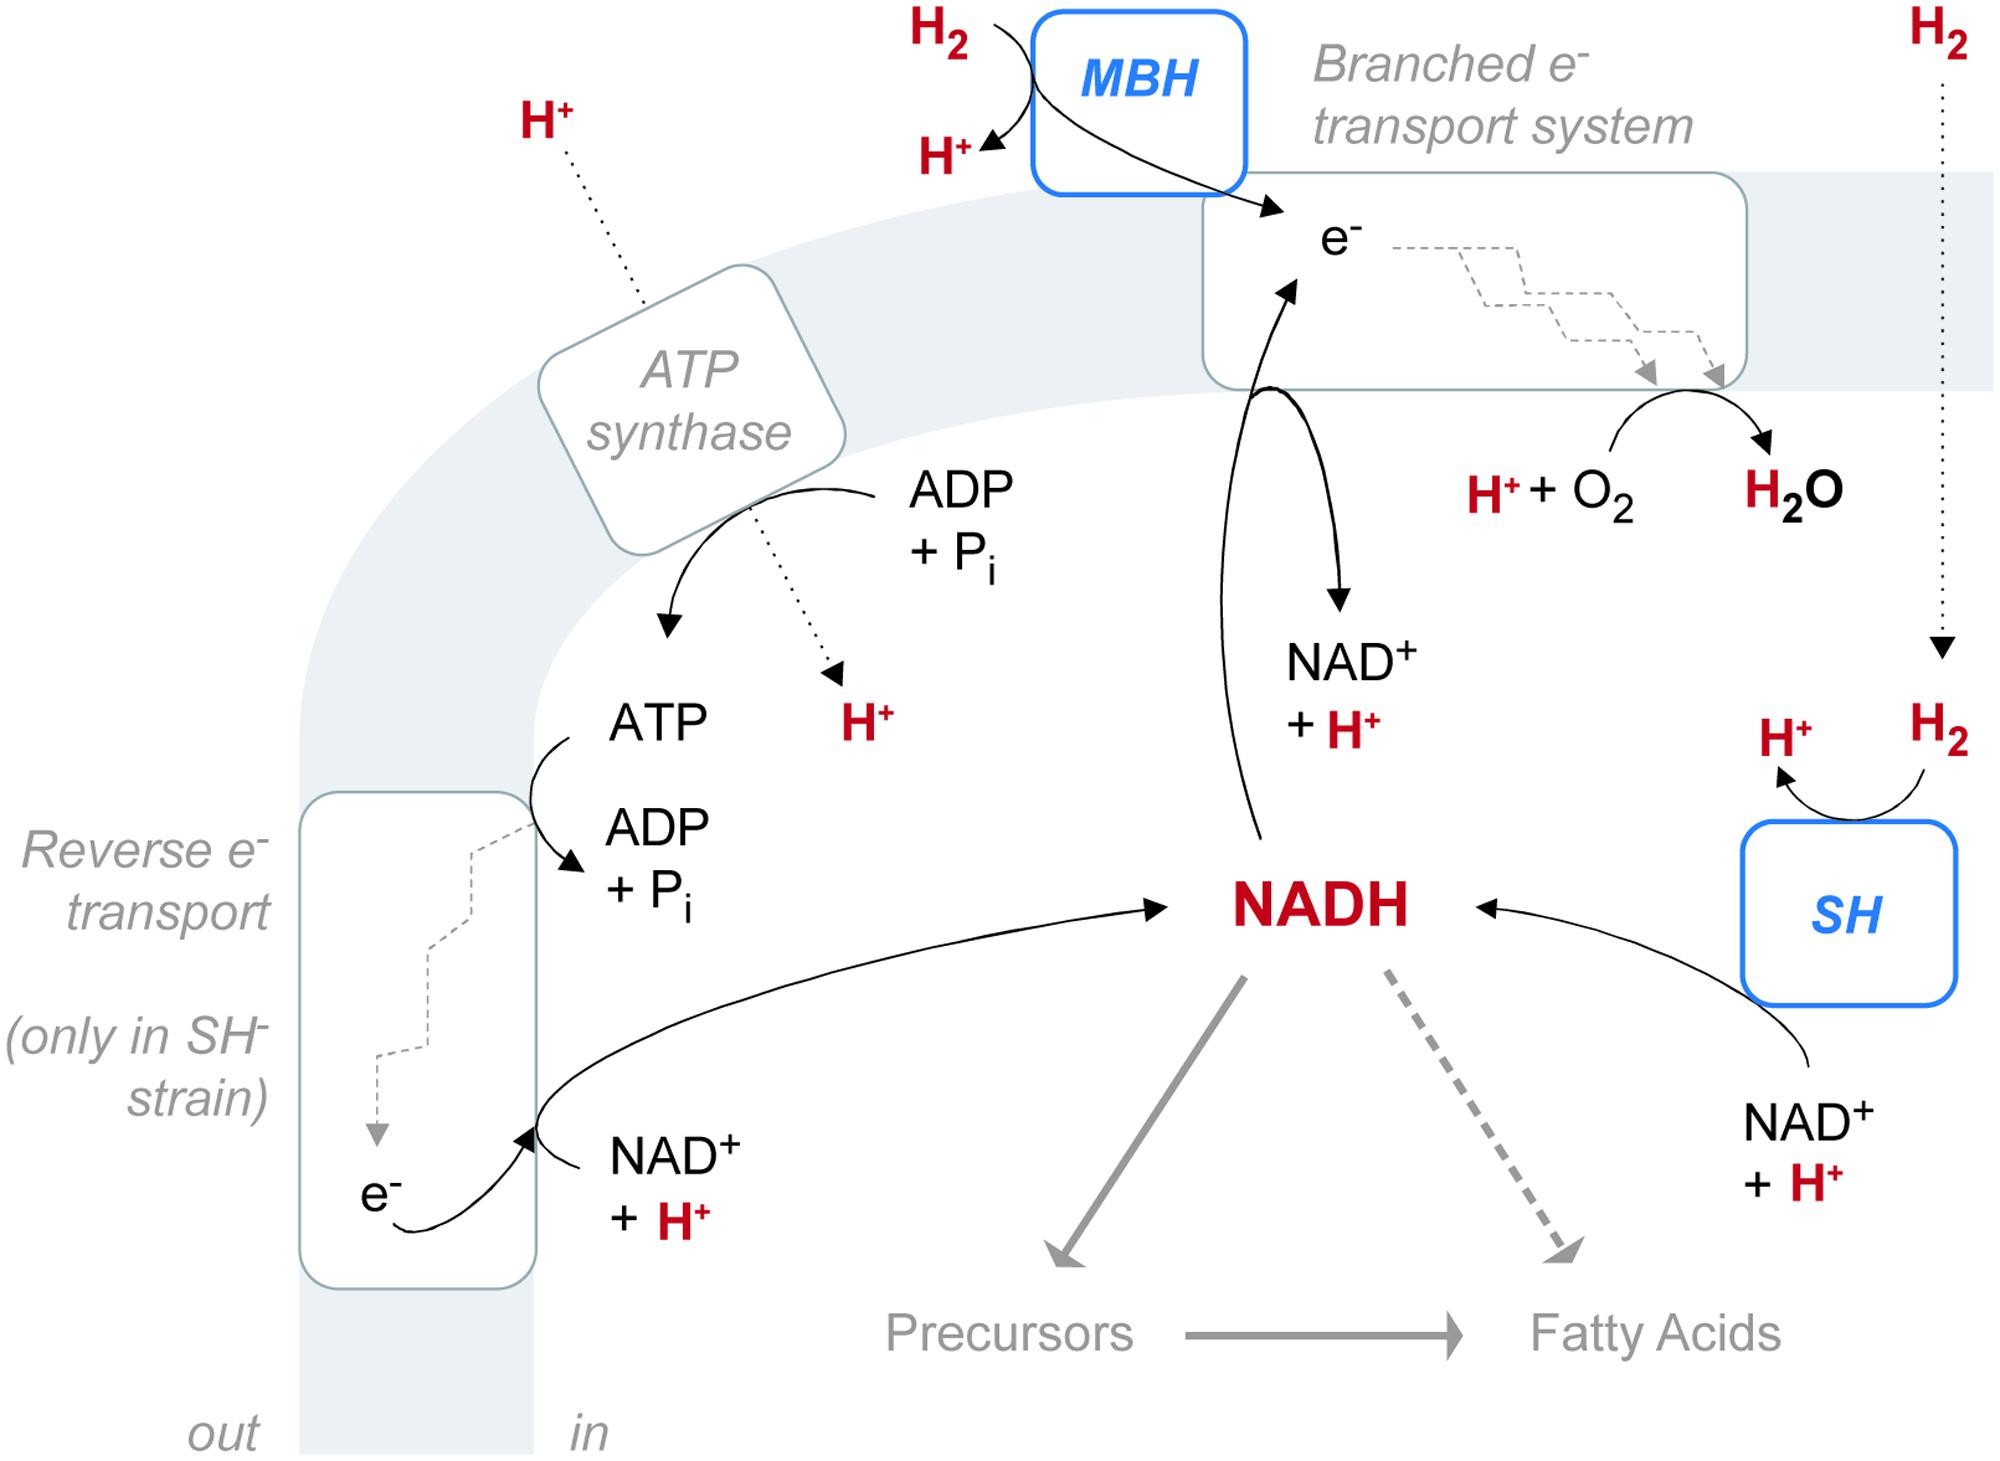
FIGURE 6. The configuration of hydrogenase enzymes and hydrogen pathways in C. necator. The gray shaded area represents the cytoplasmic membrane. ATP synthase and the electron transport system are associated with the membrane, as is the membrane-bound hydrogenase (MBH), which is located in the periplasmic space. The soluble hydrogenase (SH) is located in the cytoplasm. Hydrogen-bearing species are in red. Fine black arrows indicate chemical reactions or half-reactions (not stoichiometrically balanced). Dotted black arrows denote diffusion or transport across the membrane. Heavy gray arrows denote hydrogen flow from NADH to fatty acids, either through biosynthetic precursors (such as NADPH or acetate) or possibly by direct contribution (dashed).
MBH catalyzes the unidirectional oxidation of H2, which is ultimately coupled to O2 reduction via a respiratory chain (Schink and Schlegel, 1979). Located in the periplasmic space, MBH is anchored to the cytoplasmic membrane by a b-type cytochrome subunit, which is also the immediate acceptor of electrons from H2 oxidation (Friedrich and Schwartz, 1993; Bernhard et al., 1997). Electrons from H2 flow through the b-type cytochrome into the UQ pool, which feeds into the electron transport system. Electron transport complexes link the movement of electrons to the uptake of protons (generating ubiquinol) at the cytoplasmic side of the membrane and the release of protons at the periplasmic side (Komen et al., 1996). The resulting proton gradient supports ATP synthesis.
SH located in the cytoplasm, couples the oxidation of H2 to the reduction of NAD+ (Schneider and Schlegel, 1976). Reduction is thought to occur via electron transfer through Fe–S clusters of the hoxU subunit, rather than as an intact hydride transfer (Burgdorf et al., 2006). The enzyme is reversible, but H2 evolution from NADH, in the presence of sodium dithionite, occurs at only 2.4% of the rate of H2 uptake with NAD+ as electron acceptor (Schneider and Schlegel, 1976). This property is consistent with the demand for large amounts of NADH by the CBB cycle during autotrophic growth (Bowien and Kusian, 2002). Cells lacking SH can grow autotrophically, but only at a diminished rate, as observed in our study. Impaired growth may be due to inefficient production of NADH via ATP-dependent reverse electron transport (Komen et al., 1992). In our study, the SH- mutant exhibited an increase in relative abundance of UQ over both the wild type and MBH- strains (Figure 2B). This observation would be consistent with the upregulation of UQ in SH- cells to stimulate the rate of electron transport in the membrane.
The electron transport system of C. necator is central to the relationship of SH, MBH, and the NADH pool. H2 oxidation via MBH is not the sole source of electrons for transport. Instead, the system is branched, linking the oxidation of H2, NADH, and succinate, through the UQ pool, to four different membrane-bound terminal oxidases (Komen et al., 1991a,b). The two major branches during exponential growth are a bo-type oxidase and a cytochrome c-containing pathway (which is itself branched, having two terminal oxidases). The fourth terminal oxidase, a d-type cytochrome, is active mainly during late exponential growth. In membranes from exponential-phase, autotrophic C. necator, electron flow from H2 via the bo-type oxidase accounts for 80% of ATP synthesis, while the cytochrome c-containing pathway plays “a minor role in energy conservation” (Komen et al., 1996). In a study comparing SH- and MBH- mutants (different strains than the mutants in this study) to the wild type, Komen et al. (1992) found that the preferred pathway of electron transport is different for each strain, and the wild type reportedly favors the cytochrome c-containing pathway. That study also reported NADH dehydrogenase activity for each strain: MBH- cells exhibited 167% activity relative to wild-type cells, while SH- cells exhibited 30% activity relative to wild-type cells. We speculate that the relative activities of NADH dehydrogenase could be a factor linking growth rates to hydrogen-isotopic fractionations (as shown in Leavitt et al., 2016).
The preceding discussion makes it clear that there is no direct enzymatic link between the isotopic composition of H2 and lipids. Both uptake hydrogenases transfer only electrons, not hydrogen nuclei. The fact that SH- mutants are only slightly different in δDFA is consistent with this conclusion. Rather, the modest shifts in δDFA between the wild type, SH-, and MBH- are likely due to one or more indirect effects. Several such effects can be considered, including: generation of metabolic water from H2, hydrogen-isotopic exchange between water and H2, generation of reducing equivalents via reverse electron transport, differing transhydrogenase activity and/or growth rate, and different partitioning of reducing power between catabolism and anabolism.
The different locations of SH and MBH provide two possible mechanisms of influence on the intracellular water pool: first the oxidation of H2 to H2O, and second the catalyzed isotopic equilibration of H2 with H2O (i.e., independent of oxidation). MBH, anchored to the outer surface of the cytoplasmic membrane, oxidizes H2 in the periplasmic space where the isotopic composition of that signal is presumably quickly mixed with extracellular water and therefore lost. In contrast, SH oxidizes H2 in the cytoplasm, where released H+ will rapidly equilibrate with water and could thereby be incorporated into fatty acids. We thus can predict that hydrogenase influences on cellular water should be most pronounced in MBH-, which relies completely on SH, and should be least pronounced in SH-.
Supplied H2 in our cultures was always strongly D-depleted relative to growth water, so catabolic oxidation of H2 to H2O should serve to lower water and thus fatty acid δD values. Assuming that this effect is strongest in the MBH- strain (as argued above), the predicted variation in δDFA would be MBH- < wild type < SH-, consistent with the observed variation. Because the isotopic contrast between H2 and H2O was greatest in those experiments with D-enriched medium, this mechanism could also potentially explain the increasing differences between strains with increasing δDwater.
The second process to consider is hydrogenase-catalyzed isotopic exchange between H2 and H2O; the existence of this process is clearly indicated by the decrease in δDH2 over the course of the experiment. This decrease in δDH2 would tend to cause a corresponding enrichment in δDwater. Indeed, such enrichment was observed directly in the low-δDwater treatments, which were farthest from equilibrium with H2. Assuming that this effect is strongest in the MBH- strain, the predicted variation in δDFA would be SH- < wild type < MBH-. In fact, the opposite order was observed in this study. Therefore, the oxidation of H2 to H2O is the only mechanism of hydrogenase influence via the intracellular water pool that could yield the observed variation in δDFA between strains. A similar mechanism has previously been observed in E. coli (Kreuzer-Martin et al., 2006); however, the metabolic rates that generated a measurable effect in those experiments were likely orders of magnitude faster than those in our experiments. Growth rates in C. necator, at least as realized in our O2-limited batch cultures, may therefore be too slow to support any significant role for metabolic water.
Another obvious difference between the three C. necator strains is the necessity for the SH- mutant to employ reverse electron transport to generate NADH for carbon fixation (Figure 6). If this enzymatic reduction expresses a different kinetic isotope effect (KIE) than does SH, then the differing isotopic composition of NADH could be transmitted into carbon fixed by the CBB cycle and ultimately into fatty acids, regardless of whether NADH or NADPH is specifically used by fatty acid synthase. Although this mechanism may contribute partly to the larger difference in δDFA between the SH- mutant and the wild type, it cannot play a role in the difference between the MBH- mutant and the wild type, both of which are thought to reduce NADH via the SH.
The genome of C. necator H16 contains at least four putative transhydrogenases, capable of interconverting NADH and NADPH. Given that such enzymes commonly express large KIEs (Jackson et al., 1999), the metabolic balance between NADH and NADPH production has the capacity to significantly affect the δD values of both cofactor pools, and thus fatty acids. We predict that the MBH- mutant would overproduce NADH (because of over-reliance on the NAD+-reducing SH), whereas the SH- mutant is demonstrably underproducing NADH. Isotope effects of the specific C. necator transhydrogenases have not been reported, but assuming they are similar to most other studied examples, i.e., normal KIEs, overproduction of NADH should emphasize NADH → NADPH and thus D-depletion of NADPH, whereas underproduction should emphasize NADH ← NADPH and D-enrichment of NADPH. If NADPH is the primary cofactor used for fatty acid synthesis, the predicted order of D-enrichment would be MBH- < wild type < SH-, which matches the observed data; if NADH were the primary cofactor, the predicted order would be reversed.
Finally, if NADH is used for biosynthesis, it is possible that the competition between anabolic and catabolic demands leads to shifts in isotopic composition. In this model, the NADH pool represents a branch point in the flow of hydrogen from water to lipids. While the hydrogen flux from NADH to lipids is assumed to be similar in all strains (similar FA abundances), there is evidence that the flux from NADH to water (i.e., respiration) varies systematically among strains. This flux represents the oxidation of NADH for electron transport, which is catalyzed by NADH dehydrogenase. As noted above, NADH dehydrogenase activity varies among strains in the order SH- < wild type < MBH- (Komen et al., 1992). If the isotope effects associated with catabolic versus anabolic utilization of NADH differ, which seems plausible, then changes in the branching ratio between these two fates will lead to changes in the isotopic compositions, even with constant NADH supply (see Hayes, 2001). We cannot predict the direction of such effects without knowing the specific isotope effects associated with the two pathways, and either direction is plausible.
In summary, there are several possible mechanisms by which loss of SH or MBH could lead to modest shifts in lipid δD; none of them involve direct transfer of hydrogen isotopes from H2 to NAD(P)H. Oxidation of H2 to cellular water is possible but, given the slow growth in our experiments, is perhaps unlikely to be significant. Changes in the interconversion of NADH and NADPH, or in the downstream fates of NADH, are plausible. Because hydrogenase enzymes are intimately linked to conservation of cellular reducing equivalents, and thus the NADPH pool, similar linkages are likely in most other organisms that have hydrogenase enzymes.
Comparison with Other Organisms
The net D/H fractionations between fatty acids and water exhibited by C. necator can be compared to other organisms growing autotrophically (Figure 7). These include the marine, unicellular algae Isochrysis galbana and Alexandrium fundyense; the freshwater green algae Eudorina unicocca, Volvox aureus, and Botryococcus braunii; the photosynthetic purple sulfur bacteria Thiocapsa roseopersicina and Halochromatium glycolicum; H2-consuming cultures of the acetogenic bacterium Sporomusa sp. (DMG 58), the sulfate-reducing bacteria Desulfobacterium autotrophicum and Desulfobacter hydrogenophilus, and nitrate-reducing bacterium Paracoccus denitrificans; formate- and oxalate-consuming cultures of C. necator, C. oxalaticus, D. autotrophicum, and Desulfovibrio multivorans that are effectively chemoautotrophic with respect to hydrogen sources; and sulfur-oxidizing cultures of the bacteria Thiobacillus denitrificans and P. denitrificans. Data sources are provided in the caption of Figure 7.
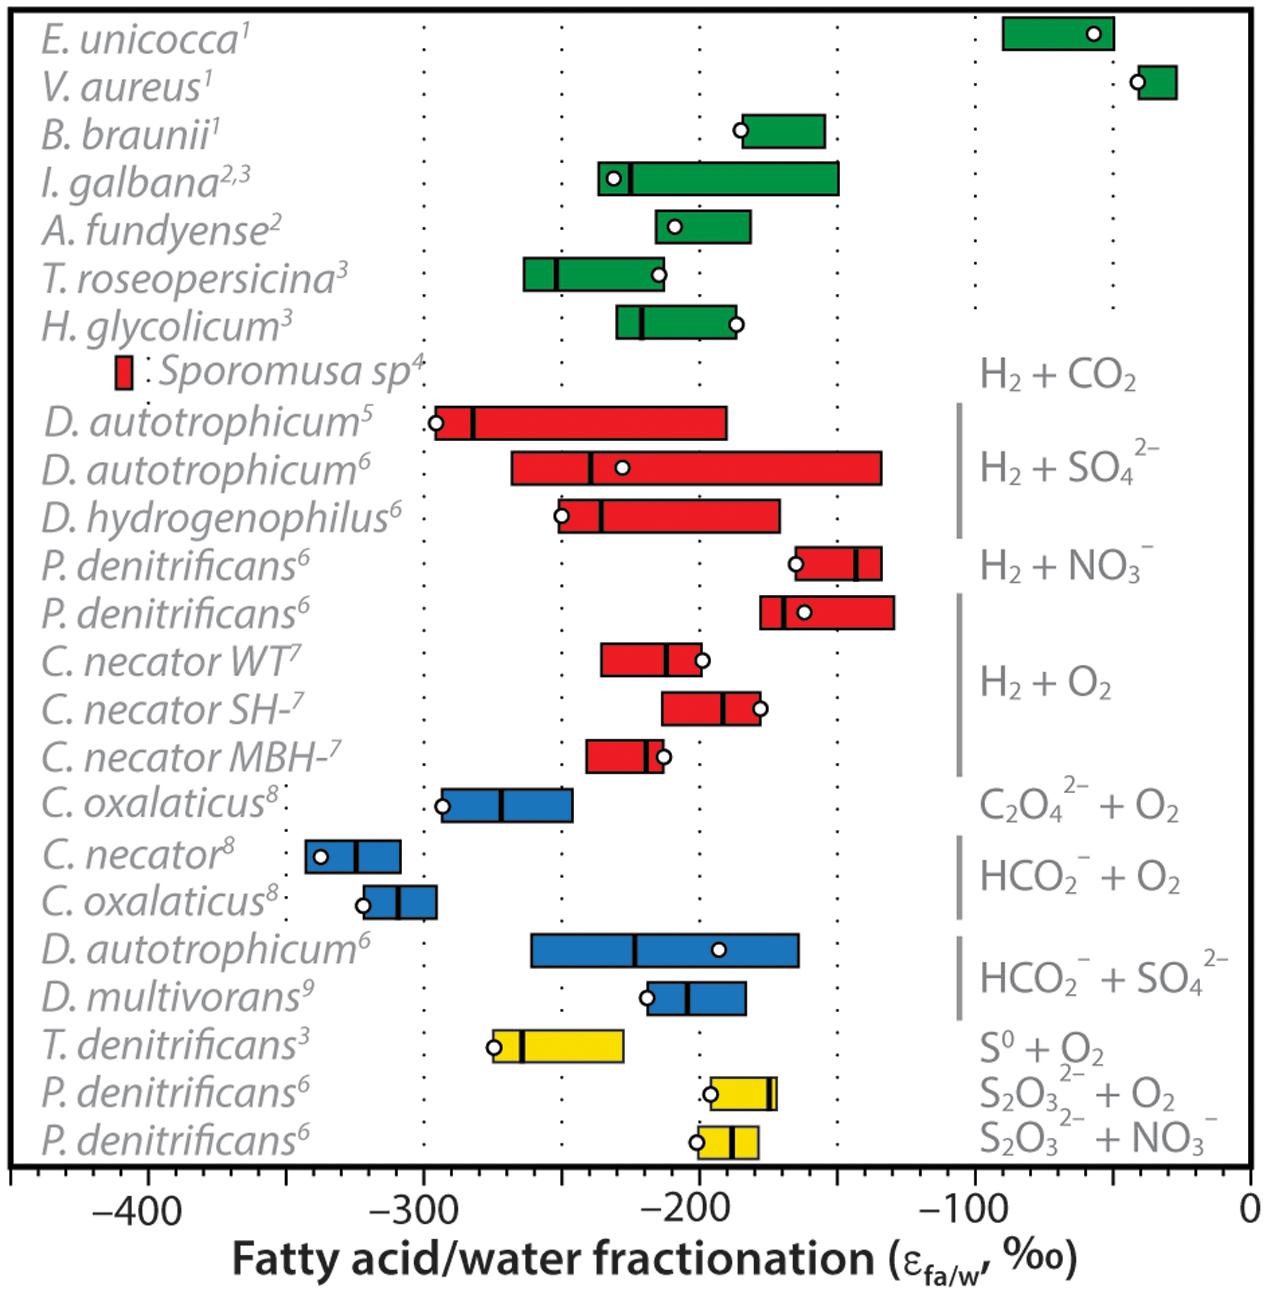
FIGURE 7. Compilation of measured hydrogen-isotopic fractionations between fatty acids and growth water (expressed as εFA/water = [(δDFA + 1)/(δDwater + 1)]. For each organism, colored bar represents the range of values for all measured fatty acids in that organism, vertical line is the weighted-mean value, circle is the value for palmitic acid (which is often the most abundant FA). Bars are colored coded for photoautotrophs (green), H2-using chemoautotrophs (red), formate- or oxalate-using chemoautotrophs (blue), or sulfur-oxidizing chemoautotrophs (yellow). Specific electron donors and acceptors are noted at right, species are noted at left. Data sources: 1Zhang and Sachs (2007); 2Sessions et al. (1999); 3Heinzelmann et al. (2015b); 4Valentine et al. (2004); 5Campbell et al. (2009); 6Osburn et al. (2016); 7This study; 8Zhang et al. (2009a); 9Dawson et al. (2015).
Zhang et al. (2009a) had originally hypothesized that substantial D-depletion of lipids relative to growth water was a potential hallmark of chemoautotrophic organisms. This hypothesis was influenced heavily by the early results of Valentine et al. (2004) for Sporomusa sp. and Zhang et al. (2009a) for C. necator and C. oxalaticus, all of which were more D-depleted than photoautotrophs. A precise mechanistic explanation for the D-depletion was not offered. Additional data on autotrophic fractionations (Figure 7) are now fairly clear in disproving this hypothesis: D/H fractionations in chemoautotrophs are not significantly different, on average, from those in unicellular photoautotrophs. Fractionations are still larger than those for most terrestrial plants (e.g., Sachse et al., 2012), but this is a consequence of soil and leaf water evaporation rather than a biochemical effect. Some heterotrophs also exhibit lipid/water fractionations that are in a similar range (e.g., Osburn et al., 2016), although many are more D-enriched for reasons that are still not entirely understood.
Although the distributions of chemoautotrophic and photoautotrophic fractionations are largely overlapping, there are several examples of chemoautotrophs that lie well outside the known range for photoautotrophs. These include D. autotrophicum grown on H2, and C. necator and C. oxalaticus grown on formate; but most of all, Sporomusa emerges as a clear anomaly. With this being the only studied example of a Firmicute or of an acetogenic organism, we do not speculate as to the uniqueness or biochemical basis of its anomalous D-depletion. Regardless, while it is clear that strong D-depletions are not ubiquitous amongst chemoautotrophs, it remains possible that abnormally D-depleted lipids could still be markers for certain metabolic pathways. This clearly requires further study, both to understand the phylogenetic distribution as well as the underlying mechanisms of the signal.
Similarity of C. necator and Algal Fractionations
A conspicuous feature of Figure 7 is the similarity of fractionations in C. necator grown on H2 and those in photoautotrophic bacteria and algae. Given that hydrogen metabolism in C. necator contributes little or no hydrogen to lipids, this leads us to question whether the similarity is merely a coincidence. Both groups of organisms use the same biosynthetic pathway for fatty acids, fueled by NAD(P)H. However, sources of the latter cofactor differ significantly between knallgas bacteria and photoautotrophs.
In oxygenic photosynthesizers, reducing equivalents are conserved mainly as NADPH during the light reactions of photosynthesis. The electron-transport chain of photosystem I ultimately passes a single low-potential electron to ferredoxin, an iron–sulfur protein. Since iron atoms carry the reducing equivalent, ferredoxin is an electron carrier, not a hydride carrier. Reduced ferredoxin then diffuses to the membrane-bound enzyme ferredoxin-NADP+ reductase (FNR). The prosthetic group of FNR is flavin adenine dinucleotide (FAD), which can accumulate two electrons from (two) ferredoxins and two hydrogen nuclei (H+ or D+) from solution, thereby being reduced to FADH2. FADH2 will in turn transfer these reducing equivalents as a hydride (H-) ion to NADP+ with stereospecificity (Ammeraal et al., 1965). The catalytic mechanism of FNR is thought to involve a ternary complex of ferredoxin, FAD, and NADP+, and electron/hydride transfer is both rapid and thermodynamically reversible. A large deuterium isotope effect (kH/kD ∼ 6) in vitro is consistent with intact hydride transfer (Tejero et al., 2007). The overall direction of the reaction is expected to be pushed strongly in the forward direction under physiologic conditions of photosynthesis, possibly via reductive inhibition by NADPH (Carrillo and Ceccarelli, 2003).
In C. necator, reducing equivalents are conserved primarily as NADH, which is generated from NAD+ by the SH. SH is a two-domain enzyme, with one module representing the heterodimeric[NiFe] hydrogenase encoded by hoxH and hoxY, and the other a flavin-containing NADH dehydrogenase module encoded by hoxF and hoxU (Burgdorf et al., 2006). The former module accomplishes the oxidation of H2, passing electrons (but not hydrogen atoms) to the latter to reduce NAD+ to NADH. The NADH dehydrogenase module is quite similar to the mitochondrial Complex I (NADH:UQ oxidoreductase), and uses flavin mononucleotide (FMN) as its prosthetic group. Electron transfer from the hydrogenase module to the redox module is accomplished via a series of Fe–S clusters. The catalytic mechanism of SH has not been studied, but in Complex I (which operates in the opposite direction to SH, oxidizing NADH and reducing UQ) it involves intact hydride transfer from NADH to FMN. The reaction of SH in the forward direction presumably accumulates two electrons and two protons on FMN, followed by hydride transfer from reduced FMNH2 to NAD+. Thus in C. necator, water – not H2 – would be the source of hydrogen to FMNH2 and NADH.
In both photosynthesis and hydrogenase-based chemoautotrophy, then, NAD(P)+ is reduced by electrons transferred from iron–sulfur carriers to a flavin prosthetic group, with a hydrogen nucleus (H+ or D+) acquired from solution, and then by hydride transfer from the reduced flavin to the nucleotide in a fast catalytic step. We do not yet know whether the observed fractionations are the result of equilibrium or KIEs, either during reduction of the flavin ring or during hydride transfer to the nucleotide. Regardless, the fact that these two enzymes with similar prosthetic groups express similar fractionations is arguably not a coincidence. Given the apparent constancy of the fractionation across a wide variety of plants, photosynthetic algae and bacteria, and (now) chemoautotrophic bacteria, we suggest that it may represent a general feature of many enzymes that use flavins as redox carriers.
Conclusion
C. necator H16 growing aerobically on H2 + CO2 exhibited net D/H fractionations between fatty acids and water that range from -199‰ to -236‰ (average -217‰), indistinguishable from those observed in most photoautotrophic algae and bacteria. Diverse lines of evidence, including examination of known biochemistry, study of hydrogenase mutants, and fractionation curves developed by modulating the isotopic composition of growth water, all indicate that H2 contributed little or no hydrogen to lipids. Instead, the observed fractionation must have resulted from the reduction of NADH with hydrogen nuclei from water, using only electrons supplied by H2. Small differences in fatty acid δD values (≤25‰) were observed between hydrogenase-deficient mutants and the wild type. These differences can likely be explained by changes in growth rate or efficiency, cellular localization of H2 oxidation, and/or competing demands for NADH. The lipid–water fractionations exhibited by C. necator are common, though not ubiquitous, among chemoautotrophs for which fractionations have been reported. The hypothesis that chemoautotrophic and photoautotrophic biomass can be distinguished by their δD values is therefore falsified, although at least some chemoautotrophs are significantly D-depleted for reasons not yet known. A fractionation of roughly -200‰ appears to be common to many NAD(P)+ reductases.
Author Contributions
BC planned the experiments, conducted research, analyzed the data, and wrote the manuscript. AS performed lipid analyses, analyzed the data, and wrote the manuscript. DF helped with microbial cultures and gas isotope analyses. BP provided analysis of genomic data for strain H16. QQ cultivated and sampled microbial cultures. MK performed the polar lipid analysis, DV planned and supervised the experiments, analyzed the data, and edited the manuscript.
Funding
This work was supported by the NASA Graduate Student Researcher Program (to BC) and grants from the National Science Foundation (EAR-0311894 to DV and AS; OCE-1046144 to DV; EAR-1529120 to AS).
Conflict of Interest Statement
The authors declare that the research was conducted in the absence of any commercial or financial relationships that could be construed as a potential conflict of interest.
Acknowledgments
The authors gratefully acknowledge Robert Petty, Chao Li, and Fenfang Wu for assistance with various isotopic analyses. We thank the three reviewers, who contributed substantively to improving the manuscript.
Supplementary Material
The Supplementary Material for this article can be found online at: http://journal.frontiersin.org/article/10.3389/fmicb.2017.01886/full#supplementary-material
FIGURE S1 | Bar charts of hydrogen-isotopic fractionations between fatty acids and growth water, grouped by fatty acid structure and color-coded by strain. Top, middle, and bottom plots are data from cultures with no D-enrichment, medium D-enrichment, and high D-enrichment, respectively.
TABLE S1 | Complete dataset of fatty acid structure, abundance, and isotopic composition; polar lipid structure and abundance; and bacterial growth measurements.
References
Ammeraal, R. N., Krakow, G., and Vennesland, B. (1965). The stereospecificity of the hill reaction with diphosphopyridine nucleotide. J. Biol. Chem. 240, 1824–1828.
Bernhard, M., Benelli, B., Hochkoeppler, A., Zannoni, D., and Friedrich B. (1997). Functional and structural role of the cytochrome b subunit of the membrane-bound hydrogenase complex of Alcaligenes eutrophus H16. Eur. J. Biochem. 248, 179–186. doi: 10.1111/j.1432-1033.1997.00179.x
Bowien, B., and Kusian, B. (2002). Genetics and control of CO2 assimilation in the chemoautotroph Ralstonia eutropha. Arch. Microbiol. 178, 85–93. doi: 10.1007/s00203-002-0441-3
Burgdorf, T., Lenz, O., Buhrke, T., van der Linden, E., Jones, A. K., Albracht, S. P. J., et al. (2006). [NiFe]-hydrogenases of Ralstonia eutropha H16: Modular enzymes for oxygen-tolerant biological hydrogen oxidation. J. Molec. Microbiol. Biotechnol. 10, 181–196. doi: 10.1159/000091564
Campbell, B. J., Li, C., Sessions, A. L., and Valentine, D. L. (2009). Hydrogen isotopic fractionation in lipid biosynthesis by H2-consuming Desulfobacterium autotrophicum. Geochim. Cosmochim. Acta 73, 2744–2757. doi: 10.1016/j.gca.2009.02.034
Campbell, J. W., and Cronan, J. E. (2001). Bacterial fatty acid biosynthesis: targets for antibacterial drug discovery. Ann. Rev. Microbiol. 55, 305–332. doi: 10.1146/annurev.micro.55.1.305
Carrillo, N., and Ceccarelli, E. A. (2003). Open questions in ferredoxin-NADP+ reductase catalytic mechanism. Eur. J. Biochem. 270, 1900–1915. doi: 10.1046/j.1432-1033.2003.03566.x
Chikaraishi, Y., Naraoka, H., and Poulson, S. R. (2004). Hydrogen and carbon isotopic fractionations of lipid biosynthesis among terrestrial (C3, C4 and CAM) and aquatic plants. Phytochemistry 65, 1369–1381. doi: 10.1016/j.phytochem.2004.03.036
Chivall, D., M’Boule, D., Sinke-Schoen, D., Sinninghe Damsté, J. S., Schouten, S., and van der Meer, M. T. J. (2014). The effects of growth phase and salinity on the hydrogen isotopic composition of alkenones produced by coastal haptophyte algae. Geochim. Cosmochim. Acta 140, 381–390. doi: 10.1016/j.gca.2014.05.043
Davis, D. H., Doudorof, M., Stanier, R. Y., and Mandel, M. (1969). Proposal to reject the genus Hydrogenomonas: taxonomic implications. Int. J. Syst. Bacteriol. 19, 375–390. doi: 10.1099/00207713-19-4-375
Dawson, K. S., Osburn, M. R., Sessions, A. L., and Orphan, V. J. (2015). Metabolic associations with archaea drive shifts in hydrogen isotope fractionation in sulfate-reducing bacterial lipids in cocultures and methane seeps. Geobiology 13, 462–477. doi: 10.1111/gbi.12140
de Lacey, A. L., Fernandez, V. M., and Rousset, M. (2005). Native and mutant nickel-iron hydrogenases: unravelling structure and function. Coord. Chem. Rev. 249, 1596–1608. doi: 10.1016/j.ccr.2005.03.009
Dirghangi, S. S., and Pagani, M. (2013). Hydrogen isotope fractionation during lipid biosynthesis by Haloarcula marismortui. Geochim. Cosmochim. Acta. 119, 381–390. doi: 10.1016/j.gca.2013.05.023
Friedrich, B., and Schwartz, E. (1993). Molecular biology of hydrogen utilization in aerobic chemolithotrophs. Annu. Rev. Microbiol. 47, 351–383. doi: 10.1146/annurev.mi.47.100193.002031
Hagemann, R., Nief, G., and Roth, E. (1970). Absolute isotopic scale for deuterium analysis of natural waters. Absolute D/H ratio for SMOW. Tellus 22, 712–715. doi: 10.1111/j.2153-3490.1970.tb00540.x
Hayes, J. M. (2001). “Fractionation of carbon and hydrogen isotopes in biosynthetic processes,” in Reviews in Mineralogy and Geochemistry: Stable Isotope Geochemistry, Vol. 43, eds J. Valley and D.R. Cole. Washington, DC: Mineralogical Society of America. 225–277
Heath, R. J., Jackowski, S., and Rock, C. O. (2002). “Fatty acid and phospholipid metabolism in prokaryotes,” in Biochemistry of Lipids, Lipoproteins, and Membranes, 4th Edn, eds D. E. Vance and J. E. Vance (New York, NY: Elsevier), 55–92.
Heinzelmann, S. M., Chivall, D., M’Boule, D., Sinke-Schoen, D., Villanueva, L., Sinninghe Damsté, J. S., et al. (2015a). Comparison of the effect of salinity on the D/H ratio of fatty acids of heterotrophic and photoautotrophic microorganisms. FEMS Microbiol. Lett. 362:fnv065. doi: 10.1093/femsle/fnv065
Heinzelmann, S. M., Villanueva, L., Sinke-Schoen, D., Sinninghe Damsté, J. S., Schouten, S., and van der Meer, M. T. J. (2015b). Impact of metabolism and growth phase on the hydrogen isotopic composition of microbial fatty acids. Front. Microbiol. 6:408. doi: 10.3389/fmicb.2015.00408
Horibe, Y., and Craig, H. (1995). D/H fractionation in the system methane-hydrogen-water. Geochim. Cosmochim. Acta 59, 5209–5217. doi: 10.1016/0016-7037(95)00391-6
Hungate, R. E. (1969). “A roll tube method for cultivation of strict anaerobes,” in Methods in Microbiology, Vol. 3b eds J. R. Norris and D. W. Ribbons (London: Academic Press, Inc.), 117–132.
Jackson, J. B., Peake, S. J., and White, S. A. (1999). Structure and mechanism of proton-translocating transhydrogenase. FEBS Lett. 464, 1–8. doi: 10.1016/S0014-5793(99)01644-0
Javidpour, P., Pereira, J. H., Goh, E.-B., McAndrew, R. P., Ma, S. M., Friedland, G. D., et al. (2014). Biochemical and structural studies of NADH-dependent FabG used to increase the bacterial production of fatty acids under anaerobic conditions. Appl. Environ. Microbiol. 80, 497–505. doi: 10.1128/AEM.03194-13
Kellermann, M. Y., Schubotz, F., Elvert, M., Lipp, J. S., Birgel, D., Prieto-Mollar, X., et al. (2011). Symbiont-host relationships in chemosynthetic mussels: a comprehensive lipid biomarker study. Org. Geochem. 43, 112–124.
Kellermann, M. Y., Yoshinaga, M. Y., Valentine, R. C., Wörmer, L., and Valentine, D. L. (2016). Important roles for membrane lipids in haloarchaeal bioenergetics. Biochem. Biophys. Acta 1858, 2940–2956. doi: 10.1016/j.bbamem.2016.08.010
Komen, R., Schmidt, K., and Friedrich, B. (1992). Hydrogenase mutants of Alcaligenes eutrophus H16 show alterations in the electron transport system. FEMS Microbiol. Lett. 96, 173–178. doi: 10.1111/j.1574-6968.1992.tb05412.x
Komen, R., Schmidt, K., and Zannoni, D. (1996). Hydrogen oxidation by membranes from autotrophically grown Alcaligenes eutrophus H16: role of the cyanide-resistant pathway in energy transduction. Arch. Microbiol. 165, 418–420. doi: 10.1007/s002030050347
Komen, R., Zannoni, D., Ingledew, W. J., and Schmidt, K. (1991a). The electron transport system of Alcaligenes eutrophus H16: I. Spectroscopic and thermodynamic properties. Arch. Microbiol. 155, 382–390. doi: 10.1007/BF00243459
Komen, R., Zannoni, D., and Schmidt, K. (1991b). The electron transport system of Alcaligenes eutrophus H16: II. Respiratory activities and effect of specific inhibitors. Arch. Microbiol. 155, 436-443. doi: 10.1007/BF00244958
Kopf, S. H., Sessions, A. L., Cowley, E. S., Reyes, C., Van Sambeek, L., Hu, Y., et al. (2015). Trace incorporation of heavy water reveals slow and heterogeneous pathogen growth rates in cystic fibrosis sputum. Proc. Nat. Acad. Sci. U.S.A. 113, E110–E116. doi: 10.1073/pnas.1512057112
Kreuzer-Martin, H., Lott, M., Ehleringer, J. R., and Hegg, E. (2006). Metabolic processes account for the majority of the intracellular water in log-phase Escherichia coli cells as revealed by hydrogen isotopes. Biochemistry 45, 13622–13630. doi: 10.1021/bi0609164
Leavitt, W. D., Flynn, T. M., Suess, M. K., and Bradley, A. S. (2016). Transhydrogenase and growth substrate influence lipid hydrogen isotope ratios in Desulfovibrio alaskensis G20. Front. Microbiol. 7:918. doi: 10.3389/fmicb.2016.00918.
Lee, J. N., Shin, H. D., and Lee, Y. H. (2003). Metabolic engineering of pentose phosphate pathway in Ralstonia eutropha for enhanced biosynthesis of poly-beta-hydroxybutyrate. Biotechnol. Prog. 19, 1444–1449. doi: 10.1021/bp034060v
Lenz, O., and Friedrich, B. (1998). A novel multicomponent regulatory system mediates H2 sensing in Alcaligenes eutrophus. Proc. Natl. Acad. Sci. U.S.A. 95, 12474–12479. doi: 10.1073/pnas.95.21.12474
Osburn, M. R., Dawson, K. S., Fogel, M. L., and Sessions, A. L. (2016). Fractionation of hydrogen isotopes by sulfate- and nitrate-reducing bacteria. Front. Microbiol. 7:1166. doi: 10.3389/fmicb.2016.01166
Osburn, M. R., Sessions, A. L., Pepe-Ranney, C., and Spear, J. R. (2011). Hydrogen-isotopic variability in fatty acids from Yellowstone National Park hot spring microbial communities. Geochim. Cosmochim. Acta 75, 4830–4845. doi: 10.1016/j.gca.2011.05.038
Pfitzner, J. (1974). Contribution on H-O-oxidoreductase system of Hydrogenomonas eutropha strain H16 hydrogenase-defective mutants. Z. Bakteriol. Mikrobiol. Hyg. A 228, 121–127.
Sachse, D., Billault, I., Bowen, G. J., Chikaraishi, Y., Dawson, T. E., Feakins, S. J., et al. (2012). Molecular paleohydrology: interpreting the hydrogen-isotopic composition of lipid biomarkers from photosynthesizing organisms. Annu. Rev. Earth Planet. Sci. 40, 221–249. doi: 10.1146/annurev-earth-042711-105535
Schink, B., and Schlegel, H. G. (1978). Mutants of Alcaligenes eutrophus defective in autotrophic metabolism. Arch. Microbiol. 117, 123–129. doi: 10.1007/BF00402299
Schink, B., and Schlegel, H. G. (1979). The membrane-bound hydrogenase of Alcaligenes eutrophus: 1. Solubilization, purification, and biochemical properties. Biochim. Biophys. Acta 567, 315–324. doi: 10.1016/0005-2744(79)90117-7
Schneider, K., and Schlegel, H. G. (1976). Purification and properties of soluble hydrogenase from Alcaligenes eutrophus H16. Biochim. Biophys. Acta. 452, 66–80. doi: 10.1016/0005-2744(76)90058-9
Schouten, S., Ossebaar, J., Schreiber, K., Kienhuis, M. V. M., Langer, G., Benthien, A., et al. (2006). The effect of temperature, salinity and growth rate on the stable hydrogen isotopic composition of long chain alkenones produced by Emiliania huxleyi and Gephyrocapsa oceanica. Biogeosciences 3, 113–119. doi: 10.5194/bg-3-113-2006
Schwartz, E., Henne, A., Cramm, R., Eitinger, T., Friedrich, B., and Gottschalk, G. (2003). Complete nucleotide sequence of pHG1: a Ralstonia eutropha H16 megaplasmid encoding key enzymes of H2-based lithoautotrophy and anaerobiosis. J. Mol. Biol. 332, 369–383.
Sessions, A. L. (2006). Seasonal changes in D/H fractionation accompanying lipid biosynthesis in Spartina alternflora. Geochim. Cosmochim. Acta 70, 2153–2162. doi: 10.1016/j.gca.2006.02.003
Sessions, A. L., Burgoyne, T. W., Schimmelmann, A., and Hayes, J. M. (1999). Fractionation of hydrogen isotopes in lipid biosynthesis. Org. Geochem. 30, 1193-1200. doi: 10.1016/S0146-6380(99)00094-7
Sessions, A. L., and Hayes, J. M. (2005). Calculation of hydrogen isotopic fractionations in biogeochemical systems. Geochim. Cosmochim. Acta 69, 593–597. doi: 10.1016/j.gca.2004.08.005
Spencer, R. W., Daniels, L., Fulton, G., and Orme-Johnson, W. H. (1980). Product isotope effects on in vivo methanogenesis by Methanobacterium thermoautotrophicum. Biochemestry 19, 3678–3683. doi: 10.1021/bi00557a007
Tavormina, P. L., Kellermann, M. Y., Antony, C. P., Tocheva, E. I., Dalleska, N. F., Jensen, A. J., et al. (2017). Starvation and recovery in the deep-sea methanotroph Methyloprofundus sedimenti. Mol. Microbiol. 103, 242–252. doi: 10.1111/mmi.13553
Tejero, J., Peregrina, J. R., Martínez-Júlvez, M., Gutiérrez, A., Gómez-Moreno, C., Scrutton, N. S., et al. (2007). Catalytic mechanism of hydride transfer between NADP+/H and ferredoxin-NADP+ reductase from Anabaena PCC 7119. Arch. Biochem. Biophys. 459, 79–90.
Valentine, D. L., Sessions, A. L., Tyler, S. C., and Chidthaisong, A. (2004). Hydrogen isotope fractionation during H2/CO2 acetogenesis: hydrogen utilization efficiency and the origin of lipid-bound hydrogen. Geobiology 2, 179–188. doi: 10.1111/j.1472-4677.2004.00030.x
Vandamme, P., and Coenye, T. (2004). Taxonomy of the genus Cupriavidus: a tale of lost and found. Int. J. System. Evol. Microbiol. 54, 2285–2289. doi: 10.1099/ijs.0.63247-0
Vaneechoutte, M., Kampfer, P., De Baere, T., Falsen, E., and Verschraegen, G. (2004). Wautersia gen. nov., a novel genus accommodating the phylogenetic lineage including Ralstonia eutropha and related species, and proposal of Ralstonia [Pseudomonas] syzygii (Roberts et al. 1990) comb. nov. Int. J. Syst. Evol. Microbiol. 54, 317–327. doi: 10.1099/ijs.0.02754-0
Vignais, P. M. (2005). H/D exchange reactions and mechanistic aspects of the hydrogenases. Coord. Chem. Rev. 249, 1677–1690. doi: 10.1016/j.ccr.2005.01.026
Vignais, P. M., and Colbeau, A. (2004). Molecular biology of microbial hydrogenases. Curr. Issues Mol. Biol. 6, 159–188.
Wörmer, L., Lipp, J. S., Schröder, J. M., Hinrichs, K.-U. (2013). Application of two new LC–ESI-MS methods for improved detection of intact polar lipids (IPLs) in environmental samples. Org. Geochem. 59, 10–21. doi: 10.1016/j.orggeochem.2013.03.004
Yabuuchi, E., Kosako, Y., Yano, I., Hotta, H., and Nishiuchi, Y. (1995). Transfer of two Burkholderia and an Alcaligenes species to Ralstonia gen. nov.: Proposal of Ralstonia pickettii (Ralston, Palleroni and Doudoroff 1973) comb. nov., Ralstonia solanacearum (Smith 1896) comb. nov. and Ralstonia eutropha (Davis 1969) comb. nov. Microbiol. Immunol. 39, 897–904. doi: 10.1111/j.1348-0421.1995.tb03275.x
Zhang, X., Gillespie, A. L., and Sessions, A. L. (2009a). Large D/H variations in bacterial lipids reflect central metabolic pathways. Proc. Natl. Acad. Sci. U.S.A. 106, 12580–12586. doi: 10.1073/pnas.0903030106
Zhang, Z., Sachs, J. P., and Marchetti, A. (2009b). Hydrogen isotope fractionation in freshwater and marine algae: II. Temperature and nitrogen limited growth rate effects. Org. Geochem. 40, 428–439. doi: 10.1016/j.orggeochem.2008.11.002
Keywords: Cupriavidus necator, hydrogenase, hydrogen isotope, D/H, fatty acid, autotrophic metabolism
Citation: Campbell BJ, Sessions AL, Fox DN, Paul BG, Qin Q, Kellermann MY and Valentine DL (2017) Minimal Influence of [NiFe] Hydrogenase on Hydrogen Isotope Fractionation in H2-Oxidizing Cupriavidus necator. Front. Microbiol. 8:1886. doi: 10.3389/fmicb.2017.01886
Received: 06 October 2016; Accepted: 14 September 2017;
Published: 04 October 2017.
Edited by:
Jennifer Pett-Ridge, Lawrence Livermore National Laboratory (DOE), United StatesReviewed by:
William Lanzilotta, University of Georgia, United StatesWilliam D. Leavitt, Dartmouth College, United States
Marcel Van Der Meer, Royal Netherlands Institute for Sea Research (NWO), Netherlands
Copyright © 2017 Campbell, Sessions, Fox, Paul, Qin, Kellermann and Valentine. This is an open-access article distributed under the terms of the Creative Commons Attribution License (CC BY). The use, distribution or reproduction in other forums is permitted, provided the original author(s) or licensor are credited and that the original publication in this journal is cited, in accordance with accepted academic practice. No use, distribution or reproduction is permitted which does not comply with these terms.
*Correspondence: Alex L. Sessions, als@gps.caltech.edu
†Present address: Brian J. Campbell, Department of Environmental Quality, Commonwealth of Virginia, Richmond, VA, United States