 Rui Chen
 Pei Hu
- Clinical Pharmacology Research Center, Peking Union Medical College Hospital, Beijing, China
Purpose: Asian populations have around 40–60% frequency of reduced function allele CYP2D6∗10 compared to 1–2% in Caucasian populations. The wide range of CYP2D6 enzyme activities in subjects with the CYP2D6∗10 variant is a big concern for clinical practice. The quantitative analysis measuring the impact of CYP2D6 enzyme activity as a result of one CYP2D6∗10 allele or two CYP2D6∗10 alleles has not been reported in large Asian populations.
Methods: A total of 421 healthy Chinese subjects were genotyped for CYP2D6 by polymerase chain reaction and direct DNA sequencing. A total of 235 subjects with CYP2D6∗1/∗1 (n = 22), CYP2D6∗1/∗10 (n = 93), CYP2D6∗10/∗10 (n = 85), and CYP2D6∗5/∗10 (n = 35) were phenotyped for CYP2D6 using dextromethorphan as the probe drug. Metabolic ratios (MR) were calculated as the ratio of parent drug to metabolite in 0–3 h urine, 3 h plasma, and 3 h saliva for each sample type.
Results: The urinary, plasma, or salivary MRs increased successively in subjects with CYP2D6∗1/∗1, ∗1/∗10, ∗10/∗10, and ∗5/∗10 (all P < 0.001). In the normal metabolizer group, homozygous CYP2D6∗10/∗10 decreased the CYP2D6 enzyme activity further than heterozygous CYP2D6∗1/∗10. Urinary, plasma, and salivary MRs were highly correlated.
Conclusion: The normal metabolizer group calls for a more detailed classification. The activity score system could more accurately predict enzyme activity than by grouping a number of genotypes into a single phenotype group. Single-point plasma samples and saliva samples could be used as alternative phenotyping methods for clinical convenience.
Introduction
The CYP2D6 gene encodes the cytochrome P450 2D6 enzyme that is a member of the cytochrome P450 superfamily. It plays an important role in the metabolism of approximately 25% of currently marketed drugs. This enzyme participates in metabolizing a number of substrates in the therapeutic class of clinical drugs including antidepressants, antipsychotics, analgesics and antitussives, beta adrenergic blocking agents, antiarrhythmic, antiemetics, etc. (Zhou, 2009a,b; Murphy and McMahon, 2013; Zanger and Schwab, 2013). The CYP2D6 gene product is also one of the most famous and widely investigated polymorphic enzymes due to its broad inter-individual and inter-ethnic variations in enzyme activity. This led to the discovery of mutation, deletion, and duplication variants of the CYP2D6 gene (Teh and Bertilsson, 2012). Such diverse enzyme activities have been shown to result in dose-dependent adverse events or therapeutic failures after administration of CYP2D6 substrates (Gaedigk, 2013).
Currently, there are more than 100 allelic variants of CYP2D6 identified1. Among these are full functional alleles, reduced function alleles, non-functional alleles and gene copy duplicates, that range in activity from ultra-rapid metabolism to no metabolism (Gaedigk, 2013; Hicks et al., 2016; Gaedigk et al., 2017). The frequencies of CYP2D6 alleles can vary dramatically among ethnicities. For example, non-functional CYP2D6∗4 allele frequency can be extremely low or even absent in some east Asian and Oceania populations while Europeans frequencies typically range between 15 and 20% but can be over 30% as reported in people of Faroese decent (Gaedigk, 2013). In contrast, on a population basis, Asians exhibit a marked shift toward overall slower CYP2D6 activity when comparing metabolic ratios (MR) from urine samples (Kitada, 2002) that can be presented as high frequencies (up to 64%, averaging 42%) of the reduced function allele CYP2D6∗10 (Gaedigk, 2013). In other populations the frequencies of CYP2D6∗10 range between 3 and 7% and the frequency is the lowest in white Europeans (Gaedigk, 2013) and Oceanians (Gaedigk et al., 2017).
Phenotypes are stratified into groups including poor (PM), intermediate (IM), normal (NM), and ultra-rapid (UM) metabolizer phenotypes (Gaedigk et al., 2008; Caudle and Dunnenberger, 2017). The activity score (AS) system for CYP2D6 was introduced by Gaedigk et al. (2008) and was used to translate diplotypes into predicted phenotypes (Hicks et al., 2016). Metabolic activity of CYP2D6 is assessed by probe drugs, where dextromethorphan is the most often used substrate. Eight-hour urinary MR of dextromethorphan (DM) to its metabolite dextrorphan (DX) is employed to differentiate between NMs and PMs (Chladek et al., 2000; O’mathúna et al., 2008; Lötsch et al., 2009; Ito et al., 2010). However, collection of urine during the 8 h interval is a demanding process and inconvenient for clinical operation. Therefore, alternative procedures have been developed for simple and robust phenotyping. In addition to urine, plasma, or saliva samples can also be used to determine MR. Previous studies indicated tight correlations between MRs measured in plasma (3 h post-dose) and urine (0–4 h post-dose) (Chladek et al., 2000). The MR from single-point plasma 1 to 30 h post-dose was reported to have good correlations with MR from area under the curve (AUC) (Chen et al., 2016a,b). The MR from plasma collected 3, 4, or 6 h post-dose and MR from saliva collected 2, 3, 4, 5, 6 h post-dose were explored to discriminate between NM from PM and IM (Frank et al., 2007). These results showed that single-point plasma and saliva-derived MRs may serve as alternative tools for CYP2D6 phenotyping.
It has been shown that the CYP2D6∗10 variant is a reduced function allele that decreases enzyme activity and thus increases the CYP2D6 MR value. However, quantitative analysis on the impact of CYP2D6 enzyme activity as a result of one CYP2D6∗10 allele or two CYP2D6∗10 alleles has not been reported in large populations. In the present study, CYP2D6∗1 was defined as a standard full functional allele and CYP2D6∗5 was defined as a non-functional allele. Both CYP2D6∗1 and CYP2D6∗5 were used as references or control alleles to investigate the impact of the CYP2D6∗10 allele on the metabolic activity of CYP2D6 in a healthy Chinese population. The CYP2D6 enzyme activities within the population were determined simultaneously by urinary, plasma, and salivary phenotyping methods and the results were compared.
Materials and Methods
Study Subjects
The study was performed in accordance with the Declaration of Helsinki and was approved by the Ethics Committee of Peking Union Medical College Hospital. Written informed consent was obtained from each subject. Four hundred and twenty-one healthy unrelated subjects in Mainland China were enrolled. All enrolled subjects were judged to be healthy based on the results of detailed physical examination, 12-lead electrocardiography, biochemistry, hematology, and routine urinalysis. Subjects were not eligible if they had history or evidence or hepatic, renal, gastrointestinal, or hematologic abnormality; hepatitis B or C, syphilis, or human immunodeficiency virus infection on screening examination; any other acute or chronic disease; or allergic to dextromethorphan. The consumption of alcohol, grapefruit juice, and caffeine-containing drinks was not permitted for 24 h prior to DM administration and until all samples were collected in the study phase. The subjects were instructed to abstain from taking any medication or herbal remedies for at least 1 week and smoking for at least 3 days before the study.
CYP2D6 Genotyping
Peripheral blood samples from 421 subjects were collected and DNA was extracted by total genomic DNA isolation using a Wizard TM Genomic Purification Kit (Promega, USA). The DNA from 2 mL of blood was dissolved in 100 μL of DNA hydration solution and stored at -70°C. All subjects recruited in this study were genotyped by DNA sequencing analysis for CYP2D6∗1, ∗2, ∗3, ∗4, ∗6, ∗7, ∗10, ∗14, ∗18, ∗21, ∗28, ∗33, ∗34, ∗35, ∗36, ∗39, ∗41, ∗43, ∗49, ∗51, ∗52, ∗54, ∗60, ∗63, ∗65, ∗69, ∗71, and ∗75 as previously reported (Qian et al., 2013). Long polymerase chain reaction (PCR)-based methods from Løvlie et al. (1996) and Hersberger et al. (2000) were employed with minor modifications to detect the CYP2D6∗5 allele and duplication, respectively. We tested the aforementioned alleles and duplications to determine CYP2D6∗1, ∗5, and ∗10 specifically. The CYP2D6 gene was amplified using a standard procedure (Qian et al., 2013). CYP2D6 gene sequencing had the entire gene coverage as well as 5′ and 3′ UTR regions corresponding to M33388 positions -2182 to 4482. Primers for each fragment of gene were designed using Primer Specification Design v1.1 (Capitalbio, China) (Supplementary Table 1). Fragments were amplified by PCR. To confirm PCR products sizes, samples were electrophorezed on a 1.5% agarose gel. Prior to sequencing, PCR products were cleaned using the PCR purification Kit (Capitalbio, China) to remove unincorporated primers and nucleotides. The purified DNA was sequenced using the ABI Big Dye v3.1 Terminator cycle sequencing kit (Applied Biosystems, USA). The sequencing reaction was carried out with an initial denaturing step of 96°C for 1 min, followed by 25 cycles of 96°C for 10 s, 50°C for 5 s, and 60°C for 4 s. The final reaction products were purified using an ethanol/ammonium acetate precipitation method to remove unincorporated dye terminators, sequencing primers, and residual nucleotides. Denatured samples were analyzed on the ABI 3730XL Genetic Analyzer (Applied Biosystems, USA). Finally, sequence mutations were analyzed using Sequence Variation Analysis v1.2 (Capitalbio, China).
CYP2D6 Phenotyping with DM
A total of 235 subjects with CYP2D6∗1/∗1 (n = 22), CYP2D6∗1/∗10 (n = 93), CYP2D6∗10/∗10 (n = 85), and CYP2D6∗5/∗10 (n = 35) were phenotyped for CYP2D6 using DM as the probe drug and DX as the CYP2D6-specific metabolite. Each subject received 15 mg DM (Tylenol Cold Tablet containing DM, Johnson & Johnson Investment, Ltd, Shanghai, China) with 300 ml of water. Venous blood samples and saliva samples were collected 3 h post-drug administration. Urine samples were collected at 0–3 h intervals post-drug administration. Concentrations of DM and unconjugated DX in all samples were analyzed using a sensitive and validated high performance liquid chromatography tandem mass spectrometry (HPLC–MS/MS) assay as previously described (Hou et al., 1991; Hu et al., 1998). The lower limit of quantification was 0.05 ng/mL for both DM and DX in urine, plasma, and saliva samples. A MR of the concentration of DM over DX (MRDM/DX) was used as a measure of CYP2D6 enzyme activity in the three sample types, respectively.
Statistical Analysis
Data were expressed as mean values ± SD. Based on urinary, plasma, and salivary phenotyping methods, the MR values between different genotype groups were analyzed respectively with an analysis of variance (ANOVA) test. Allele CYP2D6∗1 was defined as a standard full functional allele and CYP2D6∗5 was defined as a non-functional allele. Both CYP2D6∗1 and CYP2D6∗5 were used as references or control alleles to estimate the impact of the CYP2D6∗10 allele on CYP2D6 metabolic activity. The AS system was measured by assigning scores of 2, 1.5, 1, and 0.5 to subjects with CYP2D6∗1/∗1, ∗1/∗10, ∗10/∗10, and ∗5/∗10, respectively. A P value less than 0.05 was considered to be statistically significant. The ANOVA was performed with SPSS (version 19.0, SPSSTM).
Results
Demographic Characteristics
Of the investigated subjects, 404 subjects were ethnically Han; the remaining 17 subjects included Hui, Manchu, Khalkhas, Korean, Zhuang, Tujia, and Mongol ethnicities. Their ages, weights, body mass index (BMI) and genders can be found in Table 1.
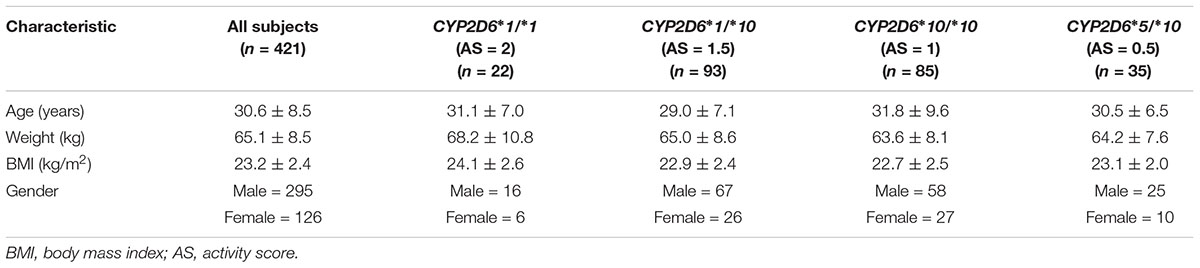
TABLE 1. Demographic characteristics of the study population of healthy Chinese volunteers (mean ± SD).
CYP2D6 Genotypes
Among the 421 subjects, the gene frequency of CYP2D6∗10 was 45.7%. There were 22 subjects with CYP2D6∗1/∗1, 93 subjects with CYP2D6∗1/∗10, 85 subjects with CYP2D6∗10/∗10, and 35 subjects with CYP2D6∗5/∗10. The CYP2D6∗10 allele was also heterozygous with other alleles besides ∗1 and ∗5 although those genotypes were not reported in this study. Other CYP2D6 alleles were tested to determine CYP2D6∗1, ∗5, and ∗10 specifically and remove the confounding factors.
CYP2D6 Phenotypes
Based on the MR values from the 0 to 3 h urine samples, the mean MR in 235 subjects was 0.485 ± 2.48, ranging from 0.00758 to 36.7, and displayed greater than 4,800-fold inter-individual range. Based on the MR values from the 3 h plasma samples, the mean MR in 235 subjects was 1.73 ± 6.63, ranging from 0.0528 to 95.6, and displayed greater than 1800-fold inter-individual range. Based on the MR values from the 3 h saliva samples, the mean MR in 235 subjects was 5.24 ± 18.8, ranging from 0.117 to 250, and displayed greater than 2100-fold inter-individual range.
The CYP2D6∗10 allele had substantial impact on the metabolic activity of CYP2D6 regardless of the urinary, plasma, or salivary phenotyping method used. The mean (± SD) MRs for CYP2D6∗1/∗1, ∗1/∗10, ∗10/∗10, and ∗5/∗10 groups were presented by the three methods, respectively (Table 2 and Figure 1). The urinary, plasma, or salivary MRs increased successively in subjects with CYP∗1/∗1, ∗1/∗10, ∗10/∗10, and ∗5/∗10 with statistical significance (all P-values < 0.001) (Table 2).
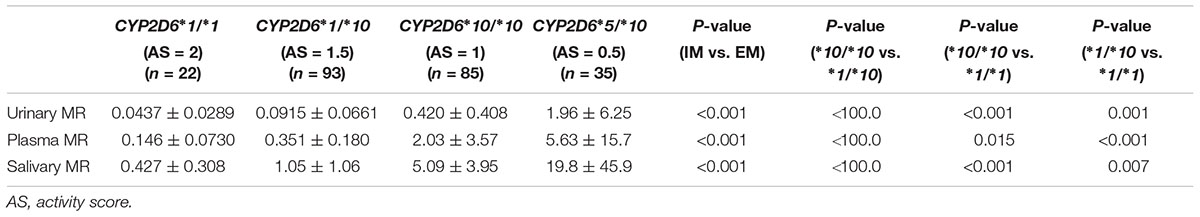
TABLE 2. The MRs for CYP2D6∗1/∗1, ∗1/∗10, ∗10/∗10, and ∗5/∗10 groups based on the three phenotyping methods.
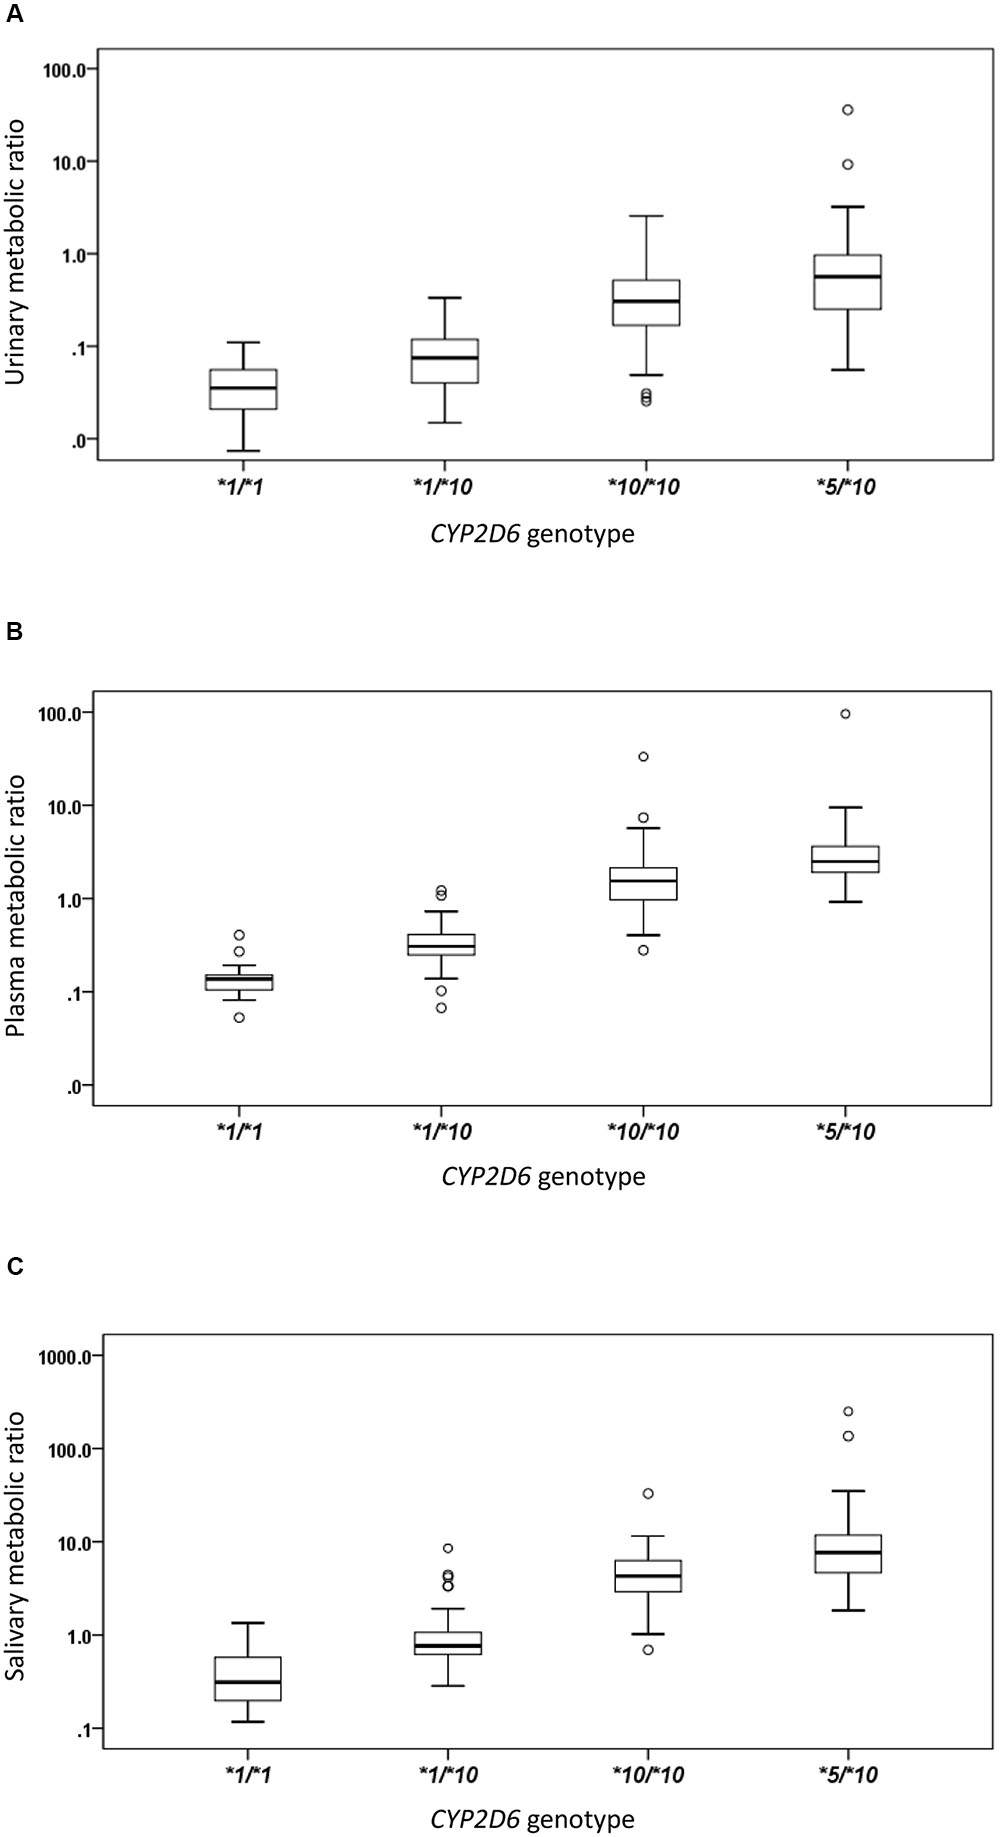
FIGURE 1. The box plots of metabolic ratio (MR) in the wild type (CYP2D6∗1/∗1) and the three CYP2D6∗10 allele relevant genotypes in 235 healthy Chinese subjects. The y-axis is logarithmic and the ratio is based on the MRDM/DX. (A) Urinary MR; (B) plasma MR; (C) salivary MR. Box plot explanation: upper horizontal line of box, 75th percentile; lower horizontal line of box, 25th percentile; horizontal bar within box, median; upper horizontal bar outside box, 95th percentile; lower horizontal bar outside box, 5th percentile. Circles represent outliers.
Correlations among Urinary, Plasma, and Salivary MR
A statistically significant correlation was found between urinary MR and plasma MR. The Spearman’s correlation coefficient measuring the statistical dependence between the ranking of two variables was 0.780 (P < 0.001) (Figure 2A). A statistically significant correlation was also found between urinary MR and salivary MR and the Spearman’s correlation coefficient was 0.717 (P < 0.001) (Figure 2B). Similarly, the correlation between plasma MR and salivary MR was also statistically significant and the Spearman’s correlation coefficient was 0.903 (P < 0.001) (Figure 2C).
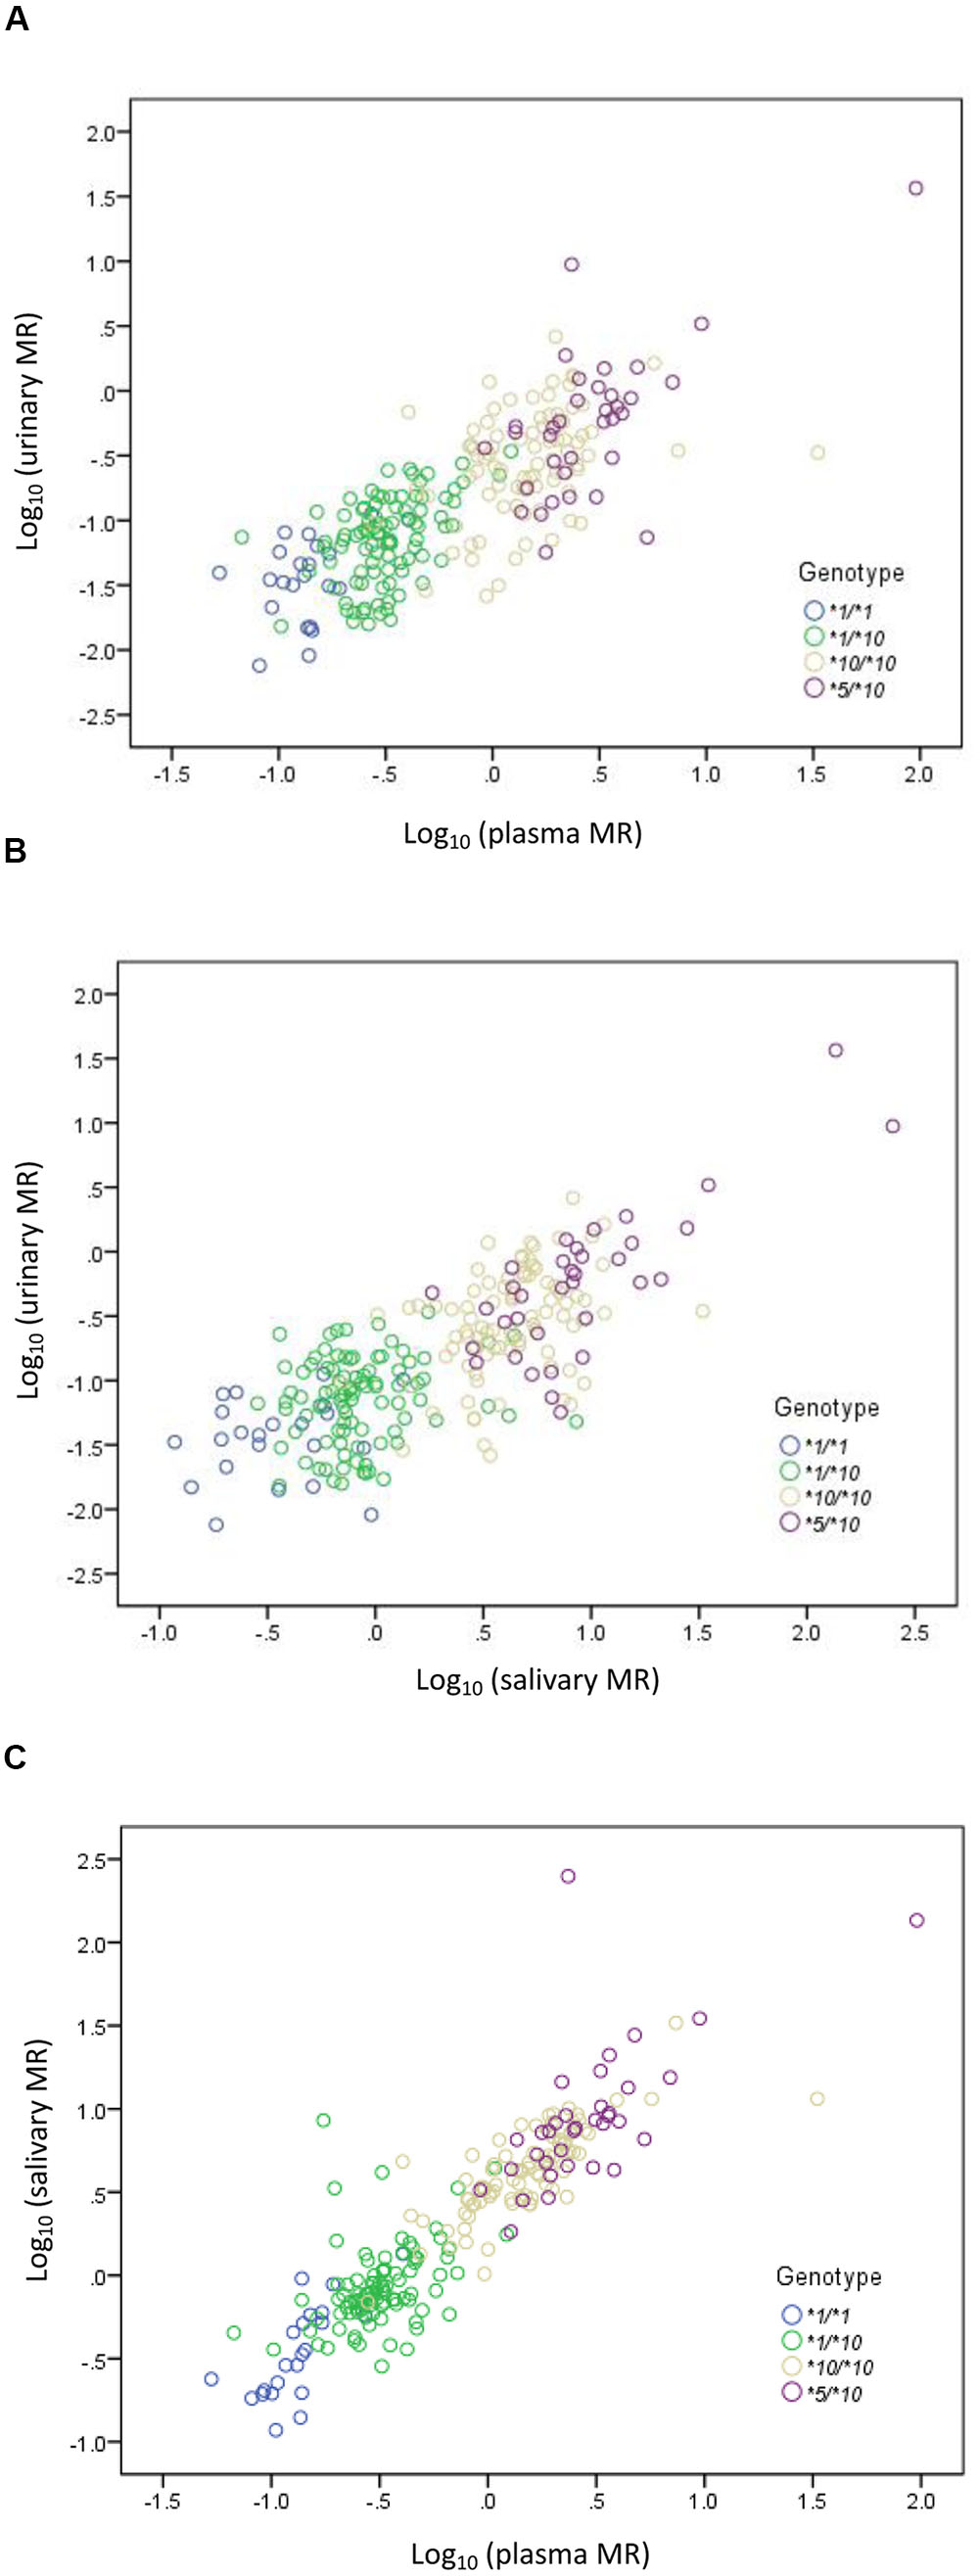
FIGURE 2. Correlations among urinary, plasma, and salivary MRs in CYP2D6∗1/∗1, ∗1/∗10, ∗10/∗10, and ∗5/∗10 genotypes, respectively, in double logarithmic coordinates. (A) Correlation between urinary MR and plasma MR (Spearman’s correlation coefficient = 0.780 with P < 0.001); (B) correlation between urinary MR and salivary MR (Spearman’s correlation coefficient = 0.717 with P < 0.001); (C) correlation between plasma MR and salivary MR (Spearman’s correlation coefficient = 0.903 with P < 0.001).
Discussion
The CYP2D6∗10 variant is the most frequent allele in Asians and a large sample study revealed that CYP2D6∗10 is the most common allele (42.6%) in the Chinese Han population, followed by CYP2D6∗1 (26.5%) (Qian et al., 2013). It is well-known that CYP2D6∗10 is a reduced function allele and it decreases the enzyme activity of CYP2D6. The present study was conducted to investigate the impact of the CYP2D6∗10 allele on CYP2D6 metabolic activity. To exclude confounding factors, we defined CYP2D6∗1 as the only full functional allele and CYP2D6∗5 as the only non-functional allele. Both alleles were used as controls to investigate the impact of CYP2D6∗10 in different allelic combinations.
The urinary, plasma, or salivary MR values increased successively in subjects with CYP2D6∗1/∗1, ∗1/∗10, ∗10/∗10, or ∗5/∗10 (all P < 0.001). According to the Clinical Pharmacogenetics Implementation Consortium (CPIC) guideline, subjects with CYP2D6∗1/∗1, ∗1/∗10, and ∗10/∗10 are classified as NMs, and subjects with CYP2D6∗5/∗10 are classified as IMs (Hicks et al., 2016). In the present study, MR values in IMs were significantly higher than those in NMs as expected, regardless of the urinary, plasma, or salivary phenotyping method used (all P < 0.001). In the NM group, however, a large diversity in MR values was still observed. Although CYP2D6∗1/∗10 and CYP2D6∗10/∗10 were both classified as NMs similar to the designation given to CYP2D6∗1/∗1, the enzyme activity for subjects carrying CYP2D6∗10 differed to a great extent from the wild type due to the reduced function allele. Both CYP2D6∗1/∗10 and ∗10/∗10 had predicted different enzyme activities as compared with ∗1/∗1. Regardless of which phenotyping method was used, the MRs of subjects with CYP2D6∗10/∗10 were significantly higher than those of subjects with CYP2D6∗1/∗10 and CYP2D6∗1/∗1, respectively, and the MRs of subjects with CYP2D6∗1/∗10 were significantly higher than those of subjects with CYP2D6∗1/∗1 (all P < 0.05). Homozygous CYP2D6∗10/∗10 could decrease the CYP2D6 enzyme activity further than heterozygous CYP2D6∗1/∗10. The mean MR was about 4.6-fold higher in subjects with CYP2D6∗10/∗10 than in subjects with CYP2D6∗1/∗10 based on the urinary phenotyping method, and the corresponding folds were 5.8 for the plasma method and 4.8 for the salivary method. In comparison, the mean MR was about 4.7-, 2.8-, and 3.9-fold higher in subjects with CYP2D6∗5/∗10 than in subjects with CYP2D6∗10/∗10 based on urinary, plasma, and salivary phenotyping methods, respectively. The difference between CYP2D6∗1/∗10 and ∗10/∗10 was comparable or even larger than that between CYP2D6∗10/∗10 and ∗5/∗10 and can be seen in Figure 1. Large overlaps were observed between CYP2D6∗10/∗10 and ∗5/∗10 as shown in Figure 2. Therefore, the NM group calls for a more detailed classification as the large diversity in the NM group could result in an inaccurate prediction of CYP2D6 enzyme activity. As discussed previously, the CYP2D6∗10/∗10 would be more appropriately classified as IM than NM. Our additional analysis showed that two subjects with CYP2D6∗5/∗5 had a plasma MR ratio > 70 suggesting that the ∗5/∗10 individuals are distinct from PMs.
Gaedigk et al. (2008) introduced an AS system for CYP2D6. It has since gained acceptance among the scientific community and has been adopted by CPIC (Hicks et al., 2016). This system, in essence, assigns each allele a value that approximates its function, and the sum of the values assigned to each allele is the final AS. Functional alleles with activity levels comparable to the CYP2D6∗1 reference allele are given a value of 1 (Gaedigk et al., 2008). Reduced function and non-functional alleles receive values of 0.5 and 0, respectively (Gaedigk et al., 2008). Gene duplications score double the value given for their single counterparts (Gaedigk et al., 2008). To date, few studies have evaluated the AS system in large Asian populations. The present study with a large sample size indicated that the AS system could benefit from further classification of the NM group, e.g., to distinguish CYP2D6∗1/∗10 and ∗10/∗10. When classifying the subjects using the AS system, the urinary, plasma, or salivary MR values increased successively from a score of 2 to a score of 0.5 (all P < 0.001). The AS system could further classify the NM group into AS 2, 1.5, and 1. On the other hand, the diversity of enzyme activity was observed when evaluating the AS system in Caucasian populations. Hertz et al. (2015) performed a linear regression model and found that the relative activities of a UM, IM, and PM alleles were 0.85, 0.67, and 0.52, respectively, when setting the activity of CYP2D6∗1 at 1.0. The ∗2 and ∗35 alleles were also assessed as NM alleles. The ∗2 allele had an estimated scaled activity of 0.63 while the ∗35 allele had an activity of 1.03 (Hertz et al., 2015). The relatively large range of activity observed among CYP2D6 alleles was not unexpected given the wide range enzyme activities of CYP2D6. The current systems for translating CYP2D6 genotypes into phenotypes are not optimally calibrated (Hertz et al., 2015). The AS system is an adequate classification method although it would be justified to revise the ASs for different alleles for a more accurate prediction of enzyme activities from CYP2D6 genotypes. Tamoxifen was used as the probe drug in Hertz et al.’s (2015) study and there might be substrate-specific differences among alleles toward different substrates. Other covariates like age and ethnicity should also be taken into account when exploring the extent of variation among phenotypes using genotype information.
Urine sample collection for 8 h is specific and a demanding process for test patients. A more lenient urine sample collection for 4 h or overnight post-drug administration has also been used in clinical studies to alleviate such a strict demand time (Chladek et al., 2000). DX could further conjugate with glucuronide (Duche et al., 1993), so the generated DX was the sum of conjugated and unconjugated DX. Several studies have compared the urinary MRs of β-glucuronidase-treated samples with those of untreated samples and found that the DM/free-DX ratio from untreated samples correlated well with the DM/total-DX ratio, although the absolute values of the two ratios may differ (Duche et al., 1993). Therefore, the DM/free-DX ratio can also be used to determine the phenotype. Urinary MR based on free compounds has been developed for phenotyping (Yeh et al., 2003). Plasma and salivary phenotyping methods have also been developed for simple and robust CYP2D6 phenotyping (Frank et al., 2007). Our previous studies indicate that MR from single-point plasma from 1 to 30 h after a single dose of DM could predict the MR from AUC well and could be used as the CYP2D6 phenotyping method for NMs, IMs, and PMs (Chen et al., 2016a,b). In consideration of clinical convenience and the urinary sample collection intervals, plasma and saliva samples were taken 3 h post-administration while urinary samples were collected at 0–3 h intervals. Few studies have explored the correlations among urinary, plasma, and salivary phenotyping methods simultaneously in large sample sizes. In the present study, statistically significant pair-wise correlations were found between any two of the three phenotyping methods (P < 0.001). Urinary MR appeared to have a smaller correlation coefficient than plasma and salivary MRs. This trend was also seen in previous studies (Hu et al., 1998; Chen et al., 2016b) and may be due to the fact that plasma and salivary MRs were collected from a single time point while urine samples were collected over a range of time. The large sample size confirmed that urinary, plasma, and salivary MRs were highly correlated and alternative phenotyping methods could be used for clinical convenience. This result was consistent with data previously reported from small samples (Chladek et al., 2000; Frank et al., 2007; Chen et al., 2016a,b). The 8-h urinary phenotyping method is used widely around the world. In clinical practice, this procedure may work well for inpatients but is inconvenient for outpatients who have to deliver the urinary samples at a later time. Plasma and salivary methods are good for saving time although plasma samples may be inconvenient to collect. The salivary method is especially convenient for sample collections in children.
The DM/free-DX ratio and DM/total-DX ratio could both be used for CYP2D6 phenotyping although the absolute values of the two ratios may differ. Only unconjugated DX was found in saliva, and therefore the DM/free-DX ratio was used for all three sample types in this study. The widely accepted anti-mode of DM/total-DX of 0.3 used to identify PMs was not applicable here. To exclude confounding factors, a strict definition of the standard full functional allele (CYP2D6∗1) caused the wild type number with two full functional alleles to be relatively small in the present study. The frequency of PM is very low (0–2%) in the Chinese population (Gaedigk, 2013) and therefore the MR values of CYP2D6∗5/∗5 were not evaluated here. Large overlaps of MR values between adjacent genotypes were clearly observed and created an insurmountable problem when predicting phenotypes from CYP2D6 genotypes. There were not convincible explanations for some outliers observed in the present study resulting in difficulty applying genotype information to individual patients. It was difficult to know if an individual carrying the variant of interest will display the predicted phenotype (Leeder and Gaedigk, 2014).
Conclusion
The urinary, plasma, or salivary MR values increased successively in subjects with CYP2D6∗1/∗1, ∗1/∗10, ∗10/∗10, or ∗5/∗10 genotypes (all P < 0.001). In the NM group, homozygous CYP2D6∗10/∗10 showed a greater decrease in CYP2D6 enzyme activity than the heterozygous CYP2D6∗1/∗10 genotype. The NM group calls for a more detailed classification due to its broad range of MR values. The AS system has shown to be a more accurate measurement for enzyme activity prediction compared to grouping a number of genotypes into a single phenotype group. Urinary, plasma, and salivary MRs were highly correlated and the latter two could be used as alternative phenotyping methods for clinical convenience.
Author Contributions
RC designed and preformed the study. XZ analyzed the samples. PH designed the study.
Funding
This work was supported by Chinese National Natural Science Foundation (81503162) and a grant from the Beijing Key Laboratory (Z151100001615061).
Conflict of Interest Statement
The authors declare that the research was conducted in the absence of any commercial or financial relationships that could be construed as a potential conflict of interest.
Acknowledgment
We acknowledge all volunteers and working staff who have contributed to the study.
Supplementary Material
The Supplementary Material for this article can be found online at: http://journal.frontiersin.org/article/10.3389/fphar.2017.00239/full#supplementary-material
Footnotes
References
Caudle, K. E., and Dunnenberger, H. M. (2017). Standardizing terms for clinical pharmacogenetic test results: consensus terms from the Clinical Pharmacogenetics Implementation Consortium (CPIC). Genet. Med. 19, 215–223. doi: 10.1038/gim.2016.87
Chen, R., Rostami-Hodjegan, A., Wang, H., Berk, D., Shi, J., and Hu, P. (2016a). Application of a physiologically based pharmacokinetic model for the evaluation of single-point plasma phenotyping method of CYP2D6. Eur. J. Pharm. Sci. 92, 131–136. doi: 10.1016/j.ejps.2016.07.001
Chen, R., Wang, H., Shi, J., and Hu, P. (2016b). Alternative methods for CYP2D6 phenotyping: comparison of dextromethorphan metabolic ratios from AUC, single point plasma, and urine. Int. J. Clin. Pharmacol. Ther. 54, 330–336. doi: 10.5414/CP202387
Chladek, J., Zimova, G., Beranek, M., and Martinkova, J. (2000). In-vivo indices of CYP2D6 activity: comparison of dextromethorphan metabolic ratios in 4-h urine and 3-h plasma. Eur. J. Clin. Pharmacol. 56, 651–657. doi: 10.1007/s002280000218
Duché, J. C., Quérol-Ferrer, V., Barré, J., Mésangeau, M., and Tillement, J. P. (1993). Dextromethorphan O-demethylation and dextrorphan glucuronidation in a French population. Int. J. Clin. Pharmacol. Ther. Toxicol. 31, 392–398.
Frank, D., Jaehde, U., and Fuhr, U. (2007). Evaluation of probe drugs and pharmacokinetic metrics for CYP2D6 phenotyping. Eur. J. Clin. Pharmacol. 63, 321–333. doi: 10.1007/s00228-006-0250-8
Gaedigk, A. (2013). Complexities of CYP2D6 gene analysis and interpretation. Int. Rev. Psychiatry 25, 534–553. doi: 10.3109/09540261.2013.825581
Gaedigk, A., Sangkuhl, K., Whirl-Carrillo, M., Klein, T., and Leeder, J. S. (2017). Prediction of CYP2D6 phenotype from genotype across world populations. Genet. Med. 19, 69–76. doi: 10.1038/gim.2016.80
Gaedigk, A., Simon, S., Pearce, R., Bradford, L., Kennedy, M., and Leeder, J. (2008). The CYP2D6 activity score: translating genotype information into a qualitative measure of phenotype. Clin. Pharmacol. Ther. 83, 234–242. doi: 10.1038/sj.clpt.6100406
Hersberger, M., Marti-Jaun, J., Rentsch, K., and Hanseler, E. (2000). Rapid detection of the CYP2D6∗3, CYP2D6∗4, and CYP2D6∗6 alleles by tetra-primer PCR and of the CYP2D6∗5 allele by multiplex long PCR. Clin. Chem. 46, 1072–1077.
Hertz, D. L., Snavely, A. C., Mcleod, H. L., Walko, C. M., Ibrahim, J. G., Anderson, S., et al. (2015). In vivo assessment of the metabolic activity of CYP2D6 diplotypes and alleles. Br. J. Clin. Pharmacol. 80, 1122–1130. doi: 10.1111/bcp.12665
Hicks, J. K., Sangkuhl, K., Swen, J. J., Ellingrod, V. L., Müller, D. J., Shimoda, K., et al. (2016). Clinical Pharmacogenetics Implementation Consortium guideline (CPIC) for CYP2D6 and CYP2C19 genotypes and dosing of tricyclic antidepressants: 2016 Update. Clin. Pharmacol. Ther. doi: 10.1002/cpt.597 [Epub ahead of print].
Hou, Z. Y., Pickle, L. W., Meyer, P. S., and Woosley, R. L. (1991). Salivary analysis for determination of dextromethorphan metabolic phenotype. Clin. Pharmacol. Ther. 49, 410–419. doi: 10.1038/clpt.1991.48
Hu, O. Y., Tang, H. S., Lane, H. Y., Chang, W. H., and Hu, T. M. (1998). Novel single-point plasma or saliva dextromethorphan method for determining CYP2D6 activity. J. Pharmacol. Exp. Ther. 285, 955–960.
Ito, T., Kato, M., Chiba, K., Okazaki, O., and Sugiyama, Y. (2010). Estimation of the interindividual variability of cytochrome 2D6 activity from urinary metabolic ratios in the literature. Drug Metab. Pharmacokinet. 25, 243–253. doi: 10.2133/dmpk.25.243
Kitada, M. (2002). Genetic polymorphism of cytochrome P450 enzymes in Asian populations: focus on CYP2D6. Int. J. Clin. Pharmacol. Res. 23, 31–35.
Leeder, J. S., and Gaedigk, A. (2014). CYP2D6 and pharmacogenomics: where does future research need to focus? Part 2: clinical aspects. Pharmacogenomics 15, 1055–1058. doi: 10.2217/pgs.14.27
Lötsch, J., Rohrbacher, M., Schmidt, H., Doehring, A., Brockmöller, J., and Geisslinger, G. (2009). Can extremely low or high morphine formation from codeine be predicted prior to therapy initiation? Pain 144, 119–124. doi: 10.1016/j.pain.2009.03.023
Løvlie, R., Daly, A. K., Molven, A., Idle, J. R., and Steen, V. M. (1996). Ultrarapid metabolizers of debrisoquine: characterization and PCR-based detection of alleles with duplication of the CYP2D6 gene. FEBS Lett. 392, 30–34. doi: 10.1016/0014-5793(96)00779-X
Murphy, E., and McMahon, F. J. (2013). Pharmacogenetics of antidepressants, mood stabilizers, and antipsychotics in diverse human populations. Discov. Med. 16, 113–122.
O’mathúna, B., Farré, M., Rostami-Hodjegan, A., Yang, J., Cuyàs, E., Torrens, M., et al. (2008). The consequences of 3, 4-methylenedioxymethamphetamine induced CYP2D6 inhibition in humans. J. Clin. Psychopharmacol. 28, 523–529. doi: 10.1097/JCP.0b013e318184ff6e
Qian, J. C., Xu, X. M., Hu, G. X., Dai, D. P., Xu, R. A., Hu, L. M., et al. (2013). Genetic variations of human CYP2D6 in the Chinese Han population. Pharmacogenomics 14, 1731–1743. doi: 10.2217/pgs.13.160
Teh, L. K., and Bertilsson, L. (2012). Pharmacogenomics of CYP2D6: molecular genetics, interethnic differences and clinical importance. Drug Metab. Pharmacokinet. 27, 55–67. doi: 10.2133/dmpk.DMPK-11-RV-121
Yeh, G. C., Tao, P. L., Ho, H. O., Lee, Y. J., Chen, J. Y., and Sheu, M. T. (2003). Analysis of pharmacokinetic parameters for assessment of dextromethorphan metabolic phenotypes. J. Biomed. Sci. 10, 552–564. doi: 10.1159/000072383
Zanger, U. M., and Schwab, M. (2013). Cytochrome P450 enzymes in drug metabolism: regulation of gene expression, enzyme activities, and impact of genetic variation. Pharmacol. Ther. 138, 103–141. doi: 10.1016/j.pharmthera.2012.12.007
Zhou, S. F. (2009a). Polymorphism of human cytochrome P450 2D6 and its clinical significance: part I. Clin. Pharmacokinet. 48, 689–723. doi: 10.2165/11318030-000000000-00000
Keywords: CYP2D6∗10, phenotyping method, metabolic ratio, polymorphism, genotype
Citation: Chen R, Zheng X and Hu P (2017) CYP2D6 Phenotyping Using Urine, Plasma, and Saliva Metabolic Ratios to Assess the Impact of CYP2D6∗10 on Interindividual Variation in a Chinese Population. Front. Pharmacol. 8:239. doi: 10.3389/fphar.2017.00239
Received: 21 February 2017; Accepted: 18 April 2017;
Published: 02 May 2017.
Edited by:
Andrea Gaedigk, Children’s Mercy Hospital, USAReviewed by:
Daniel Hertz, University of Michigan Health System, USAMing Ta Michael Lee, Institute of Biomedical Sciences Academia Sinica, Taiwan
Copyright © 2017 Chen, Zheng and Hu. This is an open-access article distributed under the terms of the Creative Commons Attribution License (CC BY). The use, distribution or reproduction in other forums is permitted, provided the original author(s) or licensor are credited and that the original publication in this journal is cited, in accordance with accepted academic practice. No use, distribution or reproduction is permitted which does not comply with these terms.
*Correspondence: Pei Hu, peihu_pumc@126.com