 Martine Rigault
95% of researchers rate our articles as excellent or good
Learn more about the work of our research integrity team to safeguard the quality of each article we publish.
Find out more
ORIGINAL RESEARCH article
Front. Plant Sci. , 28 March 2017
Sec. Plant Pathogen Interactions
Volume 8 - 2017 | https://doi.org/10.3389/fpls.2017.00394
This article is part of the Research Topic Hide-and-seek: Which Impact of Pathogen Evolutionary Dynamics and Plant Natural Variability on Effector-Host Target Showdown? View all 19 articles
Among the most devastating bacterial diseases of plants, soft rot provoked by Dickeya spp. cause crop yield losses on a large range of species with potato being the most economically important. The use of antibiotics being prohibited in most countries in the field, identifying tolerance genes is expected to be one of the most effective alternate disease control approaches. A prerequisite for the identification of tolerance genes is to develop robust disease quantification methods and to identify tolerant plant genotypes. In this work, we investigate the feasibility of the exploitation of Arabidopsis thaliana natural variation to find tolerant genotypes and to develop robust quantification methods. We compared different quantification methods that score either symptom development or bacterial populations in planta. An easy to set up and reliable bacterial quantification method based on qPCR amplification of bacterial DNA was validated. This study demonstrates that it is possible to conduct a robust phenotyping of soft rot disease, and that Arabidopsis natural accessions are a relevant source of tolerance genes.
Plants are exposed to biotic and abiotic stresses that lead to important crop yield losses. Considerable advances have been made recently that allow a better understanding of the mechanisms underlying plant–pathogen interactions which determine disease severity at the end. On the one hand, pathogens deploy various virulence systems to invade the plant tissues either by killing cells or by suppressing plant defenses. On the other hand, plants use different defense strategies to counteract this invasion (Dangl et al., 2013). Characterizing the main processes involved in virulence on the pathogen side and involved in defense on the plant side requires a reliable system to score disease severity parameters (Brouwer et al., 2003; Trontin et al., 2011). Indeed, new sequencing technologies and phenotyping open the way to investigate plant genetic determinants of resistance/tolerance to pathogens, but strictly depend on robust quantification methods (Mutka and Bart, 2015). Quantification of disease can rely on different parameters that vary according to the pathogen considered. In most cases, symptom severity is considered as a good indicator of the pathogen’s impact on its host during disease. Another parameter that can be considered, is the in planta pathogen growth or pathogen burden (Brouwer et al., 2003). Monitoring the pathogen burden allows a better understanding of the mechanisms controlling disease impact on host. Indeed, plants can be tolerant or resistant to a certain pathogen. Resistance consists of reduced disease severity due to pathogen growth restriction, and relies on specific recognition of pathogen strains via the product of a resistance (R) gene. In the majority of the cases, R genes contain two conserved domains: nucleotide binding domain (NB) and a leucine rich repeat domain (LRR) (St Clair, 2010). Tolerance consists in limiting detrimental effects of disease without a strong reduction of pathogen burden. The underlying mechanisms of tolerance are not specific and mobilize different immunity processes. The outcomes of tolerance or resistance on pathogen populations are different. Resistance can lead to pathogen eradication, but increases the risks of emergence of new hyper-virulent strains. In contrast, tolerance does not reduce pathogen populations and does not favor arms race between hosts and pathogens. Thus, combining quantification of disease severity and pathogen populations in planta is crucial.
Bacterial pathogens have the peculiarity of being difficult to control. Indeed, antibiotic use in agriculture is prohibited in most European countries, due to the risk of resistance emergence in the field that could be transferred to clinically important bacteria isolates (Williams-Nguyen et al., 2016). Among the most devastating bacterial diseases, soft rot causes crop yield losses in a large range of species with potato being the most economically important (Czajkowski et al., 2011). Soft rot can be caused by Dickeya species or Pectobacterium species (Toth et al., 2003; Toth et al., 2011). Bacteria survive in water or in plant organs like potato tubers and infect growing plants in the field (Reverchon et al., 2016). Bacteria multiply on the plant surface then enter apoplastic spaces where they multiply. Typical symptoms are maceration and rotting of infected tissues mainly caused by the massive production of plant cell wall degrading enzymes (PCWDE) that lead to tissue disorganization and then death. Cell wall degradation liberates sugars that are used as carbon source for bacterial cells (Reverchon and Nasser, 2013). The process by which Dickeya species infect their hosts corresponds to what is generally described as a necrotrophic lifestyle (van Kan, 2006). Production of these enzymes is tightly controlled at the transcriptional and post transcriptional level in response to environmental factors. Because control of soft rot species is complex, it is a prerequisite to develop a robust and reliable system to score the disease parameters (Czajkowski et al., 2011). For instance, breeding for resistance is hampered by the difficulty to score symptoms and then to correlate this with the bacterial population.
Very few data about plant defense against Dickeya dadantii are available (Reverchon et al., 2016). Accumulation of reactive oxygen species is involved in reducing D. dadantii infection on Saintpaulia ionantha and Arabidopsis (Santos et al., 2001; Reverchon et al., 2002; Fagard et al., 2007). Jasmonic acid is involved in bacterial attraction and defense (Fagard et al., 2007; Antunez-Lamas et al., 2009). Iron homeostasis plays a pivotal role in Arabidopsis defense against D. dadantii (Aznar et al., 2014, 2015; Nam Phuong et al., 2012). In order to gain insight into the plant defense arsenal effective against Dickeya spp. and to identify tolerance genes, genetic screens can be very powerful. To be able to set up genetic screens, it is necessary to find differentially susceptible plant genotypes by scoring robust quantitative traits. The use of Arabidopsis as a model plant to accelerate discovery of tolerance or resistance genes in crops proved to be efficient in several instances (Piquerez et al., 2014). The rationale of using the model plant Arabidopsis rather than potato is the availability of genetic tools such as fully sequenced genotypes, mutant libraries allowing a rapid identification of candidate genes. In this work, we investigated the feasibility of the exploitation of natural variation in Arabidopsis thaliana L. (Arabidopsis) to highlight differential susceptibilities by comparing different quantitative traits. In addition, Arabidopsis is a host for D. dadantii displaying a compatible interaction with spreading symptoms (Fagard et al., 2007). In potato, candidate genes involved in tolerance QTLs to Phytophthora infestans were found to be involved in tolerance to the oomycete after expression in Arabidopsis (Pajerowska-Mukhtar et al., 2008) indicating that common mechanisms of tolerance do exist in Arabidopsis and potato.
The most studied disease quantitative trait in genetic studies is the visible symptom. Another important trait, is the in planta pathogen burden. In planta bacterial population estimation by classical counting of bacterial colonies is tedious and time-consuming. To improve bacterial population estimation in planta, we designed primers to PCR-amplify bacterial DNA from infected tissues. We have determined the correlation between several disease parameters in different plant genotypes harboring different tolerance levels to D. dadantii.
Wild-type accessions of Arabidopsis Bur-0, Can-0, Col-0, Cvi-0, Edi-0, Ge-0, Oy-0 and Sakata were obtained from the Versailles Arabidopsis Stock Center (INRA Versailles France1). Arabidopsis seeds were stratified by incubation for 2 days at 4°C in 0.01% agarose in water (w/v) in the dark, then, were sown in sand. Homogeneous germination occurred 2 days after sowing. Three times per week, the pots were watered (by immersion of their base) in a mineral solution containing 2 mM nitrate or 10 mM nitrate (Supplementary Table 1). The pH of the watering solutions remained between 5.1 and 5.5 (Lemaitre et al., 2008). During the first 2 weeks, they were watered with the 2 mM nitrate containing solution to avoid intoxication with excess nitrate. The four following weeks, they were watered with a solution containing 10 mM nitrate (Supplementary Table 1). Plants were grown under short days (8-h light/16-h dark) with 21°C temperature and 70% relative humidity. Six- week-old plants were heavily watered and covered with a transparent plastic 16 h before inoculation. The cover was kept in place throughout the assay to maintain high-humidity conditions.
The experiments were performed with the D. dadantii 3937 strain constitutively expressing a gfp fusion and resistant to gentamycin (Asselbergh et al., 2008; Chapelle et al., 2015). Bacteria were grown in Luria-Bertani medium supplemented with 10 μg/mL gentamycin (Sigma). For plant inoculations, a small hole was made with a needle in the leaf, and then, 5 μL of a bacterial suspension at a density of 1 × 10⁸ Colony Forming Unit/mL (CFU) made up in 50 mM potassium phosphate buffer (pH 7) was spotted on the top of the hole. In each experiment, six plants were inoculated for each genotype and three leaves by plant were inoculated. In order to avoid bias linked to symptom severity, leaves were randomly chosen to be processed by each method of bacterial quantification (CFU counting or qPCR).
Photographs of infected plants were taken for each individual leaf. The surface of the lesions were analyzed using the open source software ImageJ https://imagej.nih.gov/ij/.
To monitor in planta viable bacterial populations, infected leaves were individually harvested in 500 μL 0.9% NaCl. After grinding, the suspension was diluted following a 10-fold dilution series up-to 10-6 or 10-7 fold. Ten microliters droplets were then plated out on LB medium containing 10 μg/mL gentamycin following the drop-plate method (Herigstad et al., 2001). For each dilution in the series, two 10-μL droplets were placed on LB plates and incubated at 28°C for 48 h. CFUs were counted on plated droplets that contained between 4 and 40 colonies and the number of CFU per leaf was calculated.
Bacterial DNA was extracted from pure D. dadantii liquid cultures. An overnight LB grown bacterial culture was pelleted by centrifugation. The pellet was suspended in TE(Tris-EDTA) buffer Proteinase K and SDS were added to a final concentration of 100 μg/mL and 0.5%, respectively. The extract was thoroughly mixed and incubated at 37°C for 1 h, then NaCl was added to a final concentration of 0.83 M. To precipitate cell debris, cetyltrimethylammonium bromide (CTAB)/NaCl (10% CTAB, 0.7 M NaCl) was added to reach the final proportion of 8/70th of the volume, then incubated 10 min at 65°C. An equal volume of chloroform/isoamylic alcohol was added, followed by mixing and spinning for 5 min. The supernatant was recovered and subjected to a phenol/chloroform/isoamylic alchohol extraction followed by a precipitation in isopropanol.
After harvesting, infected leaves were individually frozen in liquid nitrogen then ground. DNA extraction was performed using the CTAB extraction method. In each tube containing one ground leaf, 400 μL of CTAB buffer (2% cetyltrimethyl-ammonium bromide, 1% polyvinylpyrrolidone, 100 mM Tris-HCl, 1.4 M NaCl, 20 mM EDTA, 0.2% β-mercapto-ethanol) was added. The samples were then incubated 30 min at 60°C. Four hundred microliters of chloroform: isoamylic alcohol (24:1) were then added. The samples were centrifuged for 10 min at 7000 rpm in a micro-centrifuge and 300 μL of the supernatant were harvested, then DNA was precipitated by adding 300 μL of isopropanol. After centrifuging 15 min at 7000 rpm, the pellet was recovered and washed with 70% ethanol then DNA was dissolved in 30 μL of TE buffer.
DNA from D. dadantii bacterial cultures was used as a standard. A standard curve was obtained by a fivefold serial dilution starting from a concentration of 5 ng/μL. Amplifications of DNA from infected leaves was performed on a 1/50th of the purified DNA (see section above). Primers used are: PelA-Forward: 5′-CCGCAACGTCTACATCCAAA-3′; PelA-Reverse: 5′- CGTCGCCTTTTTCGTAATGC-3′; RpoB-Forward: 5′- AATCGAAGGTTCCGGGATTC -3′; RpoB-Reverse: 5′- GCCGTTACGGATATCGATGAG -3′. Two and a half microliters of the 1/50th diluted DNA was subjected to real time qPCR using SYBR Green PCR Mastermix (Eurogentec) and gene-specific primers. Absolute DNA quantities were obtained based on the standard curve of pure bacterial DNA. The DNA content in each leaf was converted into Bacterial cell EqDNA according to Supplementary Table 2 formulas.
Visual symptom scoring is usually performed based on a disease severity scale or based on surface measurement. We compared these two methods for the quantification of visible symptoms caused by D. dadantii on different Arabidopsis accessions. The first method consists in attributing a disease severity index (DSI) to each symptom based on the scale indicated in Figure 1A as previously described (Fagard et al., 2007). The second method consists in measuring the surface of the lesion hereafter designated as “lesion surface” (LS).
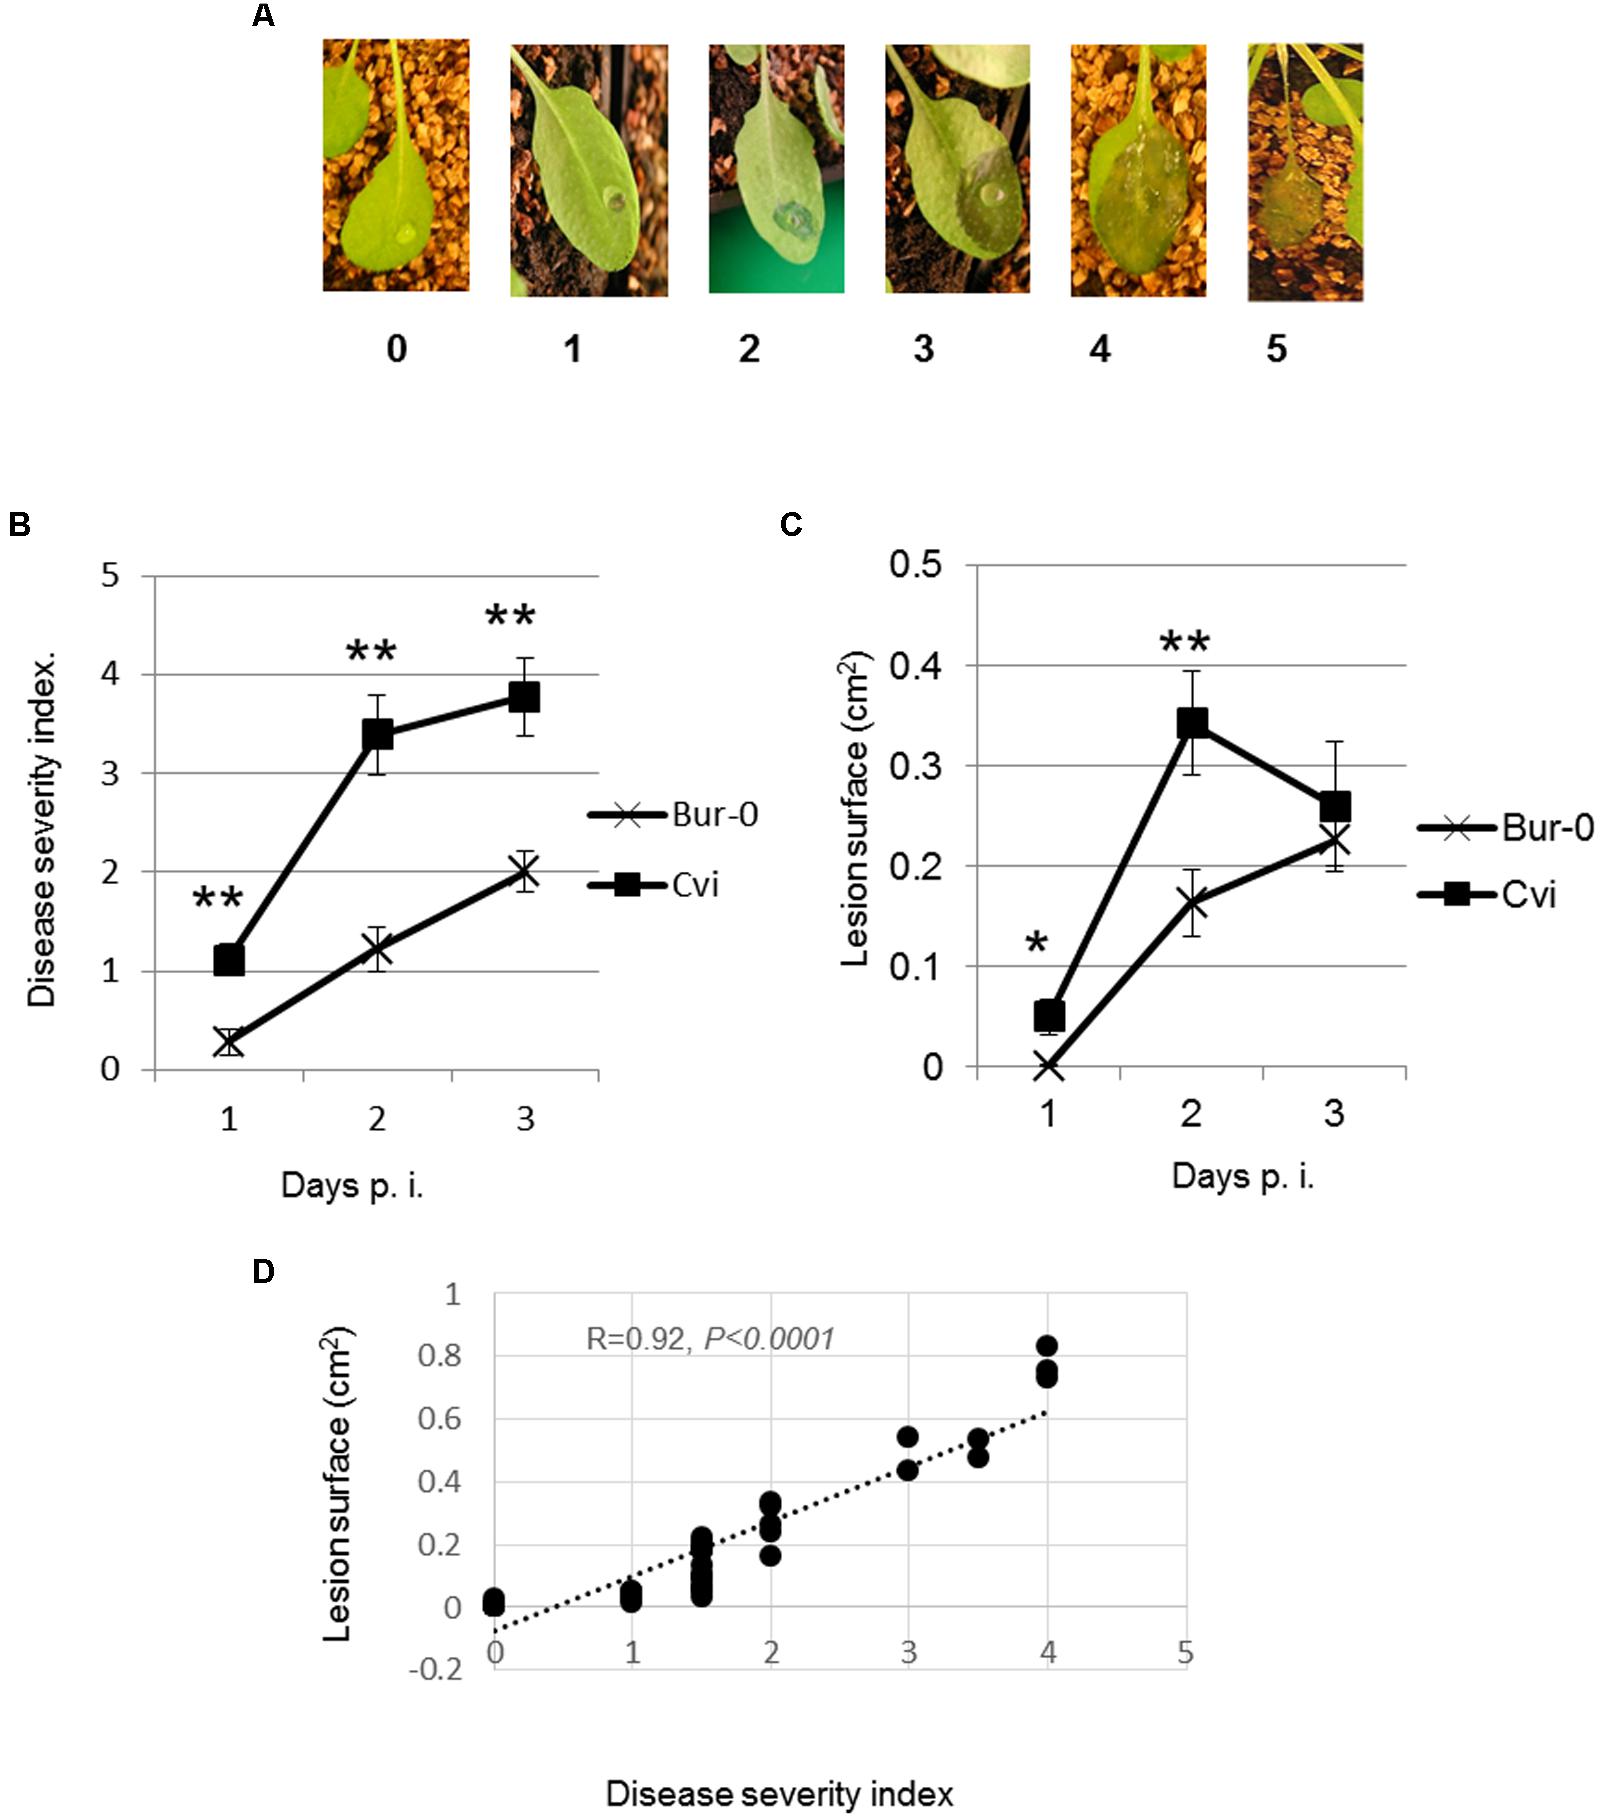
FIGURE 1. Correlation between macerated surface and disease severity on Arabidopsis leaves infected with Dickeya dadantii. Leaves were inoculated with 5 μL of bacterial suspension. (A) Image representing stages of the disease severity index scale. (B) Leaf symptoms were scored according to the scale of 0–5 (Fagard et al., 2007). (C) Photographs were taken at indicated times after inoculation. Diseased areas were measured using the computer program ImageJ. (D) Correlation between DSI and LS 48 h p.i. Experiments were repeated at least three times. Data from one representative experiment are shown. Error bars: standard deviation. Mean were compared using Student’s T-test. n = 10–18. ∗p-value < 0.05, ∗∗p-value < 0.001.
To minimize environmental effects potentially due to soil composition, seedlings were grown on sand and watered with a mineral solution as indicated. Leaves of 6-week-old seedlings were inoculated by making a hole with a needle followed by the application of 5 μL of a bacterial suspension to ensure that each leaf was inoculated with the same number of bacteria. D. dadantii infection causes tissue maceration visible 24–48 h post infection (24–48 h p.i.). The maceration spreads starting from the hole. Symptoms are scored during the 1st days (here 3 days) using the 0–5 DSI scale (Figure 1A). To compare these two procedures, photographs were taken at different time points after inoculation, areas of maceration were measured by computer-assisted analysis of the images. In order to compare the two methods, we chose Arabidopsis accessions displaying different sensitivities to infection based on symptom scoring (data not shown). These accessions are Bur-0 displaying a reduced sensitivity and Cvi-0 displaying a high sensitivity.
The progression curves of LS and DSI indicated that the relative susceptibilities of the two accessions were the same for both symptom-scoring methods, Bur-0 being the most tolerant, Cvi-0 being the most susceptible. However, significant differences were observed between DSI and LS after 24 and 48 h following infection. Indeed, the DSI progression curve shows a regular increase over 3 days (Figure 1B) while the LS started to diminish in Cvi-0 at 48 h p.i. (Figure 1C). This reduction could be attributed to the fact that severe maceration causes shrinking and folding of the leaf tissue. Thus, at later infection stages, LS may not correctly reflect the severity of symptoms. We concluded that the best time to highlight different sensitivity levels is at 48 h p.i. We determined the degree of correlation between both quantification methods (DSI and LS). Statistically significant linear correlation was obtained between LS and DSI with a Pearson correlation coefficient of 0.92 (Figure 1D). Thus, DSI and LS provide similar estimations of the Arabidopsis genotypes susceptibility to D. dadantii.
To determine whether the quantification of disease based on symptom severity can be used to discriminate between Arabidopsis genotypes, we studied D. dadantii infection on a panel of eight accessions chosen for their different origins (data not shown). For this purpose, bacterial infection was performed on the accessions Bur-0, Can-0, Col-0, Cvi-0, Edi-0, Ge-0, and Oy-0. Disease severity estimated by LS at 48 h p.i. indicates that three statistically distinct groups could be defined. According to the LS criterion, the most tolerant accessions are Oy-0, Edi-0, and Bur-0. The most susceptible ones are Ge-0, Sakata, and Can-0 (Figure 2). These data indicate that natural accessions of Arabidopsis display different levels of tolerance to D. dadantii suggesting that tolerance associated loci might be found in this plant species.
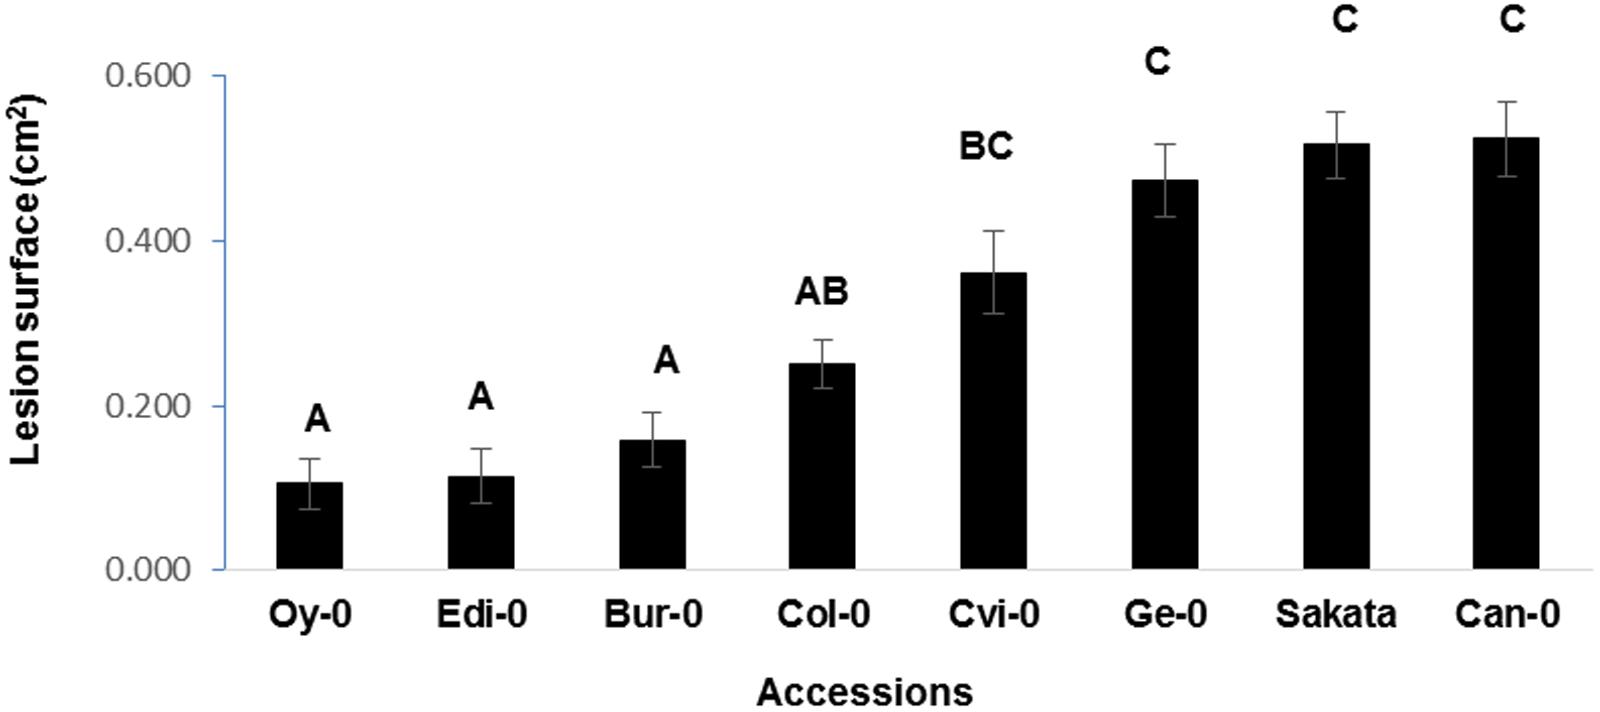
FIGURE 2. Quantification of disease on a collection of Arabidopsis accessions. Disease severity was quantified by LS on the indicated Arabidopsis genotypes 48 h p.i. Experiment was repeated three times with similar results. Representative data are shown. Means with different letters are significantly different at p < 0.05 as determined using XLSTAT ANOVA Tukey HSD test.
To perform large scale phenotyping of plants, robust and simple methods are needed. We were interested in phenotyping bacterial burden in planta, which is a complementary trait to the visible symptom. To investigate in planta bacterial populations, serial dilutions of samples followed by plating and colony counting are usually performed (Tornero and Dangl, 2001). However, this method is time-consuming and requires the use of a bacterial strain that harbors a resistance to an antibiotic. We wanted to develop a system to quantify bacteria by qPCR that could be easier to perform on a larger scale. For this purpose, before quantifying unknown bacterial titers, we checked whether DNA amplification allowed us to correctly determine a known bacterial titer in planta. To obtain leaves with a known bacterial titer, Arabidopsis leaves were inoculated with different known amounts of bacteria, then were immediately frozen. Total DNA was extracted as described, and two bacterial genes were amplified (pelA and rpoB) to avoid artifacts related to primer sequence. The pelA gene encodes a pectate lyase present in pectinolytic bacteria (Hugouvieux-Cotte-Pattat et al., 2014). The rpoB gene encodes an RNA polymerase which is a powerful tool used for bacterial identification (Mollet et al., 1997). These primers were used in a previous study (Nam Phuong et al., 2012), and their specificity was checked using as a template DNA of the closely related D. solani (Pedron et al., 2014). Amplification efficiencies with D. solani genomic DNA were out of acceptable range thus confirming the specificity of our primers (data not shown). Sequence alignments of pelA and rpoB primers with the corresponding genes from D. solani show several mismatches (Supplementary Figure 1). To quantify D. dadantii DNA, a standard curve was obtained using a serial dilution of genomic bacterial DNA from D. dadantii 3937. Data on Figure 3 show that bacterial DNA estimated by qPCR is in agreement with the expected DNA in the inoculum (Supplementary Table 2) based on the fact that a D. dadantii bacterial suspension of 0D600 = 0.1 contains approximately 5 × 10⁸ CFU/mL (Antunez-Lamas et al., 2009) and that a bacterial cell contains approximately 5 fg of DNA (Hutchison and Venter, 2006). Bacterial DNA amounts estimated via pelA and rpoB amplification were similar indicating that DNA quantification does not depend on the primers’ sequence. A highly statistically significant correlation was observed between experimentally quantified bacterial DNA via qPCR and theoretically expected bacterial DNA (Figure 3B). These data indicate that our qPCR-based quantification method is a reliable tool to estimate bacterial populations in planta at the initial stage of infection. Bacterial populations estimated by qPCR will be designated hereafter as “Bacterial cell EqDNA.”
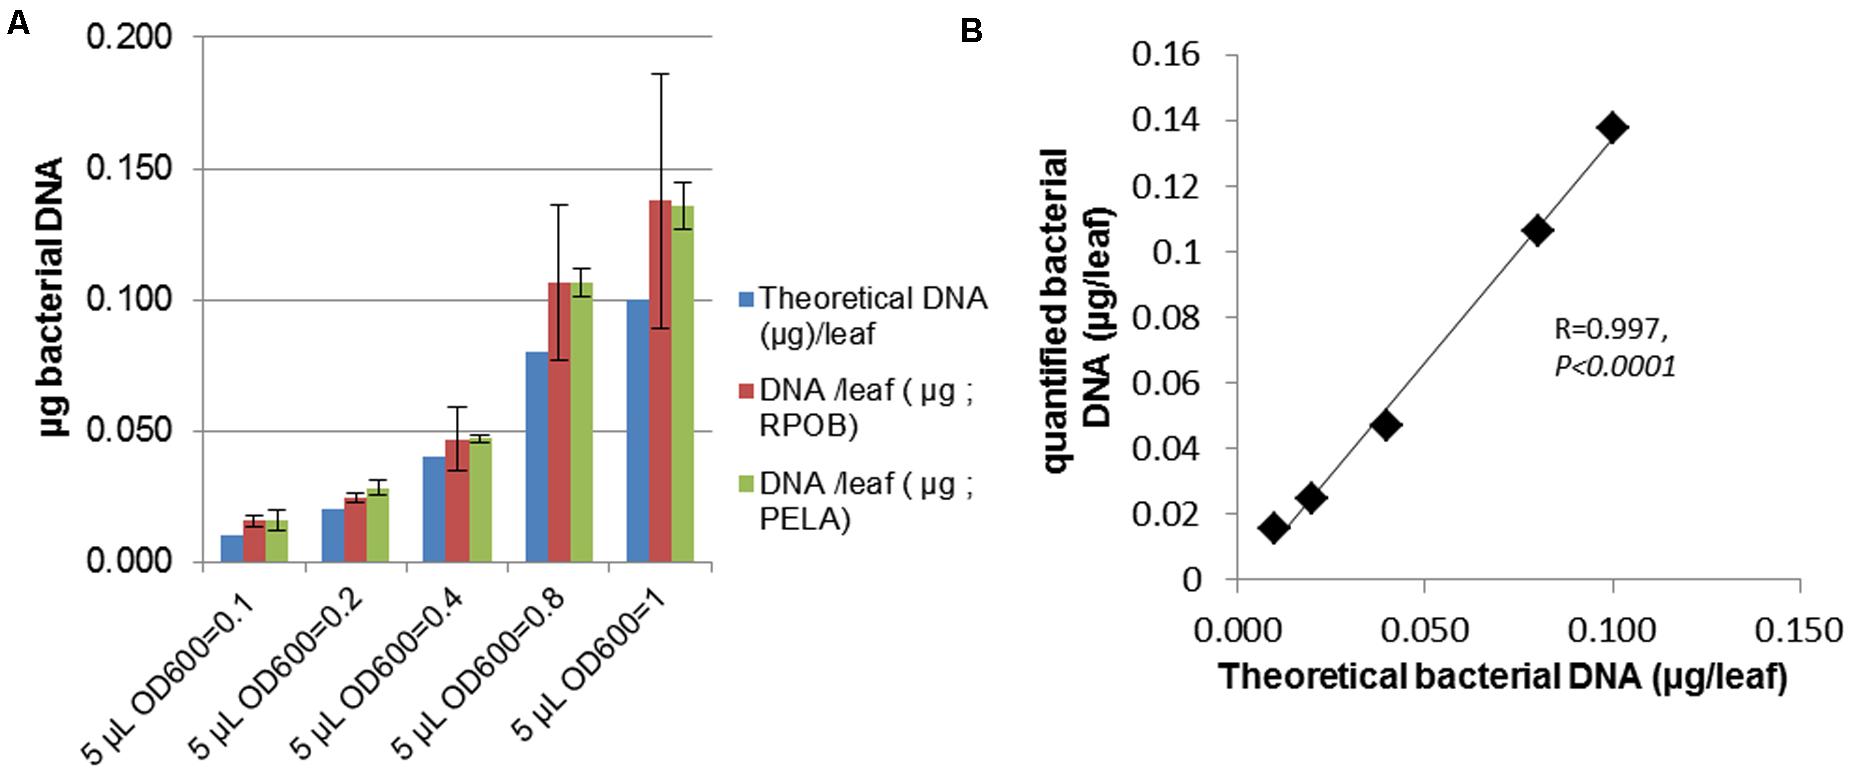
FIGURE 3. Bacterial population estimation by qPCR in samples with known bacterial titer. (A) Leaves were inoculated with 5 μL of a bacterial suspension at increasing concentrations. Leaves were immediately frozen and total DNA extracted then qPCR was performed with primers amplifying RPOB or PELA. Bacterial DNA quantities were determined based on a standard curve obtained with pure bacterial DNA. (B) Estimated bacterial DNA was plotted against expected values to check reliability of the quantification method.
Quantifying disease based on symptoms or based on bacterial populations provides different biological information. Indeed, it is conceivable that some plants may harbor a high inoculum without displaying symptoms. For instance, Dickeya species are known to survive in a latent state in plant tissues without causing symptoms (Toth et al., 2003; Czajkowski et al., 2011, 2015). Thus, we investigated possible correlations between bacterial populations and visible symptoms in individual leaves.
For this purpose, we quantified bacteria in planta using two different methods. The first method is the classical count of bacterial colonies after tissue grinding and serial dilutions followed by plating and counting the CFUs which is widely used in the literature (Tornero and Dangl, 2001; Lebeau et al., 2008; Antunez-Lamas et al., 2009). The second method is based on qPCR quantification of bacterial DNA in inoculated plants. We therefore compared these two methods, using plants at the extremes of the gradient of sensitivity of our panel of differentially susceptible accessions to investigate whether symptom severity is related to bacterial populations when disease progression has occurred (24 and 48 h p.i.). Leaves of Cvi-0 and Bur-0 plants were inoculated with 5 μL of a bacterial suspension at 5 × 10⁸ CFU/mL. Leaves displaying different intensities of DSI and of LS were harvested individually. As expected, bacterial populations at 0 h p.i., quantified by both methods corresponded to the inoculum, i.e., 25,000 bacteria/leaf (data not shown). Then, at 24 and 48 h. p.i., the bacterial titers in each inoculated leaf were determined, using either the DNA quantification method or the serial dilution method. By this means, we were able to attribute to each infected leaf 3 parameters: (1) DSI, (2) LS, (3) bacterial titer/leaf either estimated via CFU or via Bacterial cell EqDNA.
To determine whether visible symptoms were correlated with bacterial titers, we plotted LS against bacterial titers estimated by CFU or by Bacterial cell EqDNA. Figures 4A,B indicate that there was a statistically significant linear correlation between bacterial populations either estimated as CFU or as Bacterial Cell EqDNA and symptom severity (LS). Interestingly, measured bacterial populations were most variable at the beginning of the infection process, corresponding to LS below 0.2 cm2 (stages 1–2). Furthermore, we observed that in some cases bacterial populations reached higher levels in leaves with low LS compared to leaves with higher LS, indicating that in some cases bacteria can survive in leaves under a latent state. Taken together, our data show that bacterial populations are positively correlated to disease symptoms. However, bacterial populations in planta show, an important variability at the early stages of the infection, which may explain why it is quite complex in some cases to evaluate disease severity with this bacterium (Czajkowski et al., 2011). We note that the estimated bacterial populations by qPCR were in general higher than the bacterial populations estimated by counting of CFU although immediately after the inoculations, the initial inocula were identical. One possible explanation for this difference is that qPCR-based estimation of bacterial cells includes a part of the bacterial populations that died during the infection process and thereby over-estimates the amount of bacteria. Conversely, grinding the infected tissue then diluting and counting growing colonies as CFU probably kills a proportion of the bacterial cells and from the plant defense system.
To compare CFU/leaf and Bacterial Cell EqDNA/leaf, it was not technically possible to have two different estimations of the bacterial populations for the same leaf. To circumvent this problem, we compared the CFU/leaf and Bacterial Cell EqDNA/leaf for leaves displaying the same DSI. Indeed, this parameter could be scored for every leaf. To be more precise in our procedure, we divided the symptom stages as follows: Stage 0, Stage 0.5, Stage 1, Stage 1.5, Stage 2, Stage 2.5, Stage 3, Stage 3.5, Stage 4 (In our data, there was no Stage 5 because we used data for the 24 and 48 h p.i. time-points, when the symptoms rarely reach stage 5). Thus, for each stage, we could determine a mean bacterial population quantified as CFU/leaf and a mean bacterial population as Bacterial Cell EqDNA/leaf. This allowed us to check whether there is a correlation between these two parameters. Figure 4C shows that the Pearson correlation coefficient between the two datasets is 0.814 with statistically significant correlation indicating that the two bacterial quantification methods are equivalent. Although CFU and Bacterial cell EqDNA do not derive from the same individuals, this comparison provides an additional indication that both methods are consistent.
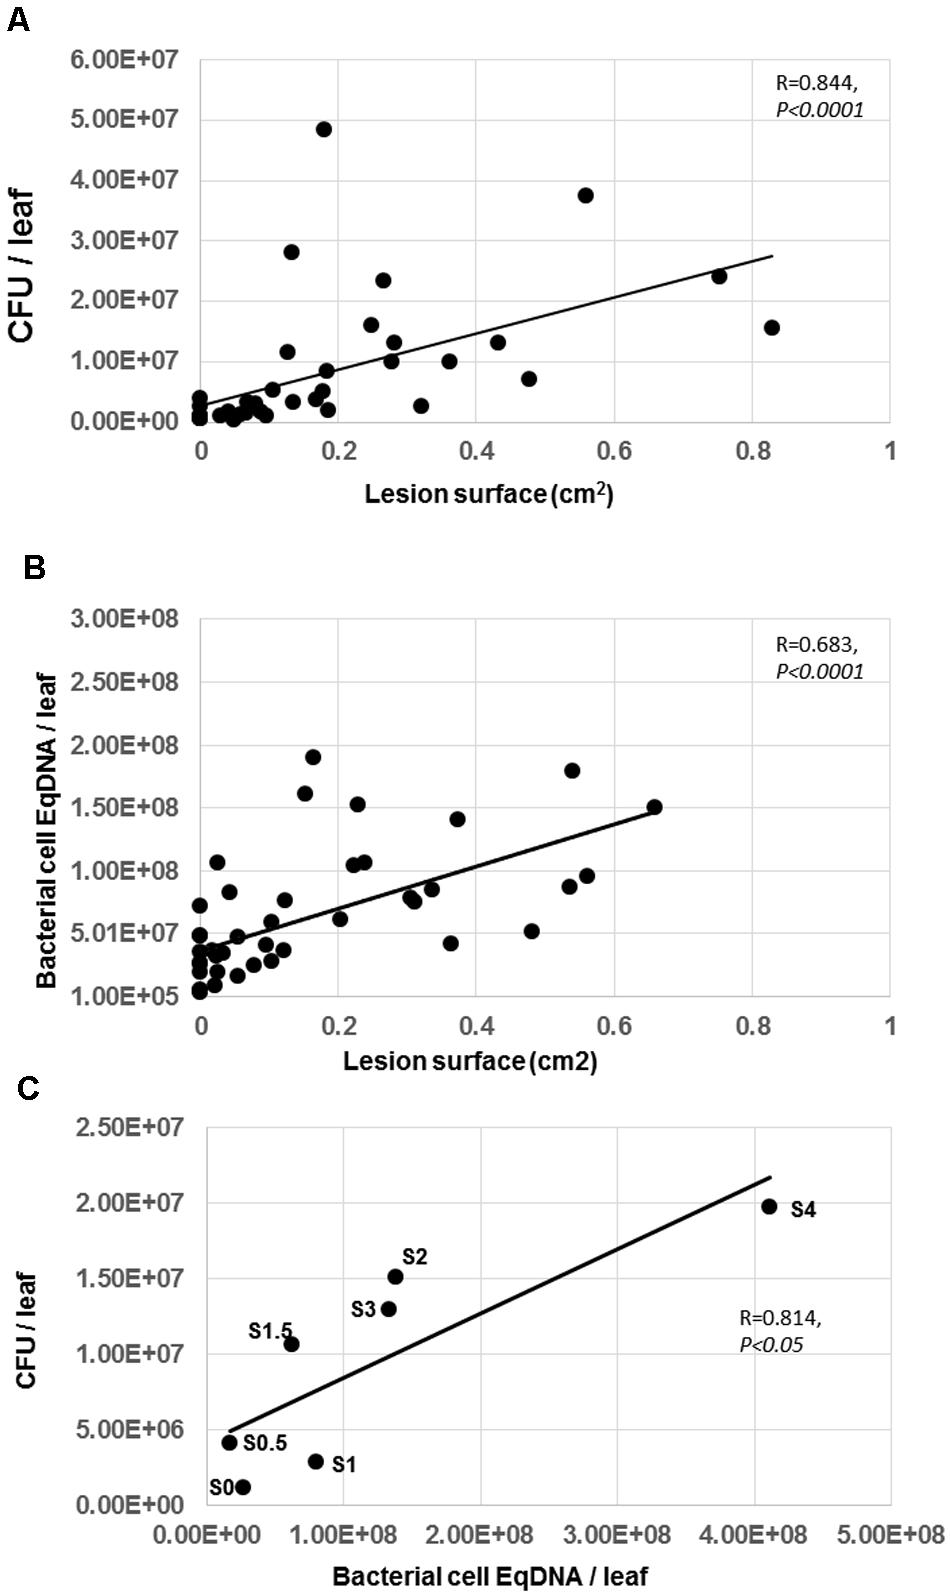
FIGURE 4. Correlation between lesion surface and bacterial population estimated by CFU or DNA in Arabidopsis leaves. (A) Bacterial population estimated by CFU was plotted against LS. (B) Bacterial population estimated by qPCR was plotted against LS. (C) Bacterial population estimated by qPCR was plotted against bacterial populations estimated by CFU in each class of symptoms (S0 = Stage 0, S0.5 = Stage 0.5, etc). Experiment was repeated twice with similar results. Representative data are shown. Determined coefficients are indicated (Spearman for A and B, Pearson for C).
To assess whether differential symptom severity on the eight accessions analyzed in Figure 2 was associated with a differential pathogen growth, bacterial populations were quantified by qPCR in these accessions. This allowed the definition of two statistically distinct groups (Figure 5). According to the bacterial population estimated by Bacterial cell EqDNA, the most tolerant accessions are Bur-0 and Edi-0 which are also classified as the most tolerant according to the LS criterion (Figure 2). The accessions displaying the highest bacterial population estimated by bacterial cell EqDNA, are Ge-0 and Cvi-0 which are also found in the most susceptible group according to the LS criterion. Disease symptoms as LS were plotted against bacterial populations for each accession to further determine the level of correlation between these two criteria. We found that the LS and bacterial DNA were significantly correlated with a correlation coefficient of 0.62 indicating again that there is an overall consistency between bacterial populations and visible disease symptoms although LS is more discriminant in this experiment. Estimation of bacterial populations provides complementary biological information about the mechanisms underlying the interaction. Taken together, these data show that although, this pathosystem presents a difficulty due to the presence of latent bacterial populations during infection, Arabidopsis is a good model to study genetic diversity of tolerance.
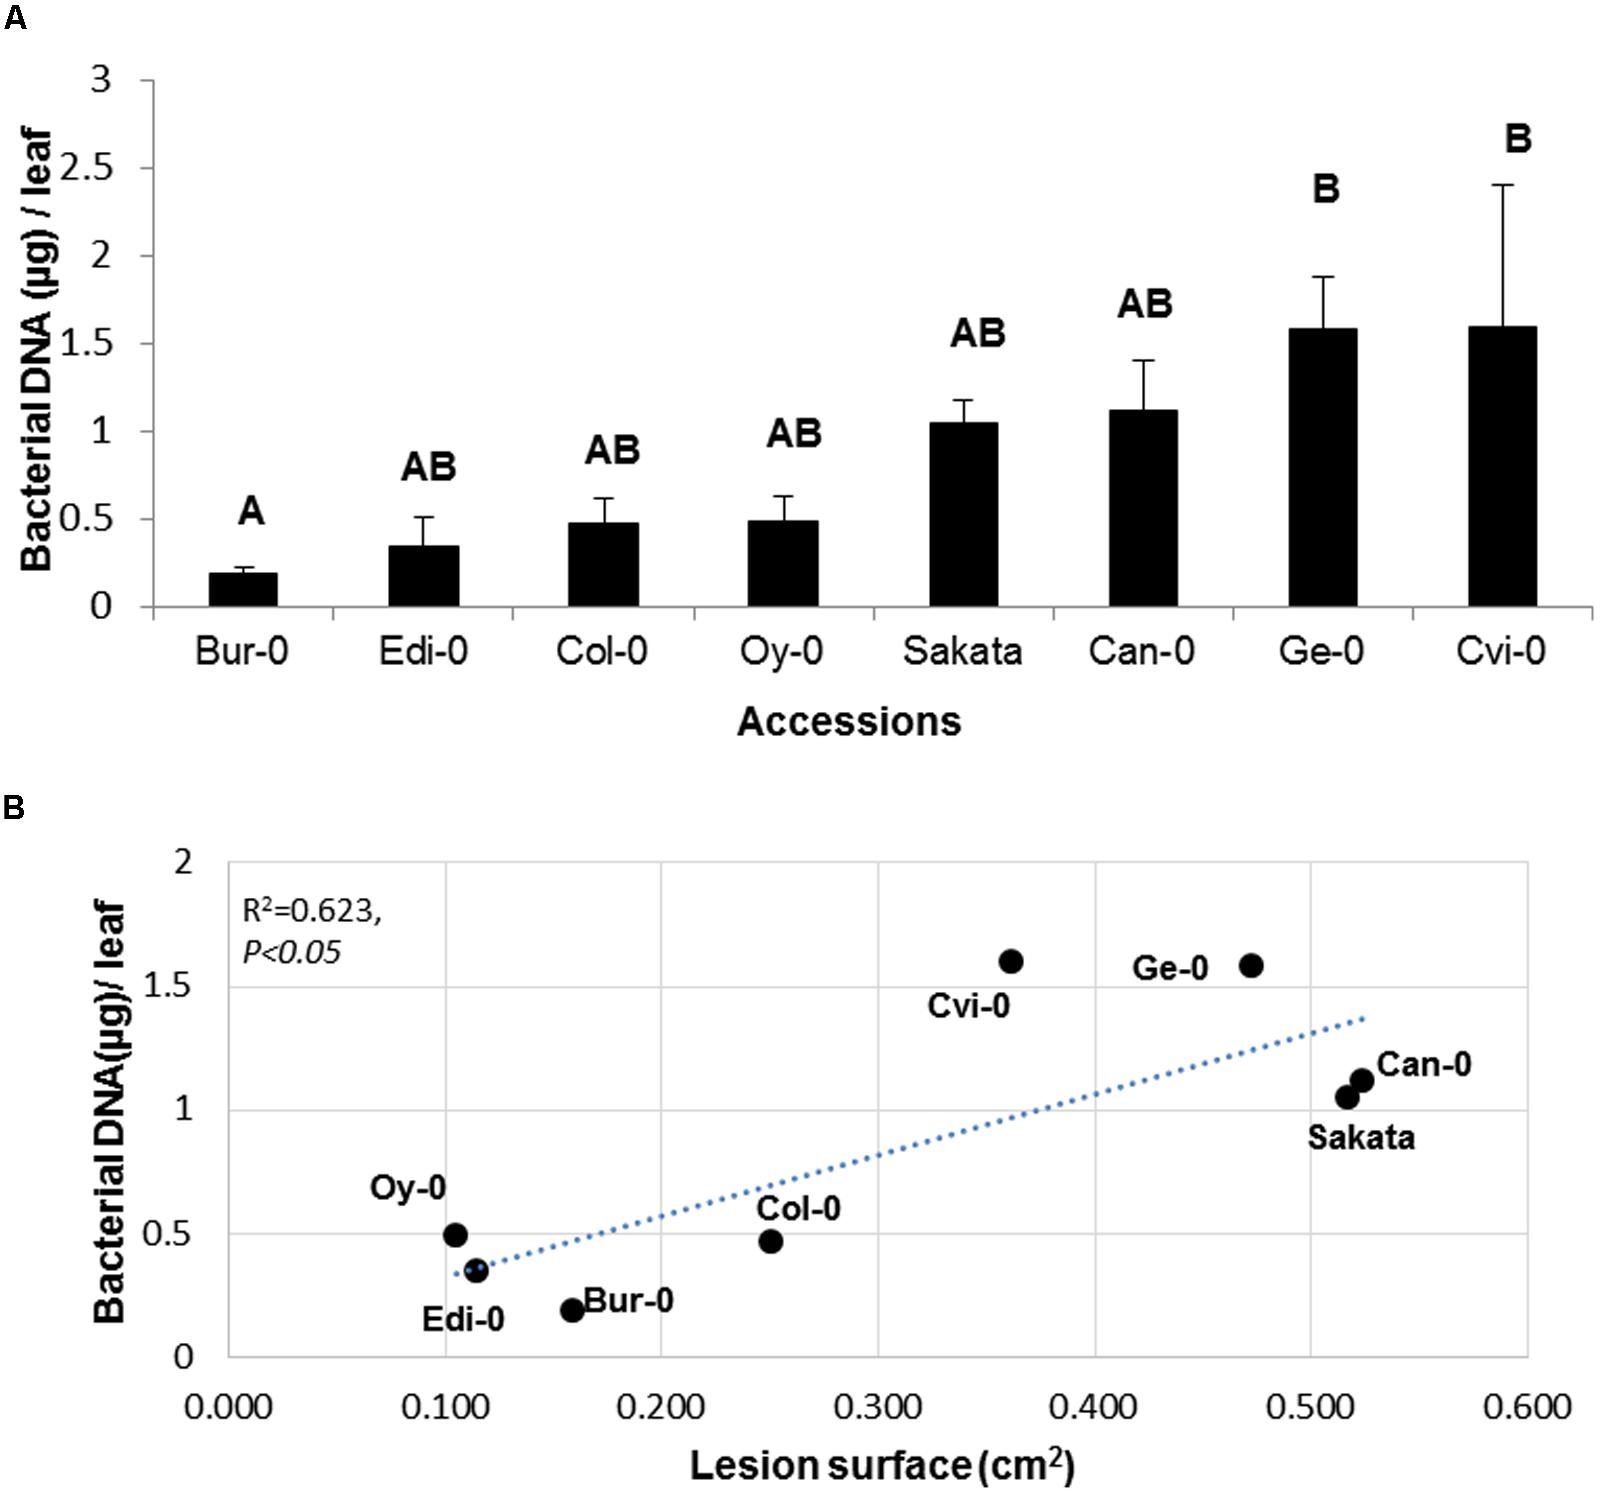
FIGURE 5. Quantification of disease and bacterial populations on a collection of Arabidopsis accessions. (A) Bacterial population estimated by qPCR on the indicated Arabidopsis genotypes 48 h p.i. (B) Bacterial population estimated by qPCR was plotted against LS for each genotype. Experiment was repeated at least twice with similar results. Representative data are shown. Means with different letters are significantly different at p < 0.05 as determined using XLSTAT ANOVA Tukey HSD test.
Identifying novel genes involved in defense processes against the necrotrophic pathogen D. dadantii is very challenging. Indeed, this bacterium causes major economic losses but very few data are available about potential tolerance genes. Taking advantage of the available novel genomics tools and QTL mapping populations in the model plant Arabidopsis opens new perspectives concerning the identification of tolerance genes to this bacterium. The feasibility of such approaches with D. dadantii is hampered by the lack of availability of reliable disease quantification methods. We addressed this issue by monitoring different disease parameters in a detailed experimental design. This experimental design was aimed at validating and comparing the different quantification methods in order to allow the choice for their use at larger scales (Table 1). We first supported our previously published scoring system by a quantitative method based on measurements of the macerated area. We then showed that quantifying bacterial populations by qPCR in planta is a reliable method to phenotype plant susceptibility to D. dadantii.
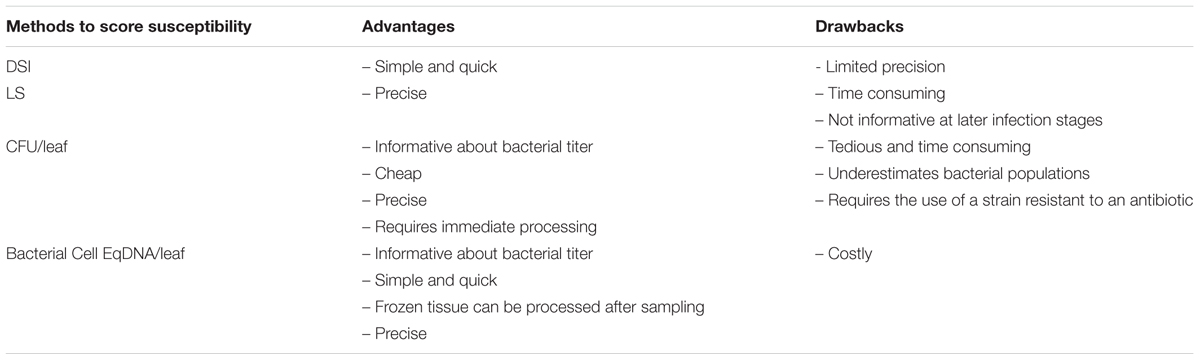
TABLE 1. Comparative analysis of the different methods to quantify Arabidopsis susceptibility levels against Dickeya dadantii.
Our data and others’ shows that the infection process by D. dadantii is quite complex and may result in asymptomatic lesions containing large amounts of bacteria in some cases, and important lesion development with limited bacterial populations in other cases. This asymptomatic phase led to the proposition that soft rot causing bacteria may be considered as hemi-biotrophs (Kraepiel and Barny, 2016). The asymptomatic phase ends at the onset of pectinase production that is under the control of a complex regulatory network in Dickeya spp. Signaling networks that sense environmental cues are activated via transcription factors including KdgR, PecS, Fur, and PecT responding to pectin fragments, immune signals, iron and temperature, respectively (Reverchon et al., 2016). In D. dadantii, a quorum sensing signal produced via a gene cluster named Vfm; coordinates the production of PCWDE at high bacterial density (Nasser et al., 2013). Notwithstanding the occurrence of asymptomatic infections, we show here that it is possible to obtain reliable estimations of bacterial populations by qPCR that are equivalent to estimations monitored by the classical CFU counting, and that this quantification method is a good indicator of the overall plant susceptibility (based on measurement of symptoms). This is consistent with a recent study showing that Pseudomonas sp. quantification in planta by qPCR is correlated with counting of bacterial colonies estimated by CFU in previously characterized susceptible Arabidopsis mutants (Ross and Somssich, 2016). In our work, instead of validating the quantification methods on previously characterized susceptible mutants, we were able to uncover significantly different susceptibility groups within a collection of Arabidopsis natural accessions uncharacterized previously following D. dadantii infection.
Quantifying DNA as a phenotyping method is a well-known method for fungal pathogens (Klosterman, 2012). Estimation of pathogenic bacteria by qPCR is performed to determine the level of natural contaminations in the field (Czajkowski et al., 2015), but it is not routinely used for pathogenic bacteria in an experimental setting. A previous work showed that it was possible to use qPCR to study bacterial populations in planta using Pseudomonas syringae and Pectobacterium carotovorum as examples (Brouwer et al., 2003), but here we go further to demonstrate the correlation with CFU and disease severity, a prerequisite for the use of this technique in experimental plant pathology. Although quantifying bacterial populations in planta based on DNA includes dead bacteria, we were able to show that this does not hamper the significant correlations between CFU bacterial counting and Bacterial Cell EqDNA. Quantifying bacterial RNA by RT-qPCR may allow the quantification of living bacteria. However, this would require the use of a constitutively expressed bacterial gene in planta, and would require an additional expensive step, which is the reverse transcription.
For most necrotrophs and hemi-biotrophs infecting a large range of hosts, the genetic determinants of plant immunity rely on tolerance rather than specific resistance (Lai and Mengiste, 2013; Roux et al., 2014). Thus, it is likely that the plant immunity against D. dadantii relies on tolerance processes. Because tolerance is a quantitative trait, the availability of powerful quantification methods is crucial. Tolerance is usually controlled by multiple loci and resistance is usually controlled by a single locus encoding a resistance (R) gene (St Clair, 2010). However, some exceptions do exist especially with the example of the bacterial wilt Ralstonia solanacearum (Huet, 2014). Tolerance can be conferred by a single R gene like it is the case for the R gene RRS-1 that confers tolerance in Arabidopsis accession Kil-0 (Van der Linden et al., 2013). Conversely, multiple R genes can be involved in tolerance to bacterial wilt in Medicago truncatula (Vailleau et al., 2007).
By the present work, we provide a tool simple to set up in order to phenotype sensitivity of Arabidopsis plant genotypes to the bacterial pathogen D. dadantii. This study demonstrates that it is possible to conduct a robust phenotyping of soft rot disease despite the occurrence of latent bacteria, and that Arabidopsis natural accessions are a relevant source of tolerance genes. Thus, it would be of great interest to use our scoring methods to identify tolerance genes either using QTL mapping in a recombinant segregating population or by performing a genome wide association study.
AD: Designed experiments, analyzed the data, and wrote the paper. MR and AB: performed experiments and analyzed the data. AD, FC, MF, and CM-D: contributed writing the paper.
This work was supported by the grant INRA NITROPATH BAP2014_63.
The authors declare that the research was conducted in the absence of any commercial or financial relationships that could be construed as a potential conflict of interest.
We are grateful to C. R. Tinsley for critical reading of the manuscript.
The Supplementary Material for this article can be found online at: http://journal.frontiersin.org/article/10.3389/fpls.2017.00394/full#supplementary-material
Antunez-Lamas, M., Cabrera-Ordonez, E., Lopez-Solanilla, E., Raposo, R., Trelles-Salazar, O., Rodriguez-Moreno, A., et al. (2009). Role of motility and chemotaxis in the pathogenesis of Dickeya dadantii 3937 (ex Erwinia chrysanthemi 3937). Microbiology 155, 434–442. doi: 10.1099/mic.0.022244-0
Asselbergh, B., Achuo, A. E., Hofte, M., and Van Gijsegem, F. (2008). Abscisic acid deficiency leads to rapid activation of tomato defence responses upon infection with Erwinia chrysanthemi. Mol. Plant Pathol. 9, 11–24. doi: 10.1111/j.1364-3703.2007.00437.x
Aznar, A., Chen, N. W. G., Rigault, M., Riache, N., Joseph, D., Desmaele, D., et al. (2014). Scavenging iron: a novel mechanism of plant immunity activation by microbial siderophores. Plant Physiol. 164, 2167–2183. doi: 10.1104/pp.113.233585
Aznar, A., Chen, N. W. G., Thomine, S., and Dellagi, A. (2015). Immunity to plant pathogens and iron homeostasis. Plant Sci. 240, 90–97. doi: 10.1016/j.plantsci.2015.08.022
Brouwer, M., Lievens, B., Van Hemelrijck, W., Van den Ackerveken, G., Cammue, B. P. A., and Thomma, B. (2003). Quantification of disease progression of several microbial pathogens on Arabidopsis thaliana using real-time fluorescence PCR. FEMS Microbiol. Lett. 228, 241–248. doi: 10.1016/s0378-1097(03)00759-6
Chapelle, E., Alunni, B., Malfatti, P., Solier, L., Pedron, J., Kraepiel, Y., et al. (2015). A straightforward and reliable method for bacterial in planta transcriptomics: application to the Dickeya dadantii/Arabidopsis thaliana pathosystem. Plant J. 82, 352–362. doi: 10.1111/tpj.12812
Czajkowski, R., Perombelon, M. C. M., Jafra, S., Lojkowska, E., Potrykus, M., van der Wolf, J. M., et al. (2015). Detection, identification and differentiation of Pectobacterium and Dickeya species causing potato blackleg and tuber soft rot: a review. Ann. Appl. Biol. 166, 18–38. doi: 10.1111/aab.12166
Czajkowski, R., Perombelon, M. C. M., van Veen, J. A., and van der Wolf, J. M. (2011). Control of blackleg and tuber soft rot of potato caused by Pectobacterium and Dickeya species: a review. Plant Pathol. 60, 999–1013. doi: 10.1111/j.1365-3059.2011.02470.x
Dangl, J. L., Horvath, D. M., and Staskawicz, B. J. (2013). Pivoting the plant immune system from dissection to deployment. Science 341, 746–751. doi: 10.1126/science.1236011
Fagard, M., Dellagi, A., Roux, C., Perino, C., Rigault, M., Boucher, V., et al. (2007). Arabidopsis thaliana expresses multiple lines of defense to counterattack Erwinia chrysanthemi. Mol. Plant Microbe Interact. 20, 794–805. doi: 10.1094/mpmi-20-7-0794
Herigstad, B., Hamilton, M., and Heersink, J. (2001). How to optimize the drop plate method for enumerating bacteria. J. Microbiol. Methods 44, 121–129. doi: 10.1016/s0167-7012(00)00241-4
Huet, G. (2014). Breeding for resistances to Ralstonia solanacearum. Front. Plant Sci. 5:715. doi: 10.3389/fpls.2014.00715
Hugouvieux-Cotte-Pattat, N., Condemine, G., and Shevchik, V. E. (2014). Bacterial pectate lyases, structural and functional diversity. Environ. Microbiol. Rep. 6, 427–440. doi: 10.1111/1758-2229.12166
Hutchison, C. A., and Venter, J. C. (2006). Single-cell genomics. Nat. Biotechnol. 24, 657–658. doi: 10.1038/nbt0606-657
Klosterman, S. J. (2012). “Real-time PCR for the quantification of fungi in planta,” in Plant Fungal Pathogens: Methods and Protocols, Vol. 835, eds M. D. Bolton and B. P. H. J. Thomma 121–132. doi: 10.1007/978-1-61779-501-5_8
Kraepiel, Y., and Barny, M. A. (2016). Gram-negative phytopathogenic bacteria, all hemibiotrophs after all? Mol. Plant Pathol. 17, 313–316. doi: 10.1111/mpp.12345
Lai, Z. B., and Mengiste, T. (2013). Genetic and cellular mechanisms regulating plant responses to necrotrophic pathogens. Curr. Opin. Plant Biol. 16, 505–512. doi: 10.1016/j.pbi.2013.06.014
Lebeau, A., Reverchon, S., Gaubert, S., Kraepiel, Y., Simond-Cote, E., Nasser, W., et al. (2008). The GacA global regulator is required for the appropriate expression of Erwinia chrysanthemi 3937 pathogenicity genes during plant infection. Environ. Microbiol. 10, 545–559. doi: 10.1111/j.1462-2920.2007.01473.x
Lemaitre, T., Gaufichon, L., Boutet-Mercey, S., Christ, A., and Masclaux-Daubresse, C. (2008). Enzymatic and metabolic diagnostic of nitrogen deficiency in Arabidopsis thaliana Wassileskija accession. Plant Cell Physiol. 49, 1056–1065. doi: 10.1093/pcp/pcn081
Mollet, C., Drancourt, M., and Raoult, D. (1997). rpoB sequence analysis as a novel basis for bacterial identification. Mol. Microbiol. 26, 1005–1011. doi: 10.1046/j.1365-2958.1997.6382009.x
Mutka, A. M., and Bart, R. S. (2015). Image-based phenotyping of plant disease symptoms. Front. Plant Sci. 5:734. doi: 10.3389/fpls.2014.00734
Nam Phuong, K., Aznar, A., Segond, D., Rigault, M., Simond-Cote, E., Kunz, C., et al. (2012). Iron deficiency affects plant defence responses and confers resistance to Dickeya dadantii and Botrytis cinerea. Mol. Plant Pathol. 13, 816–827. doi: 10.1111/j.1364-3703.2012.00790.x
Nasser, W., Dorel, C., Wawrzyniak, J., Van Gijsegem, F., Groleau, M. C., Deziel, E., et al. (2013). Vfm a new quorum sensing system controls the virulence of Dickeya dadantii. Environ. Microbiol. 15, 865–880. doi: 10.1111/1462-2920.12049
Pajerowska-Mukhtar, K. M., Mukhtar, M. S., Guex, N., Halim, V. A., Rosahl, S., Somssich, I. E., et al. (2008). Natural variation of potato allene oxide synthase 2 causes differential levels of jasmonates and pathogen resistance in Arabidopsis. Planta 228, 293–306. doi: 10.1007/s00425-008-0737-x
Pedron, J., Mondy, S., des Essarts, Y. R., Van Gijsegem, F., and Faure, D. (2014). Genomic and metabolic comparison with Dickeya dadantii 3937 reveals the emerging Dickeya solani potato pathogen to display distinctive metabolic activities and T5SS/T6SS-related toxin repertoire. BMC Genomics 15:283. doi: 10.1186/1471-2164-15-283
Piquerez, S. J. M., Harvey, S. E., Beynon, J. L., and Ntoukakis, V. (2014). Improving crop disease resistance: lessons from research on Arabidopsis and tomato. Front. Plant Sci. 5:671. doi: 10.3389/fpls.2014.00671
Reverchon, S., Muskhelisvili, G., and Nasser, W. (2016). Virulence program of a bacterial plant pathogen: the Dickeya model. Prog. Mol. Biol. Transl. Sci. 142, 51–92. doi: 10.1016/bs.pmbts.2016.05.005
Reverchon, S., and Nasser, W. (2013). Dickeya ecology, environment sensing and regulation of virulence programme. Environ. Microbiol. Rep. 5, 622–636. doi: 10.1111/1758-2229.12073
Reverchon, S., Rouanet, C., Expert, D., and Nasser, W. (2002). Characterization of indigoidine Biosynthetic genes in Erwinia chrysanthemi and role of this blue pigment in pathogenicity. J. Bacteriol. 184, 654–665. doi: 10.1128/JB.184.3.654-665.2002
Ross, A., and Somssich, I. E. (2016). A DNA-based real-time PCR assay for robust growth quantification of the bacterial pathogen Pseudomonas syringae on Arabidopsis thaliana. Plant Methods 12:48. doi: 10.1186/s13007-016-0149-z
Roux, F., Voisin, D., Badet, T., Balague, C., Barlet, X., Huard-Chauveau, C., et al. (2014). Resistance to phytopathogens e tutti quanti: placing plant quantitative disease resistance on the map. Mol. Plant Pathol. 15, 427–432. doi: 10.1111/mpp.12138
Santos, R., Franza, T., Laporte, M. L., Sauvage, C., Touati, D., and Expert, D. (2001). Essential role of superoxide dismutase on the pathogenicity of Erwinia chrysanthemi strain 3937. Mol. Plant Microbe Interact. 14, 758–767. doi: 10.1094/MPMI.2001.14.6.758
St Clair, D. A. (2010). Quantitative disease resistance and quantitative resistance loci in breeding. Annu. Rev. Phytopathol. 48, 247–268. doi: 10.1146/annurev-phyto-080508-081904
Tornero, P., and Dangl, J. L. (2001). A high-throughput method for quantifying growth of phytopathogenic bacteria in Arabidopsis thaliana. Plant J. 28, 475–481. doi: 10.1046/j.1365-313X.2001.01136.x
Toth, I. K., Bell, K. S., Holeva, M. C., and Birch, P. R. J. (2003). Soft rot erwiniae: from genes to genomes. Mol. Plant Pathol. 4, 17–30. doi: 10.1046/j.1364-3703.2003.00149.x
Toth, I. K., van der Wolf, J. M., Saddler, G., Lojkowska, E., Helias, V., Pirhonen, M., et al. (2011). Dickeya species: an emerging problem for potato production in Europe. Plant Pathol. 60, 385–399. doi: 10.1111/j.1365-3059.2011.02427.x
Trontin, C., Tisne, S., Bach, L., and Loudet, O. (2011). What does Arabidopsis natural variation teach us (and does not teach us) about adaptation in plants? Curr. Opin. Plant Biol. 14, 225–231. doi: 10.1016/j.pbi.2011.03.024
Vailleau, F., Sartorel, E., Jardinaud, M. F., Chardon, F., Genin, S., Huguet, T., et al. (2007). Characterization of the interaction between the bacterial wilt pathogen Ralstonia solanacearum and the model legume plant Medicago truncatula. Mol. Plant Microbe Interact. 20, 159–167. doi: 10.1094/mpmi-20-20-0159
Van der Linden, L., Bredenkamp, J., Naidoo, S., Fouche-Weich, J., Denby, K. J., Genin, S., et al. (2013). Gene-for-gene tolerance to bacterial wilt in Arabidopsis. Mol. Plant Microbe Interact. 26, 398–406. doi: 10.1094/mpmi-07-12-0188-r
van Kan, J. A. L. (2006). Licensed to kill: the lifestyle of a necrotrophic plant pathogen. Trends Plant Sci. 11, 247–253. doi: 10.1016/j.tplants.2006.03.005
Keywords: natural variation, Arabidopsis thaliana Dickeya dadantii, quantification, qPCR
Citation: Rigault M, Buellet A, Masclaux-Daubresse C, Fagard M, Chardon F and Dellagi A (2017) Quantitative Methods to Assess Differential Susceptibility of Arabidopsis thaliana Natural Accessions to Dickeya dadantii. Front. Plant Sci. 8:394. doi: 10.3389/fpls.2017.00394
Received: 05 December 2016; Accepted: 07 March 2017;
Published: 28 March 2017.
Edited by:
Richard Berthomé, Centre Toulouse Midi-Pyrénées (INRA), FranceReviewed by:
Javier Plasencia, Universidad Nacional Autónoma de México (UNAM), MexicoCopyright © 2017 Rigault, Buellet, Masclaux-Daubresse, Fagard, Chardon and Dellagi. This is an open-access article distributed under the terms of the Creative Commons Attribution License (CC BY). The use, distribution or reproduction in other forums is permitted, provided the original author(s) or licensor are credited and that the original publication in this journal is cited, in accordance with accepted academic practice. No use, distribution or reproduction is permitted which does not comply with these terms.
*Correspondence: Alia Dellagi, dellagi@agroparistech.fr
Disclaimer: All claims expressed in this article are solely those of the authors and do not necessarily represent those of their affiliated organizations, or those of the publisher, the editors and the reviewers. Any product that may be evaluated in this article or claim that may be made by its manufacturer is not guaranteed or endorsed by the publisher.
Research integrity at Frontiers
Learn more about the work of our research integrity team to safeguard the quality of each article we publish.