Corrigendum: Transcriptomic Identification of Drought-Related Genes and SSR Markers in Sudan Grass Based on RNA-Seq
 Yongqun Zhu1,2†
 Xia Wang1†Linkai Huang1Chaowen Lin2
 Xinquan Zhang1*Wenzhi Xu2Jianhua Peng3Zhou Li1Haidong Yan1Fuxiang Luo2
 Xie Wang2Li Yao2Dandan Peng2
- 1Department of Grassland Science, Animal Science and Technology College, Sichuan Agricultural University, Chengdu, China
- 2Soil and Fertilizer Research Institute, Sichuan Academy of Agricultural Sciences, Chengdu, China
- 3Sichuan Academy of Agricultural Sciences, Chengdu, China
Sudan grass (Sorghum sudanense) is an annual warm-season gramineous forage grass that is widely used as pasture, hay, and silage. However, drought stress severely impacts its yield, and there is limited information about the mechanisms of drought tolerance in Sudan grass. In this study, we used next-generation sequencing to identify differentially expressed genes (DEGs) in the Sudan grass variety Wulate No.1, and we developed simple sequence repeat (SSR) markers associated with drought stress. From 852,543,826 raw reads, nearly 816,854,366 clean reads were identified and used for analysis. A total of 80,686 unigenes were obtained via de novo assembly of the clean reads including 45,065 unigenes (55.9%) that were identified as coding sequences (CDSs). According to Gene Ontology analysis, 31,444 unigenes were annotated, 11,778 unigenes were identified to 25 categories in the clusters of orthologous groups of proteins (KOG) classification, and 11,223 unigenes were assigned to 280 Kyoto Encyclopedia of Genes and Genomes (KEGG) pathways. Additionally, there were 2,329 DEGs under a short-term of 25% polyethylene glycol (PEG) treatment, while 5,101 DEGs were identified under the long-term of 25% PEG treatment. DEGs were enriched in pathways of carbon fixation in photosynthetic organisms and plant hormone signal transduction which played a leading role in short-term of drought stress. However, DEGs were mainly enriched in pathway of plant hormone signal transduction that played an important role under long-term of drought stress. To increase accuracy, we excluded all the DEGs of all controls, specifically, five DEGs that were associated with high PEG concentrations were found through RNA-Seq. All five genes were up-regulated under drought stress, but the functions of the genes remain unclear. In addition, we identified 17,548 SSRs obtained from 80,686 unigenes. The newly identified drought tolerance DEGs will contribute to transgenic breeding efforts, while SSRs developed from high-throughput transcriptome data will facilitate marker-assisted selection for all traits in Sudan grass.
Introduction
Global climate change has increased the incidence of drought worldwide across successive years (Shanker et al., 2014), and it has had many negative effects on plant growth such as leaf rolling, growth inhibition, and death (Mutisya et al., 2010), thus severely affecting agriculture. Sudan grass (Sorghum sudanense) is an annual warm-season gramineous forage grass (Smith et al., 1982; Zhan et al., 2008). Because of its favorable yield, superior value, fast regrowth, superior disease, and pest resistance, and tolerance to abiotic stress, Sudan grass is widely grown in pastures and used as hay and silage throughout the world (Rangaswami Ayyangar and Ponnaiya, 1939; Summer et al., 1965; Zamfir et al., 2001; Al-Suhaibani, 2006). It is distributed throughout China as a typical grass for livestock, aquaculture foods, and protecting fishing ponds (Wei et al., 2008; Chen et al., 2009), especially in arid and semiarid regions (Awad et al., 2013). However, exposure to drought stress for long time periods can affect forage yield and quality. Bibi et al. (2010) showed that drought stress could decrease Sudan grass yields. Therefore, it is important to study drought tolerance mechanisms in Sudan grass.
Drought stress causes osmotic and oxidative stress, which decreases membrane stability, leading to cell death (Wang et al., 2003). In order to cope with drought stress, plants have developed comprehensive mechanisms such as metabolic alteration, signal transduction, and differential gene expression (Shanker et al., 2014). Although various breeding approaches have been used to alleviate damage caused by drought stress in plants, genetic engineering has been more effective than other approaches. However, genetic engineering requires identifying genes with expression patterns regulated by drought stress.
The next-generation sequencing (NGS) technique known as RNA sequencing (RNA-Seq) is a cost-efficient tool for sequencing the full transcriptomes of both model and non-model species. RNA-Seq has been successfully used in many plants such as Brachypodium sylvaticum (Fox et al., 2013), Sorghum sudanense (Li et al., 2016), sugarcane (Cardoso-Silva et al., 2014), pepper (Ashrafi et al., 2012), orchardgrass (Huang et al., 2015), Hemarthria (Huang X. et al., 2016), and annual ryegrass (Pan et al., 2016). Transcriptome data has been used in biological studies worldwide in order to better understand biological processes (Surget-Groba and Montoya-Burgos, 2010), and it has especially been applied to studying the responses of gene expression to various stresses (Kreps et al., 2002). Shinozaki and Yamaguchi-Shinozaki (2007) reported that plants transformed with drought-inducible genes exhibited improved stress tolerance. Similarly, Ashraf (2010) noted that some genes are overexpressed, thereby inducing damage caused by drought stress, which are thus well utilized to improve the tolerance of plants to drought stress. However, effectively no published reports have used RNA-Seq to analyze the regulation of gene expression by the drought stress in Sudan grass.
Marker-assisted selection (MAS) breeding is as important as genetic engineering (Ashraf, 2010). SSRs (simple sequence repeats), AFLPs (amplified fragment length polymorphisms), RAPDs (randomly amplified polymorphic DNAs), and RFLPs (restriction fragment length polymorphisms) have been used as efficient markers to analyze genetic diversity (Billot et al., 2013). Because SSRs are highly polymorphic and adaptable across species, many researchers have used them to examine genetic diversity (Smith et al., 2000; Menz et al., 2002; Geleta et al., 2006), construct genetic maps (Wu and Huang, 2006), investigate the genetic relationships among populations (Ali et al., 2008), and identify quantitative trait loci (QTLs) for important agronomic traits (Sanchez et al., 2002; Mace and Jordan, 2011; Wang et al., 2012; Upadhyaya et al., 2012). However, few SSR markers have been developed for use in Sudan grass.
In this study, we used RNA-Seq, a powerful NGS-based technique, to study transcription profiles of Sudan grass. The main goals of this study were (1) to develop SSR markers associated with drought-tolerance genes in the Sudan grass variety Wulate No. 1 and (2) to identify differently expressed genes (DEGs) under drought stress. This study provides more information about the molecular mechanisms of drought stress in Sudan grass, thereby contributing to future transgenic breeding efforts in addition to providing markers for MAS.
Materials and Methods
Plant Material and RNA Isolation
Seeds of the Sudan grass variety Wulate No.1 (Barenbrug Co., Chengdu, China) were sown in sand-culture pots that were placed in controlled growth champers set to 25°C for 12-h days and 22°C for 12-h nights. After seeds had germinated in water, 1/2 strength Hoagland's solution was used to cultivate seedlings. After 20 days, seedlings were subjected to polyethylene glycol (PEG) stress as a means of inducing drought stress. The plants were divided into two treatments: (1) plants in three pots (three replicates) were subjected to 25% PEG dissolved in 1/2 strength Hoagland's solution (drought stress); (2) the other three pots were subjected to just 1/2 strength Hoagland's solution (control). The leaves were harvested at 0, 3, and 6 days and stored in a −80°C freezer prior to RNA extraction. L_0_1, L_3_1, and L_6_1 were non-stressed controls that were collected at 0, 3, and 6 day, respectively. L_3_2 and L_6_2 were drought-stressed treatments that were collected at 3 and 6 day, respectively. Therefore, 5 treatments were set and each treatment had 3 replicates. A total of 15 samples were collected for RNA sequencing.
Total RNA was extract from leaves using the RNeasy Plant Mini Kit (Qiagen, Valencia, CA, USA) according to the manufacturer's instructions and then loaded onto and electrophoresed through a 1% agarose gel to check the degradation and contamination of the RNA (Figure 1). The quantity, concentration, and quality of the total RNA were examined using an RNA Nano 6000 kit for the Agilent 2100 Bioanalyzer 2100 System (Agilent Technologies, CA, USA). The integrity of the RNAs is shown in Figure 2.
FIGURE 1
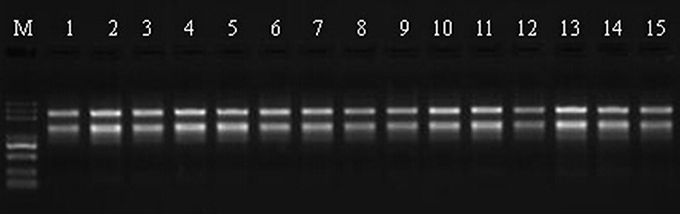
Figure 1. RNA validation of Sudan grass samples by 1% agarose gel electrophoresis. M represents the marker, lanes 1–3 correspond to the three replicates of Wulate No.1 at 0 day in 0% PEG, lanes 4–6 correspond to the three replicates of Wulate No.1 at 3 day in 0% PEG, lanes 7–9 correspond to the three replicates of Wulate No.1 at 3 day in 25% PEG, lanes 10–12 correspond to the three replicates of Wulate No.1 at 6 day in 0% PEG, and lanes 13–15 correspond to the three replicates of Wulate No.1 at 6 day in 25% PEG.
FIGURE 2
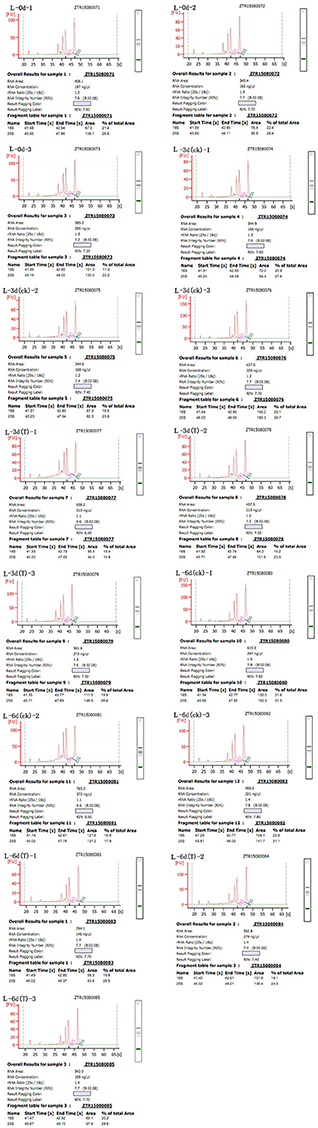
Figure 2. Sudan grass RNA sample quality. The labeling scheme for each of the Wulate No.1 RNA samples is as follows: L-0d-1 through L-0d-3, the three replicates at day 0 in 0% PEG; L-3d(ck)-1 through L-3d(ck)-3, the three replicates at day 3 in 0% PEG; L-3d(T)-1 through L-3d(T)-3, the three replicates at day 3 in 25% PEG; L-6d(ck)-1 through L-6d(ck)-3, the three replicates at day 6 in 0% PEG; and L-6d(T)-1 through L-6d(T)-3, the three replicates at day 6 in 25% PEG.
Preparation and Sequencing of the cDNA Library
We used 3 μg of RNA per sample as genetic material for preparation, and mRNAs were purified from total RNA using poly-T oligo-attached magnetic beads. These fragments were used as templates in a reaction carried out by divalent cations in a NEBNext First Strand Synthesis Reaction Buffer (5×; New England BioLabs, Ipswitch, MA, USA). The first cDNA strand was synthesized using random hexamer primers and transcribed with RNase H−. The second strand cDNA was synthesized using DNA polymerase I and RNase H. NEBNext Adaptor (New England BioLabs) were prepared for hybridization after blunt 3′ ends were cut via exonuclease/polymerase activities. Then, we purified cDNA with the AMPure XP system (Beckman Coulter, Brea, CA USA) to select 150–200 bp fragments. The products were generated using 3 μL of USER Enzyme (New England BioLabs) size-selected for adaptor-ligated cDNA at 37°C for 15 min followed by 5 min at 95°C and amplified via PCR using Universal PCR primers and index(X) primers. The PCR was performed using Phusion High-Fidelity DNA polymerase (New England BioLabs). Before PCR product sequencing, samples were index-coded for clustering under the TruSeq PE Cluster Kit v3-cBot-HS (Illumia, San Diego, CA, USA). Finally, the amplified products were purified using the AMPure XP system, and library quality was assessed on the Agilent Bioanalyzer 2100 system (Agilent Technologies, Santa Clara, CA, USA) to create the final cDNA libraries. Sequencing libraries were generated using NEBNext® Ultra™ RNA Library Prep Kit for Illumina® (New England BioLabs) following the manufacturer's recommendations. In total, there were 15 cDNA libraries were constructed of Sudan grass.
Data Analysis
The sequencing-derived image data were transformed into raw reads. To ensure high quality transcriptomic data, the raw reads were cleaned using in-house Perl scripts that remove adapter sequences, poly-N repeats, and low quality reads, whilst calculating the Q20, Q30, GC-content, and sequence duplication level of the clean data. The cleaned reads were then assembled by Trinity (Grabherr et al., 2011) with min_kmer_cov set to 2 as a default, and all other parameters used default settings.
The assembled sequences were BLASTed against NR (NCBI non-redundant protein sequences, NCBI blast 2.2.28+, e-value = 1e-5), NT (NCBI non-redundant nucleotide sequences, NCBI blast 2.2.28+, e-value = 1e-5), PFAM (Protein family, HMMER 3.0 package, hmmscan e-value = 0.01), KOG/COG (Clusters of Orthologous Groups of proteins, NCBI blast 2.2.28+, e-value = 1e-3), Swiss-Prot (a manually annotated and reviewed protein sequence database, NCBI blast 2.2.28+, e-value = 1e-5), KO (KEGG Ortholog database, KAAS [KEGG Automatic Annotation Server], e-value = 1e-10), and GO (Gene Ontology, Blast 2 GO v2.5, e-value = 1e-6; Götz et al., 2008) databases to determine gene functions of differentially expressed transcripts. Then, we predicted the coding sequences (CDSs) of the assembled unigenes in NR and Swiss-Prot. When similar unigenes were identified, the CDSs were translated into amino acid sequences later and open reading frames (ORFs) were extracted from the results; alternatively, ESTScan (3.0.3) was used to predict ORFs.
Analysis and Mapping of DEG Reads and Differential Gene Expression
Before mapping clean reads onto the reference genome with RSEM (Li and Dewey, 2011), the assembled Trinity transcript data was regarded as the reference sequence. The bowtie 2 mismatch parameter in RSEM was set to 0. The quantity of read counts for all genes was obtained from the mapping results and then normalized by FPKM (expected number of fragments per kilobase of transcript sequence per millions base pairs sequenced; Trapnell et al., 2010). Differential expression analysis of each sample was performed using the DESeq R package (1.10.1). DESeq provides statistical routines for detecting genes exhibiting differential expression with a negative binominal distribution model (Anders and Huber, 2010). To ensure the accuracy of the P-values, Benjamini and Hochberg's approach was used to control the false discovery rate (FDR), after which a P < 0.05 threshold was used to classify genes as differentially expressed. All DEGs were subjected to GO enrichment analysis. To adjust for gene length, a Wallenius non-central hyper-geometric distribution (Young et al., 2010) was applied in the GO enrichment analysis using the GOseq R package (Young et al., 2010). Next, KOBAS 2.0 (Mao et al., 2005) was utilized to test the statistical enrichment of DEGs in KEGG pathways, a database resource for understanding high-level functions within biological systems (Kanehisa et al., 2008). In KOBAS 2.0, a FDR ≤ 0.05 threshold was used for remarkable enrichment pathways, and the FDR parameter was set as BH in KOBAS 2.0. Finally, blastx was used to search the genome of a related species in the string database with the DEG sequences in order to obtain the protein–protein interactions. The results were then visualized in Cytoscape (Shannon et al., 2003).
SSR Detection and Primer Design
In order to identify and locate SSRs (Simple Sequence Repeats) from the unigenes, MISA 1.0 was used. It detected SSRs according to the following unit size and minimum repeat parameters: 1-10, 2-6, 3-5, 4-5, 5-5, and 6-5. SSR primers were designed using PRIMER 3 (2.3.4) with the following parameters: length range, 18–23, with 21 as optimal; PCR product size range, 100–300 bp; optimum annealing temperature, 55°C; and GC content, 40–60%, with 50% as optimal.
Survey of SSR Polymorphism
A total of 20 Sudan grass and sorghum accessions were used to identify SSR markers. We randomly chose 30 SSR primers to evaluate their polymorphism. DNA extractions were performed using the DNeasy Plant Mini Kit (Qiagen) from leaves of the 20 Sudan grass and sorghum accessions. PCR amplifications were conducted in a total reaction volume of 15 μL containing 1.5 μL of DNA, 0.5 μL of Golden DNA Polymerase (TIANGEN Biotech, Beijing, China), 7.5 μL of 2× Reaction Mix (TIANGEN), 0.6 μL of each primer, and 4.4 μL of ddH2O. The PCR reaction cycling profile was 94°C for 4 min followed by 35 cycles at 94°C for 40 s, 55–60°C for 40 s, 72°C for 1 min, and a final extension at 72°C for 10 min. PCR products were separated via gel electrophoresis on a 6% denaturing polyacrylamide gels at 350 V for 1 h alongside a 50-bp DNA marker used to assess product lengths. Then, we used 0.1% AgNO3 to stain the gel. Well amplified loci were identified using Gel Doc™ XR (Bio-Rad Laboratories Inc., Hercules, CA, USA).
Results and Discussion
Sequence Analysis and Transcript Assembly
Replicate cDNA libraries from Sudan grass leaf samples of plants grown under drought and control treatments (Supplementary Image 1) were constructed and sequenced on the Illumina HiSeq 2000 platform. A total of 852,543,826 raw reads were generated, and they have been deposited in the NCBI (National Center for Biotechnology Information) Short Read Archive (SRA: SRP095822). A total of 816,854,366 clean reads were identified after trimming adapters and filtering out low quality reads (Table 1). Using Trinity to further assemble the sequences, we obtained 149,395 contigs with a mean length of 1,386 bp, N50 of 2,366, and lengths of 201–24,422 bp, amounting to a total of 207,118,332 bp (Figure 3). The contigs were further assembled into 80,686 unigenes with a mean length of 938 bp and N50 of 1847 across a total of 75,697,479 bp (Figure 3). There are few Sudan grass ESTs in NCBI databases; however, Li et al. (2010) and Lu et al. (2009) used ESTs from Sorghum bicolor to explore SSRs in Sudan grass. Thus, the present results will serve as valuable genomic resources that will help identify more valuable SSRs.
TABLE 1
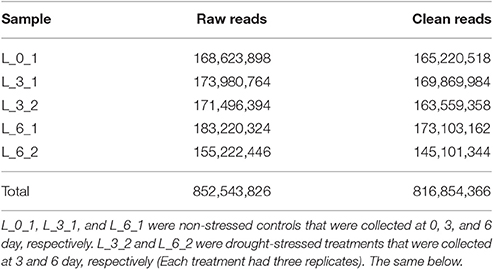
Table 1. Summary statistics of the Sudan grass transcriptome assemblies.
FIGURE 3
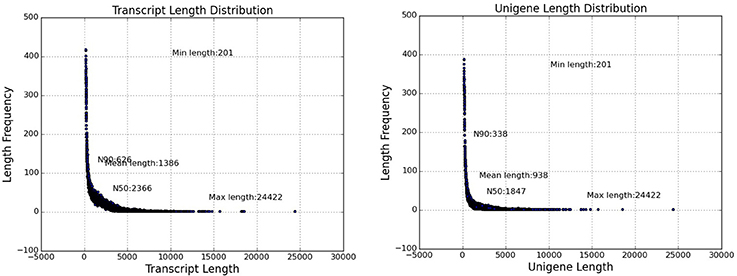
Figure 3. Transcriptome and unigene length distribution of Sudan grass.
Gene Function Annotation
A total of 80,686 unigenes were annotated successfully. Totals of 38,919 unigenes (48.23%) showed significant similarity to the NR database, 46,064 (57.09%) to the NT database, 11,223 (13.9%) to the KO database, 24,436 (30.28%) to the Swiss-Prot database, 26,786 (33.19%) to the PFAM database, 31,444 (38.97%) to the GO database, and 11,778 (14.58%) to the KOG database. When the sequences were compared to all databases, only 5,892 unigenes (7.3%) were annotated in all, while all 52,315 unigenes (64.83%) were annotated in at least one database according to Blastx search (Table 2).
TABLE 2
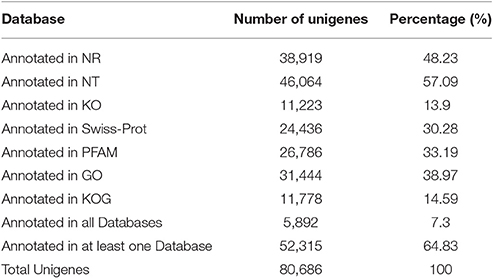
Table 2. Unigene information annotated in different databases.
To analyze the conservation of sequences, we compared Sudan grass sequences to those from other species. The top match was Sorghum bicolor (65.7% sequence identity), followed by Zea mays (14.9%), Setaria italica (4.6%), and Oryza sativa (2.9%; Figure 4). As expected, more than 88% of sequences among all unigenes had a top match with sequences from plants in the family Poaceae.
FIGURE 4
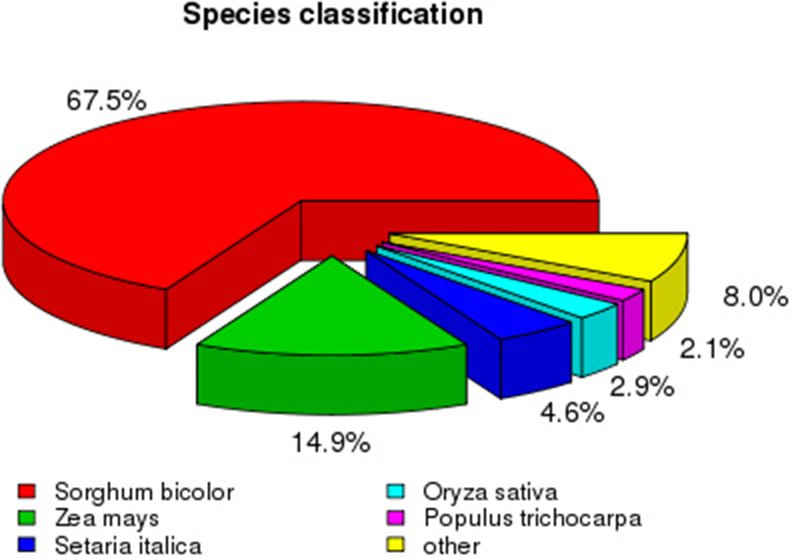
Figure 4. Species distribution of all the unigene sequences.
Among 80,686 unigenes, 45,065 (55.9%) were predicted to match CDSs with lengths ranging from 33 to 14,379 bp with an average length of 665 bp (Figure 5). ESTScan indicated that 34,128 of unigenes (42.3%) were predicted to match CDSs ranging in length from 51 to 10,476 bp with an average length of 336 bp (Figure 5).
FIGURE 5
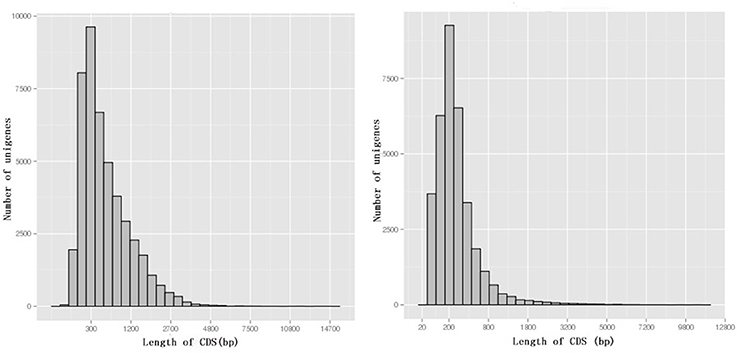
Figure 5. The length distribution of CDSs. BLAST results are on the left, while ESTScan results are on the right.
GO is an international standardized gene functional classification system with three ontologies: biological process (BP), molecular function (MF), and cellular component (CC; Wang et al., 2010). Each ontology offers a comprehensive description of the properties of genes. A total of 31,444 unigenes were annotated according to an analysis performed with Blast 2 GO. BP was the most abundantly represented according to GO, followed by CC and MF (Figure 6). Within BP, cellular process (18,850 unigenes, 21.0%) and metabolic process (18,499 unigenes, 20.6%) comprised the majority. Within MF, binding (19,070 unigenes, 46.5%) and catalytic activity (15,383 unigenes, 37.5%) contained the largest numbers of genes, while within CC, cell (13,495 unigenes, 21.4%) was almost as common as cell part (13,492, 21.4%), in agreement with Li et al. (2016).
FIGURE 6
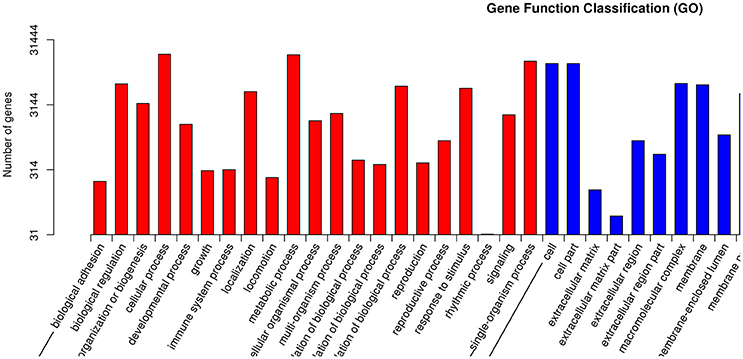
Figure 6. Gene Ontology classification of assembled unigenes.
Within the KOG analysis, 11,778 unigenes were identified to 25 categories. The largest number of unigenes were classified as “General function prediction only” (2,463 unigenes, 20.9%), followed by “Posttranslational modification, protein turnover, chaperones” (1,535 unigenes, 13.0%), and “Signal transduction mechanisms” (1,039 unigenes, 8.8%; Figure 7). However, in Sorghum, the category enriched for the most unigenes was “General function prediction only,” followed by “Replication, recombination, and repair” and “Posttranslational modification, protein turnover, chaperones.” Similarly, in sugarcane, unigenes were enriched in the “Replication, recombination and repair” category followed by “General function prediction only” and “Posttranslational modification, protein turnover, chaperones” (Cardoso-Silva et al., 2014). Likewise, Sudan grass grown under exposure to natural daylight, expressed genes that were enriched for “Replication, recombination and repair,” followed by “General function prediction only” and “Transcription” (Li et al., 2016). Thus, different species and different conditions yielded different classifications.
FIGURE 7
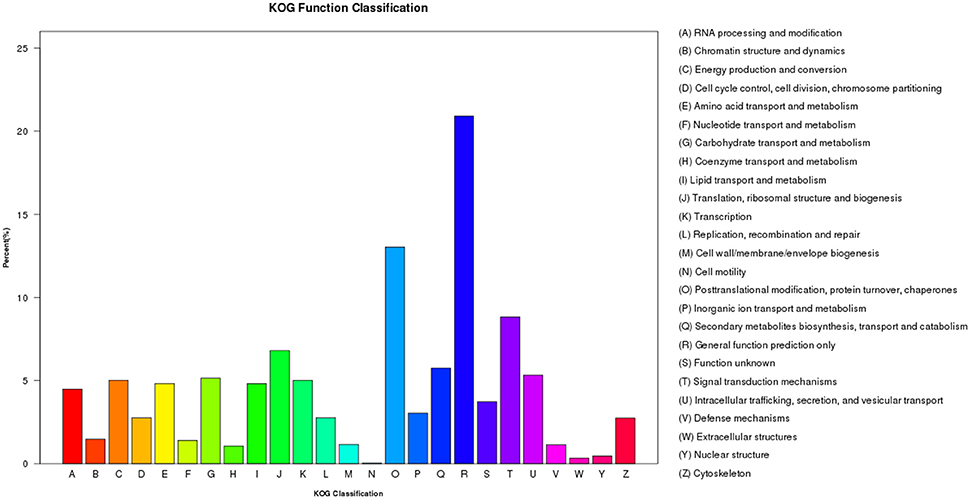
Figure 7. Histogram presentation of clusters of orthologous groups.
To better understand the biological functions of and interactions among genes, 11,223 unigenes were classified into 280 KEGG pathways. The pathways included Metabolism, Genetic Information Processing, Environmental Information Processing, Cellular Processes, Organismal Systems, and Human Diseases. Metabolic pathway contained the largest number of unigenes (5,871, 46.1%), followed by Genetic Information Processing (2,190, 17.2%), and Organismal Systems (2,189, 17.2%). Overall, Carbohydrate metabolism (1,071 unigenes, 8.4%) was the most among all pathways, while signal transduction (1,028 unigenes, 8.4%) contributed to Environmental Information Processing (Figure 8). Carbohydrate metabolism was heavily enriched in the KEGG analysis, in accordance with the results of Huang D. L. et al. (2016), as well as a similar study in orchardgrass (Huang et al., 2015).
FIGURE 8
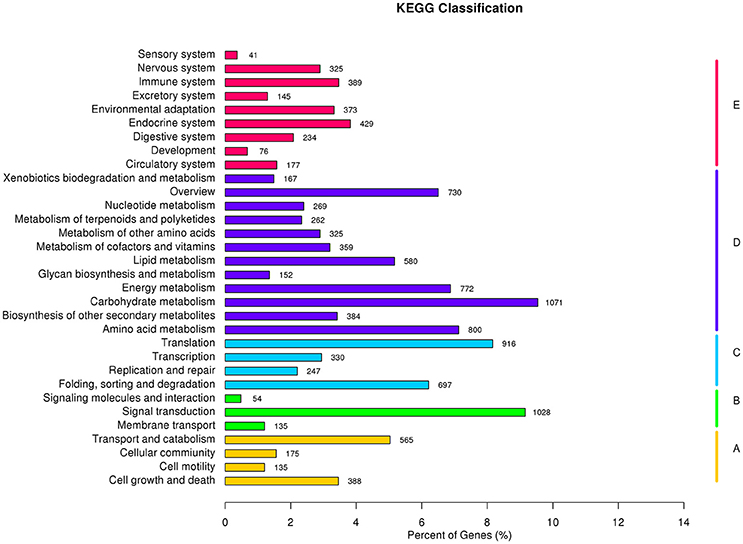
Figure 8. KEGG classification results: A, Cellular Processes; B, Environmental Information Processing; C, Genetic Information Processing; D, Metabolism; and E, Organismal Systems.
DEGs under Drought Stress
There were 4,903 and 3,466 DEGs identified by comparing expression on the 3rd day to the control expression levels of days 0 and 3, respectively (i.e., L_0_1 vs. L_3_2 and L_3_1 vs. L_3_2 comparisons). Comparisons between Sudan grass exposed to the PEG treatment for 6 days with the day 0 and 6 controls, revealed 9,512 and 6,194 DEGs, respectively (i.e., L_0_1 vs. L_6_2 and L_6_1 vs. L_6_2 comparisons), which indicated that expressions changes that had occurred by the 3rd day were smaller than those occurring by the 6th day. In contrast, the comparison between expression levels on the 3rd and 6th day of the PEG treatment (i.e., L_3_2 vs. L_6_2), revealed only 130 DEGs, with 5 and 125 genes down- and up-regulated, respectively. Few of the same DEGs changed in the 3rd and 6th days, but there were changes among all control samples over time (i.e., L_0_1 vs. L_3_1, L_0_1 vs. L_6_1, and L_3_1 vs. L_6_1; Table 3).
TABLE 3
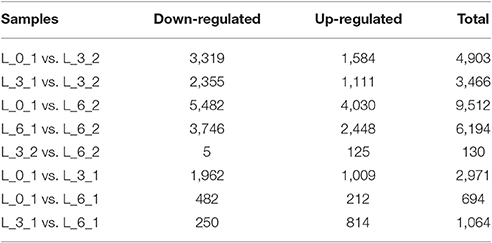
Table 3. Differentially expressed genes across two categories of Sudan grass.
To improve the accuracy of the results, we excluded DEGs that changed in the controls, finding 2,329 DEGs between the controls (0 and 3rd day) and the treatment of 3rd (i.e., L_0_1 vs. L_3_2 vs. L_3_1 vs. L_3_2), which including 1,531 and 785 DEGs down- and up-regulated, respectively. For the 6th days of the PEG treatment compared to the controls (0 and 6th day) (i.e., L_0_1 vs. L_6_2 vs. L_6_1 vs. L_6_2), there were 3,031 and 2,084 DEGs down- and up-regulated, respectively, in total of 5,101 DEGs been founded (Table 4). The DEGs enriched within KEGG pathways indicated Carbon fixation in photosynthetic organisms and Plant hormone signal transduction pathways play important roles in handling short-term drought stress. The next most enriched pathways were Phenylpropanoid biosynthesis, Glycolysis/Gluconeogenesis, and Photosynthesis (Figure 9). Lenka et al. (2011) also demonstrated that the Carbon fixation pathways play an important role in the drought responses of rice. However, under long term drought stress, the Plant hormone signal transduction pathways was most important, followed by Starch and sucrose metabolism and Phenylpropanoid biosynthesis (Figure 9). Huang et al. (2014) declared that the up-regulated genes stimulated by drought stress were enriched in the signal transduction pathway, agreeing with our results.
TABLE 4
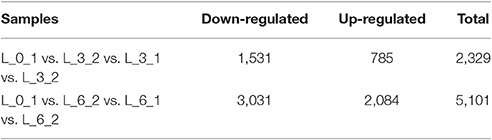
Table 4. Differentially expressed genes across four categories of Sudan grass.
FIGURE 9
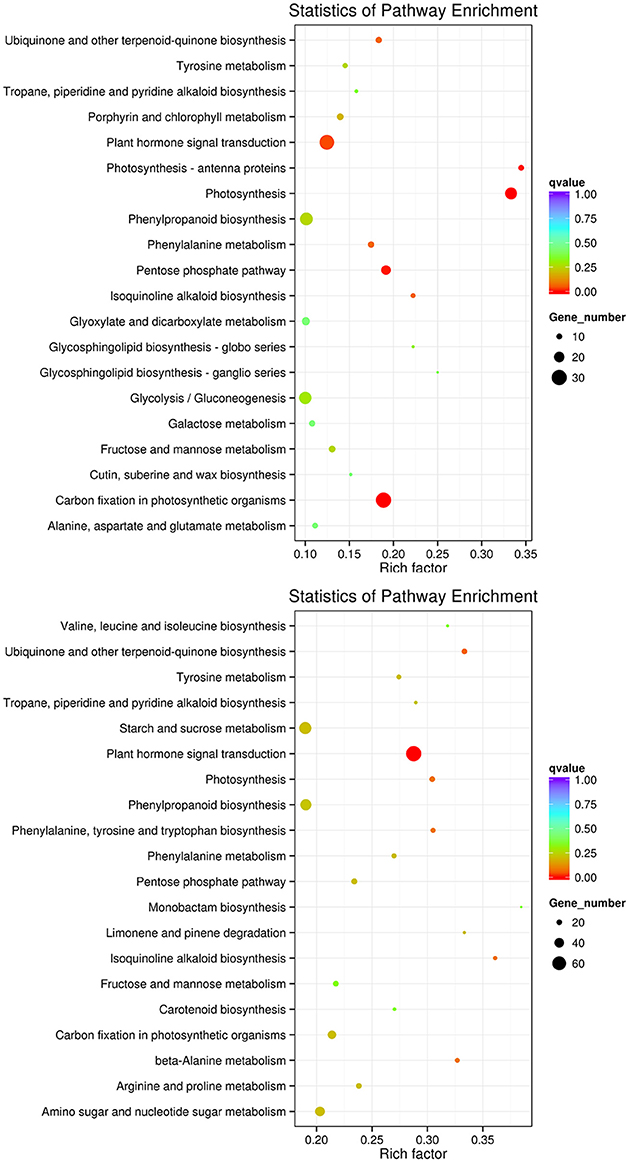
Figure 9. KEGG pathways enriched for DEGs by the 3rd and 6th days. KEGG pathways enriched for DEGs by the 3rd day are on the top, while those enriched by the 6th day are in the bottom.
To eliminate expression changes among the all controls (0, 3rd, and 6th day), Venn diagrams were examined (Figure 10), which revealed no genes were down-regulated by PEG stress, while five genes were up-regulated. The corresponding genes ID were c18079_g1, c21893_g1, c33865_g2, c34306_g1, and c35500_g3.
FIGURE 10
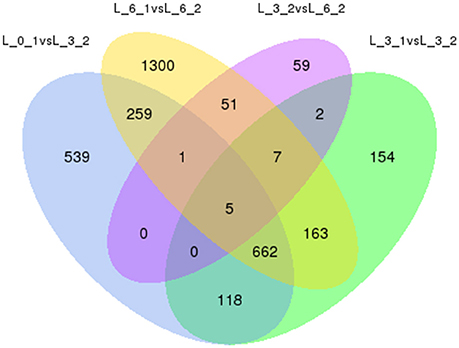
Figure 10. Analysis of DEGs with drought stress in Sudan grass. The left one is the up-regulation of DEGs, the right one is the down-regulation of DEGs.
To better understand the functions of these genes, we BLASTed these sequences against NR, NT, PFAM, KOG, Swiss-Prot, and GO databases. The c18079_g1 sequence is 612 bp (Appendix S1), and its NR and NT descriptions indicate it is a hypothetical protein that has been annotated in Sorghum bicolor. According to Swiss-Prot, it is similar to Arabidopsis thaliana's defensin-like protein. According to PFAM, it appears to belong to the Gamma-thionin family or Scorpion toxin-like domain. Lastly, GO analysis indicated it has a role in transport or defense response in BP, plasma membrane or ion channel inhibition or activity in MF, and plant-type in CC (Table 5). The first response to the drought stress is reducing water deficit by closure of stomata, which is also called hydropassive closure. When the stomata are open, water evaporates from guard cells. However, stomata are opened by the reversal of ion fluxes (Jouyban, 2012); c18079_g1 may be responsible for mediating this response.
TABLE 5
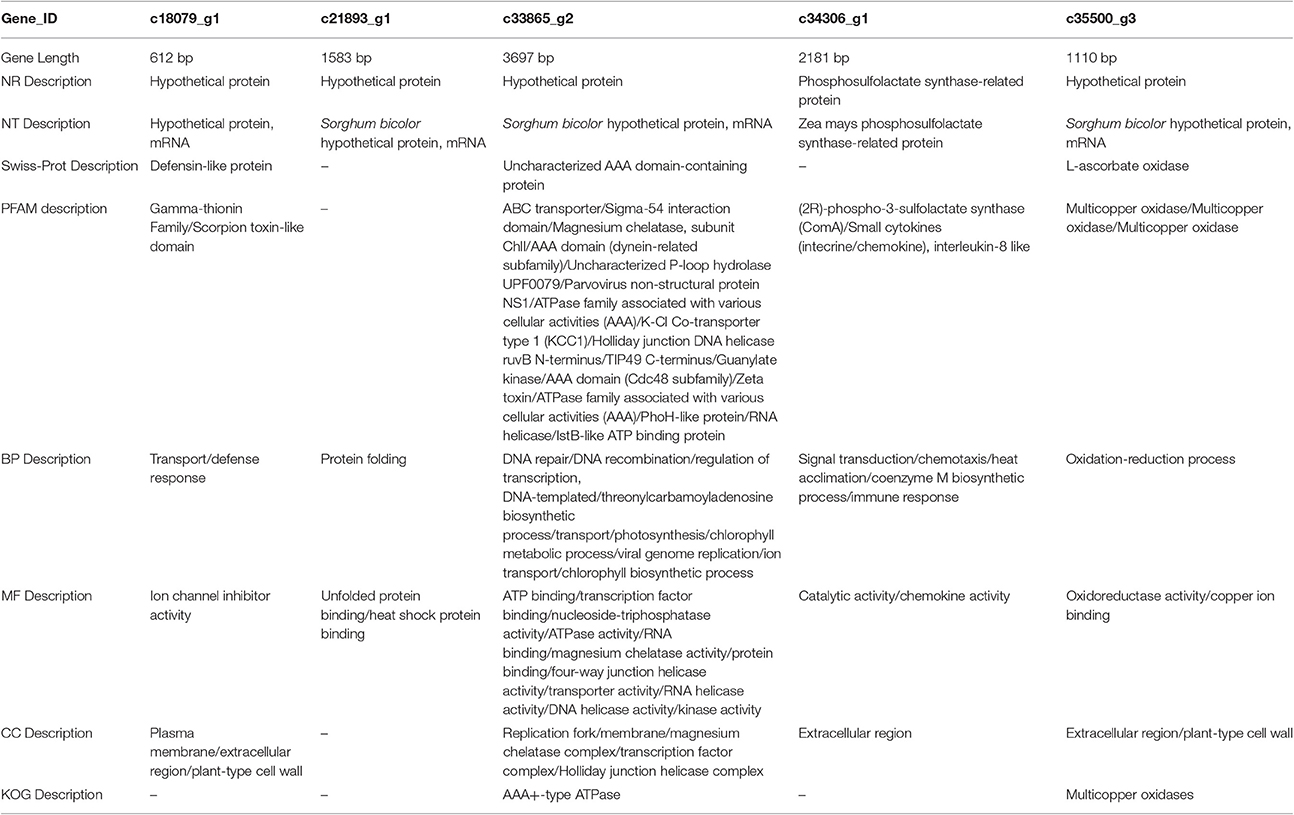
Table 5. Functions of DEGs according to various databases.
The second gene, c21893_g1, is 1,583 bp (Appendix S1), and it also strongly resembles the Sorghum bicolor hypothetical proteins in the NR and NT databases. However, we were unable to find any description of it in the PFAM, KOG, and Swiss-Prot databases, but in the GO database, the functions of the gene were protein folding and unfolded protein binding (BP) or heat shock protein binding (MF; Table 5). Buchanan et al. (2005) indicated that heat shock protein 17.2, heat shock protein 16.9, and HSP 70 were up-regulated by increased PEG stress in sorghum. Several studies reported that drought stress is often combined with heat shock (Wang and Huang, 2004; Mienie and De Ronde, 2008; Grigorova et al., 2011), perhaps explaining the up-regulation of this gene by drought stress in Sudan grass.
The third gene, c33865_g2, is the longest of all five (3,697 bp, Appendix S1). It is similar to the previous genes, which are similar to hypothetical proteins in Sorghum bicolor, but in contrast, it matches genes in all of the examined databases. It matches an uncharacterized AAA domain-containing protein from Schizosaccharomyces pombe in the Swiss-Prot database, and there were many BP, MF, and CC roles in the GO database (Table 6). The KOG database indicated the gene is an AAA+-type ATPase (Table 5). As an ABC transporter-like protein in sorghum, the gene has been shown to be up-regulated under drought stress (Buchanan et al., 2005). Deeba et al. (2012) also showed that activation of the ATP generation in groundnuts can improve drought tolerance. However, the actually function of this gene is unclear.
TABLE 6
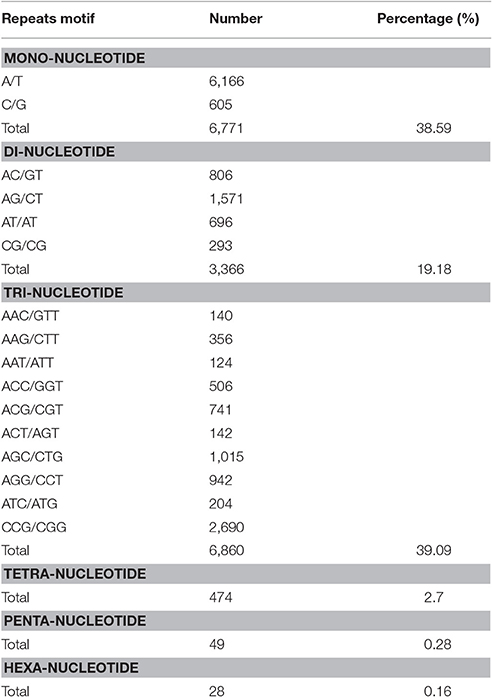
Table 6. SSR motifs.
The fourth gene, c34306_g, is 2,181 bp in length (Appendix S1). In the NR and NT databases, it matches the phosphosulfolactate synthase-related protein in Zea mays. The PFAM database indicated the gene is a (2R)-phospho-3-sulfolactate synthase (ComA) or Small cytokine (intecrine/chemokine), interleukin-8 like gene, whereas GO indicates it has a role in signal transduction, chemotaxis, heat acclimation, coenzyme M biosynthetic process, or immune response (BP); chemokine activity and catalytic activity (MF), and extracellular region (CC; Table 5). Graham et al. (2002) introduced the details of the biosynthetic pathway for coenzyme M. Phosphosulfolactate synthase and ComA catalyze the first step of the coenzyme M biosynthetic process (Liu et al., 2006), and c34306_g may be involved in this process.
The last gene, c35500_g3, is 1,110 bp (Appendix S1), and it is a hypothetical protein in the NR and NT databases. It matched a cucumber L-ascorbate oxidase in Swiss-Prot and a multicopper oxidase or copper ion binding protein in PFAM. In GO, c35500_g3 is characterized as having a role in the oxidation-reduction process (BP), oxidoreductase activity (MF), and extracellular region or plant-type cell wall (CC). Drought stress induces the accumulation of reactive oxygen species (ROS), and therefore ROS-scavenging is stimulated by drought. Osakabe et al. (2014) indicated that ascorbate oxidase plays an important role in scavenging cytosolic H2O2 (Table 5). The function of ascorbate oxidase was to protect integrated chloroplast proteins, and massive reports have shown that the overexpression of APX2 improved drought tolerance. Increased levels of thylakoid-bound ascorbate peroxidase have been identified in sorghum under drought stress (Buchanan et al., 2005). Dawson et al. (1975) reported that every molecule of ascorbate oxidase contains 8–10 atoms of copper, and this has been subsequently studied as an enzyme model for L-ascorbate oxidase (Ueda and Hanaki, 1984). Thus, this gene maybe involved in the pathway for ascorbate oxidase.
Finally, to ensure the accuracy of the Venn diagrams, we used more comparisons to analyze DEGs (5 combinations). These alternative results coincide with the main results. We again found the same five genes up-regulated and no genes down-regulated (Figure 11).
FIGURE 11
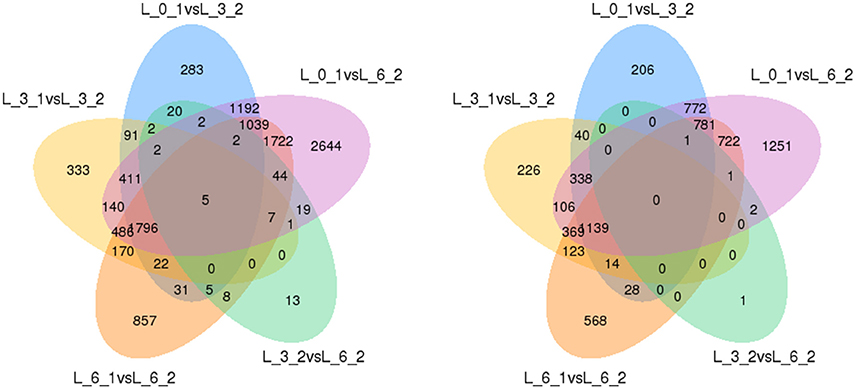
Figure 11. Venn diagrams of DEGs among 5 combinations. Up-regulated DEGs are on the left, while down-regulated DEGs are on the right.
Development and Validation of SSR Markers
We identified 17,548 SSRs obtained from 80,686 sequences totaling 75,697,479 bp. A total of 13,574 sequences contained SSRs. Of these, 2,965 sequences contained more than a single SSR, and 866 exhibited compound SSR formation. Trinucleotide repeat motifs were the most abundant among the six types of motifs, totaling 6,860 (39.09%). The second most abundant were mononucleotide motifs, totaling 6,771 (38.59%), followed by 3,366 dinucleotide motifs (19.18%), 474 tetranucleotide motifs (2.7%), 49 pentanucleotide motifs (0.28%), and 28 hexanucleotide motifs (0.16%). The most abundant motifs included mononucleotide A (91%), dinucleotide AG (47%), and trinucleotide CCG repeats (39%; Table 6).
The repeat counts ranged from 5 to 23. SSRs with 5–8 repeats were being most abundant, followed by those with 9–12 repeats (Figure 12). In sugarcane, trinucleotide motifs are perhaps most common among SSRs, which is consist with our results. Cardoso-Silva et al. (2014) reported that trinucleotide SSR motifs strongly impact the rate of frameshift mutations.
FIGURE 12
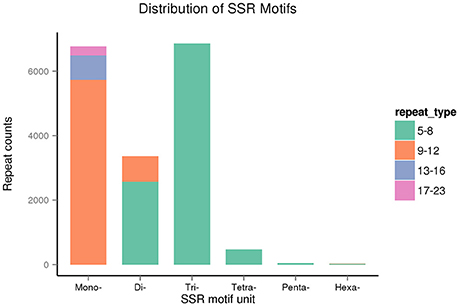
Figure 12. The distribution of SSR motifs in Sudan grass.
We randomly selected 30 primer pairs for amplification. Of these, 23 primer pairs (76.7%) successfully amplified products from genomic DNA from Sudan grass and Sorghum (though the remaining 7 primer pairs failed to generate PCR products). The failure of the primer pairs to amplify may have been caused by the location of primers across splice sites, introns, mutations, or indels.
In total, 124 amplified bands were detected from the PCR products of 23 primer pairs. The products of the primer pairs ranged from 134 to 280 bp. Among the 23 primers, the unigene c24737_g1 amplified by primer pair 23 showed the highest average polymorphism information content (PIC = 0.8304), followed by c25684_g1, which was amplified by primer pair 1 (PIC = 0.7608). However, according to Shannon's information index (I), c25493_g1 (amplified by primer pair 9) was the most diverse, (I = 0.6851), followed by c24737_g1 (amplified by primer pair 23). According to Nei's gene diversity (H), c10226_g1 (amplified by primer pair 7) exhibited the most variation (H = 0.5281), followed by c33403_g4 (amplified by primer pair 14; H = 0.5169). Among these 23 unigenes, the average PIC was 0.5327, I was 0.552, H was 0.439, and PPB was 78.18%. Therefore, these 23 unigenes showed high levels of diversity (Table 7).
TABLE 7
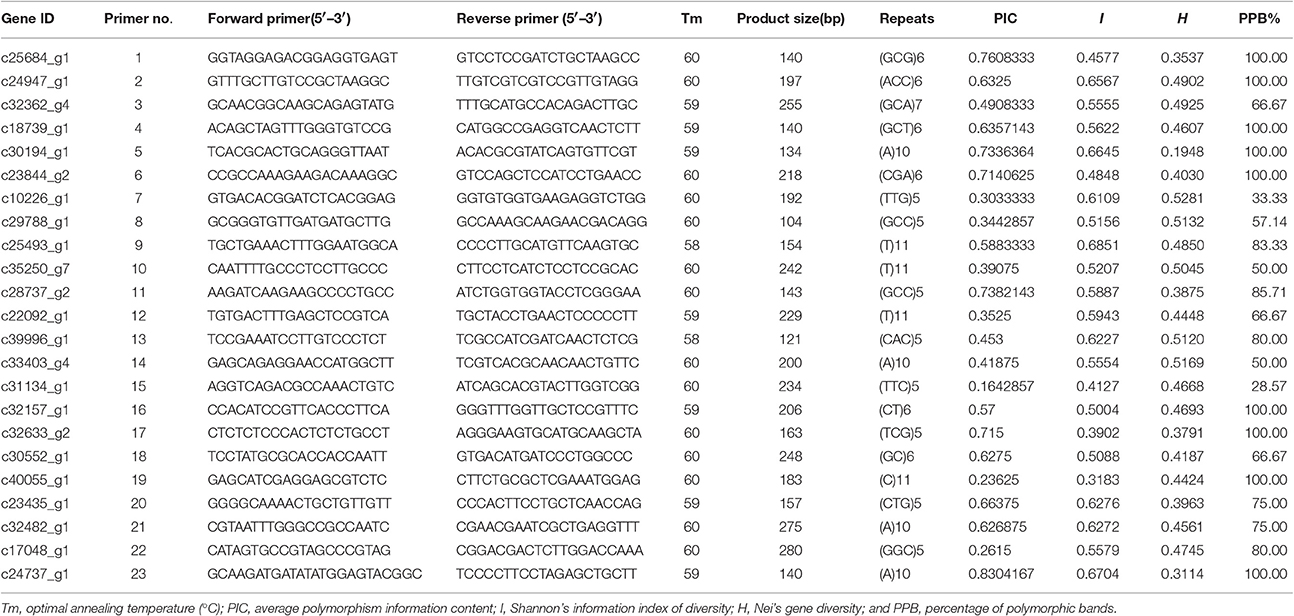
Table 7. Characterization of 23 novel microsatellite loci for Sudan grass.
SSR makers are extremely useful molecular makers that can be used for genetic linkage mapping, comparative mapping, and many other genotyping applications (Tang et al., 2009). These makers have many advantages including reliable reproducibility, co-dominance, and a high degree of operational transferability to other related species (Wang et al., 2002; Kaur et al., 2011). SSRs have been widely used in sorghum (Sanchez et al., 2002; Mace and Jordan, 2011; Upadhyaya et al., 2012; Hussein et al., 2014), but Li et al. (2016) reported important differences between sorghum and Sudan grass in indel markers. Few studies have tried to use ESTs from sorghum to design SSR markers in Sudan grass. Further genetic analyses of Sudan grass require the development of more SSR makers for the species. Our study has identified 17,548 SSRs that may be used to enhance the molecular breeding of Sudan grass.
Conclusion
In this study, we used NGS data to analyze the Sudan grass transcriptome under drought stress. We found 2,329 DEGs and 5,101 DEGs under a short- and long-term of 25% PEG treatment, respectively. And we also found five genes related to the drought stress strictly. Notably, those genes were up-regulated in Sudan grass under drought stress. This discovery may facilitate the development of transgenic breeding for drought resistance. We also developed a substantial number of new genetic markers, including SSRs, which can be broadly applied to understanding the genetics of Sudan grass.
Author Contributions
XZ, YZ, and XiaW conceived the project and designed the experiments; YZ, XiaW, and LH performed the experiments; YZ, XiaW, CL, WX, JP, ZL, and HY analyzed the data; YZ, XiaW, FL, XieW, LY, and DP finalized the manuscript; all authors discussed the results and reviewed the manuscript.
Conflict of Interest Statement
The authors declare that the research was conducted in the absence of any commercial or financial relationships that could be construed as a potential conflict of interest.
Acknowledgments
This research work was funded by the Modern Agro-industry Technology Research System (CARS-35-36, CARS-35-05), project 948 of the Agricultural Department of Sichuan Province (2014-Z53), the Fiscal Genetic Engineering Project in Sichuan province (2016TSCY-005), and the Funding of Outstanding Papers Promotion Project for Financial Innovation in Sichuan province (2014LWJJ-006).
Supplementary Material
The Supplementary Material for this article can be found online at: http://journal.frontiersin.org/article/10.3389/fpls.2017.00687/full#supplementary-material
Supplementary Image 1. Sudan grass exposed to 0% PEG (control; top) and 25% PEG (experimental treatment; bottom) at 6th day, with three replicates each.
Appendix S1. Five unigenes are differentially expressed among all controls and treatments of “Wulate No.1”. The c18079_g1, c21893_g1, c33865_g2, c34306_g1, and c35500_g3 indicate the name of unigenes; the bases below the name are the sequences of these five unigenes.
References
Al-Suhaibani, N. A. (2006). Effect of irrigation intervals and nitrogen fertilizer rates on fresh forage yield of Sudangrass [Sorghum sudanense (Piper) Stapf.]. Food Sci. Agric. Res.Center King Saud Univ. 142, 1–14. Available online at: http://hdl.handle.net/123456789/7970
Ali, M. L., Rajewski, J. F., Baenziger, P. S., Gill, K. S., Eskridge, K. M., and Dweikat, I. (2008). Assessment of genetic diversity and relationship among a collection of US sweet sorghum germplasm by SSR markers. Mol. Breed. 21, 497–509. doi: 10.1007/s11032-007-9149-z
Anders, S., and Huber, W. (2010). Differential expression analysis for sequence count data. Genome Biol. 11:R106. doi: 10.1186/gb-2010-11-10-r106
Ashraf, M. (2010). Inducing drought tolerance in plants: recent advances. Biotechnol. Adv. 28, 169–183. doi: 10.1016/j.biotechadv.2009.11.005
Ashrafi, H., Hill, T., Stoffel, K., Kozik, A., Yao, J., Chin-Wo, S. R., et al. (2012). De novo assembly of the pepper transcriptome (Capsicum annuum): a benchmark for in silico discovery of SNPs, SSRs and candidate genes. BMC Genomics 13:571. doi: 10.1186/1471-2164-13-571
Awad, A., Hafiz, S., Hammada, M. S., El-Nouby, A., and El-Hendawy, S. (2013). Grain yield production of Sudan grass (Sorghum sudanense (Piper) Stapf.) as influenced by cutting numbers, potassium rates, and intrarow spacing in a semiarid environment. Turk. J. Agric. Forestry 37, 657–664. doi: 10.3906/tar-1208-53
Bibi, A., Sadaqat, H., Akram, H. M., Khan, T. M., and Usman, B. F. (2010). Physiological and agronomic responses of sudangrass to water stress. J. Agric. Res. 48, 369–380. Available online at: https://www.researchgate.net/publication/281541636
Billot, C., Ramu, P., Bouchet, S., Chantereau, J., Deu, M., Gardes, L., et al. (2013). Massive sorghum collection genotyped with SSR markers to enhance use of global genetic resources. PLoS ONE 8:e59714. doi: 10.1371/journal.pone.0059714
Buchanan, C. D., Lim, S., Salzman, R. A., Kagiampakis, I., Morishige, D. T., Weers, B. D., et al. (2005). Sorghum bicolor's transcriptome response to dehydration, high salinity and ABA. Plant Mol. Biol. 58, 699–720. doi: 10.1007/s11103-005-7876-2
Cardoso-Silva, C. B., Costa, E. A., Mancini, M. C., Balsalobre, T. W. A., Canesin, L. E. C., Pinto, L. R., et al. (2014). De novo assembly and transcriptome analysis of contrasting sugarcane varieties. PLoS ONE 9:e88462. doi: 10.1371/journal.pone.0088462
Chen, Q., Wei, S. S., Deng, Z. R., Yin, L. P., He, B., and Kong, X. L. (2009). Optimization of DNA extraction from seeds of Sorghum sudanense (Piper) Stapf. Notulae Botanicae Horti Agrobotanici Cluj-Napoca 37, 256. doi: 10.15835/nbha3713132
Dawson, C. R., Strothkamp, K. G., and Krul, K. G. (1975). Ascorbate oxidase and related copper proteins. Ann. N. Y. Acad. Sci. 258, 209–220. doi: 10.1111/j.1749-6632.1975.tb29281.x
Deeba, F., Pandey, A. K., Ranjan, S., Mishra, A., Singh, R., Sharma, Y. K., et al. (2012). Physiological and proteomic responses of cotton (Gossypium herbaceum, L.) to drought stress. Plant Physiol. Biochem. 53, 6–18. doi: 10.1016/j.plaphy.2012.01.002
Fox, S. E., Preece, J., Kimbrel, J. A., Marchini, G. L., Sage, A., Youens-Clark, K., et al. (2013). Sequencing and de novo transcriptome assembly of Brachypodium sylvaticum (Poaceae). Appl. Plant Sci. 1:1200011. doi: 10.3732/apps.1200011
Geleta, N., Labuschagne, M. T., and Viljoen, C. D. (2006). Genetic diversity analysis in sorghum germplasm as estimated by AFLP, SSR and morpho-agronomical markers. Biodivers. Conserv. 15, 3251–3265. doi: 10.1007/s10531-005-0313-7
Götz, S., García-Gómez, J. M., Terol, J., Williams, T. D., Nagaraj, S. H., Nueda, M. J., et al. (2008). High-throughput functional annotation and data mining with the Blast2GO suite. Nucleic Acids Res. 36, 3420–3435. doi: 10.1093/nar/gkn176
Grabherr, M. G., Haas, B. J., Yassour, M., Levin, J. Z., Thompson, D. A., Amit, I., et al. (2011). Full-length transcriptome assembly from RNA-Seq data without a reference genome. Nat. Biotechnol. 29, 644–652. doi: 10.1038/nbt.1883
Graham, D. E., Xu, H., and White, R. H. (2002). Identification of coenzyme m biosynthetic 8 phosphosulfolactate synthase: a new family of sulfonate-biosynthesizing enzymes. J. Biol. Chem. 277, 13421–13429. doi: 10.1074/jbc.M201011200
Grigorova, B., Vaseva, I., Demirevska, K., and Feller, U. (2011). Combined drought and heat stress in wheat: changes in some heat shock proteins. Biol. Plant. 55, 105–111. doi: 10.1007/s10535-011-0014-x
Huang, D. L., Gao, Y. J., Gui, Y. Y., Chen, Z. L., Qin, C. X., Wang, M., et al. (2016). Transcriptome of High-sucrose sugarcane variety GT35. Sugar Tech 18, 520. doi: 10.1007/s12355-015-0420-z
Huang, L. K., Yan, H. D., Zhao, X. X., Zhang, X. Q., Wang, J., Frazier, T., et al. (2015). Identifying differentially expressed genes under heat stress and developing molecular markers in orchardgrass (Dactylis glomerata L.) through transcriptome analysis. Mol. Ecol. Resour. 15, 1497–1509. doi: 10.1111/1755-0998.12418
Huang, L. Y., Zhang, F., Wang, W. S., Zhou, Y. L., Fu, B. Y., and Li, Z. K. (2014). Comparative transcriptome sequencing of tolerant rice introgression line and its parents in response to drought stress. BMC Genomics 15:1026. doi: 10.1186/1471-2164-15-1026
Huang, X., Yan, H. D., Zhang, X. Q., Zhang, J., Frazier, T. P., Huang, D. J., et al. (2016). De novo transcriptome analysis and molecular marker development of two Hemarthria species. Front. Plant Sci. 7:496. doi: 10.3389/fpls.2016.00496
Hussein, A. A. E., Siddig, M. A. E., Abdalla, A. W. H., Dweikat, I., and Baenziger, S. (2014). Ssr and srap markers-based genetic diversity in sorghum (sorghum bicolor (L.) moench) accessions of sudan. Int. J. Plant Breed. Genet. 8, 89–99. doi: 10.3923/ijpbg.2014.89.99
Jouyban, Z. (2012). Study of effects of drought stress in plants. Tech. J. Eng. Appl. Sci. 2, 172–176.
Kanehisa, M., Araki, M., Goto, S., Hattori, M., Hirakawa, M., Itoh, M., et al. (2008). KEGG for linking genomes to life and the environment. Nucleic Acids Res. 36 D480–D484. doi: 10.1093/nar/gkm882
Kaur, S., Cogan, N. O., Pembleton, L. W., Shinozuka, M., Savin, K. W., Materne, M., et al. (2011). Transcriptome sequencing of lentil based on second-generation technology permits large-scale unigene assembly and SSR marker discovery. BMC Genomics 12:265. doi: 10.1186/1471-2164-12-265
Kreps, J. A., Wu, Y., Chang, H. S., Zhu, T., Wang, X., and Harper, J. F. (2002). Transcriptome changes for Arabidopsis in response to salt, osmotic, and cold stress. Plant Physiol. 130, 2129–2141. doi: 10.1104/pp.008532
Lenka, S. K., Katiyar, A., Chinnusamy, V., and Bansal, K. C. (2011). Comparative analysis of drought-responsive transcriptome in Indica rice genotypes with contrasting drought tolerance. Plant Biotechnol. J. 9, 315–327. doi: 10.1111/j.1467-7652.2010.00560.x
Li, B., and Dewey, C. (2011). RSEM: accurate transcript quantification from RNA-Seq data with or without a reference genome. BMC Bioinformatics 12:323. doi: 10.1186/1471-2105-12-323
Li, J. Q., Wang, L. H., Zhan, Q. W., and Chen, Y. (2010). Establishment of sorghum EST-SSR marker and its preliminary application to sudangrass. Pratacultural Sci. 27, 112–117.
Li, J., Wang, L., Zhan, Q., Liu, Y., and Yang, X. (2016). Transcriptome characterization and functional marker development in Sorghum sudanense. PLoS ONE 11:e0154947. doi: 10.1371/journal.pone.0154947
Liu, N. Y., Hsieh, W. J., Liu, H. C., and Charng, Y. Y. (2006). Hsa32, a phosphosulfolactate synthase-related heat-shock protein, is not involved in sulfolipid biosynthesis in arabidopsis. Bot. Stud. 47, 389–394.
Lu, J., Zhan, Q. W., Lu, J. B., Li, J. Q., and Wang, M. (2009). Development of EST-SSR marker in sorghum and sudangrass. Acta Laser Biol. Sin. 18, 389–394.
Mace, E. S., and Jordan, D. R. (2011). Integrating sorghum whole genome sequence information with a compendium of sorghum QTL studies reveals uneven distribution of QTL and of gene-rich regions with significant implications for crop improvement. Theor. Appl. Genet. 123, 169–191. doi: 10.1007/s00122-011-1575-y
Mao, X. Z., Cai, T., Olyarchuk, J. G., and Wei, L. P. (2005). Automated genome annotation and pathway identification using the KEGG Orthology (KO) as a controlled vocabulary. Bioinformatics 21, 3787–3793. doi: 10.1093/bioinformatics/bti430
Menz, M. A., Klein, R. R., Mullet, J. E., Obert, J. A., Unruh, N. C., and Klein, P. E. (2002). A high-density genetic map of Sorghum bicolor (L.) moench based on 2926 AFLP®, RFLP and SSR markers. Plant Mol. Biol. 48, 483–499. doi: 10.1023/A:1014831302392
Mienie, A., and De Ronde, J. A. (2008). A comparison of drought stress and heat stress in the leaves and tubers of 12 potato cultivars: research letter. S. Afr. J. Sci. 104, 156–159.
Mutisya, J., Sitieney, J. K., and Gichuki, S. T. (2010). Phenotypic and physiological aspects related to drought tolerance in sorghum. Afr. Crop Sci. J. 18, 175–182. doi: 10.4314/acsj.v18i4.68645
Osakabe, Y., Osakabe, K., Shinozaki, K., and Tran, L. S. (2014). Response of plants to water stress. Front. Plant Sci. 5:86. doi: 10.3389/fpls.2014.00086
Pan, L., Zhang, X. Q., Wang, J. P., Ma, X., Zhou, M. L., Huang, L. K., et al. (2016). Transcriptional profiles of drought-related genes in modulating metabolic processes and antioxidant defenses in Lolium multiflorum. Front. Plant Sci. 7:519. doi: 10.3389/fpls.2016.00519
Rangaswami Ayyangar, G. N., and Ponnaiya, B. W. X. (1939). Studies in Sorghum sudanense, Stapf-The Sudan grass. Proc. Plant Sci. 10, 237–254.
Sanchez, A. C., Subudhi, P. K., Rosenow, D. T., and Nguyen, H. T. (2002). Mapping QTLs associated with drought resistance in sorghum (Sorghum bicolor L. moench). Plant Mol. Biol. 48, 713–726. doi: 10.1023/A:1014894130270
Shanker, A. K., Maheswari, M., Yadav, S. K., Desai, S., Bhanu, D., Attal, N. B., et al. (2014). Drought stress responses in crops. Funct. Integr. Genomics 14, 11–22. doi: 10.1007/s10142-013-0356-x
Shannon, P., Markiel, A., Ozier, O., Baliga, N. S., Wang, J. T., Ramaga, D., et al. (2003). Cytoscape: a software environment for integrated models of biomolecular interaction networks. Genome Res. 13, 2498–2504. doi: 10.1101/gr.1239303
Shinozaki, K., and Yamaguchi-Shinozaki, K. (2007). Gene networks involved in drought stress response and tolerance. J. Exp. Bot. 58, 221–227. doi: 10.1093/jxb/erl164
Smith, J. S. C., Kresovich, S., Hopkins, M. S., Mitchell, S. E., Dean, R. E., Woodman, W. L., et al. (2000). Genetic diversity among elite sorghum inbred lines assessed with simple sequence repeats. Crop Sci. 40, 226–232. doi: 10.2135/cropsci2000.401226x
Smith, S. J., Dillow, D. W., and Young, L. B. (1982). Disposition of fertilizer nitrate applied to sorghum-sudangrass in the Southern Plains. J. Environ. Qual. 11, 341–344. doi: 10.2134/jeq1982.00472425001100030002x
Summer, D. C., Martin, W. E., and Etchegaray, H. S. (1965). Dry matter and protein yields and nitrate content of Piper sudangrass (Sorghum sudanense (Piper) Stapf.) in response to nitrogen fertilization. Agron. J. 57, 351–354. doi: 10.2134/agronj1965.00021962005700040012x
Surget-Groba, Y., and Montoya-Burgos, J. I. (2010). Optimization of de novo transcriptome assembly from next-generation sequencing data. Genome Res. 20, 1432–1440. doi: 10.1101/gr.103846.109
Tang, S., Okashah, R. A., Cordonnier-Pratt, M. M., Pratt, L. H., Johnson, V. E., Taylor, C. A., et al. (2009). EST and EST-SSR marker resources for Iris. BMC Plant Biol. 9:72. doi: 10.1186/1471-2229-9-72
Trapnell, C., Williams, B. A., Pertea, G., Mortazavi, A., Kwan, G., Baren, M. J. V., et al. (2010). Transcript assembly and quantification by RNA-Seq reveals unannotated transcripts and isoform switching during cell differentiation. Nat. Biotech. 28, 511–515. doi: 10.1038/nbt.1621
Ueda, J. I., and Hanaki, A. (1984). Copper (II)-poly(L-histidine) as an enzyme model for L-ascorbate oxidase. Bull. Chem. Soc. Jpn. 57, 3511–3516. doi: 10.1246/bcsj.57.3511
Upadhyaya, H. D., Wang, Y. H., Sharma, S., Singh, S., and Hasenstein, K. H. (2012). SSR markers linked to kernel weight and tiller number in sorghum identified by association mapping. Euphytica 187, 401–410. doi: 10.1007/s10681-012-0726-9
Wang, W., Vinocur, B., and Altman, A. (2003). Plant responses to drought, salinity and extreme temperatures: towards genetic engineering for stress tolerance. Planta 218, 1–14. doi: 10.1007/s00425-003-1105-5
Wang, Y., Georgi, L. L., Zhebentyayeva, T. N., Reighard, G. L., Scorza, R., and Abbott, A. G. (2002). High-throughput targeted SSR marker development in peach (Prunus persica). Genome 45, 319–328. doi: 10.1139/g01-153
Wang, Y. H., Bible, P., Loganantharaj, R., and Upadhyaya, H. D. (2012). Identification of SSR markers associated with height using pool-based genome-wide association mapping in sorghum. Mol. Breed. 30, 281–292. doi: 10.1007/s11032-011-9617-3
Wang, Z., and Huang, B. (2004). Physiological recovery of kentucky bluegrass from simultaneous drought and heat stress. Crop Sci. 44, 1729–1736. doi: 10.2135/cropsci2004.1729
Wang, Z. Y., Fang, B. P., Chen, J. Y., Zhang, X. J., Luo, Z. X., Huang, L. F., et al. (2010). De novo assembly and characterization of root transcriptome using Illumina paired-end sequencing and development of cSSR markers in sweetpotato (Ipomoea batatas). BMC Genomics 11:726. doi: 10.1186/1471-2164-11-726
Wei, L., Luo, C., Li, X., and Shen, Z. (2008). Copper accumulation and tolerance in Chrysanthemum coronarium L. and Sorghum sudanense L. Arch. Environ. Contam. Toxicol. 55, 238–246. doi: 10.1007/s00244-007-9114-1
Wu, Y. Q., and Huang, Y. (2006). An SSR genetic map of Sorghum bicolor (L.) Moench and its comparison to a published genetic map. Genome 50, 84–89. doi: 10.1139/g06-133
Young, M. D., Wakefield, M. J., Smyth, G. K., and Oshlack, A. (2010). Gene ontology analysis for RNA-seq: accounting for selection bias. Genome Biol. 11:R14. doi: 10.1186/gb-2010-11-2-r14
Zamfir, M. C., Schitea, M., and Zamfir, I. (2001). The variability study of some quantitative traits in Sudan grass [Sorghum sudanense Piper(Staph.)]. Rom. Agric. Res. 1, 23–30. Available online at: https://www.researchgate.net/publication/242626066
Keywords: Sudan grass, next-generation sequencing, differentially expressed genes, simple sequence repeat markers, PEG
Citation: Zhu Y, Wang X, Huang L, Lin C, Zhang X, Xu W, Peng J, Li Z, Yan H, Luo F, Wang X, Yao L and Peng D (2017) Transcriptomic Identification of Drought-Related Genes and SSR Markers in Sudan Grass Based on RNA-Seq. Front. Plant Sci. 8:687. doi: 10.3389/fpls.2017.00687
Received: 30 November 2016; Accepted: 13 April 2017;
Published: 04 May 2017.
Edited by:
Zhulong Chan, Huazhong Agricultural University, ChinaReviewed by:
Bin Xu, Nanjing Agricultural University, ChinaMeiliang Zhou, Chinese Academy of Agricultural Sciences, China
Copyright © 2017 Zhu, Wang, Huang, Lin, Zhang, Xu, Peng, Li, Yan, Luo, Wang, Yao and Peng. This is an open-access article distributed under the terms of the Creative Commons Attribution License (CC BY). The use, distribution or reproduction in other forums is permitted, provided the original author(s) or licensor are credited and that the original publication in this journal is cited, in accordance with accepted academic practice. No use, distribution or reproduction is permitted which does not comply with these terms.
*Correspondence: Xinquan Zhang, zhangxq@sicau.edu.cn
†These authors have contributed equally to this work.