 Jin-Xue Li1,2†
 Xiao-Jin Hou3†Jiao Zhu3Jing-Jing Zhou4*Hua-Bin Huang2Jian-Qiang Yue2Jun-Yan Gao2Yu-Xia Du2Cheng-Xiao Hu3
 Chun-Gen Hu3
 Jin-Zhi Zhang3*
- 1College of Resources and Environment, Huazhong Agricultural University, Wuhan, China
- 2Institute of Tropical and Subtropical Cash Crops, Yunnan Academy of Agricultural Sciences, Kunming, China
- 3Key Laboratory of Horticultural Plant Biology (Ministry of Education), College of Horticulture and Forestry Science, Huazhong Agricultural University, Wuhan, China
- 4College of Horticulture and Forestry Science, Huazhong Agricultural University, Wuhan, China
Water deficit is a key factor to induce flowering in many woody plants, but reports on the molecular mechanisms of floral induction and flowering by water deficit are scarce. Here, we analyzed the morphology, cytology, and different hormone levels of lemon buds during floral inductive water deficits. Higher levels of ABA were observed, and the initiation of floral bud differentiation was examined by paraffin sections analysis. A total of 1638 differentially expressed genes (DEGs) were identified by RNA sequencing. DEGs were related to flowering, hormone biosynthesis, or metabolism. The expression of some DEGs was associated with floral induction by real-time PCR analysis. However, some DEGs may not have anything to do with flowering induction/flower development; they may be involved in general stress/drought response. Four genes from the phosphatidylethanolamine-binding protein family were further investigated. Ectopic expression of these genes in Arabidopsis changed the flowering time of transgenic plants. Furthermore, the 5′ flanking region of these genes was also isolated and sequence analysis revealed the presence of several putative cis-regulatory elements, including basic elements and hormone regulation elements. The spatial and temporal expression patterns of these promoters were investigated under water deficit treatment. Based on these findings, we propose a model for citrus flowering under water deficit conditions, which will enable us to further understand the molecular mechanism of water deficit-regulated flowering in citrus.
Highlight:
Based on gene activity during floral inductive water deficits identified by RNA sequencing and genes associated with lemon floral transition, a model for citrus flowering under water deficit conditions is proposed.
Introduction
The transition from vegetative to reproductive growth is an important life-history event for flowering plants (Khan et al., 2014). Studies on the biology of flowering of model plants have identified several flowering regulatory pathways, such as the vernalization, photoperiod, circadian clock, age, autonomous, and gibberellin (GA) pathways (Khan et al., 2014). Different signaling pathways responding to endogenous and environmental signals converge on several floral integrator genes including FLOWERING LOCUS T (FT), CONSTANS (CO), SUPPRESSOR OF OVEREXPRESSION OF CONSTANS 1 (SOC1), FLOWERING LOCUS C (FLC), LEAFY (LFY) (Wahl et al., 2013; Khan et al., 2014). Among them, FT encodes a mobile florigen signal. SOC1 encodes a MADS box protein and regulates the expression of floral meristem identity genes (LFY), which links floral induction, inflorescence development and flowering (Liu et al., 2008). FLC is also a MADS box gene and strong suppressor of flowering (Michaels and Amasino, 1999). Other genes such as SHORT VEGETATIVE PHASE (SVP), TERMINAL FLOWER 1 (TFL1), TWIN SISTER OF FT (TSF), and BROTHER OF FT and TFL1 (BFT) are known to be suppressors of flower development and flowering (Guitton et al., 2012; Kazan and Lyons, 2016). Recent studies suggested that these genes are also key regulators of flower development and flowering time in citrus (Tan and Swain, 2007; Zhang et al., 2009a,b; Li et al., 2010; Chica and Albrigo, 2013a).
Traditionally, plant stress-regulated flowering is not formally recognized as a flowering pathway in past studies (Franks et al., 2007; Kazan and Lyons, 2016). However, several studies suggested that stress factors play key roles in controlling plant flowering (Chica and Albrigo, 2013a; Shanker et al., 2014; Kazan and Lyons, 2016). Water deficit is main stress factor that affects agricultural production, particularly irrigated land. For many annual and perennial plants, the emergence of flowering coincides with water deficit stress to ensure successful reproduction, a response known as “drought-escape” (Franks et al., 2007; Kazan and Lyons, 2016). Interestingly, flowering pathways play key roles in modulating drought tolerance (Riboni et al., 2013; Kazan and Lyons, 2016). Genetic knockouts in Arabidopsis have connected water deficit to ABA signaling as well as to several important genes in the flowering pathway (Kooyers, 2015). GIGANTEA (GI), FT, and TSF are key regulators of the drought-escape response (Riboni et al., 2013, 2016). Drought led to increased peak levels of GI. The mutant gi could not flower under drought stress (Riboni et al., 2013). The latest evidence suggests that ABA-dependent control of GI transcription enables “drought-escape” via up-regulation of FT expression in model plants (Riboni et al., 2016). GI does have other roles in carbon signaling and starch metabolism as well as interactions with the GA pathway (Putarjunan and Rodermel, 2014). Although genetic mechanisms connecting the drought response and flowering have been elucidated in model plants, how plants regulate flowering in response to drought remains poorly understood in woody plants.
Citrus is one of the most important and widely fruit crops (Tan and Swain, 2007; Xu et al., 2013). Citrus mainly bloom in the spring following the winter rest period in subtropical climates, similar to the normal response for temperate-zone deciduous fruit trees. However, the flowering of some important citrus varieties is induced during the dry season with flowering after the first effective rains of the rainy season in tropical regions (Chica and Albrigo, 2013a). Therefore, low-temperatures and water deficit are two key factors in flowering induction in sweet orange (Moss, 1969). Low-temperature (15°C) has been shown to directly affect the expression of FT homologs in Satsuma mandarin (Nishikawa et al., 2007). In sweet orange, FT responds rapidly (overnight) to floral inductive low-temperatures and requires alternation of light and dark cycles during induction (Chica and Albrigo, 2013b). In addition, some MADS box genes are also involved in the low-temperature regulation of flowering and bud dormancy in trifoliate orange typically FLC and SVP (Zhang et al., 2009a; Li et al., 2010). PtFLC was up-regulated expression during endodormancy (winter), and its expression is reduced after dormancy release (spring) in trifoliate orange (Zhang et al., 2009a). Similarly, PtSVP has also been involved in terminal bud formation and growth cessation (Li et al., 2010). Water deficit is another key floral inductive factor described in citrus (Southwick and Davenport, 1986; Chica and Albrigo, 2013a). For example, exposure to severe water deficit for 5 weeks produced maximum flowering intensity compared with milder deficit in Tahiti lime (Citrus latifolia) (Southwick and Davenport, 1986). A recent report suggested that water deficit induces flowering through the up-regulation of FT (Chica and Albrigo, 2013a). However, reports on the molecular mechanisms of floral induction and flowering by water deficit in citrus are still scarce. Therefore, enhanced understanding of the links between water deficit and flowering is essential for engineering drought tolerance in citrus.
To understand the impacts of water deficit on floral induction in lemon, we treated 1- to 2-year-old lemon [C. limon (L.) Burm. f.] trees cultivar (Femminello) and observed their morphological changes. We also examined gene expression by RNA sequencing, identifying 1000s of genes potentially involved in water deficit responses in flowering induction. In particular, we found that four genes from the phosphatidylethanolamine-binding protein (PEBP) family were important for flowering of lemon. Together, the results provide evidence for regulation of citrus floral induction under water deficit conditions and establish a foundation for advanced research on functional flowering genes in citrus and similar plants.
Materials and Methods
Plant Material and Experimental Conditions
All plants were grown in the greenhouse of the Institute of Tropical and Subtropical Cash Crops, Yunnan Academy of Agriculture Sciences. We used 2-year-old lemon trees (Femminello) propagated by bud grafting to trifoliate orange rootstocks, 80 and 15 healthy trees were selected for water deficit-treated and control, respectively. The trees ranged in height from 1 to 1.5 m growing in 52-cm plastic pots containing potting mix of commercial medium and perlite (3:1). Trees in the greenhouse were exposed to natural variations in photoperiod throughout the experiment during Summer (from June to July) 2015. Before the water deficit treatment, trees were kept in a greenhouse and watered every 2 days to saturation. Minimum and maximum temperatures were 23 and 31°C, respectively. At the beginning of the water deficit, trees were fully watered and soil moisture was measured 4 h later by Theta probe type ML2x (Delta-T Devices Ltd., Cambridge, England), and the soil water naturally evaporated until reaching the set level (around 15%). Then the soil moisture was maintained by accurately watering according to the daily loss of water (pots were weighed and watered thrice per day). Leaf water potential was measured with a pressure chamber (PMS Instrument Co., Corvallis, OR, United States), thrice per day (10:00 am, 2:00 pm, and 6:00 pm). After 2 weeks, trees were fully watered. In this study, the soil moisture was measured three times per pot and leaf water potential was detected once per plant with the values indicated as the mean ± SE of three plant leaves, all treated plants were investigated. When the plants were fully watered, the soil moisture was about 30%, and the corresponding leaf water potential was near –1 MPa. Under water deficit treatment, soil moisture levels were maintained at around 15% corresponding to approximately 50% of the control, and the corresponding water potentials were around -1.5 MPa. In this study, terminal bud and the following five buds from flushes were collected at three stages (stage 1: 1 week before water deficit; stage 2: 1 week after the beginning of water deficit; and stage 3: 1 week after releasing from water deficit). It is worth noting that flower buds were visible to the naked eye at stage 3. To analyze the expression of CiFT, leaf sample was also collected. Only mature healthy fully expanded leaves were randomly collected from the three most apical nodes of shoots. Considering that CiFT might be affected by light, all leaves were sampled at 10:00 am. In this study, bud and leaf samples were collected from three groups of trees used as three biological repeats, each group containing three trees. All plant tissues were sampled, immediately frozen in liquid nitrogen, and stored at –80°C until used.
For morphological observation, 15 water deficit-treated and 15 untreated trees were selected and tagged, respectively. For flowering evaluation, each shoot as a statistical unit (Figure 1A). All shoots of each tree were counted, no flowering shoots as vegetative shoots. The data were processed using one-way analysis of variance (ANOVA), and significant differences were compared based on Student’s t-test. P < 0.01 was considered significant. Paraffin section analysis was performed as described by Yao et al. (2007), approximately 500 buds were selected and tagged under a similar growing condition. Ten shoots from lemon derived from these buds were collected every 4 days before the water deficit treatment and every 2 days beginning of water deficit.
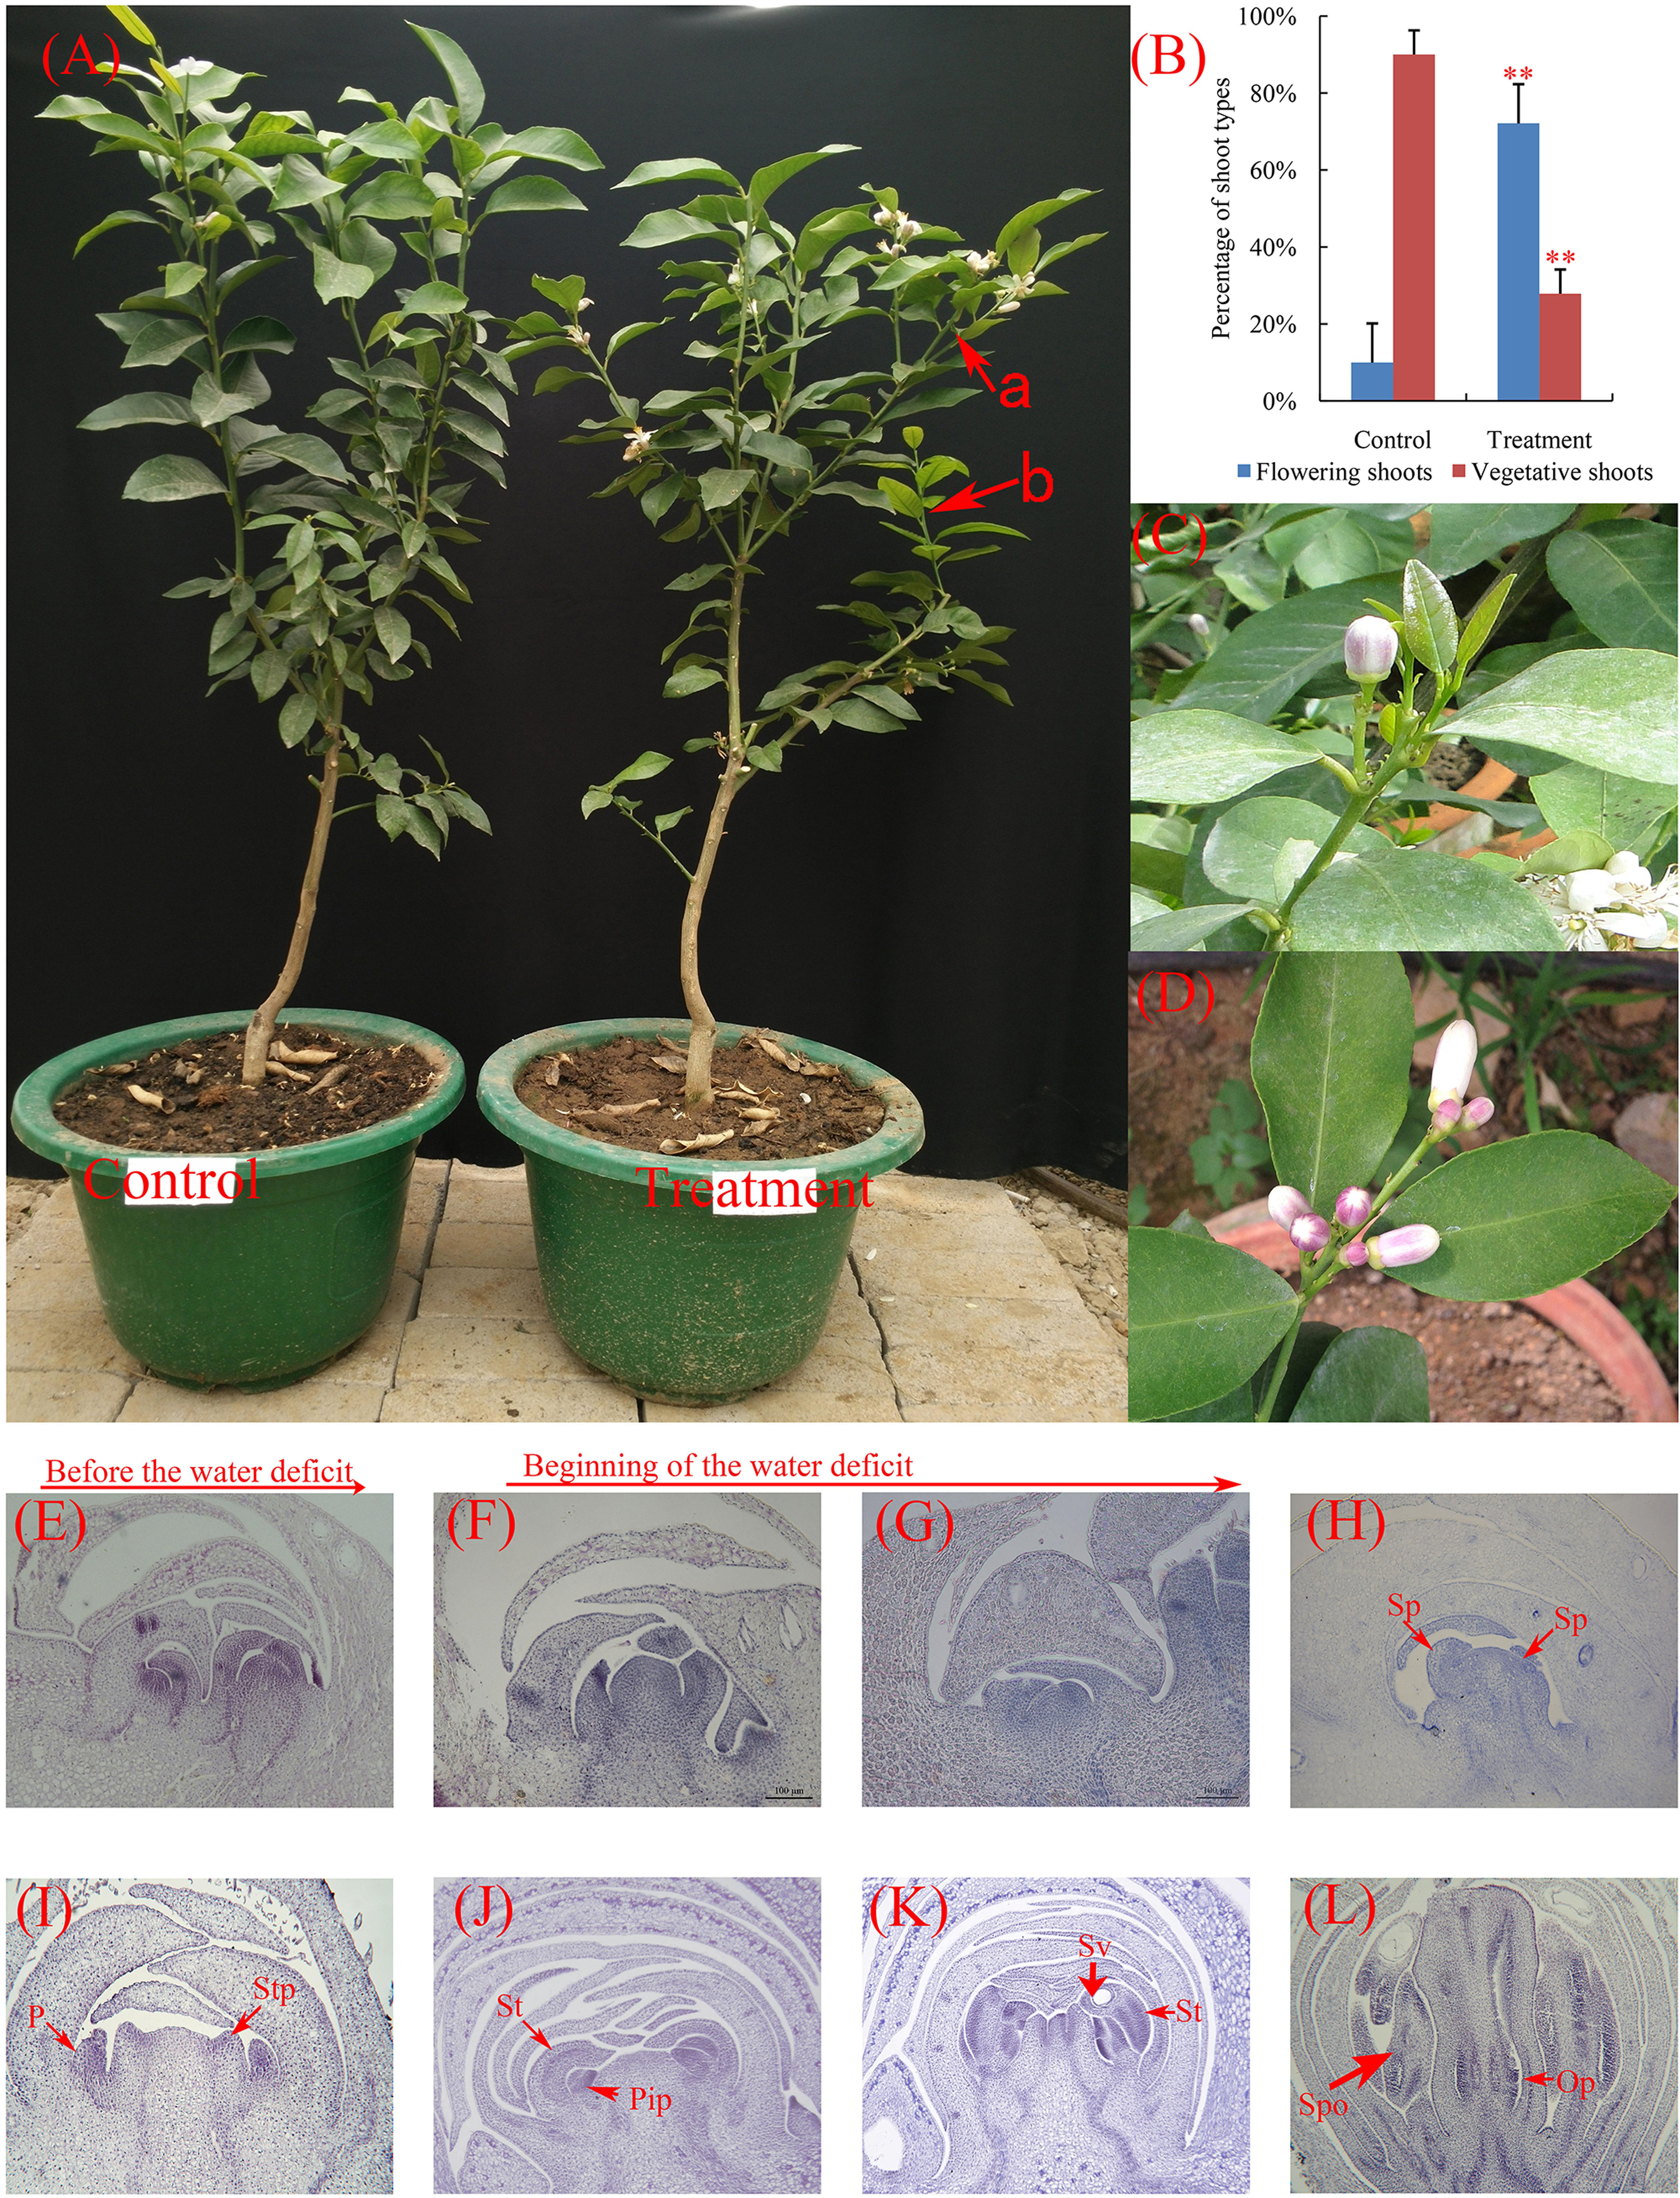
FIGURE 1. Phenotypic characteristics and cytological changes of lemon during floral inductive water deficits. (A) The control and water deficit-treated plants after resumption of irrigation. a, a statistical unit of flowering shoot; b, a statistical unit of vegetative shoot. (B) Effect of water deficit on flowering of lemon. The data were processed using one-way analysis of variance (ANOVA), and statistical differences were compared based on Student’s t-test, taking P < 0.01 as ∗∗. (C) Single flowers from the water deficit-treated plants. (D) Leafless inflorescences from the water deficit-treated plants. (E–L) The floral differentiation on lemon buds. The integrated flower bud was formed in 2 or 3 weeks, and then flower bud began flowering. (E) Undetermined state. (F) Lateral bud growth resumes. (G,H) Flower primordium forms and sepal primordia arise. Sp, sepal primordia; P, petal; (I,J) Stamen primordia arise. Stp, stamen primordia; Pip, pistil primordia; (K) Stamen and pistil primordia arise. St, stamen; Sv, secretion vesicle. (L) Fully developed floral bud. Spo, sporogenous; Op, ovule primordia. The bars represent 50 μm (E–H) and 100 μm (I–L).
Hormone Treatments on Lemon Trees
Trees were randomly divided into five groups with 15 plants per group and subjected to treatments in a growth chamber with adjustable temperature (Minimum and maximum temperatures were 23 and 31°C, respectively). These trees were treated by spraying 40 mg L-1 of GA3, 100 mg L-1 of ABA, 40 mg L-1 of NAA, and 800 mg L-1 of paclobutrazol (PBZ, a GA biosynthesis inhibitor) onto entire trees with a hand-gun sprayer, using approximately 0.5 L per tree and wetting the tree to the point of run-off. Meanwhile, a non-ionic wetting agent (Tween 20, 20% w/v) was added at a rate of 0.05% v/v in all treatments. Water-treated trees served as control. Samples were collected at 15-days intervals until flower bud formation of PBZ-treated trees (visible to the naked eye). The CiFT expression was measured in leaves, whereas other genes were measured in buds.
RNA Extraction and Sequencing
Total RNA was extracted as previously described (Zhang et al., 2009b). The libraries were produced and sequenced using Illumina’s Genome Analyzer (Solexa; Illumina, San Diego, CA, United States). The sequencing and data analysis were carried out essentially as described in previous studies (Mortazavi et al., 2008; Conesa et al., 2016). In this study, three biological replicates were carried out for the RNA Seq analysis. Raw sequence reads were filtered for quality using the FASTX-Toolkit (Blankenberg et al., 2010). All clean reads were mapped to the citrus genome1 (Xu et al., 2013) using Burrows–Wheeler Aligner (BWA) software (Li and Durbin, 2010). In this study, the NOIseq was used to identify differentially expressed genes, probability ≥ 0.8 and the absolute value of log2Ratio ≥ 1 were used as the threshold (Tarazona et al., 2011). Gene annotation was conducted using the Blast2GO program (Conesa et al., 2005). The alternative splicing (AS) events from different stages were identified using TopHat (Trapnell et al., 2009). All the junction sites of the same gene were used to distinguish the type of AS events, including alternative 5′-splice sites (A5SS), alternative 3′-splice sites (A3SS), skipped exons (ES), and retained introns (RI). During the analysis of the AS CiFT, we found that two PCR products were generated by a pair of CiFT primers, implying the existence of CiFT AS in lemon. By comparing the two CiFT cDNA sequences, we discovered that one splicing product contained 88 amino acids of open reading frame (ORF) because of intron 2 and 3 retention compared with a typical CiFT gene. Thus, we designated this form as CiFT2β and the full-size transcript as CiFT2α.
Real-Time PCR Verification
Real-time PCR was performed with SYBR Green I chemistry (Qiagen, Hilden, Germany) as described previously (Zhang et al., 2009b, 2014). All primers are listed in Supplementary Table S1. Data were evaluated by using the LightCycler 480 software version 1.5 (Roche Applied Science, Mannheim, Germany) and normalized to expression of β-actin (Zhang et al., 2014). Three independent biological replications of each sample and four technical replications of each biological replication were used for real-time PCR.
Quantification of Hormones
The samples for ABA, IAA, and GA3 quantification were prepared according to a previously reported protocol (Pan et al., 2010; Wu et al., 2014). The Icon Isotopes of internal standard (d6-ABA, d5-IAA, and d2-GA3) were used for ABA, IAA, and GA3, respectively. An Agilent 1100 HPLC (Agilent Technologies, Santa Clara, CA, United States), C18 column (150 mm × 2.1 mm, 5 μm; Waters, Milford, MA, United States), and API3000 MS-MRM (Applied Biosystems, Foster City, CA, United States) were used for the analysis (Pan et al., 2010; Wu et al., 2014). Three biological replications were assayed for each sample in this study.
Arabidopsis Transformation and Histochemical Localization of GUS Activity
To generate the over-expression vectors of CiFTα, CiFTβ, CiBFT, CiTFL1, and CiMFT, each full-length cDNA sequence was cloned into the binary vector pBI121 with the ClonExpress One Step Cloning Kit (Vazyme Biotech Co., Ltd., Nanjing, China) according to the manufacturer’s instructions, respectively. Meanwhile, the promoter of CiFT, CiBFT, CiTFL1, and CiMFT was also cloned into the DX218 vector, respectively. The floral dipping transformation method was used in this experiment (Clough and Bent, 1998). The surviving plants were transplanted into soil and grown under long-day conditions (16 h light/8 h dark) at 22 ± 1°C. Morphological analyses were investigated in the transgenic plants T3. The number of rosette leaves and days to flowering were counted when transgenic plants bore a 1-cm-long inflorescence (Li et al., 2010; Sun et al., 2014).
Water Deficit Treatment and Histochemical Localization of GUS Activity in Arabidopsis
Seeds from transgenic plants T3 were vernalized in the dark at 4°C for 1 week before sowing. Approximately 200 vernalized seeds were sown on a plastic plate (9-cm), then the plates with seeds were transferred into a Percival growth chamber (Percival Scientific, Percival AR41L2), which was set at standard conditions (22°C, 60% humidity, 16 h light/8 h dark, ∼300 μmol m-2 s-1 photon flux) until two-leaf stage. When the seedlings reach two-leaf stage, extra seedlings were removed, leaving approximately 100 plants per plate under similar growth status. For the drought treatments, the relative air humidity in the chamber was adjusted to 30% to accelerate the water evaporation at the beginning of the water deficit. Meanwhile, treated plants stop watering and soil moisture was measured by Theta probe type ML2x. Soil moisture levels were maintained at around 15% corresponding to approximately 50% of the control. After 3 days, whole plant material was collected. GUS staining was performed as previously described (Zhang et al., 2014). In this study, three independent transgenic lines for each promoter were analyzed.
Results
Flowering Response Induced by Water Deficit Treatment
Lemon trees produced more flowers than control trees under water deficit condition (Figure 1A). Under control condition, very few flowering shoots (10% of total shoots) were produced in irrigated trees, whereas 72% of shoots flowered when trees were exposed to water deficit (Figure 1B). Most of the flowers formed in trees were of the axillary flower under water deficit condition (flower from axillary buds, Figures 1C,D). These results indicated that the water deficit treatment was effective method at inducing lemon flowering.
To examine cytological changes of buds during floral inductive water deficits, buds were collected, fixed, and stained with hematoxylin for microscopic examination (Figures 1E–L). The paraffin sections analysis of buds showed that lemon do not flower bud differentiation, begin to produce vegetative buds before water deficit (Figure 1E). Under water deficit conditions, the floral buds rapidly initiated differentiation (about 3–4 days after the beginning of water deficit, Figures 1F–H). Floral development hastened differentiation and produced the primordia of the floral organ including sepal, petal, stamen, and pistil (Figures 1H–L). The whole integrated flower bud was formed in 2 or 3 weeks, and then part of the flower bud began to flowering.
Analysis of Dynamic Changes in Bud Transcriptome with RNA Sequencing
To analyze dynamic changes in the lemon bud transcriptome during floral inductive water deficits, RNA sequencing was performed on lemon buds at three stages (stage 1: 1 week before water deficit; stage 2: 1 week after the beginning of water deficit; and stage 3: 1 week after releasing from water deficit). After removing low-quality reads, approximately 28 million clean reads were obtained for each biological replicate. From stage 1 to stage 2, of the 21,947 read-mapped genes detected, more genes were up-regulated (11,490) than down-regulated (10,457). From stage 2 to stage 3, of the 21,763 read-mapped genes detected, more genes were down-regulated (11,956) than up-regulated (9807). Similarly, of the 21,947 read-mapped genes detected from stage 1 to stage 3, more genes were down-regulated (11,055) than up-regulated (10,892). A total of 22,354 non-redundant genes were expressed during floral inductive water deficits when the data from the three stages were combined. Of these, 406 were not observed from stage 1 to stage 2, 326 were not found from stage 2 to stage 3, and 591 were not found from stage 1 to stage 3.
Large-Scale Identification of Alternative Splicing by RNA Sequencing
To explore potential AS events during floral inductive water deficits, gene structure analyses of AS genes were performed. When combining cDNA of the sweet orange genome (Xu et al., 2013) and RNA sequencing data, more than 27% (12,041) of the multi-exon genes contained at least one AS event. In this study, we detected 45,752 splice junctions in 10,689 genes at stage 1, 43,365 splice junctions in 10,193 genes at stage 2, and 42,734 splice junctions in 10,125 genes at stage 3 (Figure 2A). We also identified the following four common types of AS: A3SS, A5SS, ES, and RI. At stage 1, classification of the 45,752 splice junctions showed that 807 (1.8%) splice junctions corresponded to ES, 2488 (5.4%) corresponded to A5S, 4563 (10.0%) corresponded to A3S, and 38,894 (85.0%) corresponded to IR. At stage 2, of the 43,365 splice junctions 610 (1.4%) splice junctions corresponded to ES, 2213 (5.1%) corresponded to A5S, 4043 (9.3%) corresponded to A3S, and 36,503 (84.2%) corresponded to IR. At stage 3, of the 42,734 splice junctions 685 (1.6%) splice junctions corresponded to ES, 2038 (4.8%) corresponded to A5S, 3743 (8.6%) corresponded to A3S, and 36,268 (84.9%) corresponded to IR (Figure 2B). Intron retention was the most prevalent mechanism. There might be two possible explanations for the high percentage of IR transcripts: at first, some novel transcriptional events may have occurred during under water deficit condition. Secondly, the ORF from reference transcripts may be inaccurate because their ORFs were predicted based on triplet code (Xu et al., 2013).
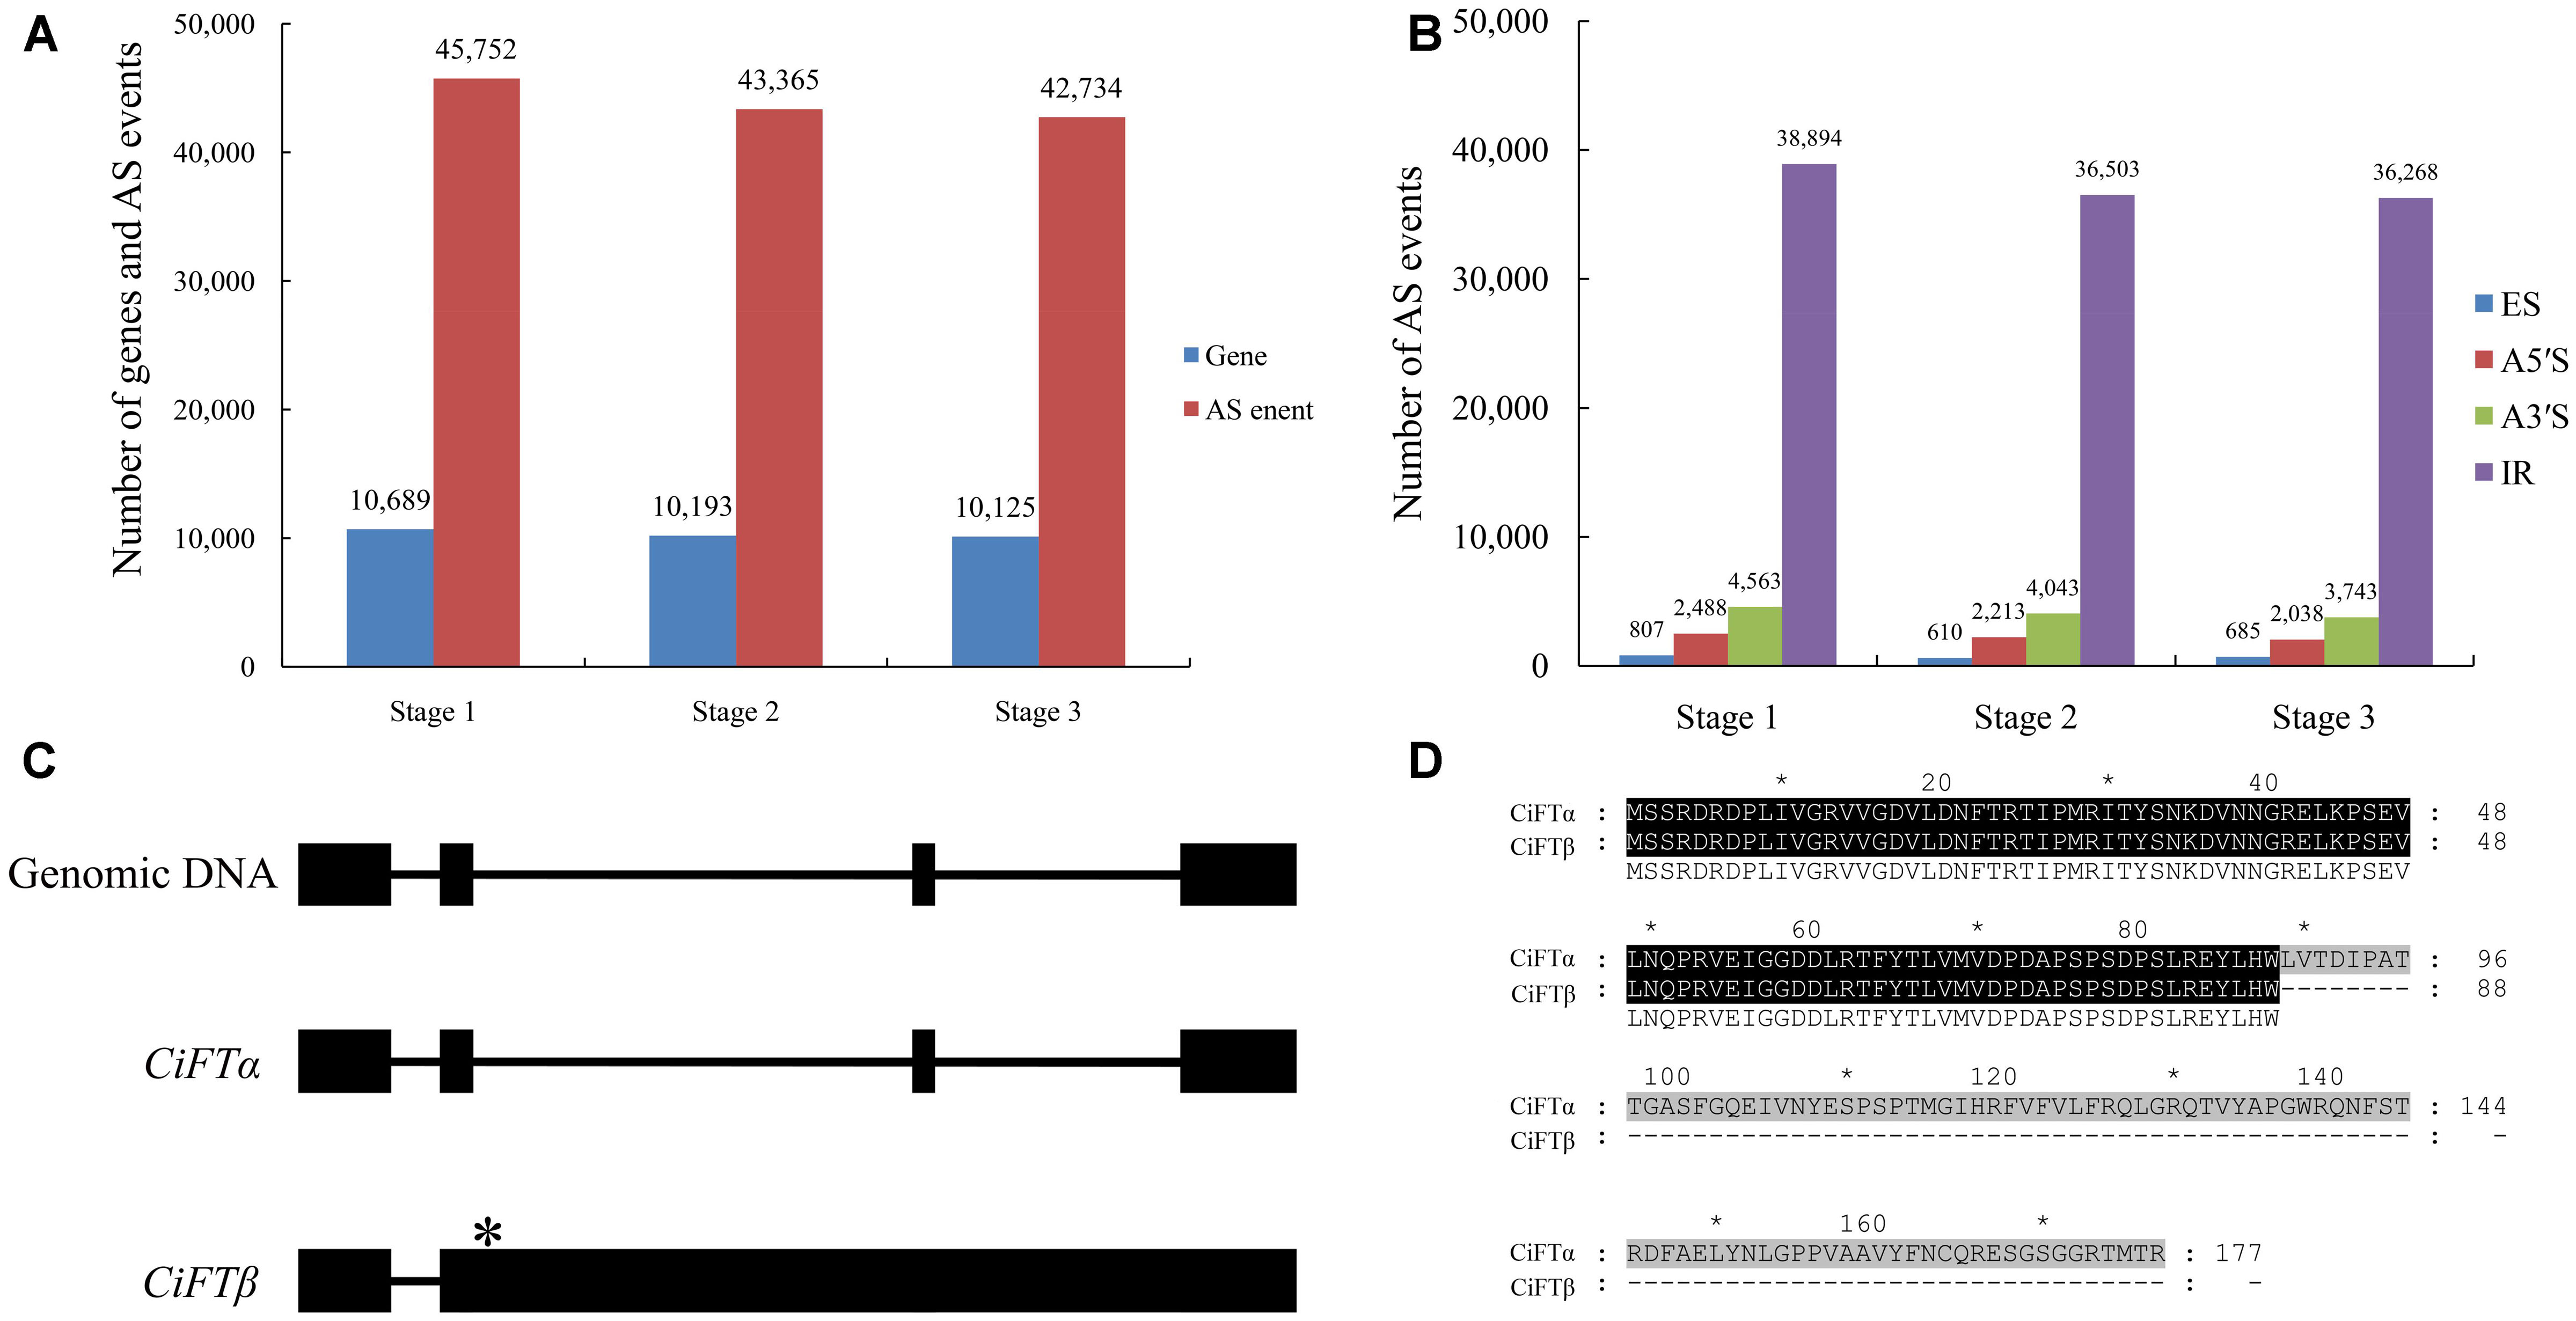
FIGURE 2. Large-scale identification of alternative splicing (AS) by RNA sequencing during floral inductive water deficits. (A) The AS events and genes at different stages (stage 1: 1 week before water deficit; stage 2: 1 week after the beginning of water deficit; and stage 3: 1 week after releasing from water deficit). (B) The different types of the AS events at different stages (stage 1: 1 week before water deficit; stage 2: 1 week after the beginning of water deficit; and stage 3: 1 week after releasing from water deficit). ES, skipped exons; RI, retained introns; A5SS, alternative 5′-splice sites; A3SS, alternative 3′-splice sites. (C) The structural comparison between the CiFT genomic sequence and putative AS transcripts of CiFT (CiFTα and CiFTβ), asterisk indicates location of termination codon. (D) The sequence analysis of CiFTα and CiFTβ protein.
We noted many AS events of flowering-related genes, such as RELATIVE OF EARLY FLOWERING 6 (REF6), FLC, FCA, EMBRYONIC FLOWER 1 (EMF1), FT, and FY. Almost all reported AS events of citrus flowering time genes were found, including FLC, FCA, and FY (Zhang et al., 2009a; Ai et al., 2012, 2016). Here, we report the splicing of lemon FT (CiFT) as an example. CiFT comprises four exons and three introns according to DNA analysis of lemon; two AS forms were detected based on RNA sequencing. Further expression analysis of CiFT was conducted by reverse transcriptase PCR (Figure 2C). Two AS transcripts of CiFT were isolated from lemon. One of the AS transcripts showed high identity with trifoliate orange and Citrus unshiu FT and was named CiFTα, and only some SNPs (single nucleotide polymorphism) were found compared with the protein-coding sequences of the previously published trifoliate orange and sweet orange FT (Kobayashi et al., 1999; Endo et al., 2005; Zhang et al., 2009b). The other AS transcript contains four exons and two introns (because of intron 2 and 3 retention) and was named CiFTβ. The isolated cDNA of CiFTβ is 2429 bp long, and 267 nucleotides of an ORF contained 88 amino acids based on bioinformatics prediction (Figure 2D) because the second intron has a termination codon (Figure 2C).
Differential Transcriptome Responses of Bud under Water Deficit Conditions
To identify flowering-related genes, the number of normalized gene reads of different stages was calculated using FPKM. Genes were considered to be differentially expressed based on probability ≥0.8 and an absolute value of log2Ratio≥1 as a threshold (Tarazona et al., 2011). According to these criteria, 944 genes were DEGs from stage 1 to stage 2, and 455 were up-regulated and 489 were down-regulated. From stage 2 to stage 3, 922 genes were DEGs, and 596 were up-regulated and 326 were down-regulated. From stage 1 to stage 3, 686 DEGs were identified, with 395 up-regulated and 291 down-regulated (Figure 3A). By combining results from the three stages, 1638 DEGs were identified as candidates that may represent the common flowering-related genes, and 59 DEGs were shared in all three stages that may represent the common flowering-responsive genes (Figure 3B). And then, a homology search was conducted using the NCBI database to investigate the biological processes possibly regulated by the 1638 DEGs (Supplementary Table S2). We detected 1519 DEGs as having homology with known proteins and the remaining 19 did not in the NCBI database. Based on Gene Ontology annotation of these genes performed by Blast2GO analysis, 1436 DEGs were divided into the three principal GO organization categories (Supplementary Figure S1): molecular function, biological process, and cellular components.
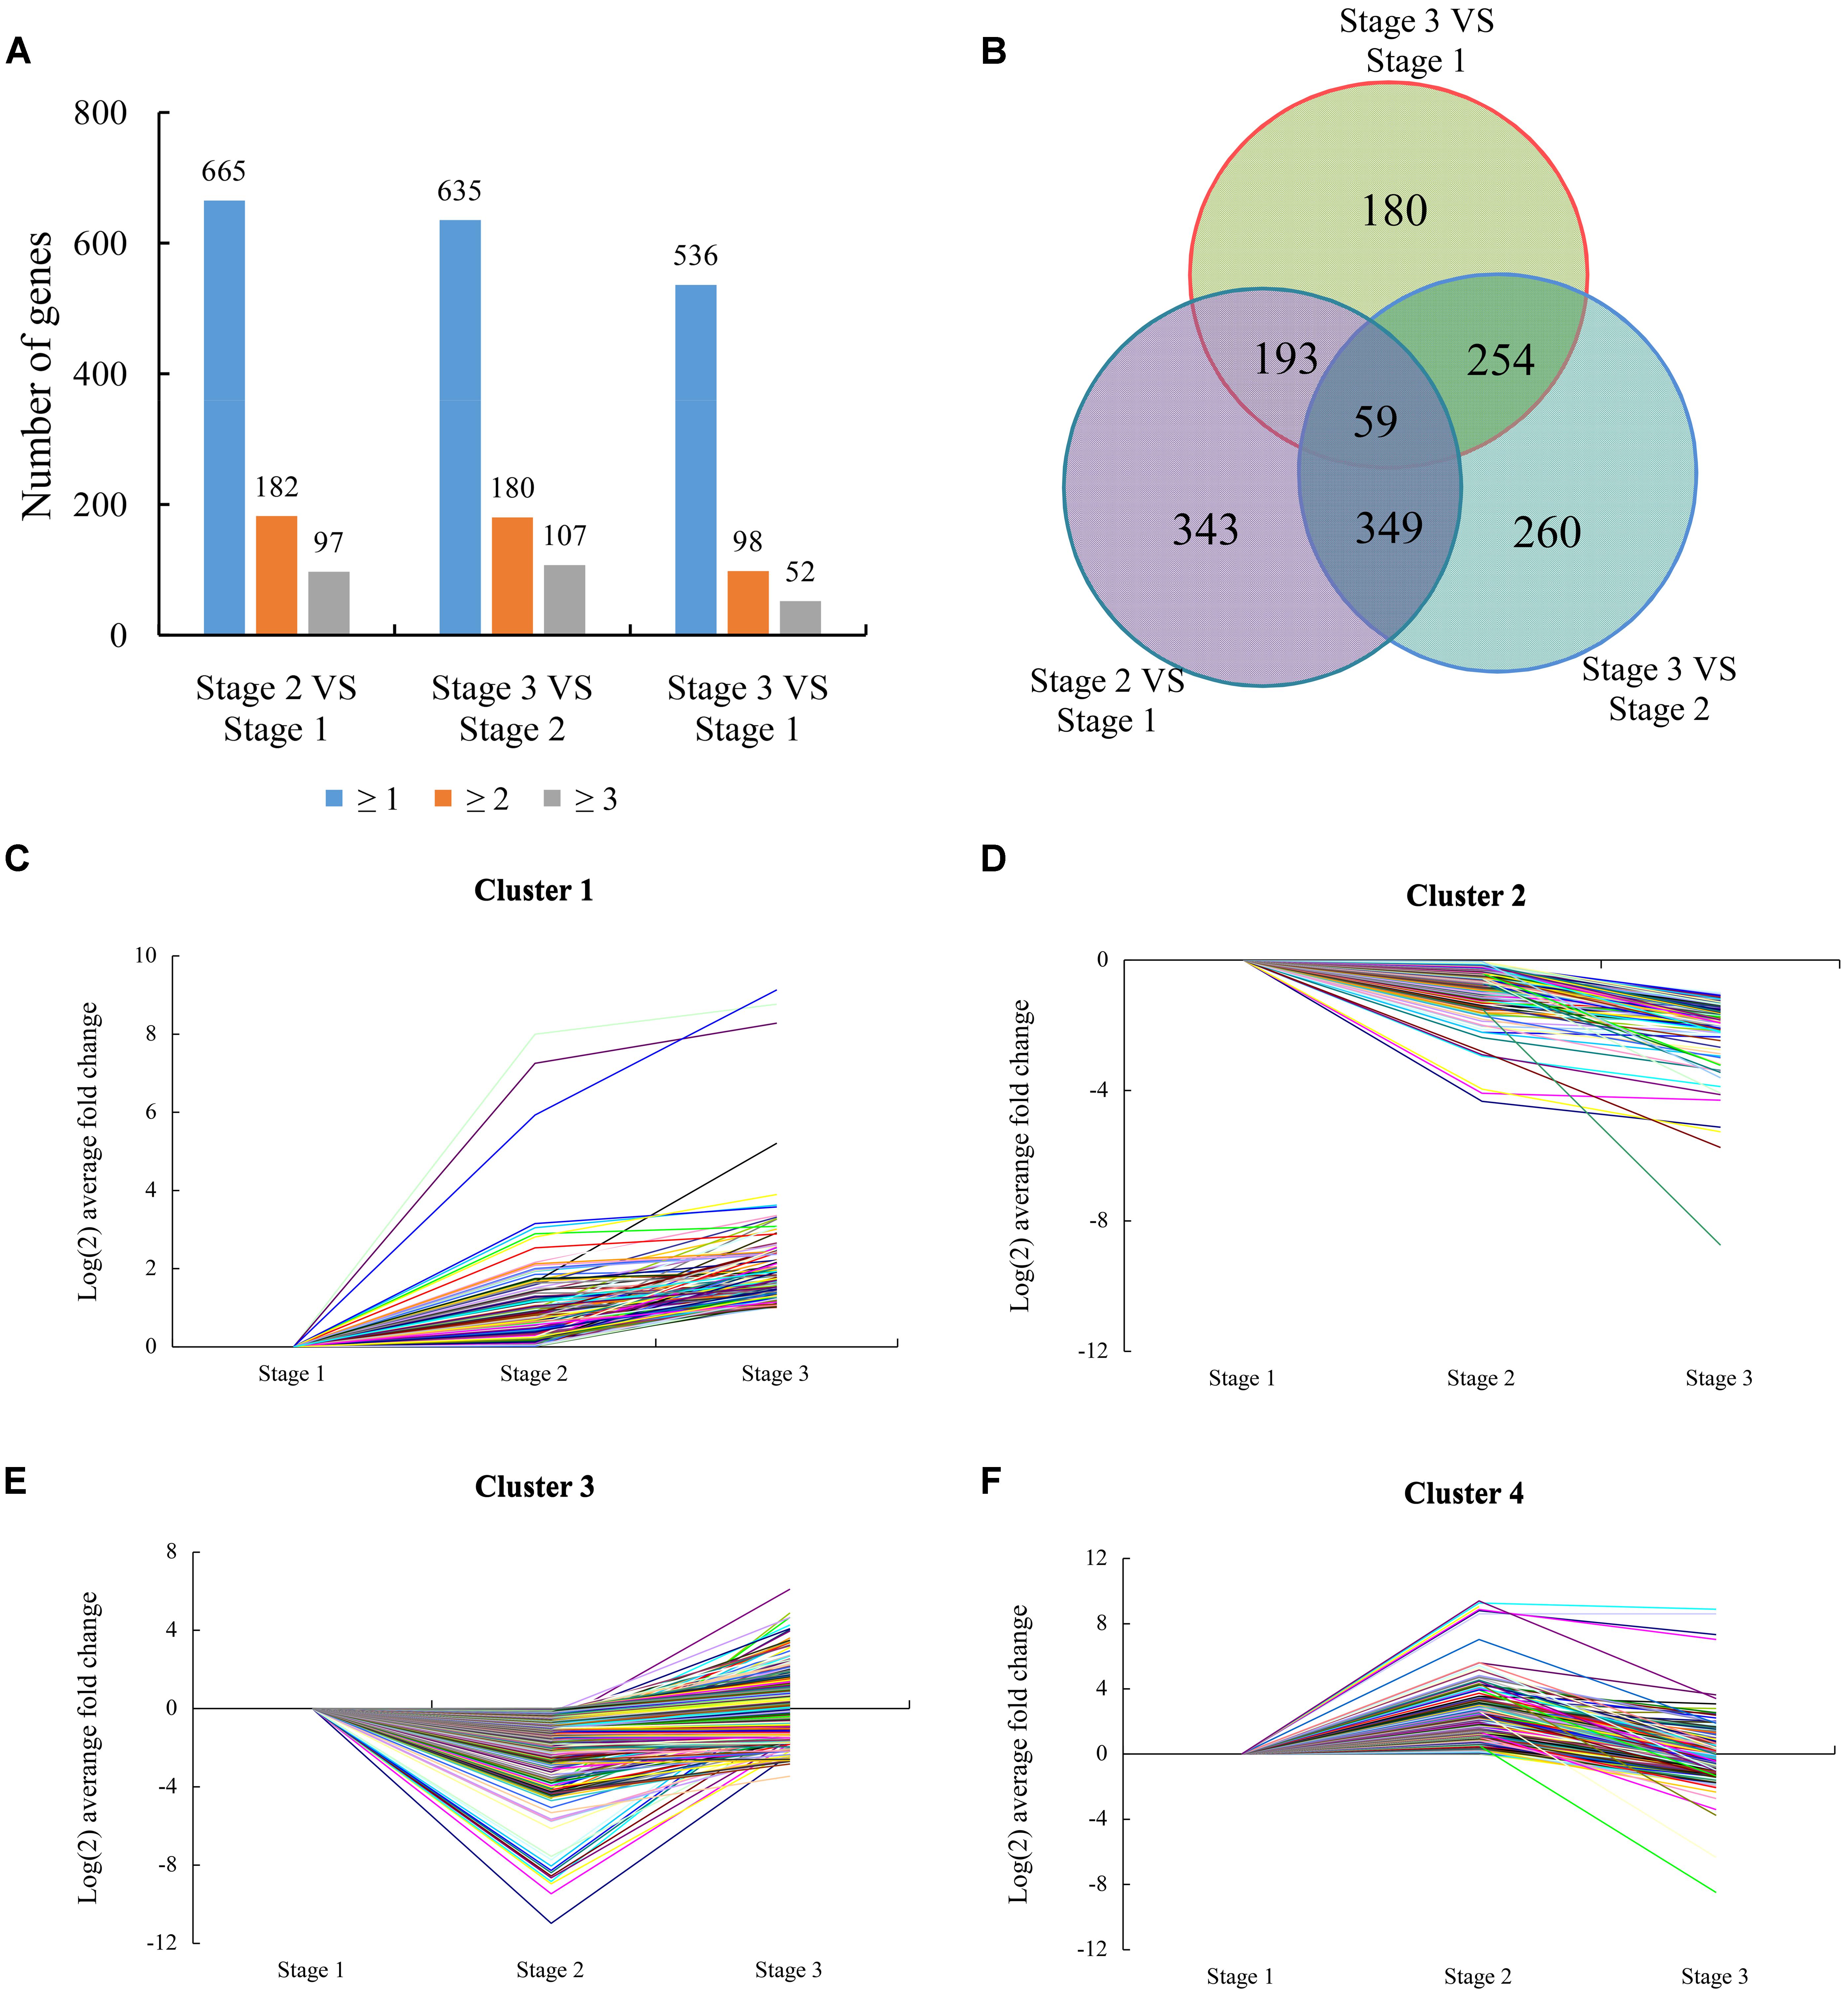
FIGURE 3. Expression patterns of differentially expressed genes (DEGs). (A) The total numbers of genes differentially expressed (including up- or down-regulated, fold changes ≥ 1, 2, and 3) at stage 2 compared with stage 1, stage 3 compared with stage 2, and stage 3 compared with stage 1, respectively. (B) Venn diagram showing the overlapping of DEGs at three different stages (Stage 2 compared with stage 1, stage 3 compared with stage 2, and stage 3 compared with stage 1). (C) Cluster 1 consisting of 172 DEGs. (D) Cluster 2 consisting of 181 DEGs. (E) Cluster 3 consisting of 776 DEGs. (F) Cluster 4 consisting of 509 DEGs.
Based on the similarity of the expression patterns of the DEGs, 1638 DEGs were classified into four clusters. The gene from cluster 1 (including 172 genes) was induced at stage 1 and most maintained high expression levels at stage 3 compared with stage 1 and stage 2 (Figure 3C). This cluster featured genes encoding transcription factors (TFs), biotic/abiotic response proteins, and heat shock proteins. These genes were significantly induced at the beginning of water deficit, indicating that the gene cluster might play a key role in the necessary development of lemon. The gene from cluster 2 (including 181 genes) was suppressed at stage 1 and maintained low expression levels at stage 3 compared with stage 1 and stage 2 (Figure 3D). These genes were involved in transcriptional regulation, protein metabolism, and ABA signaling, according to BLAST analysis. These genes may involved in meristem gene regulation and development of vegetative buds. Meanwhile, hormone-related genes and stress proteins were featured in this cluster, indicating these genes might be related to the water deficit response. The gene from cluster 3 (including 776 genes) was transiently suppressed at stage 2 and was then induced at stage 3 (Figure 3E). This cluster also featured genes encoding hormone (GAs, ABA, auxin, and ethylene) signaling/biogenesis and flowering control proteins. These genes shows up-regulated at stage 3, indicating these genes involved in flowering and recovery of vegetative growth. The gene from cluster 4 (including 509 genes) that was transiently induced at stage 2 and was then suppressed at stage 3 (Figure 3F). The suppression of the gene cluster may imply possible involvement in drought stress response, floral induction, and flower bud differentiation of lemon.
Identification of Flowering-Related Genes by RNA Sequencing
Many previously reported flowering-related genes were found among DEGs such as GI, FLC EARLY FLOWERING 3 (ELF3), and EARLY FLOWERING 4 (ELF4) (Supplementary Table S2). The expression pattern of these genes was closely correlated with flowering during floral inductive water deficits. In Arabidopsis, drought and ABA promote transcriptional up-regulation of PEBP family members such as FT and TSF leading to flowering under long days (Riboni et al., 2013). In this study, the two genes showed high identity with MOTHER OF FT (MFT) and BFT from the PEBP gene family. Moreover, some additional related flowering genes that have not been placed in any specific flowering pathway were also identified in this study, such as the SQUAMOSA PROMOTER BINDING PROTEIN family genes (SPL6/8/9/13) and MADS TF family genes. Many genes involved in different hormone synthesis and signaling pathways showed significant expression changes during floral inductive water deficits (Supplementary Table S2). For example, four ABA-related genes (two ABA 8-hydroxylase genes and two ABA stress-related proteins) showed significant up-regulation under water deficit condition, which encode key enzymes in ABA biosynthesis and metabolism. Eleven auxin-related genes were significant altered included four auxin-induced proteins, three auxin response factors, three auxin transporters, and one auxin canalization protein. The auxin response factors were down-regulated and auxin-induced proteins were up-regulated at the beginning of water deficit. After the water deficit treatment, cluster 3 genes for ethylene biosynthesis and perception were up-regulated, including 15 ethylene-responsive TFs and 1 ethylene response protein. In addition, six genes involved in the response to GA stimulus pathways were up-regulated at the beginning of water deficit. Furthermore, the biological interpretation of the DEGs was further investigated by KEGG pathway analysis. The most frequently represented pathways are plant hormone signal transduction and metabolic pathways at different stages (Supplementary Figure S2). These results suggest that plant hormone are involved in the regulation of flowering under water deficit conditions.
Verification of the DEGs
To validate the expression profiles obtained by RNA sequencing, a total of 26 genes (The expression pattern of 14 genes belong to cluster 3 and 12 genes belong to cluster 4) were chosen to real-time PCR analysis; these genes included 24 DEGs, four genes of no differential expression. The results from real-time PCR were compared with RNA sequencing data. For 22 of the 26 genes, the same expression patterns was shown between the RNA sequencing data and real-time PCR analysis (Figures 4A–C), the remaining four genes showed different expression patterns according to RNA sequencing and real-time PCR.
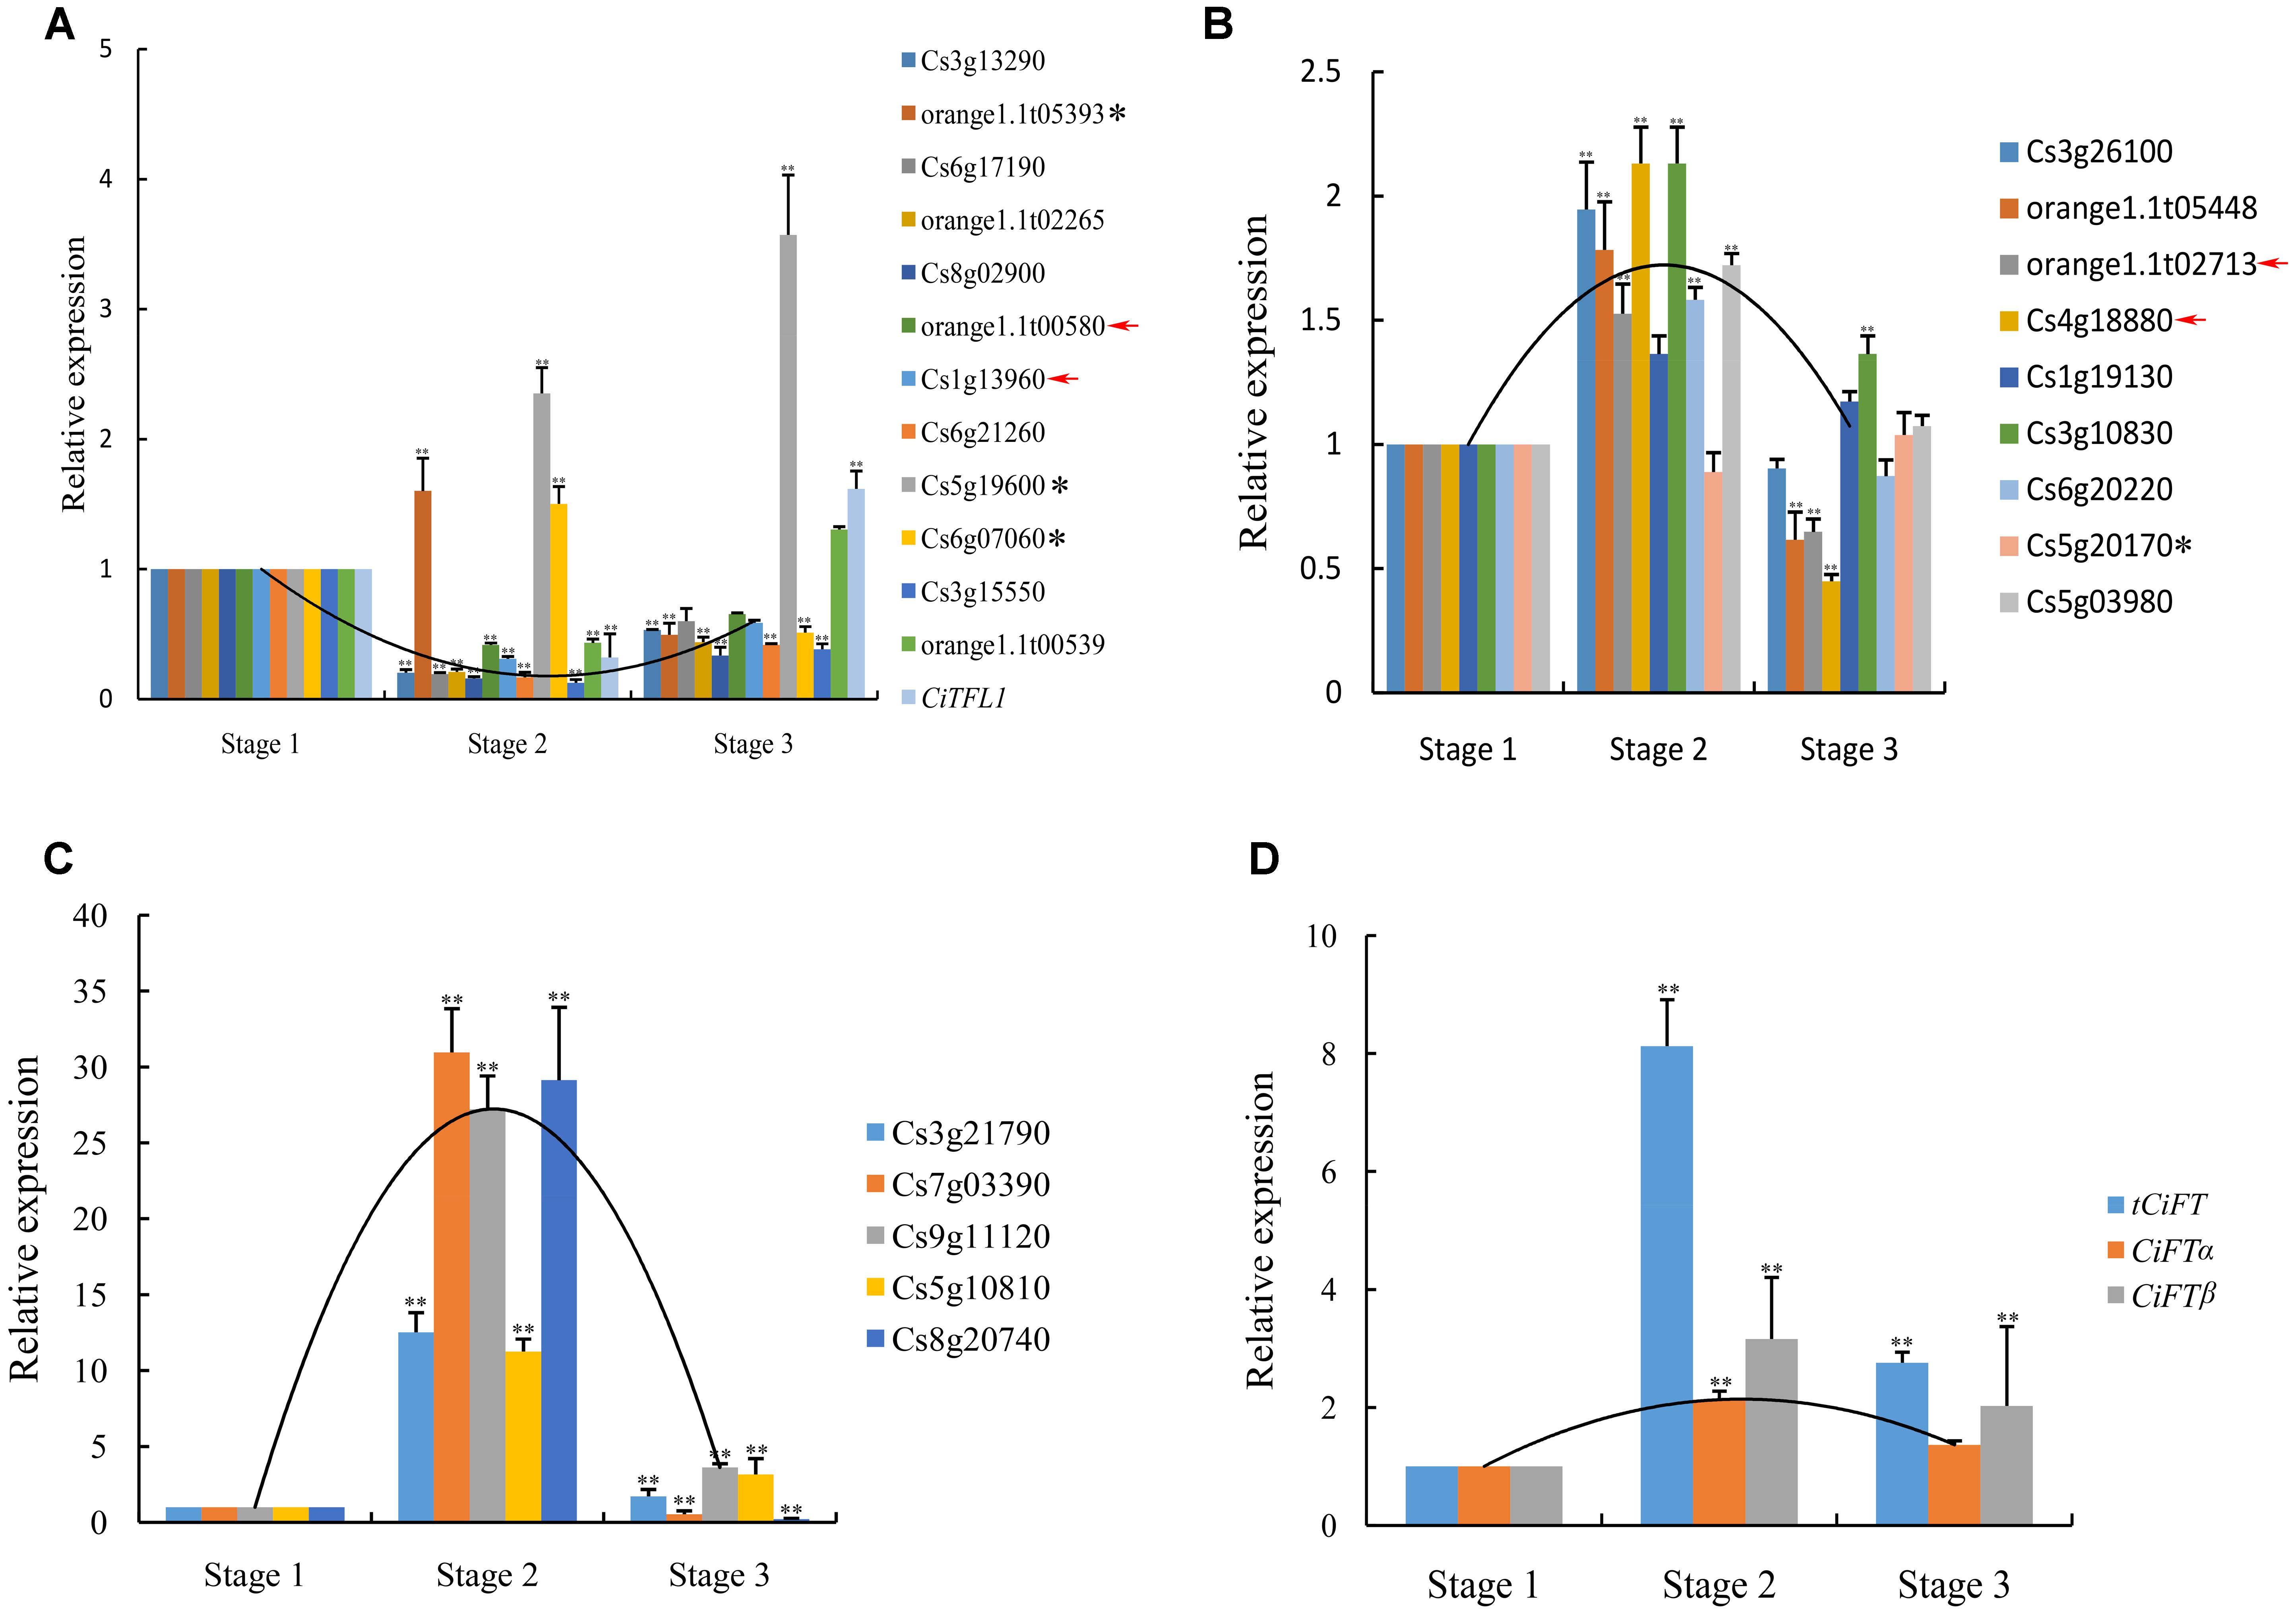
FIGURE 4. Real-time PCR confirmation of the DEGs. (A) The expression pattern of 14 genes belong to cluster 3 were verified. (B) Nine low levels of genes belonging to cluster 4 were verified. (C) Five high levels of genes belonging to cluster 4 were verified. (D) Transcript level of CiFT during floral inductive water deficits. Asterisk indicates that these genes showed different expression patterns between real-time PCR and RNA sequencing. Red arrow indicates that these genes of no significantly differential expression at different stages by RNA sequencing. Relative transcript levels are calculated by real-time PCR with Actin as a standard. Three independent biological replications of each sample and three technical replications of each biological replication were used for real-time PCR analysis, and all biological replications showed similar trends. Data from one biological replication are presented, data were indicated as means ± SD (n = 4). The data were processed using ANOVA, and statistical differences were compared based on Student’s t-test, taking P < 0.01 as ∗∗.
In this study, the expression of CiTFL1 was not detected during floral inductive water deficits. One possible explanation is that its mRNA levels were too low to be detected by RNA sequencing. These results consistent with our previous reports on TFL1 in citrus (Zhang J.Z. et al., 2011). Therefore, the expression of lemon CiTFL1 was investigated in lemon bud by real-time PCR. The expression of CiTFL1 was transiently suppressed under water deficit treatment and was then induced at the resumption of irrigation. On the other hand, citrus FT was mainly expressed in leaves, with little or no expression in citrus buds based on our previous study (Zhang et al., 2009b). Therefore, the expression of lemon FT (CiFTα; CiFTβ; tCiFT: Total CiFT including CiFTα and CiFTβ) was investigated in lemon leaves, and the results showed that the accumulation of tCiFT significantly increased under water deficit treatment (Figure 4D). However, when water deficit was interrupted, the expression levels returned to the initial levels. The expression patterns of CiFTα and CiFTβ were similar to that of tCiFT. These results indicated that the expression of CiFT was induced by water deficit.
Quantification of Endogenous Plant Hormones and Different Hormone Treatments
The RNA sequencing data revealed that hormone-related genes changed greatly during the water deficit process, especially genes for ABA biosynthesis and metabolism, followed by the genes for GA and IAA biosynthesis and signal transduction. Therefore, the ABA, IAA, and GA3 contents of buds were measured in water deficit-treated and control trees. IAA increased immediately at the beginning of the water deficit treatment and maintained high expression levels until the resumption of irrigation (Figure 5A). ABA content was transiently induced during floral inductive water deficits and was then suppressed at resumption of irrigation (Figure 5B). Unfortunately, we were unable to detect GA3 successfully. Therefore, trees were sprayed with PBZ, a GA biosynthesis inhibitor, and untreated trees served as the control. The number of flowers in the PBZ-treated trees was increased compared to the control (Supplementary Figure S3). PBZ yielded a similar trend with water deficit treatment. These results indicate that the GAs content may be suppressed during water deficit.
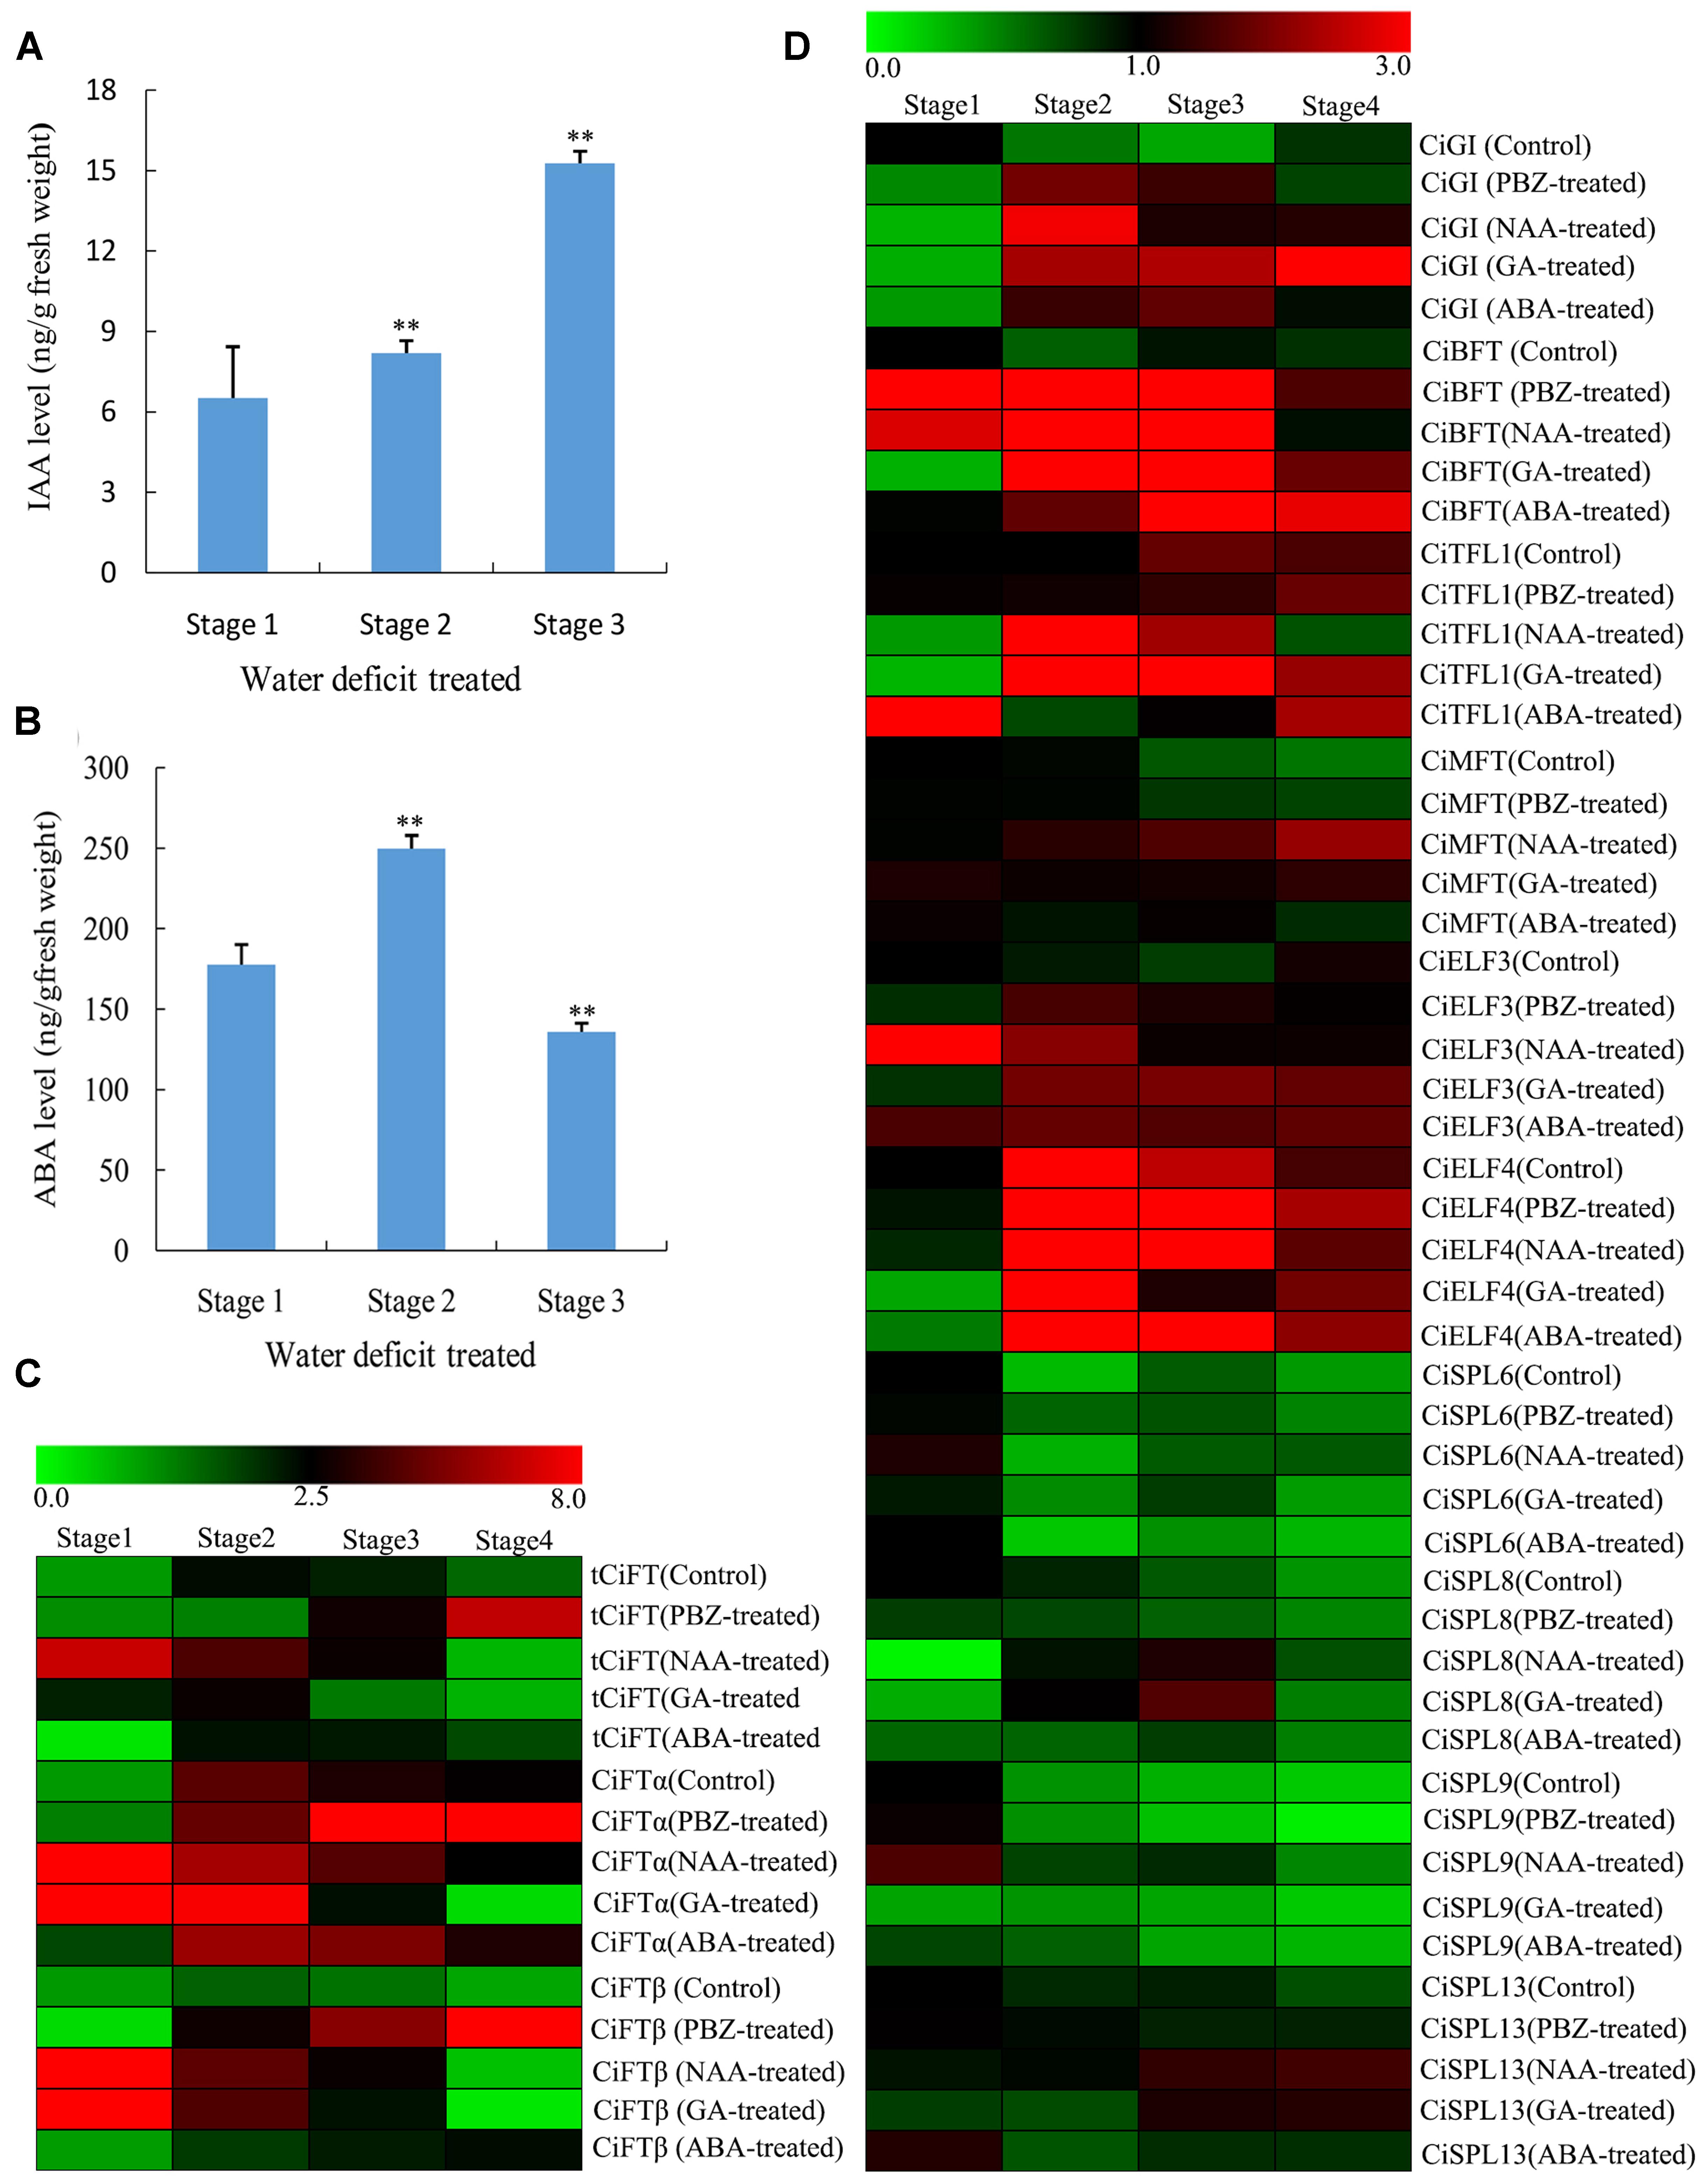
FIGURE 5. Changes of different hormone contents of lemon buds during floral inductive water deficits and the expression pattern of DEGs by different hormone treatments. (A) Changes in IAA content (ng/g fresh weight) in lemon buds (Stage 1: 1 week before water deficit; stage 2: 1 week after the beginning of water deficit; and stage 3: 1 week after releasing from water deficit). The data were processed using ANOVA, and statistical differences were compared based on Student’s t-test, taking P < 0.01 as ∗∗. (B) Changes in ABA content (ng/g fresh weight) in lemon buds (Stage 1: 1 week before water deficit; stage 2: 1 week after the beginning of water deficit; and stage 3: 1 week after releasing from water deficit). The data were processed using ANOVA, and statistical differences were compared based on Student’s t-test, taking P < 0.01 as ∗∗. (C) Heat map showing the expression of total CiFT (tCiFT), CiFTα, and CiFTβ in plant lemon leaves treated with PBZ, NAA, GA3, and ABA treatments. Plant materials from PBZ-treated, GA3-treated, ABA-treated, NAA-treated, and water-treated trees were collected at four stages (stage 1, stage 2, stage 3, and stage 4). (D) Heat map showing the expression of CiGI (Cs3g21790), CiBFT (Cs8g15080), CiMFT (Cs2g06960), CiELF3 (Cs1g19130), CiELF4 (Cs7g31110), CiSPL6 (Cs5g12260), CiSPL8 (Cs1g03630), CiSPL9 (orange1.1t02265), and CiSPL13 (orange1.1t02597) in lemon buds during PBZ, NAA, GA3, and ABA treatments. Plant materials from PBZ-treated, GA3-treated, ABA-treated, NAA-treated, and water-treated trees were collected at four stages (stage 1, stage 2, stage 3, and stage 4). Three independent biological replications of each sample and four technical replications of each biological replication were used for real-time PCR analysis. Genes highly or weakly expressed in the tissues are colored red and green, respectively. The heat map was generated using Cluster 3.0 software.
To investigate the effect of exogenous hormones on citrus flowering and the expression of flowering genes, GA3, ABA, and NAA were also sprayed onto entire trees. Some new vegetative shoots were formed by GA3 and NAA treatment compared with the control. However, no significant differences were observed by ABA treatment. Samples were collected at 15-days intervals until flower buds of PBZ-treated trees were visible to the naked eye. In this study, plant materials from PBZ-treated, GA3-treated, ABA-treated, NAA-treated, and water-treated trees were collected at 4 stages (stages 1, stage 2, stage 3, and stage 4). It appears that stage 1 was the bud induction period and stage 2 and 3 were flower bud differentiation period because part of the flower bud from PBZ-treated trees were visible to the naked eye at stage 4 compared with the control trees. The expression of related flowering DEGs (tCiFT, CiBFT, CiTFL1, CiELF, and CiSPLs) was investigated at different treated stages. Compared with the control trees, the expression of tCiFT in leaves was significantly increased by ABA and PBZ treatment (Figure 5C). The expression level of tCiFT in GA3- and NAA-treated trees was significantly suppressed from stage 3 to stage 4. Under PBZ treatment condition, the expression patterns of CiFTα and CiFTβ were similar to that of tCiFT, indicating that they may perform a similar function role during the treatment process. For different hormone treatments, the relative expression of CiGI, CiTFL1, and CiBFT showed significantly higher values throughout the entire treated period (Figure 5D). They increased at the beginning of the treatment, then maintaining a high level of expression during treatment, and tended to decrease at the end of the treatment. The levels of CiBFT1 and CiTFL1 accumulation in buds were induced during the entire treatment period by ABA. A high transcript level of CiMFT was seen as the beginning of treatment, and it was then maintained at a low level except when treated with NAA. No differences in the expression of CiELF3 and CiELF4 were detected between the control and the treated trees; they showed high expression levels throughout the entire period studied. The relative expression levels of CiSPL6, CiSPL8, and CiSPL9 were not significantly altered. They were detected and present at low levels during the treatment process, and their expression levels were independent of treatments throughout the study period. Relative expression of CiSPL13 was different from other CiSPL genes at stage 4; the accumulation of CiSPL13 was induced at stage 4 by NAA and GA treatments (Figure 5D).
Functional Analysis of CiFTα, CiFTβ, CiBFT, CiTFL1, and CiMFT in Transgenic Arabidopsis
To assess the functional characteristics of CiFTα, CiFTβ, CiBFT, CiTFL1, and CiMFT, these genes were over-expressed in Arabidopsis. Sixteen, 20, 18, 14, and 26 independent T1 transgenic lines were generated, respectively. Interestingly, CiFTβ transcribed several new transcripts (Figure 6A). Comparison of the various CiFTβ cDNA revealed that four AS transcripts of CiFTβ were identified; Among these AS transcripts, one of the transcripts was the same as CiFTα, other transcripts could not encode complete protein compared with CiFTα because of intron retention or A3SS (Supplementary Figure S4).
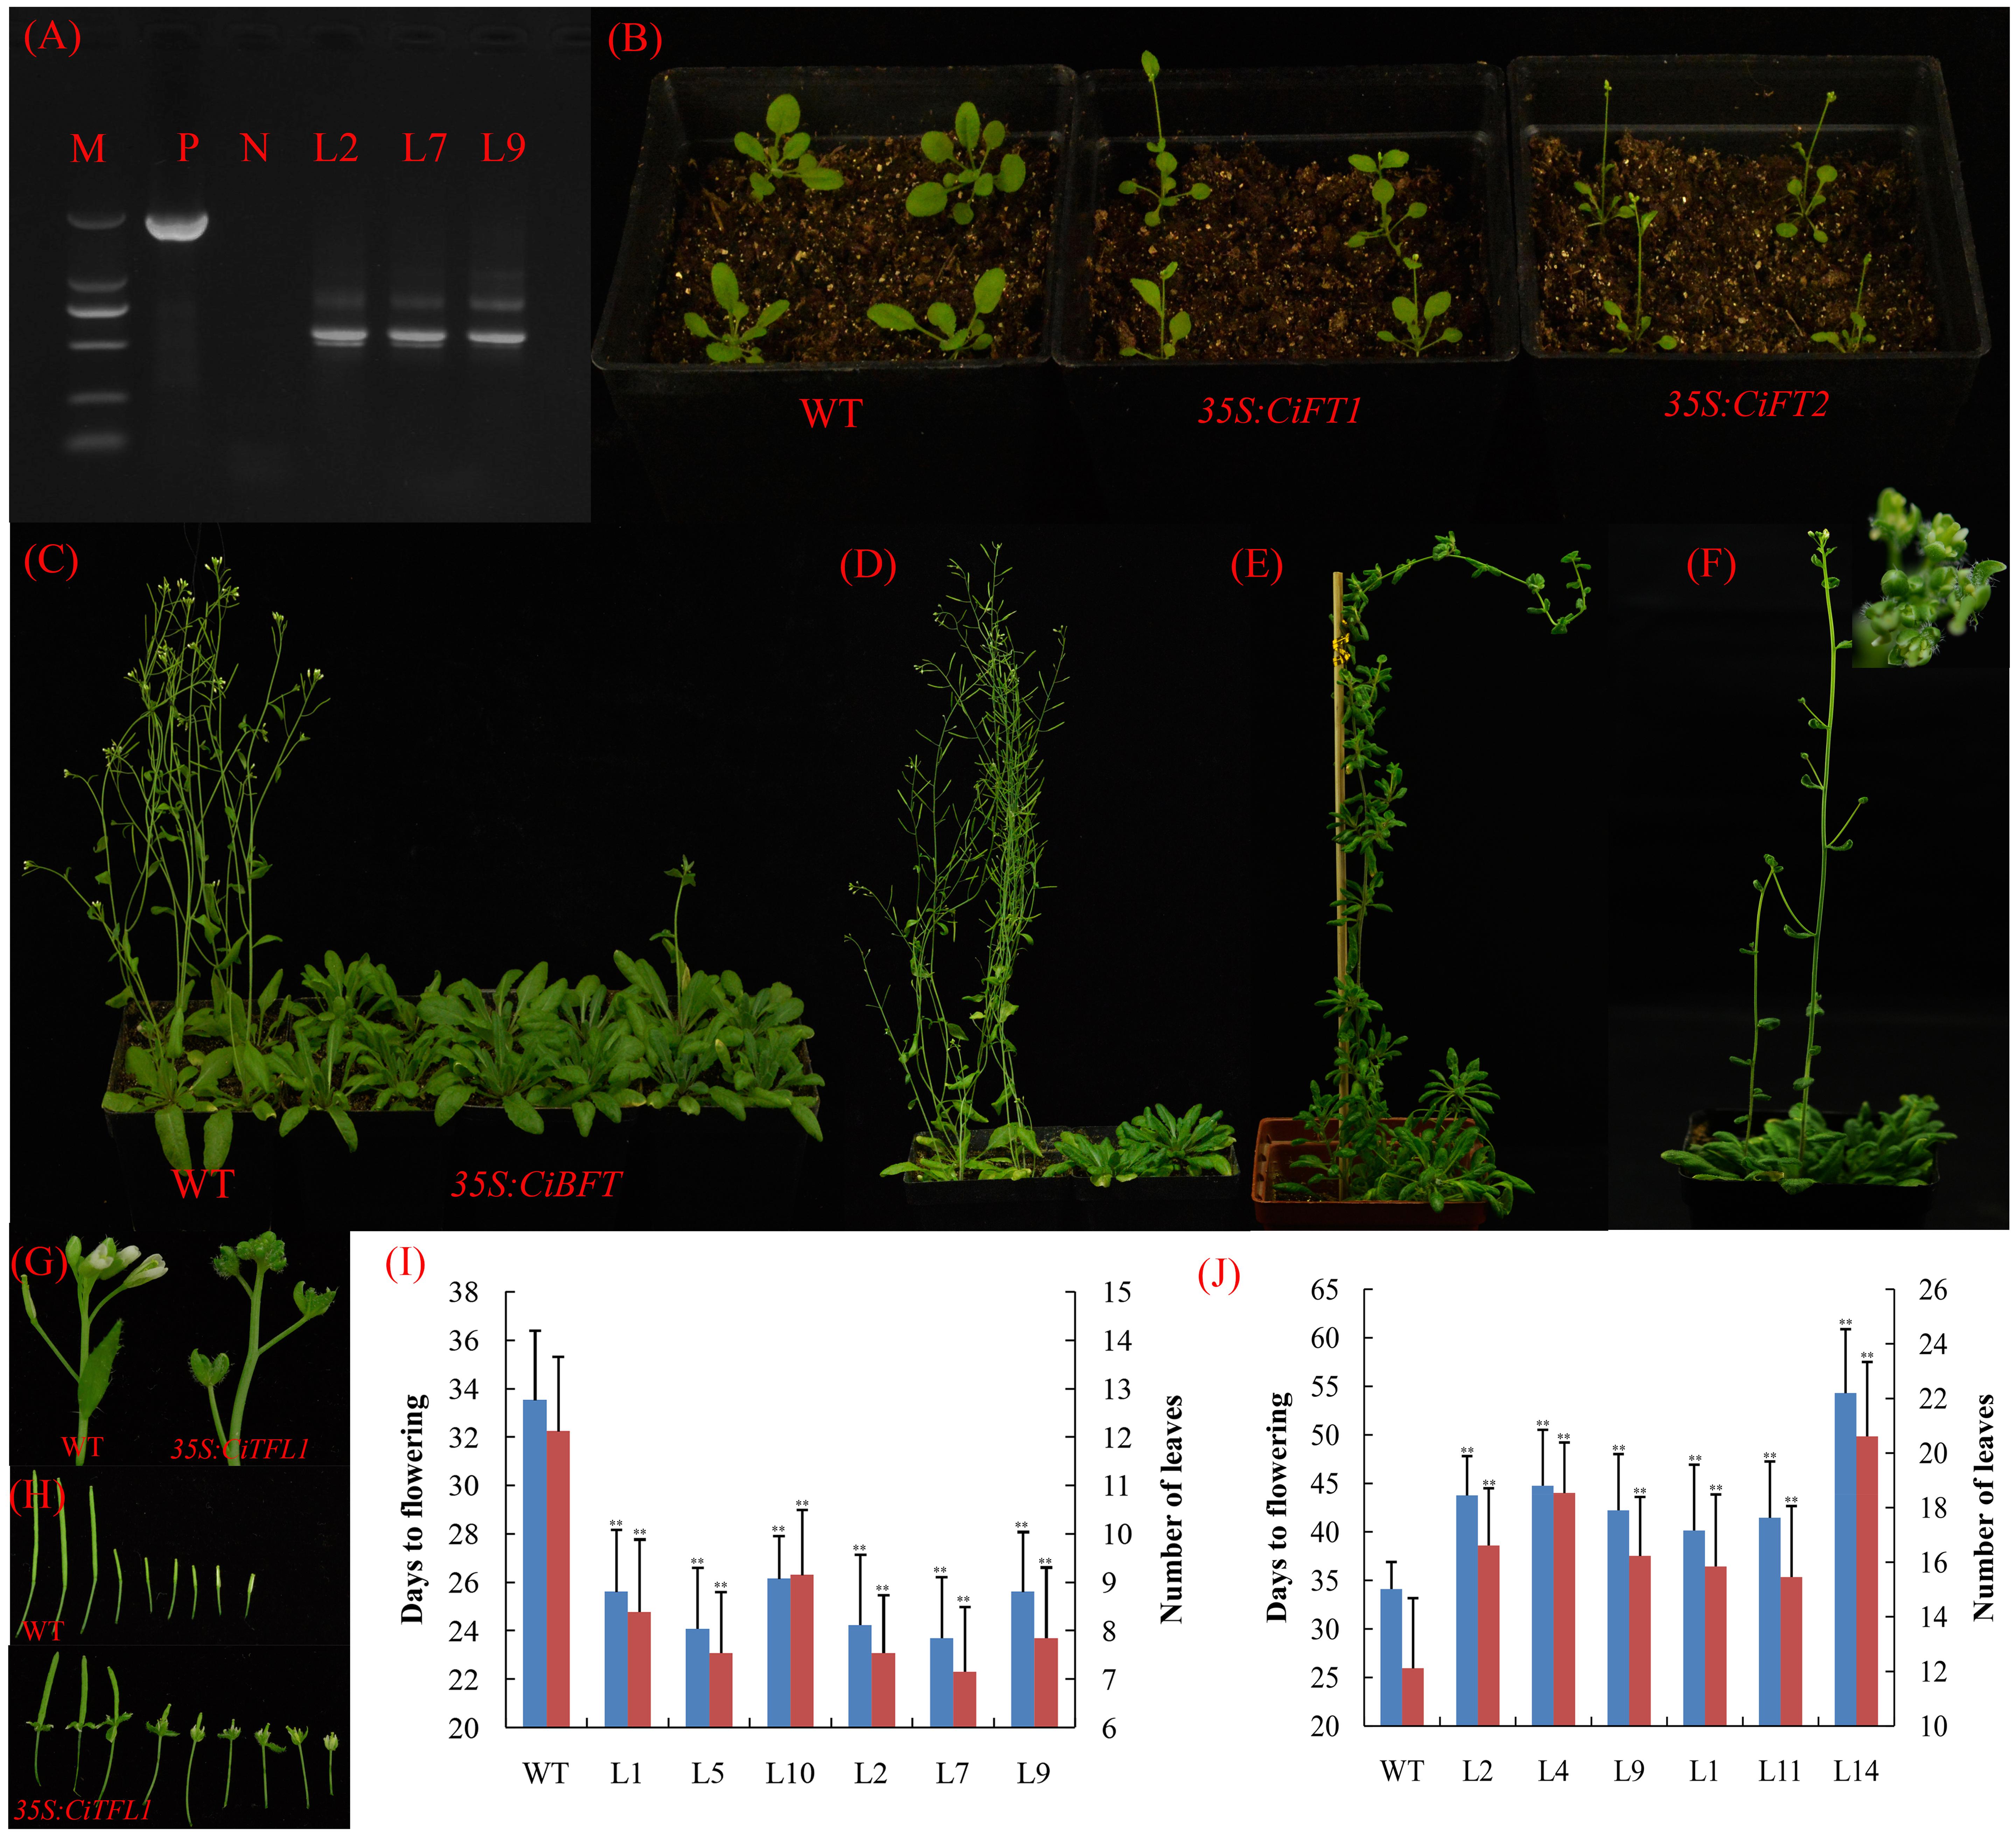
FIGURE 6. Phenotypes of 35S::CiFTα, 35S::CiFTβ, 35S::CiBFT, and 35S::CiTFL1 transgenic Arabidopsis. (A) RT-PCR analysis of the accumulation of CiFTβ in 35S::CiFTβ transgenic Arabidopsis RNA level. P: positive plasmid as a control, N: wild type Arabidopsis as a negative control, M: Marker 5000; L2, L7, and L9 are the 35S::CiFTβ transgenic lines. (B) Two randomly selected lines that constitutively expressed 35S::CiFTα and 35S::CiFTβ exhibited an early-flowering phenotype relative to wild-type controls under long days. (C) Ectopic expression of CiBFT in wild-type Arabidopsis delayed the flowering under long days. (D) Ectopic expression of CiTFL1 in wild-type Arabidopsis delayed flowering. (E) Two transgenic lines from 35S::CiTFL1 plants flowered significantly later than the wild-type plants. (F) Floral defects phenotype with conversion of sepals into leaf-like structures in some 35S:: CiTFL1 lines. (G) Severe phenotype with conversion of sepals into leaf-like structures in some 35S:: CiTFL1 lines. (H) Persistent sepals around the fruits in some 35S:: CiTFL1 lines. (I) Number of leaves and times to flowering of T3 plants of six independent transgenic lines from 35S::CiFTα (L1, L5, and L10) and 35S::CiFTβ (L2, L7, and L9). Blue bar indicates number of days to flowering, red bar indicated number of leaves to flowering. (J) Number of leaves and times to flowering of T3 plants of six independent transgenic lines from 35S::CiBFT (L2, L4, and L9) and 35S::CiTFL1 (L1, L11, and L14). Blue bar indicates number of days to flowering, red bar indicated number of leaves to flowering. The data were processed using ANOVA, and statistical differences were compared based on Student’s t-test, taking P < 0.01 as ∗∗.
To further analyze the function of these genes, three transgenic lines were randomly selected for each gene. We selected 15 T3 plants for each transgenic line. Compared with control plants, the 35S::CiFTα and 35S::CiFTβ transgenic lines flowered significantly earlier than control plants in terms of both number of leaves and days to flowering (Figure 6B). In 35S::CiFTα and 35S::CiFTβ, the average time to flowering ranged from 23.7 to 26.1 days in six transgenic lines, whereas that of the control plants was 33.5 days. The average number of leaves at flowering ranged from 7.1 to 9.1 and was 12.1 control plants (Figure 6I). The 35S::CiFTβ flowered earlier than 35S::CiFTα. Transgenic plants from 35S::CiTFL1 and 35S::CiBFT showed late flowering (Figures 6C,D). The average time to flowering of the transgenic plants ranged from 41.1 to 52.1 days, while that of the control plants was 34.1 days. The average number of leaves at flowering ranged from 15.8 to 20.1 in the transgenic plants and was 12.1 in the control plants (Figure 6J). Two transgenic lines from 35S::CiTFL1 plants flowered significantly later than the control plants (80- to 120-day delay in flowering, Figure 6E). It is worth noting that some lines showed flowering defects including alterations in floral organ number, pale green sepals, vestigial petals, and persistent sepals around the fruit (Figures 6F–H). However, no difference in the appearance of flowering time, flower and inflorescences was observed between 35S::CiBFT and control plants. Twenty-six plants were obtained in the T1 generation. However, CiMFT did not affect flowering and flower inflorescences in transgenic Arabidopsis (data not shown).
Isolation, Structure Analysis, and Expression Patterns of CiFT, CiBFT, and CiTFL1 Promoter
To further study the expression of CiFT, CiTFL1, and CBFT, the promoters (about 1.5–2.0 kb) of the three genes were amplified from lemon by using the genome walking method. We confirmed that these sequences were the promoters of the three genes by comparing them with the sweet orange genome (Xu et al., 2013). The 5′ upstream region of the above three genes were analyzed by using PLACE software. The results showed that the common elements were found in these promoters such as the putative transcriptional start site, TATA box, CAAT box, and different binding motifs (hormone response elements, light regulation, and drought response elements) (Supplementary Table S3). To examine the spatial patterns of CiFT, CiTFL1, and CBFT, we generated transgenic Arabidopsis with the GUS reporter gene driven by these putative promoters. Consequently, we obtained >30 independent transgenic lines for each promoter.
Histochemical staining indicated that the expression of CiFT promoter was seen first in the vascular tissues of cotyledons. With the development of plants, GUS staining was present throughout the whole plant except roots. In inflorescences, CiFT promoter was also detected in the vascular tissues of pedicels and floral organs but not in the inflorescence meristem (Figures 7A–D). The GUS signal from CiTFL1 promoter can be observed at different stages. In juvenile transgenic plants, GUS staining was present throughout the whole plant. Further analysis of GUS activity in various organs of transgenic plants revealed that GUS staining was observed in rosette leaf, cauline leaf, flowers, silique pods and roots (Figures 7E–H). GUS expression gradually decreased at the adult stage. The CiBFT promoters were found only in the cell elongation zone and around the vascular bundles of the roots except root tip in the entire life cycle of transgenic plants. The same pattern is observed in lateral roots (Figures 7I–L). Closer analysis revealed low GUS activity in the leaves. In addition, the expression of CiFT, CiTFL1, and CiBFT promoter response to water deficit treatments was also investigated; the expression of CiBFT and CiTFL1 promoters was decreased and that of CiFT promoter was increased under water deficit conditions (Figures 7M–O).
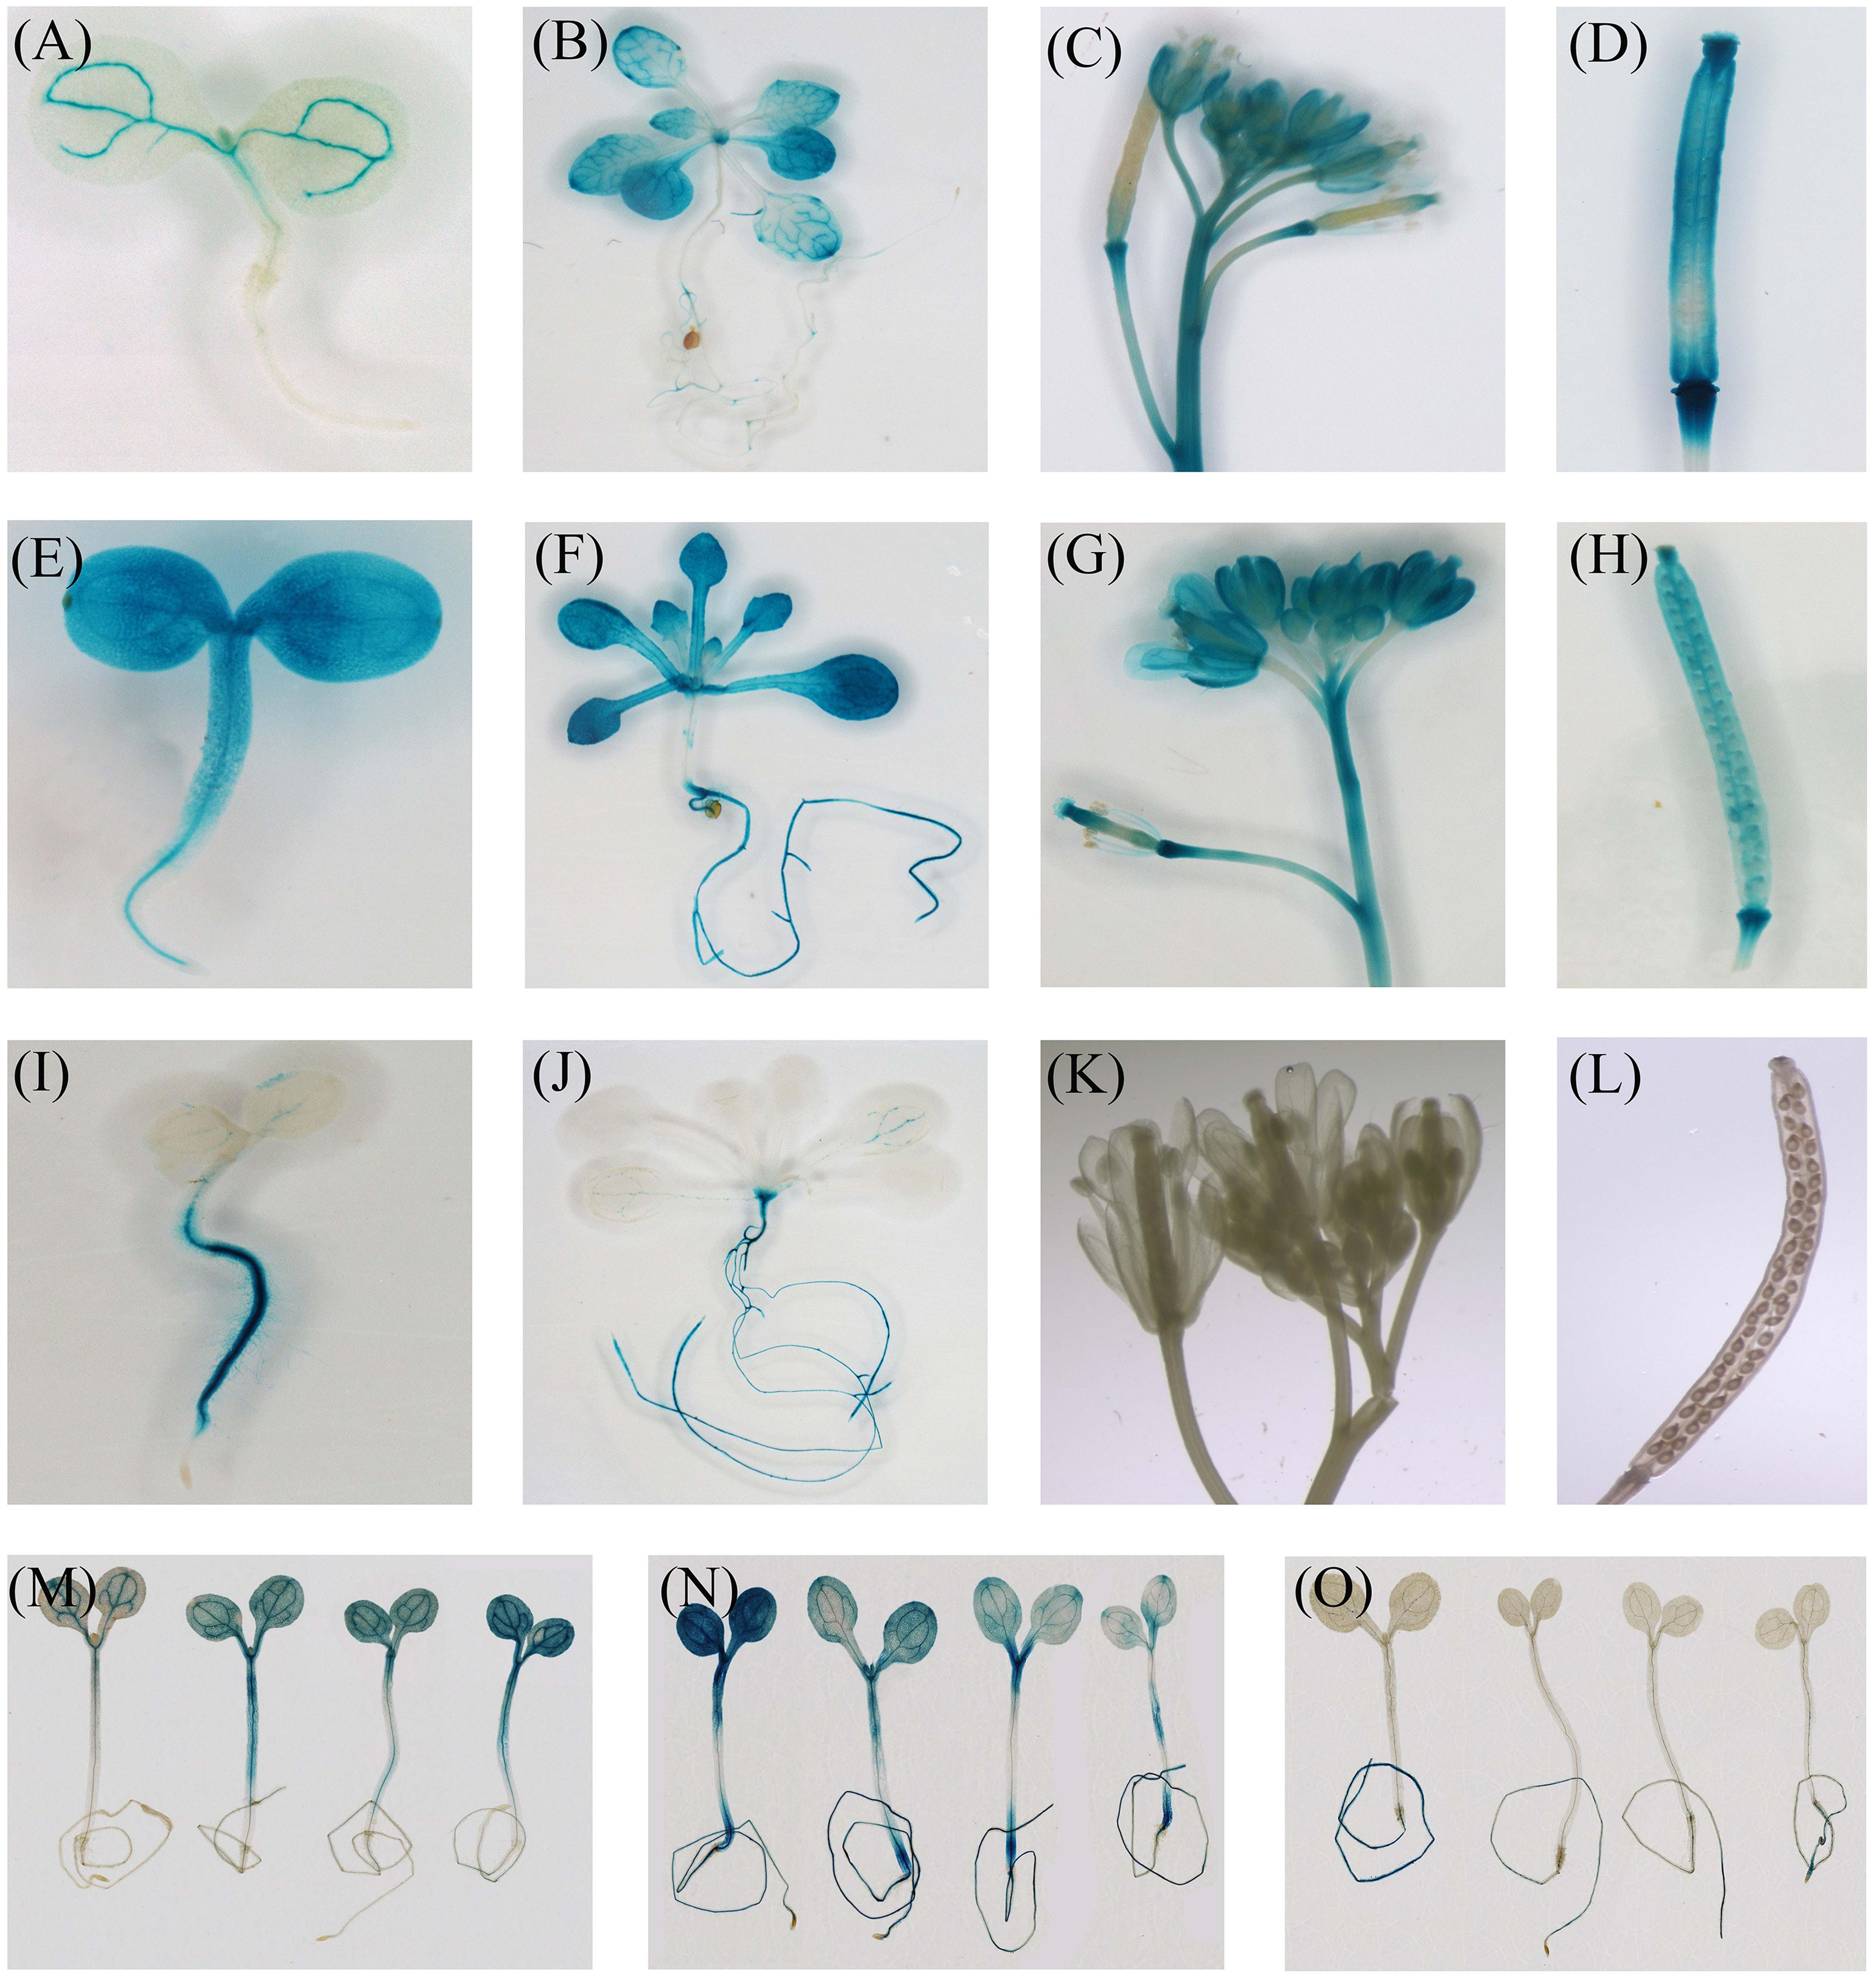
FIGURE 7. Histochemical localization of GUS in transgenic Arabidopsis. Histochemical GUS staining of the CiFT, CiBFT, CiTFL1 promoters (A,B: CiFT; E,F: CiBFT; I,J: CiTFL1) at 7 and 28 days after germination (DAG). Histochemical GUS staining of the CiFT, CiBFT, CiTFL1 promoters (C: CiFT; G: CiBFT; K: CiTFL1) in flower of transgenic Arabidopsis. Histochemical GUS staining of three promoters (D: CiFT; H: CiBFT; L: CiTFL1) in fruit of transgenic Arabidopsis. Histochemical localization of GUS activity in untreated and water deficit-treated transgenic Arabidopsis (M: CiFT; N: CiBFT; O: CiTFL1).
Discussion
Molecular mechanisms underlying vernalization, photoperiod, circadian clock, and GA control of flowering time have been elucidated in annual and perennial plants, but how plants regulate flowering in response to water deficit, remains poorly understood. Because plant hormones involved in diverse biological processes of biotic and abiotic stress, so it is not surprising that associations exist between water deficit-regulated flowering and plant hormones (Koshita et al., 1999; Kazan and Lyons, 2016). In past studies, to elucidate their roles in flower-bud induction, plant hormones have been applied exogenously in crops (Dokoozlian and Peacock, 2001; Lenahan et al., 2006). However, the role of ABA is poorly understood in the regulation of plant flowering. Various studies have clearly shown that ABA plays an key role in stress responses of higher plants, plants accumulate high levels of ABA accompanied under water deficit condition (Duque and Setter, 2013; Shanker et al., 2014). ABA promotes transcriptional up-regulation of FT, TSF, and SOC1, leading to flowering only under long days (Riboni et al., 2013). Recent data also indicated that ABA involved in the photoperiodic induction of flowering in Pharbitis nil seedlings (Wilmowicz et al., 2008). In this study, ABA content significantly increased in buds during the water deficit process. The buds were in an undetermined state and floral primordia were not observed before the beginning of water deficit. When the treatment began, differentiation occurred rapidly and produced the primordia of sepal. Furthermore, although no significant differences were observed between ABA-treated trees and the control, the expression of CiFT was induced by ABA treatment. Therefore, although there was no direct evidence connecting the ABA contents and floral induction in lemon, endogenous ABA might be one of the key factors during floral inductive water deficits, because different levels were observed during the flower bud induction period.
Gibberellins has been extensively reported in inhibiting floral initiation of woody plants (Lee and Safe, 2008). Berthelsen et al. (2002) suggested that GAs act indirectly on the floral process by delaying bud formation. In this study, the number of flowers was increased with PBZ treatment compared to the control. These results indicated that water deficit may inhibit endogenous GA production. Interestingly, the IAA content was induced immediately at the beginning of water deficit and most maintained high expression levels after releasing from water deficit. Therefore, the role of endogenous IAA may be maintaining the necessary vegetative growth during floral inductive water deficits. In addition, according to the overview of the transcriptome profiles, 1638 genes were differentially expressed during the water deficit process. The KEGG analysis shows that the genes responding to water deficit are mainly related to plant hormone signal transduction, biosynthesis of secondary metabolites, as well as starch and sucrose, which has been suggested to be associated with floral initiation and flower development. Traditionally, sugars were regarded as energy supply, but recently sugars have been suggested to serve as signals during plant development (Lebon et al., 2008). Model plants containing mutations in starch biosynthesis or sugar transporter genes exhibit regulated flowering (Corbesier et al., 1998; O’Hara et al., 2013). These data indicated that plant hormones, starch, and sucrose may be involved in flowering induction under water deficit conditions.
Alternative splicing is involved in some important development processes in plants, such as flowering (Eckardt, 2002). To explore potential AS events during the water deficit process, we preformed computational analyses to determine AS junctions. Overall, our data indicated that 27% of lemon genes undergo AS, similar to the rate previously reported for trifoliate orange (Ai et al., 2012). However, this number is significantly lower than predicted in Arabidopsis, in which AS is estimated to occur in 61% of all genes (Wang and Brendel, 2006; Marquez et al., 2012). As previously reported in Arabidopsis and rice (Wang and Brendel, 2006), intron retention is the primary type of AS. This is different from trifoliate orange AS events in which the alternative 3′ spliced site is the most prevalent mechanism (Ai et al., 2012). The differences in AS frequency and alternative splice type between lemon and trifoliate orange may reflect underlying differences in pre-mRNA splicing regulation under stress conditions. It is also very possible that part of the differences has to do with the methods software settings and defaults used to construct the transcript build and AS analysis. In addition, trifoliate orange is phylogenetically fairly distant from lemon, and from different climate zones, that maybe another contributor to the differences. Many flowering-related genes of AS events were involved in floral inductive. For example, a previous study indicated that AS of trifoliate orange FCA has functional significance related to its role in the floral transition (Ai et al., 2016). AS of FLC was also associated with the transition from juvenile to mature trees in trifoliate orange (Zhang et al., 2009a). These AS events of flowering genes were also involved in water deficit-regulated flowering. The lemon FT ortholog has AS events, consistent with previous reports on FT of London plane (Zhang J. et al., 2011). Furthermore, the expression patterns of the different CiFT AS transcripts (CiFTα and CiFTβ) were related to floral induction under water deficit treatment and hormone treatment conditions. Plants over-expressing CiFTα and CiFTβ flowered earlier than the control in transgenic Arabidopsis. These results suggest that CiFT acts as a floral inducer during floral inductive water deficit.
In model plants, GI is a key regulator of the drought-escape response and promotes flowering via the photoperiod and circadian pathways (Mishra and Panigrahi, 2015). Under long-days condition, water deficit stress triggers transcriptional induction of FT and TSF in a manner dependent on GI and ABA. Under short days condition, water deficit and ABA are thought to activate floral suppressors, inhibiting the expression of FT and TSF (Riboni et al., 2013). In this study, the expression level of GI and the ABA content significantly increased during the water deficit treatment. Therefore, the regulatory mechanism of water deficit-regulated flowering in lemon may be similar to that of model plants. However, lemon FT and TSF were not found among the DEGs; only two other PEBP family members (MFT and BFT) were differentially expressed. This might be explained by the fact that FT protein is a mobile signal synthesized in leaves and transported to the shoot apical meristem (Turck et al., 2007; Zhang et al., 2009b). In order to confirm this speculation, the expression levels of CiFT were investigated in leaves. The results indicated that the levels of CiFT and promoter increased under water deficit conditions. This increased CiFT was correlated with more flowers being formed in trees under water deficit condition than control trees. Therefore, the accumulation of CiFT seems to be sensitive to water deficit. To this effect, buds from GA3-treated trees showed significantly decreased CiFT compared to the control trees.
In contrast, we were not able to identify TSF homologs gene in the citrus genome by using several TSF-like sequences from other plants as a query. In model plants, Yamaguchi et al. (2005) indicated that TSF gene acts as a floral pathway integrator and promotes flowering redundantly with FT. These results indicated that the transcripts CiFTβ may play a similar role during the water deficit process. Our previous work revealed that the promotion of trifoliate orange flowering by FT and TFL1 was largely achieved through up-regulation of FT and down-regulation of TFL1 in trifoliate orange (Zhang et al., 2009b). However, we were unable to detect the expression of TFL1 because of its low expression. In our previous study, the expression of TFL1 also was not detected in the vegetative and flower buds of trifoliate orange by RNA sequencing (Zhang J.Z. et al., 2011). Therefore, the expression of CiTFL1 was investigated during floral inductive water deficits. In treated bud samples, we noted reduced expression of CiBFT and CiTFL1 in trees under water deficit condition but increased accumulation both control and GA-treated trees, indicating that water deficit acts as a negative regulator of the two genes. The promoters of CiFT, CiBFT, and CiTFL1 were regulated by water deficit treatment. The promoters of CiBFT and CiTFL1 were down-regulated and the promoter of CiFT was up-regulated under water deficit conditions. These results further indicated that the three genes play an important role during water deficit.
In addition, several putative homologs of Arabidopsis flowering-related and floral identity genes were found among DEGs under water deficit conditions besides members of the PEBP family and GI, such as SPL6/8/9/13, GI, ELF3, and ELF4. Some of these genes are required for light signal transduction pathways, while others encode components of the day length response or are involved in circadian clock function (Khan et al., 2014). For example, ELF3 has been implicated as a suppressor of light signaling to the circadian clock (Dixon et al., 2011). In model plants, ELF4 as a signaling intermediate in promotion of circadian clock function and photoperiod perception (Khanna et al., 2003). GI and ELF4 exhibit differential phase-specific genetic influences over a diurnal cycle in Arabidopsis (Kim et al., 2012). SPL proteins constitute a diverse family of TFs that play fundamental roles in plant growth and development such as flowering (Preston and Hileman, 2013). In this study, the expression patterns of CiELF3, CiELF4, CiGI, and CiSPLs were closely correlated with floral induction during the water deficit process. However, no differences in gene expression were found throughout the experiment by GA3, NAA, ABA, and PBZ treatments. Although we could not identify the exact role of these genes, our expression data indicated that water deficit is essential for the up-regulation of these genes, suggesting that they may play an important role during floral inductive water deficits.
Conclusion
To identify the physiological and molecular mechanism of lemon flowering during floral inductive water deficits, we analyzed the morphology, cytology, and gene expression profiles of buds and performed functional analysis of some of the key flowering genes. Our results reveal an interaction between water deficit and hormones in the activation of the florigen related genes, with the process requiring GI and the hormones ABA, GAs, and IAA (Figure 8). Before water deficits, ABA, GAs, and IAA are produced in the buds, and some stimulus coming from the lemon leaves allows the expression of the floral bud potential, with the high level of GAs and IAA interfering with it. Therefore, the buds do not form floral buds and continue to produce vegetative buds. At the beginning of water deficit treatment, GAs and IAA are decreased and ABA is rapidly increased in the buds, GI protein directly binds to the FT promoter, and FT is up-regulated, and then florigen and nutrients are gradually transported from leaves to the bud. FT protein is transported to the bud, where FT protein interacts with FD protein (a bZIP TF required for the transition to flowering promoted by FT) by competing against TFL1 protein. TFL1 was reduced in buds by water deficit, and FD converts FT into a strong activator, which binds to the AP1 promoter of floral meristem identity genes. BFT was also down-regulated by water deficit and reduced BFT levels further trigger AP1 activation, which in turn contributes to up-regulation of floral organ gene. Finally, nutrients begin to accumulate in the lateral bud for flower bud differentiation and flowering.
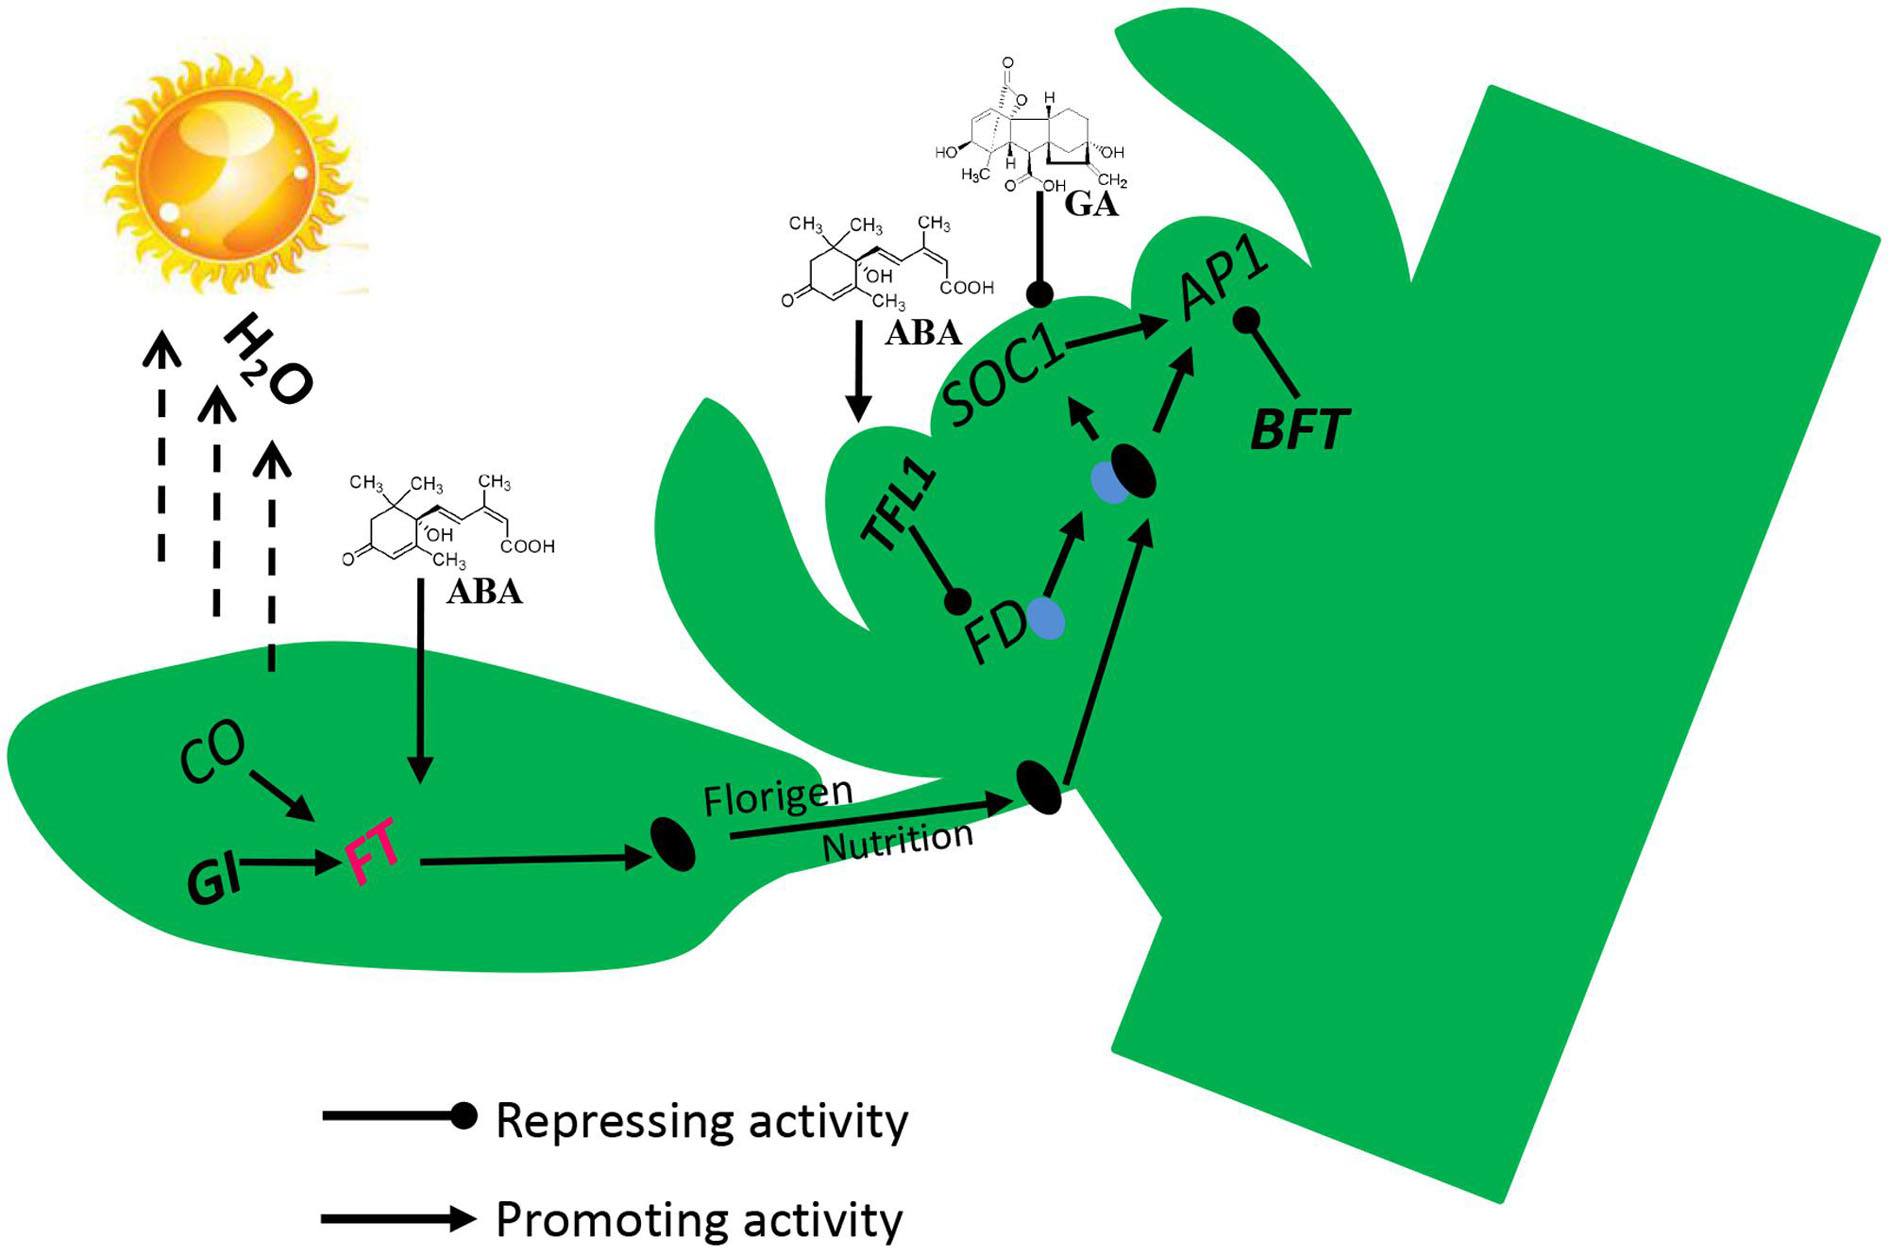
FIGURE 8. Proposed flowering model for molecular events occurring in lemon buds during floral inductive water deficits. Arrow-ended and blunt-ended lines represent process induction and suppression, respectively.
Data Archiving Statement
The RNA-Seq data has been submitted to Gene Expression Omnibus (GEO) under accession number GSE90596. CiMFT (MF069597), CiBFT (MF069598), CiTFL1 (MF069599), CiFTα (MF069600), and CiFTβ (MF069601) have been deposited with the GenBank database. Meanwhile, the CiMFT (MF069602), CiBFT (MF069603), CiTFL1 (MF069604), CiFT (MF069605) promoters have been also deposited with the GenBank database.
Author Contributions
J-XL, J-ZZ, JZ, J-JZ, J-QY, C-XH, and C-GH conceived the research plan and supervised the experiments; H-BH, X-JH, J-YG, Y-XD, and JZ performed the experiments and analyzed the data; J-XL, J-JZ, and JZ-Z drafted the manuscript. All authors read and approved the final manuscript.
Conflict of Interest Statement
The authors declare that the research was conducted in the absence of any commercial or financial relationships that could be construed as a potential conflict of interest.
Acknowledgments
This research was supported financially by the National Natural Science Foundation of China (grant nos. 31360469, 31471863, 31372046, 31521092, and 31221062), the Fundamental Research Funds for the Central Universities (grant nos. 2662016PY039 and 2662015QC048), and the International Foundation for Science No C/5148-2.
Supplementary Material
The Supplementary Material for this article can be found online at: http://journal.frontiersin.org/article/10.3389/fpls.2017.01013/full#supplementary-material
FIGURE S1 | Gene ontology analysis of differentially expressed genes.
FIGURE S2 | Pathway enrichment analysis of differentially expressed genes using the program KEGG pathway.
FIGURE S3 | Phenotypic characteristics of PBZ-treated and the control plants. (A) The PBZ-treated and control plants after resumption of irrigation; (B) Effect of PBZ on flowering of lemon. The data were processed using one-way analysis of variance (ANOVA), and statistical differences were compared based on Student’s t-test, taking P < 0.01 as ∗∗.
FIGURE S4 | Evidence for alternative splicing of CiFTβ in transgenic Arabidopsis. The multiple sequence alignment was performed with Clustal X.
TABLE S1 | Primer sequence information.
TABLE S2 | Analysis of the 1638 differentially expressed genes.
TABLE S3 | Cis-elements in the CiFT, CiBFT, and CiTFL1 promoters predicted by PlantCARE database analysis. Positions are relative to start codon. The orientation of the motifs is indicated (+, forward; -, reverse).
Footnotes
References
Ai, X. Y., Lin, G., Sun, L. M., Hu, C. G., Guo, W. W., Deng, X. X., et al. (2012). A global view of gene activity at the flowering transition phase in precocious trifoliate orange and its wild-type [Poncirus trifoliata (L.) Raf.] by transcriptome and proteome analysis. Gene 510, 47–58. doi: 10.1016/j.gene.2012.07.090
Ai, X. Y., Zhang, J. Z., Liu, T. J., and Hu, C. G. (2016). PtFCA from precocious trifoliate orange is regulated by alternative splicing and affects flowering time and root development in transgenic Arabidopsis. Tree Genet. Genomes 12:85. doi: 10.1007/s11295-016-1035-6
Berthelsen, M. G., Tustin, D. S., and Waagepetersen, R. (2002). Effects of GA3 and GA4+7 on early bud development of apple. J. Hortic. Sci. Biotechnol. 77, 83–90. doi: 10.1080/14620316.2002.11511462
Blankenberg, D., Gordon, A., Von Kuster, G., Coraor, N., Taylor, J., and Nekrutenko, A. (2010). Manipulation of FASTQ data with galaxy. Bioinformatics 26, 1783–1785. doi: 10.1093/bioinformatics/btq281
Chica, E. J., and Albrigo, L. G. (2013a). Expression of flower promoting genes in sweet orange during floral inductive water deficits. J. Am. Soc. Hortic. Sci. 138, 88–94.
Chica, E. J., and Albrigo, L. G. (2013b). Changes in CsFT transcript abundance at the onset of low-temperature floral induction in sweet orange. J. Am. Soc. Hortic. Sci. 138, 184–189.
Clough, S. J., and Bent, A. F. (1998). Floral dip: a simplified method for Agrobacterium-mediated transformation of Arabidopsis thaliana. Plant J. 16, 735–743. doi: 10.1046/j.1365-313x.1998.00343.x
Conesa, A., Gotz, S., Garcia-Gomez, J. M., Terol, J., Talon, M., and Robles, M. (2005). Blast2GO: a universal tool for annotation, visualization and analysis in functional genomics research. Bioinformatics 21, 3674–3676. doi: 10.1093/bioinformatics/bti610
Conesa, A., Madrigal, P., Tarazona, S., Gomez-Cabrero, D., Cervera, A., McPherson, A., et al. (2016). A survey of best practices for RNA-seq data analysis. Genome Biol. 17:13. doi: 10.1186/s13059-016-0881-8
Corbesier, L., Lejeune, P., and Bernier, G. (1998). Role of carbohydrates in the induction of flowering in Arabidopsis thaliana: comparison between the wild type and a starchless mutant. Planta 206, 131–137. doi: 10.1007/s004250050383
Dixon, L. E., Knox, K., Kozma-Bognar, L., Southern, M. M., Pokhilko, A., and Millar, A. J. (2011). Temporal repression of core circadian genes is mediated through EARLY FLOWERING 3 in Arabidopsis. Curr. Biol. 21, 120–125. doi: 10.1016/j.cub.2010.12.013
Dokoozlian, N. K., and Peacock, W. L. (2001). Gibberellic acid applied at bloom reduces fruit set and improves size of ‘Crimson Seedless’ table grapes. Hortscience 36, 706–709.
Duque, L. O., and Setter, T. L. (2013). Cassava response to water deficit in deep pots: root and shoot growth, ABA, and carbohydrate reserves in stems, leaves and storage roots. Trop. Plant Biol. 6, 199–209. doi: 10.1007/s12042-013-9131-3
Eckardt, N. A. (2002). Alternative splicing and the control of flowering time. Plant Cell 14, 743–747. doi: 10.1105/tpc.000000
Endo, T., Shimada, T., Fujii, H., Kobayashi, Y., Araki, T., and Omura, M. (2005). Ectopic expression of an FT homolog from citrus confers an early flowering phenotype on trifoliate orange (Poncirus trifoliata L. Raf.). Transgenic Res. 14, 703–712. doi: 10.1007/s11248-005-6632-3
Franks, S. J., Sim, S., and Weis, A. E. (2007). Rapid evolution of flowering time by an annual plant in response to a climate fluctuation. Proc. Natl. Acad. Sci. U.S.A. 104, 1278–1282. doi: 10.1073/pnas.0608379104
Guitton, B., Kelner, J. J., Velasco, R., Gardiner, S. E., Chagne, D., and Costes, E. (2012). Genetic control of biennial bearing in apple. J. Exp. Bot. 63, 131–149. doi: 10.1093/jxb/err261
Kazan, K., and Lyons, R. (2016). The link between flowering time and stress tolerance. J. Exp. Bot. 67, 47–60. doi: 10.1093/jxb/erv441
Khan, M. R., Ai, X. Y., and Zhang, J. Z. (2014). Genetic regulation of flowering time in annual and perennial plants. Wiley Interdiscip. Rev. 5, 347–359. doi: 10.1002/wrna.1215
Khanna, R., Kikis, E. A., and Quail, P. H. (2003). EARLY FLOWERING 4 functions in phytochrome B-regulated seedling de-etiolation. Plant Physiol. 133, k1530–1538. doi: 10.1104/pp.103.030007
Kim, Y., Yeom, M., Kim, H., Lim, J., Koo, H. J., Hwang, D., et al. (2012). GIGANTEA and EARLY FLOWERING 4 in Arabidopsis exhibit differential phase-specific genetic influences over a diurnal cycle. Mol. Plant 5, 678–687. doi: 10.1093/mp/sss005
Kobayashi, Y., Kaya, H., Goto, K., Iwabuchi, M., and Araki, T. (1999). A pair of related genes with antagonistic roles in mediating flowering signals. Science 286, 1960–1962. doi: 10.1126/science.286.5446.1960
Kooyers, N. J. (2015). The evolution of drought escape and avoidance in natural herbaceous populations. Plant Sci. 234, 155–162. doi: 10.1016/j.plantsci.2015.02.012
Koshita, Y., Takahara, T., Ogata, T., and Goto, A. (1999). Involvement of endogenous plant hormones (IAA, ABA, GAs) in leaves and flower bud formation of satsuma mandarin (Citrus unshiu Marc.). Sci. Hortic. 79, 185–194. doi: 10.1016/S0304-4238(98)00209-X
Lebon, G., Wojnarowiez, G., Holzapfel, B., Fontaine, F., Vaillant-Gaveau, N., and Clcbment, C. (2008). Sugars and flowering in the grapevine (Vitis vinifera L.). J. Exp. Bot. 59, 2565–2578. doi: 10.1093/jxb/ern135
Lee, J., and Safe, S. (2008). Regulation of floral initiation in horticultural trees. J. Exp. Bot. 59, 3215–3228. doi: 10.1093/jxb/ern188
Lenahan, O. M., Whiting, M. D., and Elfving, D. C. (2006). Gibberellic acid inhibits floral bud induction and improves ‘Bing’ sweet cherry fruit quality. Hortscience 41, 654–659.
Li, H., and Durbin, R. (2010). Fast and accurate long-read alignment with Burrows-Wheeler transform. Bioinformatics 26, 589–595. doi: 10.1093/bioinformatics/btp698
Li, Z.-M., Zhang, J.-Z., Mei, L., Deng, X.-X., Hu, C.-G., and Yao, J.-L. (2010). PtSVP, an SVP homolog from trifoliate orange (Poncirus trifoliata L. Raf.), shows seasonal periodicity of meristem determination and affects flower development in transgenic Arabidopsis and tobacco plants. Plant Mol. Biol. 74, 129–142. doi: 10.1007/s11103-010-9660-1
Liu, C., Chen, H., Er, H. L., Soo, H. M., Kumar, P. P., Han, J.-H., et al. (2008). Direct interaction of AGL24 and SOC1 integrates flowering signals in Arabidopsis. Development 135, 1481–1491. doi: 10.1242/dev.020255
Marquez, Y., Brown, J. W., Simpson, C., Barta, A., and Kalyna, M. (2012). Transcriptome survey reveals increased complexity of the alternative splicing landscape in Arabidopsis. Genome Res. 22, 1184–1195. doi: 10.1101/gr.134106.111
Michaels, S. D., and Amasino, R. M. (1999). FLOWERING LOCUS C encodes a novel MADS domain protein that acts as a repressor of flowering. Plant Cell 11, 949–956. doi: 10.1105/tpc.11.5.949
Mishra, P., and Panigrahi, K. C. (2015). GIGANTEA-an emerging story. Front. Plant Sci. 6:8. doi: 10.3389/fpls.2015.00008
Mortazavi, A., Williams, B. A., Mccue, K., Schaeffer, L., and Wold, B. (2008). Mapping and quantifying mammalian transcriptomes by RNA-Seq. Nat. Methods 5, 621–628. doi: 10.1038/nmeth.1226
Moss, G. I. (1969). Influence of temperature and photoperiod on flower induction and inflorescence development in sweet orange (Citrus sinensis L. osbeck). J. Hortic. Sci. 44, 311–320. doi: 10.1080/00221589.1969.11514314
Nishikawa, F., Endo, T., Shimada, T., Fujii, H., Shimizu, T., Omura, M., et al. (2007). Increased CiFT abundance in the stem correlates with floral induction by low temperature in satsuma mandarin (Citrus unshiu Marc.). J. Exp. Bot. 58, 3915–3927. doi: 10.1093/jxb/erm246
O’Hara, L. E., Paul, M. J., and Wingler, A. (2013). How do sugars regulate plant growth and development? New insight into the role of trehalose-6-phosphate. Mol. Plant 6, 261–274. doi: 10.1093/mp/sss120
Pan, X., Welti, R., and Wang, X. (2010). Quantitative analysis of major plant hormones in crude plant extracts by high-performance liquid chromatography-mass spectrometry. Nat. Protoc. 5, 986–992. doi: 10.1038/nprot.2010.37
Preston, J. C., and Hileman, L. C. (2013). Functional evolution in the plant SQUAMOSA-PROMOTER BINDING PROTEIN-LIKE (SPL) gene family. Front. Plant Sci. 4:80. doi: 10.3389/fpls.2013.00080
Putarjunan, A., and Rodermel, S. (2014). Gigantea suppresses immutans variegation by interactions with cytokinin and gibberellin signaling pathways. Plant Physiol. 166, 2115–2132. doi: 10.1104/pp.114.250647
Riboni, M., Galbiati, M., Tonelli, C., and Conti, L. (2013). GIGANTEA enables drought escape response via abscisic acid-dependent activation of the florigens and SUPPRESSOR OF OVEREXPRESSION OF CONSTANS. Plant Physiol. 162, 1706–1719. doi: 10.1104/pp.113.217729
Riboni, M., Test, A. R., Galbiati, M., Tonelli, C., and Conti, L. (2016). ABA-dependent control of GIGANTEA signalling enables drought escape via up-regulation of FLOWERING LOCUS T in Arabidopsis thaliana. J. Exp. Bot. 67, 6309–6322. doi: 10.1093/jxb/erw384
Shanker, A. K., Maheswari, M., Yadav, S. K., Desai, S., Bhanu, D., Attal, N. B., et al. (2014). Drought stress responses in crops. Funct. Integr. Genomics 14, 11–22. doi: 10.1007/s10142-013-0356-x
Southwick, S. M., and Davenport, T. L. (1986). Characterization of water stress and low temperature effects on flower induction in citrus. Plant Physiol. 81, 26–29. doi: 10.1104/pp.81.1.26
Sun, L. M., Zhang, J. Z., Mei, L., and Hu, C. G. (2014). Molecular cloning, promoter analysis and functional characterization of APETALA 1-like gene from precocious trifoliate orange (Poncirus trifoliata L. Raf.). Sci. Hortic. 178, 95–105. doi: 10.1016/j.scienta.2014.08.015
Tan, F. C., and Swain, S. M. (2007). Functional characterization of AP3, SOC1 and WUS homologues from citrus (Citrus sinensis). Physiol. Plant. 131, 481–495. doi: 10.1111/j.1399-3054.2007.00971.x
Tarazona, S., Garcíaalcalde, F., Dopazo, J., Ferrer, A., and Conesa, A. (2011). Differential expression in RNA-seq: a matter of depth. Genome Res. 21, k2213–2223. doi: 10.1101/gr.124321.111
Trapnell, C., Pachter, L., and Salzberg, S. L. (2009). TopHat: discovering splice junctions with RNA-Seq. Bioinformatics 25, 1105–1111. doi: 10.1093/bioinformatics/btp120
Turck, F., Fornara, F., and Coupland, G. (2007). Regulation and identity of florigen: FLOWERING LOCUS T moves center stage. Annu. Rev. Plant Biol. 59, 573–594. doi: 10.1146/annurev.arplant.59.032607.092755
Wahl, V., Ponnu, J., Schlereth, A., Arrivault, S., Langenecker, T., Franke, A., et al. (2013). Regulation of flowering by trehalose-6-phosphate signaling in Arabidopsis thaliana. Science 339, 704–707. doi: 10.1126/science.1230406
Wang, B. B., and Brendel, V. (2006). Genomewide comparative analysis of alternative splicing in plants. Proc. Natl. Acad. Sci. U.S.A. 103, 7175–7180. doi: 10.1073/pnas.0602039103
Wilmowicz, E., Kêsy, J., and Kopcewicz, J. (2008). Ethylene and ABA interactions in the regulation of flower induction in Pharbitis nil. J. Plant Physiol. 165, 1917–1928. doi: 10.1016/j.jplph.2008.04.009
Wu, J., Xu, Z., Zhang, Y., Chai, L., Yi, H., and Deng, X. (2014). An integrative analysis of the transcriptome and proteome of the pulp of a spontaneous late-ripening sweet orange mutant and its wild type improves our understanding of fruit ripening in citrus. J. Exp. Bot. 65, 1651–1671. doi: 10.1093/jxb/eru044
Xu, Q., Chen, L.-L., Ruan, X., Chen, D., Zhu, A., Chen, C., et al. (2013). The draft genome of sweet orange (Citrus sinensis). Nat. Genet. 45, 59–66. doi: 10.1038/ng.2472
Yamaguchi, A., Kobayashi, Y., Goto, K., Abe, M., and Araki, T. (2005). TWIN SISTER OF FT (TSF) acts as a floral pathway integrator redundantly with FT. Plant Cell Physiol. 46, 1175–1189. doi: 10.1093/pcp/pci151
Yao, J. L., Zhou, Y., and Hu, C. G. (2007). Apomixis in Eulaliopsis binata: characterization of reproductive mode and endosperm development. Sex. Plant Reprod. 20, 151–158. doi: 10.1007/s00497-007-0051-y
Zhang, J., Liu, G., Guo, C., He, Y., Li, Z., Ning, G., et al. (2011). The FLOWERING LOCUS T orthologous gene of Platanus acerifolia is expressed as alternatively spliced forms with distinct spatial and temporal patterns. Plant Biol. 13, k809–820. doi: 10.1111/j.1438-8677.2010.00432.x
Zhang, J. Z., Ai, X. Y., Sun, L. M., Zhang, D. L., Guo, W. W., Deng, X. X., et al. (2011). Transcriptome profile analysis of flowering molecular processes of early flowering trifoliate orange mutant and the wild-type [Poncirus trifoliata (L.) Raf.] by massively parallel signature sequencing. BMC Genomics 12:63. doi: 10.1186/1471-2164-12-63
Zhang, J.-Z., Li, Z.-M., Mei, L., Yao, J.-L., and Hu, C.-G. (2009a). PtFLC homolog from trifoliate orange (Poncirus trifoliata) is regulated by alternative splicing and experiences seasonal fluctuation in expression level. Planta 229, 847–859. doi: 10.1007/s00425-008-0885-z
Zhang, J. Z., Li, Z. M., Yao, J. L., and Hu, C. G. (2009b). Identification of flowering-related genes between early flowering trifoliate orange mutant and wild-type trifoliate orange (Poncirus trifoliata L. Raf.) by suppression subtraction hybridization (SSH) and macroarray. Gene 430, 95–104. doi: 10.1016/j.gene.2008.09.023
Keywords: citrus, FLOWERING LOCUS T, flowering time, hormone, lemon, water deficit
Citation: Li J-X, Hou X-J, Zhu J, Zhou J-J, Huang H-B, Yue J-Q, Gao J-Y, Du Y-X, Hu C-X, Hu C-G and Zhang J-Z (2017) Identification of Genes Associated with Lemon Floral Transition and Flower Development during Floral Inductive Water Deficits: A Hypothetical Model. Front. Plant Sci. 8:1013. doi: 10.3389/fpls.2017.01013
Received: 26 March 2017; Accepted: 26 May 2017;
Published: 13 June 2017.
Edited by:
Petr Smýkal, Palacký University, Olomouc, CzechiaReviewed by:
Joanna Putterill, University of Auckland, New ZealandRosario Muleo, Università degli Studi della Tuscia, Italy
Copyright © 2017 Li, Hou, Zhu, Zhou, Huang, Yue, Gao, Du, Hu, Hu and Zhang. This is an open-access article distributed under the terms of the Creative Commons Attribution License (CC BY). The use, distribution or reproduction in other forums is permitted, provided the original author(s) or licensor are credited and that the original publication in this journal is cited, in accordance with accepted academic practice. No use, distribution or reproduction is permitted which does not comply with these terms.
*Correspondence: Jing-Jing Zhou, hupodingxiangyu@mail.hzau.edu.cn Jin-Zhi Zhang, jinzhizhang@mail.hzau.edu.cn
†These authors have contributed equally to this work.